Engl Text Full - Racursconf.racurs.ru/images/abstracts/2015/Proceedings.pdf · 15 th International...
44
Transcript of Engl Text Full - Racursconf.racurs.ru/images/abstracts/2015/Proceedings.pdf · 15 th International...


15th International Scientifi c and Technical Conference “From imagery to map: digital photogrammetric technologies”
October 26-29, 2015, Yucatan, Mexico.
2015
Dear colleagues!We present to your attention the proceedings of the 15th International Scientifi c and Technical
Conference “From imagery to map: digital photogrammetric technologies”. Here are few words about the conference history. The fi rst, second and third conferences were held in Russia, next ten in Europe. Since last year we have expanded conference geography and held the 14th conference in Asia, China. This year, the 15th conference will be held in Latin America, Mexico. Racurs Company has strong relationships with this region. Moreover, the very fi rst Spanish localization of PHOTOMOD was done in Argentina. PHOTOMOD is widely used for RSD processing and education in Cuba, Mexico, Brazil, Colombia, Argentina, Chili, Nicaragua.
Traditionally, the main topic of the conference is photogrammetric processing of aerial and satellite images. The related issues also do not go unheeded. Undoubtedly, the proceedings will be useful and informative for you.
Sincerely yours,
the Scientifi c Committee of
the 15th International Scientifi c and Technical Conference
“From imagery to map: digital photogrammetric technologies”
CONTENT
G. Alvarez Parma, A. Munizaga, W. Melian, S. López. Utilización De Photomod Lite Como Herramienta De Aprendizaje Del Método Fotogramétrico..........................................................................3Ciro de la C. Díaz. XV Años De Experiencias En El Uso Del Programa Digital Fotogramétrico PHOTOMOD En El Ámbito Profesional, Investigativo Y Docente En La Universidad Autónoma De Sinaloa; Campus Los Mochis, México...................................................................................................9I. Ewiak, P. Brodowska. The Measuring Qualities of Archival Aerial Photographs as A Function of Time...............................................................................................................................10M. Kędzierski, A. Fryśkowska, D. Wierzbicki, P. Deliś. Cadastral Mapping Based on UAV Imagery....12
D. Khaydukova. Technological Capabilities of DPW PHOTOMOD 6.0: Practice Implementation In the Cartographic Production........................................................................................17
G. Konecny. My Latin American Experience............................................................................................18
V. Panarin, O. Kolesnikova, R. Panarin. Applying of Space Remote Sensing Data in Urban Development...............................................................................................................................20
A. Peshkun. Creation of Digita l Surface Models using Resurs-P Stereo Pairs........................................23
V. Petrova. GIS-Sofi a Data Base...............................................................................................................24
A. Sechin. Photogrammetry and Parallel Computing — Software and Hardware....................................25
R. Shevchenko. Updating the Thematic Content of Touristic Maps Using Satellite Images....................26
A.Voitenko, I. Koshechkin. Creation of a 3D Model of the City of Krasnoyarsk as Part of Cartographic Support of Urban Planning and Property Complex Management...................................29
I. Yudin. Real World Information Addressing Global Challenges.............................................................33
E. Mozgovaya, T. F. Cuesta, K.Iankov. Escaneo Lidar Y Fotogramétrico Con Cámara Digital De Barrido, Un Avance Tecnológico En La Aerotopografía...........................................................................34
15th International Scientifi c and Technical Conference “From imagery to map: digital photogrammetric technologies”
3
RESUMEN Las tendencias actuales, en cuanto a la gran
disponibilidad de recursos de imágenes, la demanda creciente de datos geográfi cos para su utilización masiva en un amplio espectro de disciplinas, y las nuevas tecnologías que evolucionan día a día, imponen al Ingeniero Agrimensor su involucramiento directo con los métodos y técnicas más modernos utilizados para el relevamiento del terreno y la producción cartográfi ca, entre ellas la Fotogrametría.
A partir del año 2015 se propuso un cambio de enfoque pedagógico para el dictado de la cátedra de Fotogrametría, correspondiente al quinto año de la carrera de Ingeniería en Agrimensura de la Facultad de Ingeniería, de la UNSJ. Este cambio consistió en buscar el involucramiento directo de los estudiantes en la construcción activa y signifi cativa del conocimiento, aplicando en las clases los conceptos pedagógicos de “Clase invertida” y “Aprender haciendo”.
A modo de fortalecer esta iniciativa, se propuso la implementación de una práctica fi nal integradora, de todos los contenidos dictados en la materia, a partir de la aplicación del método general de la fotogrametría, en un proyecto de pequeñas dimensiones, y utilizando como software de apoyo PHOTOMOD Lite 5.3.
Con el objetivo de compartir la idea de educar a futuros profesionales capaces y competentes, y no meros receptores de saberes y datos, se invitó a otras cátedras interrelacionadas con la fotogrametría, a pasar a ser parte de la iniciativa de brindar conocimientos y herramientas para que los alumnos sean capaces de resolver situaciones problemáticas diversas, trabajando r en proyectos reales, y asi puedan crear sus propios portfolios con sus alcances y aprendizajes.
Los resultados logrados son considerados como muy positivos, ya que se pudo verifi car la participación activa de los alumnos en los conceptos teóricos generales de la materia, trabajando motivados, en equipo y vinculados
con otras materias, propiciando la interrelación de contenidos, donde alumnos y profesores trabajaron juntos para evaluar y lograr un aprendizaje signifi cativo.
PALABRAS CLAVEFotogrametría digital, software de aplicación
fotogramétrico, Photomod, proceso fotogramétrico, clase invertida (fl ipp classroom) aprender haciendo, enseñanza universitaria.
OBJETIVOEl objetivo general del proyecto se enfocó
en complementar y reforzar los conocimientos teóricos adquiridos durante el cursado de la materia a partir de la aplicación del método general de la fotogrametría en un proyecto de pequeñas dimensiones, aplicando en el dictado de clases los enfoques pedagógicos denominados “clases invertidas” y “aprender haciendo”.
Para ello se propuso la realización de una práctica fi nal integradora, cuyos objetivos particulares estaban dirigidos a relevar los distintos rasgos del terreno en estudio y elementos necesarios para la generación de productos cartográfi cos fi nales.
Los productos fi nales solicitados para el área de trabajo fueron los siguientes: Modelo digital de elevaciones; Cartografía digital; Ortofoto; Hoja Cartográfi ca; Informe fi nal.
La precisión de los productos solicitados debían ajustarse a una escala 1:10000.
La realización y aprobación de la práctica, se consideró como condición de aprobación de la materia.
GRUPO DE TRABAJOEl grupo de trabajo para llevar a cabo esta
propuesta, estuvo compuesto por tres docentes de la cátedra de Fotogrametría y personal de apoyo, involucrados directamente en la proyecto, y otro grupo de docentes del Departamento de Agrimensura y del Centro de Fotogrametría Cartografía y Catastro, que colaboraron con la iniciativa en la realización de trabajos relacionados con sus propias materias.
El grupo de alumnos que realizaron la práctica
Utilización De Photomod Lite Como Herramienta De Aprendizaje Del Método Fotogramétrico
Gabriela Alvarez Parma, Alejandro Munizaga, Walter Melian, Silvia LópezCentro de Fotogrametría Cartografía y Catastro,
Facultad de Ingeniería - Universidad Nacional de San Juan (UNSJ), Argentina

October 26-29, 2015, Yucatan, Mexico
4
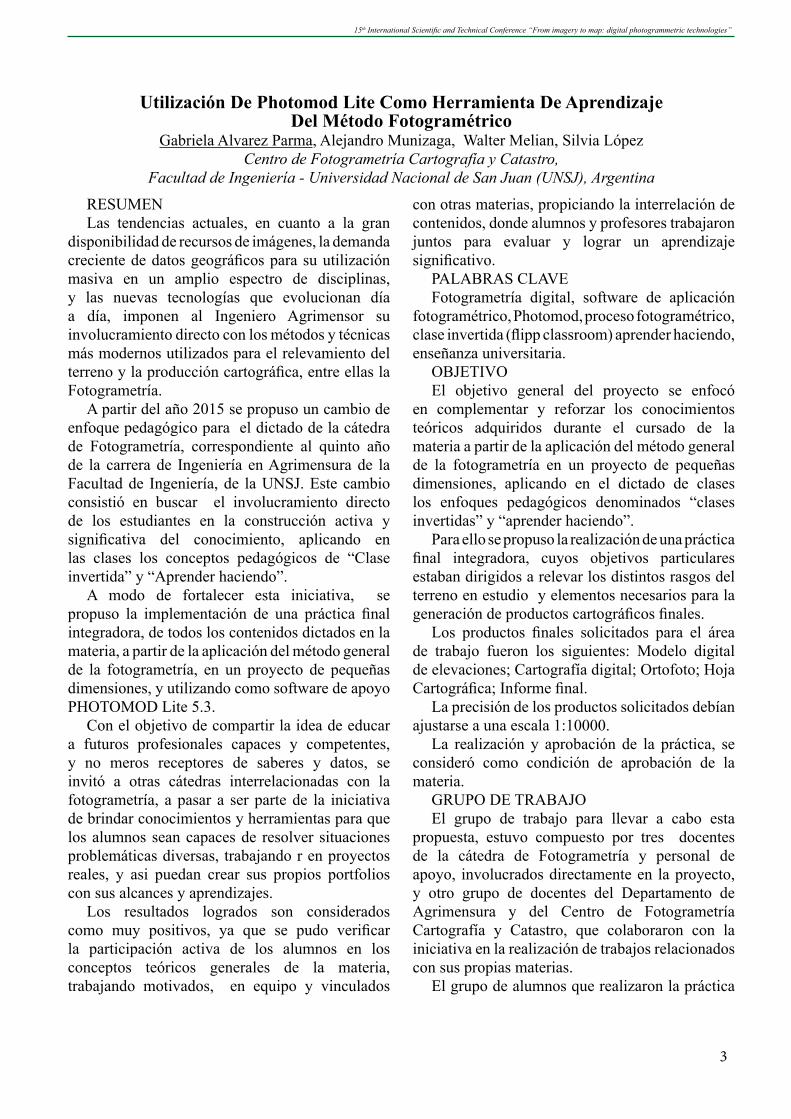
estuvo compuesto de 15 personas.ÁREA DE TRABAJOEl área de trabajo seleccionada para la práctica se
ubicó en las inmediaciones de la zona denominada Quebrada de Zonda, (Departamentos Rivadavia y Zonda) a 15 km al oeste de la Ciudad de San Juan, en la provincia de San Juan, República Argentina. El polígono defi nido involucró una superfi cie aproximada de 10 km2 según la fi gura.
El área de trabajo se dividió en sectores, que fueron abordados individualmente por 6 equipos de trabajo.
DATOS UTILIZADOSPara la realización de la práctica se solicitó la
colaboración del Instituto Geográfi co Nacional de Argentina (IGN), ante quien se hicieron las gestiones necesarias para la adquisición del material fotográfi co.
El IGN proveyó de 6 fotografías aéreas digitales, dispuestas en dos corridas sucesivas sobre el área de interés, con las siguientes características:
Sensor: Vecxel Ultracam XPCalibración del sensor: Revisión 2.0Tamaño de imagen: 11310 pixel x 17310 pixelTamaño de pixel: 6.000μm x 6.000μm
Distancia focal: 100.5mm ± 0.002mm
Punto principal: X ppa 0.000mm ±0.002mm;
Y ppa 0.000mm ±0.002mm
Número de tomas que componen el sector: 1421
Tamaño del pixel: 0.50 m
Fecha de vuelo: 26/04/2014
Altura (snm) : 8970 m
Escala de foto: 1/83284
Bandas: 4 (Azul, verde, rojo, infrarrojo cercano).
Formato de imagen: Tiff standard.
Las imágenes originales fueron convertidas
a un formato de menor tamaño para que puedan
ser usadas en computadoras de características
estándares.
HARDWARE UTILIZADO
Para la realización de las tareas que no requerían
visualización estereoscópica, cada uno de los 6
grupo de trabajo, utilizaron un ordenador portátil
(confi guración típica: Procesador: Intel, i3, i5 SO:
Windows Windows 7/8).
Luego para las tareas de digitalización
estereoscópica se utilizaron las estaciones
fotogramétricas del CEFOCCA, con el objetivo de
mejorar las condiciones de visión e interpretación
de los rasgos del terreno y de utilizar por parte del
alumnado estaciones de trabajo actuales y posibles
de utilizar en su ejercicio profesional. Se contó con
dispositivos para visión estereoscópica de acuerdo
a la confi guración recomendada para PHOTOMOD
en su licencia comercial (Tarjeta gráfi ca NVIDIA
QUADRO FX580, pantalla nVidia 3D Vision
Ready, anteojos Stereoglasses nVidia 3D Vision)
SOFTWARE UTILIZADO
Para la realización de la práctica se utilizó
Photomod Lite 5.3. Los alumnos no tenían
instrucción previa sobre el manejo y funcionamiento
del software, la cual se fue dando en forma
simultánea al avance de la práctica, utilizando
de base los contenidos teóricos dictados. Como
material de guía y manual de ayuda en el proceso,
se tomó de referencia el documento publicado por
el Ing. Carlos Lizana “Utilización de PHOTOMOD
como estación fotogramétrica digital (DPS)”, y
manuales de Photomod.
APOYO TERRESTRE
Las tareas necesarias para el apoyo terrestre
fueron realizadas en conjunto con las cátedras
de Geodesia I y II y Cartografía Matemática,
con el objetivo de propiciar una interrelación de
contenidos y economizar tiempos de trabajo.
Se programó una campaña de medición con
equipamiento GPS diferencial para el relevamiento
de puntos de apoyo fotogramétrico post vuelo. Con
anterioridad a la ejecución del mismo se evaluó
la probable ubicación de los puntos en función
del área de trabajo, características del terreno y
accesos. La medición fue realizada en una jornada
de trabajo dividiendo la medición de los puntos en
grupos de trabajo.
El post proceso de los datos fue realizado como
parte de las trabajos prácticos previstos en las
Cátedra de Geodesia y Cartografía.

15th International Scientifi c and Technical Conference “From imagery to map: digital photogrammetric technologies”
5
Con los resultados anteriores, se procedió a la
elaboración de monografías de cada punto relevado
para luego poder compartirlas con todos los grupos
de trabajo.
ESQUEMA GENERAL DEL TRABAJO
La práctica fue organizada en etapas,
siguiendo el esquema lógico del cualquier
proyecto fotogramétrico. Cada una de las etapas
se cumplieron semanalmente, en un período de
trabajo que abarcó poco más de dos meses con una
dedicación horaria semanal de 8 a 10 horas por
grupo. Para cada semana se preparó un documento
indicando las tareas a realizar y entregables o
obtener, según el detalle que se cita a continuación:
Etapa 1: Creación del proyecto fotogramétrico
bajo el entorno del software de trabajo.
● Generación del Proyecto dentro del entorno
de Photomod
● Armado del bloque
Etapa 2: Orientación interna
● Cargar datos de la cámara (ver certifi cado de
calibración),
● Asociar la cámara a cada una de las imágenes
● Realizar proceso de orientación interna
● Generar reporte y analizar resultados
Etapa 3: Orientación externa
● Cargar coordenadas de puntos de apoyo
terrestre (PAF)
● Identifi cación y medición de puntos de apoyo
en las imágenes.
● Medición de puntos de enlace entre fotogramas.
● Medición de puntos de enlace entre corridas.
● Transferencia de puntos medidos en la zona
de superposición lateral y de triple superposición a
los pares contiguos.
● Generar reporte y analizar resultados.
Etapa 4: Ajuste de bloques (Aerotriangulación)
● Confi gurar método de ajuste.
● Confi gurar parámetros del reporte
● Establecer alguno de los puntos de chequeo
● Analizar los resultados obtenidos (residuos
aceptables 50 cm planimetría y altimetría en los
puntos de apoyo, y 75 cm en los puntos de chequeo)
● Generar reportes con parámetros del ajuste.
Etapa 5: Restitución tridimensional
● Digitalizar estereoscópicamente: Caminos
principales (rutas), Caminos secundarios (huellas
más destacadas), Drenajes principales, Rasgos
para mejorar el modelo de elevaciones, Puntos
acotados, construcciones.
● Exportar resultados para su posterior
compilación cartográfi ca
Etapa 6: Generación del modelo de elevaciones
y edición
● Crear una grilla de puntos regulares.
● Incorporar datos vectoriales
● Generar TIN
● Generar DEM
● Visualizar resultados y evaluar correspondencia
con el terreno
● Evaluar posibles ediciones. Exportar
resultados: Archivo de curvas de nivel, Modelo de
elevaciones
Etapa 7: Generación de mosaico y ortofoto
● Confi gurar proyecto de mosaico
● Evaluar solapes, sitios de corte, balance de
brillos.
● Generar Ortofoto
● Evaluar posibles desplazamientos
● Exportar resultados: ortofoto
Etapa 8: Producción cartográfi ca fi nal
● Evaluar y seleccionar software para la
compaginación cartográfi ca fi nal.
● Diseñar esquema de hoja cartográfi ca
conteniendo todos sus elementos.
● Volcar sobre la hoja los productos obtenidos a
partir del proceso fotogramétrico
● Seleccionar simbología adecuada
● Exportar resultados e imprimir producto fi nal.
Etapa 9: Elaboración de memoria fi nal de
resultados y exposición del trabajo realizado.
● Con la experiencia realizada a partir de la
práctica elaborar un informe técnico conteniendo el
resumen del material utilizado, tareas desarrolladas
y productos obtenidos.
● Exposición y defensa del trabajo realizado
CONCLUSIONES Y EXPECTATIVAS A
FUTURO
El enfoque pedagógico iniciado, buscó centrarse
en la idea de educar a futuros profesionales capaces
y competentes, y no meros receptores de saberes y
datos, pasando a ser la base de una metodología
del proceso de enseñanza-aprendizaje diferente,
que brinda conocimientos y herramientas para que
los alumnos sean capaces de resolver situaciones
problemáticas y diversas en tiempo real. En lo
que respecta a la fotogrametría; que trabajen
en proyectos reales y puedan crear sus propios
portfolios con sus alcances y aprendizajes,
destacando la importancia y la necesidad de
hacerlos sentirse protagonistas y constructores de
su propio aprendizaje.
Se promovió en los alumnos el uso intensivo
de material de lectura, videos y documentos ya
existentes en internet relacionados con la materia,
como así también la práctica con modernos
equipamientos. Esto les permitió abordar la
apropiación de nuevos conocimientos referidos al
método general de la fotogrametría, de una forma
signifi cativa. Si sumamos la implementación de un
proyecto real, aunque de pequeñas dimensiones,
les permitió vivenciar el concepto de “aprender
haciendo”, potenciando el aprendizaje en el aula.
La utilización de Photomod Lite 5.3 como
software fotogramétrico facilitó la aplicación del
método general de la fotogrametría. Su esquema
lógico permite al alumnado adoptar con mayor
facilidad los conceptos teóricos adquiridos. Su
versión en español y material de referencia ya
generado, facilitó la apropiación por parte de los
alumnos, sumado a la facilidad de contar con el
software en el idioma nativo de los alumnos.
Si bien Photomod Lite, es una versión liberada
con algunas restricciones, para la ejecución de
este proyecto superó las expectativas, por cuanto
pudieron realizarse todas las tareas previstas y
obtener verdaderos productos cartográfi cos de
acuerdo a los requerimientos planteados.
Esta primera experiencia plantea a futuro,
para el dictado de la materia, un desafío, ya que
el dominio de una competencia y de herramientas
tecnológicas no es algo lineal unidireccional, sino
que requiere un proceso de aprendizaje apoyado
en determinados conocimientos y en el desarrollo
de contenidos aportando experiencias, debate de
opiniones, iniciativas, proyectos, etc.
Por último, los resultados logrados son
considerados como muy positivos, ya que se pudo
verifi car el involucramiento activo de los alumnos
en los conceptos teóricos generales de la materia,
trabajando motivados y en equipo y la vinculación
con otras materias propiciando la interrelación de
contenidos, donde alumnos y profesores trabajaron
juntos para evaluar y lograr un aprendizaje
signifi cativo.
Colaboradores: Ing. Dario Terluk, Ing. Hernán
Alvis Rojas, Lic. Ricardo Velázquez, Ing. Eduardo
Marquez, Ing. José Maraz, Ing. Guillermo Garcés,
Ing. Osvaldo Estevez.
October 26-29, 2015, Yucatan, Mexico
6

UniScan™ realtime satellite monitoring
A multimission UniScan™ ground station is capable of receiving
Earth observation data from polarorbiting remote sensing satellites
in Xband. One UniScan™ station covers an area of about 20 million
sq. km. and can receive images from optical and radar satellites
in real time. The UniScan™ system includes software and hardware
components for data acquisition, storage and processing. As of to
day there are more than 80 UniScan™ stations deployed worldwide,
including Russia, Ukraine, Kazakhstan, Uzbekistan, Vietnam, Spain,
USA, etc.
Highperformance remote sensing software for photogrammetric processing
and thematic mapping
SIP ScanEx Image Processor®
The main features of the software include support of all major
remote sensing data formats, userfriendly and intuitive interface,
paralleled computing, ability to work with large volumes of data,
automation and a 64bit architecture. The software provides all
functionality that is necessary to perform basic and advanced
image processing on an industrial scale for a variety of applications.
The modular structure of the SIP provides an exceptional level of
flexibility and scalability to endusers.
+7 (495) 739-73-85 • www.scanex.com

15th International Scientifi c and Technical Conference “From imagery to map: digital photogrammetric technologies”
XV Años De Experiencias En El Uso Del Programa Digital Fotogramétrico PHOTOMOD En El Ámbito Profesional, Investigativo Y Docente En La
Universidad Autónoma De Sinaloa; Campus Los Mochis, MéxicoCiro de la C. Díaz
Universidad Autónoma de Sinaloa, Mexico
El Uso del Programa Photomod se ha difundido
en América Latina, en ello ha jugado un papel
predomínate los egresados de los centros de
enseñanzas de la Federación rusa, y las generosas
facilidades, que ha mostrado la Empresa RACURS.
Conocemos del uso del Software en versiones de
trabajo y demo en Chile, Argentina, Colombia,
Cuba y por su puesto en México.
Desde el año 2000 en la Universidad Autónoma
de Sinaloa, México se ha venido usando el programa
Digital Photomod, versión de trabajo y demos
(desde la Ver2.11 hasta la última actualización de
5.3). Nos ha servido como herramienta insustituible
en el aprendizaje e instrucción de los estudiantes
en los cursos de fotogrametría, y en la posibilidad
de poder convertir las imágenes terrestres aéreas y
satelitales en cartas topográfi cas, catastrales y para
GIS.
En el campo de la investigación ha permitido
poder procesar imágenes tomadas por nuestros
propios medios desde aviones ligeros y ultraligeros
de ciudades, litorales, islas, minas, estudios de
ecosistemas, vegetación, monumentos históricos,
objetos metrados en 3d, entre otros. Lo más
importante poder demostrar para la docencia y la
investigación ciclos tecnológicos cerrados.
Ortomosaico Mochis, México Ortofotoplano UAS Campus Mochis Plano topográfi co UAS Campus Mochis
9
10
The Measuring Qualities of Archival Aerial Photographs as A Function of Time
Ireneusz Ewiak, Paulina Brodowska
Military University of Technology, Faculty of Civil Engineering and Geodesy, Warsaw, Poland
In the process of aging the usable properties of
the material change over time. Aging is detrimental
for a lot of materials and results in the deterioration
of their properties. In case of aerial photographs,
elapsed time predominantly dictates their
interpretative and measuring value, which, while
linked to physical properties of the photographs,
depends on external factors as well. Supposing
the physical properties of aerial photographs do
not change, the process of aging may only be
considered with regard to the degree of changes of
the depicted topography, and such an aspect of the
aging process is the subject of the present research.
The degree of aging of aerial photo may be indicated
through evaluating the possibility to project and
measure the ground control points, which comply
with the required criteria of completeness and
layout, within the block is a part of. It was agreed
the points should be clearly identifi ed in archival
aerial photographs, and directly measured, taking
current topography into account.
The purpose of this research was to determine the
time resolution of the aerial photographs block, for
which the block could be prepared in compliance
with the Polish quality standards. In order to
determine the indicator, aerial triangulations of 10
blocks of aerial photographs obtained in different
time periods between 1972 and 2013 were
elaborated. The photographs taken with analogue
cameras, scale from 1:5000 to 1:30000, and digital
cameras of GSD spatial resolution between 10 and
15 cm, were used in the research. The arranged
blocks included from 60 to 4000 aerial photographs
with standard overlaps of 60% and 30% in fl ight
and cross fl ight direction taken analogue images
respectively, and 70% and 50% for digital images.
The images covered approximately the same urban
area, with minor height difference, spreading circa
900 km2. In order to examine the aging degree
of an aerial photograph, the requirements for
measuring control and tie points of the block, and
the accuracy of the aerial triangulation results, were
determined. Derogations from these requirements
dictated the value of the aging degree of aerial
photograph coeffi cient. Two tie points had to be
measured in each Gruber position, assuming they
are measured in all photographs. For the image
coordinates measured with standard deviation of
more than 5 micrometres, three binding points had
to be measured in the position of six-fold photo
coverage. It was also agreed that the tie points
measured in at least 4 photographs, should be no
less than 35% of all tie points. The number and
placement of the control points in the block, and
their position in the aerial photograph, were to
assure the required accuracy of the result and its
homogeneity.
The project of control points included
individual properties of the block, such as shape,
the measuring hindrance resulting from the
topography and possible inconsistencies in the
lateral overlap. It was agreed that when measuring
the perspective centres for all photographs in a
block, one had to measure two control points in
the angular models of the block and eight bases
on its edges, along the fl y direction. If there were
no measurements of the perspective for some
photographs in a block, it was agreed that an
additional control points will be measured, which
has to be closest possible equivalent of the missing
measurement, particularly with regard to accuracy
of the determine of altitude of tie pints. It was
agreed that due to the determination of additional
adjustment parameters and to systematic errors of
absolute orientation elements of the photographs,
the number of ground control points should not be
less than 1 control point for every 17 photographs.
For unsuccessful measurements of the
perspective centres for all photographs in the block,
the control points network had to be rearranged in
such a way so as to place the points on the edges of
the block and in every second lateral overlap, not
less frequently than every 4 bases. It was agreed
that the photo control points at the end of strips
have to be placed in lateral overlap so as to enable
their measuring on 4 photographs, and that control
points on the edges of the block, along the axis of
strips, have to be placed in triple coverage, with
October 26-29, 2015, Yucatan, Mexico

15th International Scientifi c and Technical Conference “From imagery to map: digital photogrammetric technologies”
11
the exclusion of the points in angular models of the
block. The ground control points were placed in
such a way to enable semi-automatic measurements
on all photographs with the particular control point.
The photo-measurements and adjustments of
individual aerial triangulations were obtained
and conducted with the software module Match-
AT by Inpho. The accuracy measure of the aerial
triangulation result was the average root mean
square error of determining the ground coordinates
of the tie point. The error was calculated as a root
mean square of all root mean square error of the
coordinates of the tie points in the block. The value
of the error was in strict correlation with the scale of
the aerial photograph, its spatial resolution, and the
focal length of the photogrammetric camera lens.
As a result of the analyses conducted the ranges for
the indicator of the aging of aerial photographs, in
relation to the completeness of the ground control
points network and the maximum value of the
average root mean square error of the coordinates
of the tie point defi ned for individual aerial
triangulations, were determined. The indicator
equalled 0 if all ground control points in the block
were projected and measured, and the root mean
square error of determining the ground coordinates
of the tie point did not exceed half of the value of
the maximum error. The indicator equalled 0.1 if
all required control points of the photogrammetric
network in the block were measured and the root
mean square error of determining the ground
coordinates of the tie point was close to the value
of the maximum error. If more than 80% of the
nominal value of the control points were planed
and measured, and the criterion for the root mean
square error of determining the ground coordinates
of the tie point was met, the indicator of the aging
of aerial photographs equalled 0.2. For other values
of planned ground control points within general
required scores of 70%, 60%,...,10%, the indicator
equalled 0.3, 0.4,...., 0.9 respectively.
The criterion for the root mean square error
was met if the indicator was more than 0.4. It was
determined, on the basis of the analysis, that for
the aerial photographs with time resolution less
than 6 years, the value of the indicator was within
the number range of <0.0-0.1). It was determined,
on the basis of the analysis that for the aerial
photographs with time resolution less than 8 years,
the value of the indicator was within the number
range of <0.1-0.2).
Increasing the time resolution of the block
of aerial photographs to 11, 15 and 21 years
resulted in the increase of the indicator of aging
of aerial photographs to more than 0.2, 0.3 and
0.4 respectively, which means that it is impossible
for more than 21-year-old aerial photographs to
obtain the results of aerial triangulation meets the
accuracy criterion. It is justifi able to investigate the
possibility to adopt a sequential measurement of
control points of archival aerial photographs on the
basis of the aerial triangulation developed for other
archival blocks with lesser time resolution.
The present research was conducted as part
of the research project no. PBS3/B9/39/2015,
co-fi nanced by the Ministry of Science and
Higher Education under the Applicable Research
Programmes of the National Centre for Research
and Development.
12
1. Introduction
The recent evolution of non-metric high
resolution digital cameras and miniaturization
of UAVs has promoted development of low-
altitude aerial photogrammetry. Considering
cost-effectiveness of the fl ight time of UAVs
vs. conventional airplanes, the use of the former
is advantageous in many photogrammetric and
remote sensing applications including the up-
dating of cadastral maps.
As the primary mapping resource for many legal
and business uses, including land management,
development planning and project location,
cadastral maps should be kept up to date.
An increasing number of government agencies
worldwide use photogrammetric data from both
aerial and satellite imagery for developing and
updating cadastral maps. A good example is
Bolivia, where cadastral map is produced based on
aerial photos [1]. Also Japan used archival aerial
imagery for reproducing the limits of cadastral
plots as they existed before natural disasters (the
earthquake and tsunami of 2011) [2]. In Poland, in
order to cadastral maps updating, orthoimage on
scale 1: 26 000 developed within the framework of
the PHARE (Poland and Hungary: Assistance for
Restructuring their Economies) system and LPIS
(Land Parcel Identyfi cation System) are used [3].
The study by Corlazzoli and Fernandez [4]
can exemplify the use of satellite imagery for
the development of cadastral maps. In this case,
orthoimages produced based on high-resolution
images from the SPOT 5 satellite were the main
source of data for plot limit identi-fi cation. In
certain cases, cadastral maps are plotted based on
both airborne and satellite im-agery [5].
However, because of the large scale, low-altitude
UAV images serve this purpose much better than
the conventional aerial or satellite imagery. UAV
images are used for updat-ing cadastral maps
[6], [7]. Further, UAV data can help to evaluate
up-to-dateness and accu-racy of cadastral maps
[8]. The study described in this paper evaluated
the suitability of UAV orthoimagery for updating
cadastral maps.
2. Data capture
To capture low-altitude aerial photos, the
researchers used a Trimble UX5 UAV equipped
with a compact SONY NEX5R camera with a
wide-angle fi xed-focus lens. The platform has a
single-frequency GPS receiver and IMU, which
enables registration of ap-proximate components
of the external reference for each image. The UAV
can fl y at the alti-tude of 75-750 m and the design
overlap of pictures it can take ranges from 60 to 90
percent.
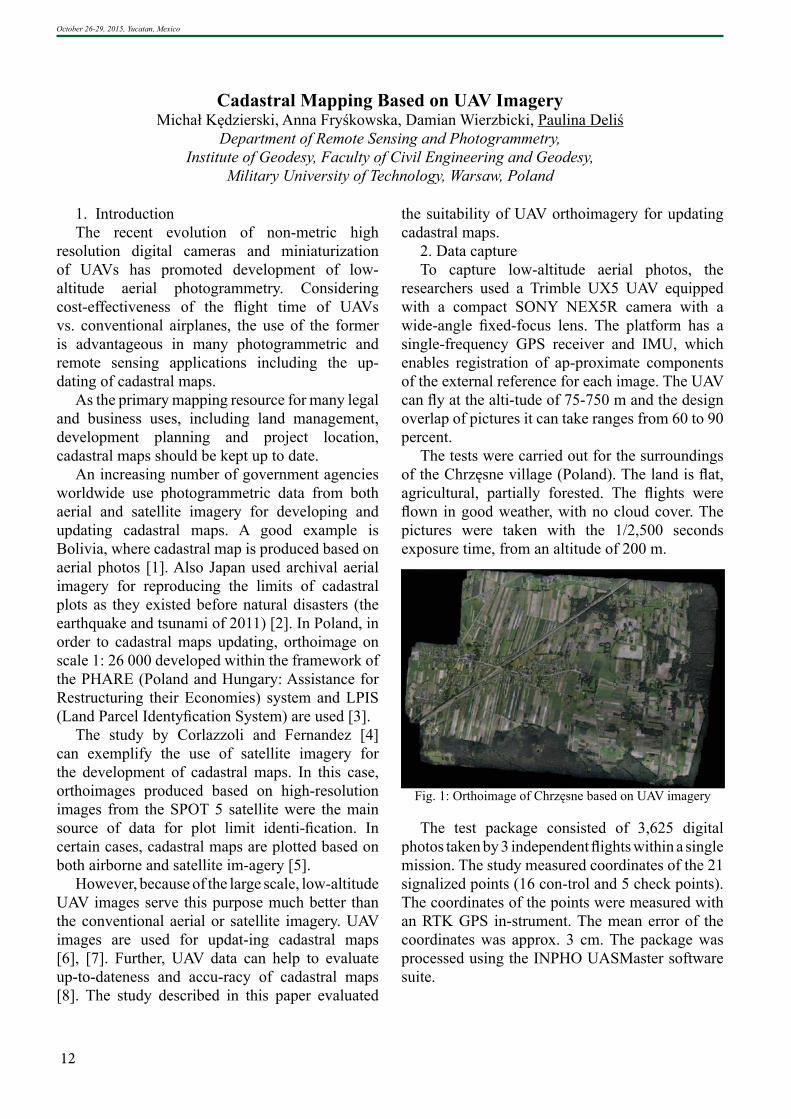
The tests were carried out for the surroundings
of the Chrzęsne village (Poland). The land is fl at,
agricultural, partially forested. The fl ights were
fl own in good weather, with no cloud cover. The
pictures were taken with the 1/2,500 seconds
exposure time, from an altitude of 200 m.
The test package consisted of 3,625 digital
photos taken by 3 independent fl ights within a single
mission. The study measured coordinates of the 21
signalized points (16 con-trol and 5 check points).
The coordinates of the points were measured with
an RTK GPS in-strument. The mean error of the
coordinates was approx. 3 cm. The package was
processed using the INPHO UASMaster software
suite.
Cadastral Mapping Based on UAV ImageryMichał Kędzierski, Anna Fryśkowska, Damian Wierzbicki, Paulina Deliś
Department of Remote Sensing and Photogrammetry,
Institute of Geodesy, Faculty of Civil Engineering and Geodesy,
Military University of Technology, Warsaw, Poland
October 26-29, 2015, Yucatan, Mexico
Fig. 1: Orthoimage of Chrzęsne based on UAV imagery

15th International Scientifi c and Technical Conference “From imagery to map: digital photogrammetric technologies”
Parameter Test packageNumber of rows 37
Camera / focal length
[mm]
NEX 5/ 15.51
overlap (along / across-
track direction) [%]
80/ 70
Flight altitude [m] 200
Camera matrix pixel
size [μm]
4,75
13
Table 1: Test package features
3. Data processing
After adjustment of the test package, the mean
error of a typical observation was 6.9 µm (1.4 px).
This large value could be a result of signifi cant
rotation angles (ω and φ < 3°). See Table 2 for the
package adjustment specifi cations.
Table 2: Results of the test block adjustment
σ0 [μm]/[pix] 6.9/1.4
Number of control points 16
Number of check points 5
RMS error for control
points (X, Y, Z) [m]
0.03; 0.03; 0.09
RMS error for check
points (X, Y, Z) [m]
0.11; 0.04; 0.13
mX0 [m] / mY0 [m] /
mZ0 [m]
0.10 / 0.08 / 0.09
mω [°] / mφ [°] / mκ [°] 0.020 / 0.026 /
0.007
The values of root mean square errors (calculated
from the adjustment) in the X,Y positioning of
the signalized control points ranged from 0.03 to
0.09 m. For the independent control points, the
RMS errors (calculated as differences between
the coordinates set by the ad-justment and the on-
ground survey coordinates) ranged from 0.04 to
0.13 m.
The adjustment provided very good results for
the determination of coordinates of the centers
of perspectives (X0, Y0 and Z0). The values of
standard deviations ranged from 0.08 to 0.10 m.
The accuracy of determination of the rotation
angles (ω, φ and κ) ranged from 0.007° to 0.026°.
The processes of creation of DTM and
orthorectifi cation used the Surface and Ortho
Generation module of the UASMaster software
suite. The creation of a DTM starts from the
genera-tion of a point cloud based on stereo. The
minimizing of the function of costs is the measure
of similarity of features in the adjustment algorithm
used to generate the point cloud. The al-gorithm
is called “Cost Based Matching” (CBM) [9]. The
resulting point cloud was fi ltered by removing
points located underground. The quality of the DTM
used to generate the ortho-imagery is critical to the
accuracy of the fi nal product. The modifi cation
of DTM was fol-lowed by orthorectifi cation and
automatic tessellation. A very important aspect of
teaseling orthoimagery taken from a low altitude
is the merging and adjusting of image radiometry.
The automatic tessellation produced a uniform
digital orthoimage with 6 cm spatial resolution.
To verify the quality of the geometric
orthoimage, its accuracy was evaluated in abso-
lute terms by reference to an independent control
measurement. This accuracy can be ex-pressed as
the root mean square error [10]:
n
ddmorto =
where:
d – deviation meaning the length of the control
point offset vector found on the orthoimages in
reference to the position determined with the
independent control measurement.
n – number of points
The evaluation used the check points not
involved in the adjustment. The accuracy of the
resulting orthoimage generated for the test area
based on the UAV imagery with a 6.4 cm GSD
was about 2 pixels, which means an accuracy of
approx. 10-12 cm.
4. Orthoimage vs. cadastral map
Depending on urban development density,
Polish cadastral maps are produced at the 1:500,
1:1,000, 1:2,000 and 1:5,000 scales. The accuracy
of cadastral maps corresponds to the accuracy of
the underlying master maps. The scale used for
rural area mapping is 1:2,000 or smaller. It was
agreed for rural areas that the acceptable error of
point positioning on a cadas-tral map is equal to
the accuracy of the 1:2,000 master map (2 m).
To check whether the geometric accuracy
and interpretative advantages of the result-ing
orthoimages are suffi cient to justify investing in
cadastral maps were used as the reference. The
review evaluated buildings, plots, roads and single-
purpose land stretches.
These items were checked for accuracy and in
terms of identifi cation on the orthoimages. The
check determined the mean error of positioning of
the outlines of buildings, plots, roads and single-
use land stretches. See Table 3 for the results.
Table 3: Comparison results
14
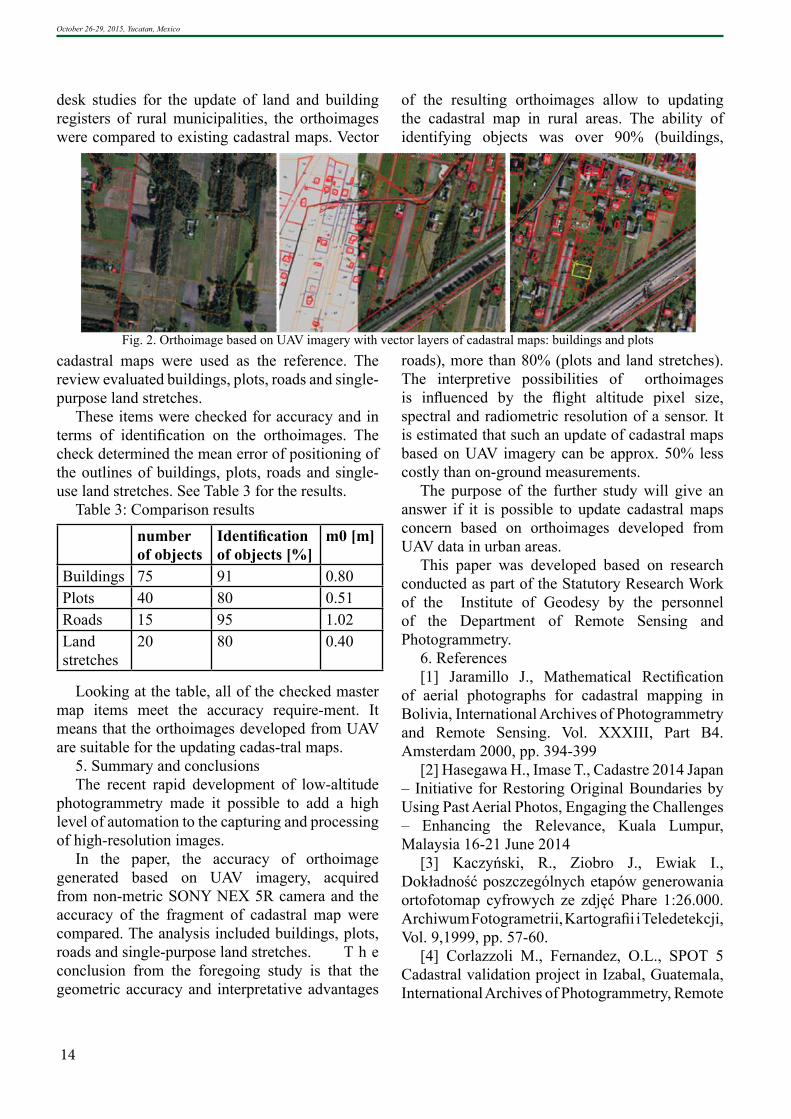
desk studies for the update of land and building
registers of rural municipalities, the orthoimages
were compared to existing cadastral maps. Vector
October 26-29, 2015, Yucatan, Mexico
Fig. 2. Orthoimage based on UAV imagery with vector layers of cadastral maps: buildings and plots
number of objects
Identifi cation of objects [%]
m0 [m]
Buildings 75 91 0.80
Plots 40 80 0.51
Roads 15 95 1.02
Land
stretches
20 80 0.40
Looking at the table, all of the checked master
map items meet the accuracy require-ment. It
means that the orthoimages developed from UAV
are suitable for the updating cadas-tral maps.
5. Summary and conclusions
The recent rapid development of low-altitude
photogrammetry made it possible to add a high
level of automation to the capturing and processing
of high-resolution images.
In the paper, the accuracy of orthoimage
generated based on UAV imagery, acquired
from non-metric SONY NEX 5R camera and the
accuracy of the fragment of cadastral map were
compared. The analysis included buildings, plots,
roads and single-purpose land stretches. T h e
conclusion from the foregoing study is that the
geometric accuracy and interpretative advantages
of the resulting orthoimages allow to updating
the cadastral map in rural areas. The ability of
identifying objects was over 90% (buildings,
roads), more than 80% (plots and land stretches).
The interpretive possibilities of orthoimages
is infl uenced by the fl ight altitude pixel size, spectral and radiometric resolution of a sensor. It is estimated that such an update of cadastral maps based on UAV imagery can be approx. 50% less costly than on-ground measurements.
The purpose of the further study will give an answer if it is possible to update cadastral maps concern based on orthoimages developed from UAV data in urban areas.
This paper was developed based on research conducted as part of the Statutory Research Work of the Institute of Geodesy by the personnel of the Department of Remote Sensing and Photogrammetry.
6. References[1] Jaramillo J., Mathematical Rectifi cation
of aerial photographs for cadastral mapping in Bolivia, International Archives of Photogrammetry and Remote Sensing. Vol. XXXIII, Part B4. Amsterdam 2000, pp. 394-399
[2] Hasegawa H., Imase T., Cadastre 2014 Japan – Initiative for Restoring Original Boundaries by Using Past Aerial Photos, Engaging the Challenges – Enhancing the Relevance, Kuala Lumpur, Malaysia 16-21 June 2014
[3] Kaczyński, R., Ziobro J., Ewiak I., Dokładność poszczególnych etapów generowania ortofotomap cyfrowych ze zdjęć Phare 1:26.000. Archiwum Fotogrametrii, Kartografi i i Teledetekcji, Vol. 9,1999, pp. 57-60.
[4] Corlazzoli M., Fernandez, O.L., SPOT 5 Cadastral validation project in Izabal, Guatemala, International Archives of Photogrammetry, Remote
15th International Scientifi c and Technical Conference “From imagery to map: digital photogrammetric technologies”
15
Sensing and Spatial Information Sciences, vol. 35,
pp. pp. 291-296.
[5] Farzaneh, A., 2010, Cadastral mapping of
Agricultural lands and Natural Resources by using
image and non-image data, ISPRS Commission I
Mid-Term Symposium, Image Data Acquisition -
Sensors & Platforms, Calgary, Canada 2010
[6] Manyoky, M. Theiler P., Steudler D.,
Eisenbeiss H., Unmanned aerial vehicle in
cadastral applications, International Archives of
the Photogrammetry, Remote Sensing and Spatial
Information Sciences, Vol. XXXVIII-1/C22,
UAV-g 2011, Conference on Unmanned Aerial
Vehicle in Geomatics, Zurich, Switzerland
[7] Volkmann W., Barnes G., Virtual Surveying:
Mapping and Modeling Cadastral Boundaries
Using Unmanned Aerial Systems, Engaging the
Challenges – Enhancing the Relevance, Kuala
Lumpur, Malaysia 16-21 June 2014
[8] Cunningham, K. Walker, G., Stahlke E.,
Wilson, Cadastral Audit And Assessments Using
Unmanned Aerial Systems, International Archives
of the Photogrammetry, Remote Sensing and
Spatial Information Sciences, Vol. XXXVIII-1/
C22, UAV-g 2011, Conference on Unmanned
Aerial Vehicle in Geomatics, Zurich, Switzerland
[9] Saile J., High Performance Photogrammetric
Production, Photogrammetric Week 2011, pp.21-
27;
[10] Kędzierski M., Fryśkowska A., Wierzbicki
D., Opracowania fotogrametryczne z niskiego
pułapu, Redakcja Wydawnictw Wojskowej
Akademii Technicznej, Warszawa 2014, ISBN
978-83-7938-047-3


Technological Capabilities of DPW PHOTOMOD 6.0: Practice Implementation In the Cartographic Production
Dinara M. Khaydukova
JSC Uralgeoinform, Ekaterinburg, Russia
In October 2014 came the full 64-bit digital
photogrammetry system PHOTOMOD 6.0.
JSC Uralgeoinform successfully works with
PHOTOMOD more than ten years, so already
10 October 2014, the company introduced a new
software system to work. At that time, it assumed
active use PHOTOMOD 6.0 for the creation of
digital orthophotos for satellite images.
In the fi rst part of the report referred to the
composition of the professional and technical
capabilities of the Department of digital
photogrammetry. The main advantage of 64-bit
version of the system is complete and optimal use
of computer memory, so the company acquired
a new modern fl eet of workstations. Server
distributed processing made an eight-processor
computer with Intel (R) Core (TM) 2 3.40GGts
i7-3770 CPU, RAM and 16 GB Windows 7 x64.
Clients were 7 computers with 4 core processor 4
nuclear Intel (R) Core (TM) 2 3.40GGts i5-3570
CPU, RAM and 16 GB Windows 7 x64. The total
number of customers - 9 threads - 28.
The second part describes the experiment
posed of "Uralgeoinform" based on the project on
creation of digital orthophotos for satellite images.
The total area of the captured territory 698000
km2. The number of satellite images: 5139,
obtained from spacecraft TH-1, TH-2 and ZY-3.
The total size image 1400.832 GB. The resulting
volume of digital orthophoto 3000 nomenclature
sheets. For the main work in PHOTOMOD 6.0 was
allocated two jobs for engineers photogrammetry,
the other computers involved only as clients
distributed processing and is mainly used by
specialists cartographers to work on other projects
the company.
Additionally, the report will examine some
interesting thematic projects implemented in the
enterprise.
In conclusion, the report will draw attention
to the positive and negative conditions affecting
the speed of the work will be the analysis of the
benefi ts of using PHOTOMOD 6.0, estimated
profi tability of using DPS PHOTOMOD 6.0 when
creating large mapping projects limited number of
specialists.
17
15th International Scientifi c and Technical Conference “From imagery to map: digital photogrammetric technologies”

18
My Latin American ExperienceEm. Prof. Dr.mult. Gottfried Konecny
Leibniz University Hannover, Germany
From 1959 to 1971 I was employed by the
University of New Brunswick (UNB) in Canada,
where we started the fi rst English language
Geomatics program in Canada. As part of my
University activities I participated in a Canadian
Research Council led activity of the Pan American
Institute of Geography and History (PAIGH)
to introduce cadastral land registration in Latin
American countries. At PAIGH we had annual
meetings in Mexico City between 1968 and 1970.
At UNB we had a guest professor in geodesy
from 1967 to 1970 from Tucuman in Argentina.
After my move from Canada to Hannover in 1971
my Argentine friend had become Dean at his
University in Argentina, and he invited me to hold
a short course in analytical photogrammetry to the
Argentine photogrammetric community in 1971,
which up till then had an analog orientation. At that
time the group of about 30 participants founded the
Argentine Society for Photogrammetry. The course
was repeated in 1973.
During my activities in Hannover I continued my
interest in establishing cadastral land registration
systems in the developing countries of the globe. We
founded a group of German academic, commercial
and governmental representatives, the BEV, of
which I became chair in 1975. We held workshops
supported by the German Ministry of Economic
Cooperation on surveying and mapping in 1975
in Berlin and later in Hannover and Hamburg. We
cooperated with the UN Secretariat in New York
and with the German national technical cooperation
agency GTZ (now GIZ).
This brought me as a member of the German
delegation to the UN Cartographic Conferences for
the Americas to Panama in 1976, to Mexico in 1979
and since 1983 to the UN Headquarters to New
York where we had interchanges with the Latin
American countries in geodesy, land surveying,
cadastre, photogrammetric mapping and remote
sensing.
In this context I became involved in the
educational effort for surveying and mapping at the
University of Heredia in Costa Rica in 1976, at the
University of Los Andes in Merida, Venezuela in
1982 and at the University of Zulia in Maracaibo,
Venezuela in 1983. I gave a short in analytical
photogrammetry in Spanish at the Universidad
Nacional de Mexico in the same year and I gave
lectures at the University of Curitiba in Brazil in
1984.
In the 1990´s I was involved in a technical
cooperation project at the Instituto Geografi co
Nacional in Guatemala.
Through my ISPRS activities as President I had
good contacts with visits in the 1980´s to Brazil,
Uruguay, Chile and Cuba.
Latin America has traditionally very close
relations to the U.S. This was facilitated by the
Interamerican Geodetic Survey organized by the
American Military. Accordingly access to hardware
and software is traditional from the US except for
Cuba, which had relations with the Sovjet Union.
It is only handicapped by cost. But even German
technical cooperation agencies have included
American software into their projects because of
service considerations. However,
European hardware suppliers, like formerly
Wild, Zeiss and Kern traditionally had a high
esteem, even though only Hexagon is on the
global market from Europe. Brazil´s activities of
their space agency INPE by providing imagery
and software for image processing free of charge
or at low cost have enhanced uses of geospatial
products.
In the geoinformatics fi eld Latin America
has a very unique position. The Latin American
countries gained independence in the early 19th
century, when mapping was globally not yet
well developed. In Asia and Africa mapping was
introduced in the late 19th century and in the early
20th century by the colonial powers. In the early
20th century the Soviet Union introduced mapping
as a national priority. So it happened in North
America, Australia and Japan as well.
In Latin America Mexico followed the
developments in the USA, while in most Latin
American Countries in the South mapping was
mostly a military activity. The UN Secretariat
studies of 1960 to 1986 show, that the areas mapped
October 26-29, 2015, Yucatan, Mexico
15th International Scientifi c and Technical Conference “From imagery to map: digital photogrammetric technologies”
19
at large and medium scales in Latin America had
a much lower percentage than areas mapped in
Africa and Asia, and this is still so. Brazil has only
a complete coverage at the scale 1:250 000. This
means, that the demand for large scale mapping
is immense, considering the existing low map
coverage and considering at the same time the
rapid increase in population in the Latin American
urban centers. This demand cannot be satisfi ed by
government alone. This is a great challenge for the
private sector, particularly when it can cooperate
with the government.
International events and conferences, such
as the Racurs Conference, are opportunities for
network creation. Organizers of such conferences
have it in their hand to invite papers of persons,
who are responsible for soliciting, fi nancing and
conducting large scale mapping projects:
1) national mapping agencies, such as INEGI in
Aguascalientes in Mexico, which plans and fi nances
national activities at medium scales. The same is
the case in Guatemala by the Instuto Geografi co
Nacional. The Municipalities in Mexico and
Guatemala may have their own budgets for large
scale mapping, but their activities are coordinated
by the national mapping agencies.
2) some of the poorer states in Central America
rely on donors, such as the World Bank, Latin
American Division in Washington D.C. or
the Interamerican Bank to fi nance urban, land
management and cadastral projects, which need
large scale mapping. The World Bank and the
Interamerican Bank provides loans to governments.
Other bilateral arrangements for smaller projects
are usually made by national donors, such as the
Canadian International Development Agency
CIDA in Ottawa, USAID in Washington, D.C.,
the German Technical Cooperation Agency in
Eschborn near Frankfurt, and other agencies funded
by their national governments, such as Dutch
Cadastre, Swedesurvey, Norwegian Development
Agency NORAD, the Danish Agency DANIDA or
IGN France. JICA Japan has not been very active
in Latin America, as well as China.
3) all such agencies generally outsource their
projects by international or national tender to
a mapping company. In Mexico GeoAir with
Wolfgang Kost as CEO, who also works by tenders
in Central America and even South American
countries should have an excellent knowledge
about the national and international competitors in
the region. Maybe you might want to talk to him or
ask him to present a paper on the private mapping
sector in Latin America, if you cannot attract all
competitors together.
4) all Latin American mapping agencies are
networked in two organizations:
a) the Pan American Institute of Geography and
History PAIGH, established in Mexico in 1928,
with is present General Secretary Santiago Borrero
from Colombia. PAIGH meets annually and has
many working group activities with members of
all Americas.
b) out of the former United Nations Cartographic
Conferences for the Americas established in 1976
a regional group was created by the name PC-
IDEA in the 1990´s. Santiago Borrero was the fi rst
President of PC-IDEA. In 2009 UN ECOSOC has
established UNGGIM in New York, which meets
globally every year. The next global conference
is scheduled from August 3 to 7, 2015 at UN
Headquarters in New York. Current Vice Chair of
UNGGIM is INEGi, Mexico President Eduardo
Sojo Caza-Adape.
However, UNGGIM has created regional
chapters for the establishment of regional activities
by working groups. UNGGIM-Americas has
become the successor of PC-IDEA.
President of UNGGIM-Americas is currently
Rolando Ocampo Alcantanar, Vice President of
INEGI, Mexico. PAIGH and UNGGIM-Americas
also discuss mapping activities.
5) As noted, the next UNGGIM global
conference UNGGIM5 is scheduled from August
3 to 7, 2015 at UN Headquarters in New York. The
German government has nominated me as member
of the German delegation. Our delegation consists
of BKG President Kutterer from Frankfurt, the
representative of the Cadastral administrations
of Germany Mr. Wandinger, the President of the
German Survey Society, Karl Friedrich Thöne,
who organizes Intergeo and myself.
October 26-29, 2015, Yucatan, Mexico
20
Applying of Space Remote Sensing Data in Urban DevelopmentVictor A. Panarin1, Olga N. Kolesnikova2, Roman V. Panarin3
1Municipal Budget Institution “Urban development”, Dzerzhinsk, Russia2Sovzond, Moscow, Russia
3SCANEX Research and Development Center, Moscow, Russia
As of today in the urban self-governance
architecture structure the space imaging as one of
the types of urban development documentation,
or at least as a source for preparation of this
documentation, is not clearly understood and
underestimated by staff and even the developers of
the documentation. In the best case the images are
used for visual clarifi cation of a particular location
or to recognition of objects of urban development.
However these images can provide a signifi cant
amount of information for correction and further
control of urban development documentation
and allow to econom signifi cant fonds during the
documentation development.
First step during as part of a try to use the
image as a base for further work was the image
coordinates binding to the coordinate system used
in urban self-governance architecture structure.
The binding was done using land anchor points
with binding accuracy check by 10 pivot control
points. To achieve acceptable results it is enough
that binding is done using 4-5 points and the rule
that 3-4 of the points are chosen close to the image
corners area and one point is located in central area
to adjust offsets is followed.
Having image translated into urban coordinate
system it is possible to use the image to clarify
information about urban development objects and
urban territories sensing. Having images from
different time periods and from different satellites
gives the possibility of correct and quality
comparison of given calculated results (most
importantly object areas and object locations) from
different sources, such as: images, maps, schemes,
general plan of a city, rules of land tenure and
housing, planning projects, territories and land lots
surveying, etc.
Vectorization of sensed territory boundaries
from an image is needed to get the digital estimation
of territory sensing. Digitizing was done using
spectral analysis with visual adjustment.
First and widely used application of the images
is monitoring of urban territory. City housing
boundaries, water objects, roads, natural and
artifi cial landscapes can be vectorized automatically
and with high quality using the image. Processing
of high-detailed images requires adjustment and
clarifi cation by generalization of images of objects
fragmentary which impacts area of vectorized
polygon. Swamps, meadow vegetation, various
grounds, landscaping elements are much more
laborious and require manual adjustment. It is close
to impossible to digitize buildings, especially the
ones with gable roofs. The only reliable method is
manual digitizing of the buildings.
General plan of a city and rules of land tenure
and housing are prepared using maps with 1:10 000
scale according to standards, but at the same time
rules of land tenure and housing have to be fulfi lled
with land lots boundaries which have accuracy
equal or more detailed than 1:2 000. Fulfi llment of
such requirements and combining it with images in
such scales is very laborious and expensive which
is why it is not used in development of rules of land
tenure and housing, thus reducing development
cost. However partly the issue is solved by using
space image for boundaries adjustments.
Territory balancing is a very important element
of territory planning and sensing. Space images
usage allows estimate with very high precision
areas of water objects, green spaces (noticeably the
real boundaries instead of assumed boundaries),
landscaping, etc.
To conclude, usage of high-detailed space
images with high defi nition during development
of urban development documentation, especially
documents of territorial planning and sensing,
allows (even using old maps as sources) to get
an accurate and quality data, adjust boundaries
of territories and reduce cost of development
and further correction of urban development
documentation.
Provided with step by step instructions and
corresponding software the methods for binding

and processing (including vectorization) of space
images can be utilized by regular staff of urban
self-governance architecture structure. Additional
expenses for development of the instructions,
acquiring of specialized software and education
of personnel pays off in a very short time period.
Urban development documents with high quality
are popular and allow to increase the investment
attractiveness of urban territories. The return of
spent fonds is done by providing paid details from
information systems supporting urban development
activities and development of territories by
investors.
15th International Scientifi c and Technical Conference “From imagery to map: digital photogrammetric technologies”
21

23
Creation of Digita l Surface Models using Resurs-P Stereo PairsAlexey A. Peshkun
The Research Center for Earth Operative Monitoring
JSC “Russian Space Systems”, Moscow, Russia
Two spacecrafts of Resurs-P”type (spacecraft
№1 was launched on June 25, 2013, spacecraft №2
was launched on December 26, 2014) are operated
currently. These spacecrafts are manufactured for
a wide range of tasks (map updating, supporting
of activity of different federal, regional, municipal
departments and other consumers) as well as for
receiving information concerning control and
protection of the environment.
The Resurs-P spacecrafts stereopairs are the
input data for creating DSM.
The key characteristic of a stereo pair is the B / H
ratio. The convergence angle is approximately 54
degrees for values of the B / H ratio close to 1. If
stereo imaging is performed with equal deviations
in pitch, the defl ection angles will be about 27
degrees in this case. Pros of such parameters of
stereo imaging are: a large angle of convergence
allows to improve the measurement accuracy of
a stereo pair, a larger area of a stereo pair. Cons
are: shadow zones of mountainous areas and areas
with storied buildings, additional imaging with a
small angle of deviation from the nadir or use of
image of a stereo pair with a deviation from the
nadir more than 20 degrees is to be performed for
creating orthophoto
Normally B/H ratio is in the range from 0.3 to
0.5. This ration should be reduced for mountain
areas , and increased for fl at areas. Thus, the
convergence angles range is from 30 to 45
degrees. To create orthophoto stereo imagery can
be performed with different angles of defl ection
of the optical axis from the nadir in pitch (for
example, +20 and -10 degrees) for the purpose of
using image with a lesser angle of deviation from
the nadir for orthorectifi cation.
To create a DSM stereo imaging by spacecraft
Resurs-P №1 sensor GEOTON-L1 in the
panchromatic band with different angles of
deviations in pitch were performed.
7 images were used For creating stereo pairs .
The main stereo pairs (by the imaging on the same
orbit pass) and additional (matched to the angle
of convergence). The result was 8 stereo pairs
for the same territory, but with different angles
of convergence and B/H ratio. Data processing
level 1A and 2A was used for photogrammetric
processing .
Photogrammetric processing was performed by
using the PHOTOMOD v.6. The block of 7 images
was formed during processing. To perform the
block adjustment 7 controls and 76 check points
were used.
7 DSM were created after adjustment . 5 DSM
were created using data processing level 1A and
2 DSM were created using data processing level
2A. Amond them 2 DSM were built using the new
algorithm of PHOTOMOD — dense DSM creation
(using multiple overlapping).
The results of data processing showed that
images of data processing level 2A are the best for
photogrammetric processing, including the creating
DTM and DSM . Images of data processing level
2A have better geometric properties and lead to the
DTM precision (standard deviation by height up to
3 meters).
15th International Scientifi c and Technical Conference “From imagery to map: digital photogrammetric technologies”

GIS-Sofi a Data BaseVanya Petrova
GIS-Sofi a Ltd., Sofi a, Bulgaria
Founded seven thousand years ago, Sofi a is the
second oldest city in Europe. It has been given
several names in the course of history and the
remains of the old Thracian and Roman cities can
still be seen today. The city became known as Sofi a
from the beginning of the 15th century. In 1879
Sofi a became capital of Bulgaria.
Nowadays the territory of Sofi a Municipality is
1349 sq. km and includes the areas of 4 towns — City
of Sofi a (around 200 sq. km), three other towns:
Bankya, Novi Iskar, Buhovo and 34 villages. The
City of Sofi a with 1.3 million population includes
24 administrative and territorial districts.
The main function of creation and maintenance
of the cadastral information system of Sofi a
Municipality is in charge of GIS SOFIA Ltd.
(Geographical Information System – Sofi a),
established in 1999, as a Sofi a Municipality
company. Starting with 25 persons the staff of GIS
SOFIA has grown to 130 highly qualifi ed, proven
specialists in the fi eld of geodesy, cadastre, spatial
planning, photogrammetry, cartography and a
team of lawyers, specialized in the fi eld of property
relationships. GIS SOFIA Ltd. is one of the largest
surveying companies in Bulgaria. The company is
certifi ed according to International Standard ISO
9001:2008.
GIS SOFIA Ltd. has created own geographic
information system - SOFCAR - including cadastral
and urban plans, as well as other geographical data
also orthophotoplans, from aerial and satellite
images, over the territory of the municipality. The
SOFCAR information system meets all modern
requirements and trends in this area, allowing
effi cient use and management of the data. This is
the most signifi cant project and achievement of the
company.
There is an internet application on our
site through which you get reliable real-time
information about the cadastral plan of Sofi a —
IsofMap. For the territory or property you have
chosen the system enables you to load additional
thematic maps with information on regulation,
spatial development zones, noise sources, cultural
monuments, orthophotoplan also data on the
location, boundaries and features of the property.
In the family of geographical information
system one of the main positions holds
photogrammetry — the fastest and the most
modern way to acquire up-to-date information of
the Earth’s surface. Photogrammetry Department
at GIS SOFIA applies digital photogrammetric
software PHOTOMOD in projects based on aerial
and satellite images. During the years 2000-2013
different kind of sources were used — analogue
fi lm cameras (RMK A 15/23, RMK TOP 30),
digital cameras (DMC, UltraCamXp), various high
resolution satellite sensors (IKONOS, QuickBird,
KOMPSAT, GeoEye-1).
The fi rst of its kind, in Bulgaria, orthophotoatlas of
Sofi a Municipality at a scale of 1:5000 was printed,
using aerial images with 10 cm GSD — a luxurious,
limited edition. In 2013 on the celebrating of
the World GIS Day in Bulgaria, GIS SOFIA
Ltd. was awarded in category of successful GIS
projects within local authorities for "Applying of
innovative GIS approach in the development of an
Ortophotoatlas of Sofi a Municipality".
Cartography Department at GIS SOFIA
produces cartographic products in various formats,
size and content for the territory of Sofi a and Sofi a
Municipality. There are lots of interesting thematic
maps - map of polling stations and voting sections
within an administrative area; with the location of
sirens for warning of the population; with stations
for protection of the population in case of disasters
or emergencies; with places for walking pets etc.
One of the recent activities in GIS SOFIA
is the Professional Training Centre, established
in 2010. The Centre organizes courses and
seminars for increasing qualifi cation levels in the
several occupational areas - Cadastre, Regulation
Planning, Digital Photogrammetry, Remote
Sensing, Cartography and Legislation related to
geodesy. The main goal of the centre is to organize
very specialized training that meets the specifi c
needs and requirements of participants. The center
is licensed by the National Agency for Vocational
Education and Training.
October 26-29, 2015, Yucatan, Mexico
24
Photogrammetry and Parallel Computing — Software and HardwareAndrey Yu. Sechin
Racurs, Moscow, Russia
We have currently a rapid growth of remote
sensing satellites and aerial cameras productivity.
For example European Pleiades-1А and Pleiades-
1B satellites have acquisition capacity of 2,000,000
km2 per day. Visionmap A3 Edge aerial camera
produces 5000 km2/hour of images with 20 см
GSD. Total size of acquired aerial or satellite
images is enormous and requires a lot of CPU
processing time on a modern workstation. If one
needs fast photogrammetric image processing he
should use modern parallel computer capabilities.
Today computer clusters are cheap enough and
allow fast photogrammetric processing.
This paper considers high computer performance
technologies and algorithms for parallel seamless
photogrammetric mosaic building for aerial and
satellite images with the given DTM. Different
methods and algorithms are analyzed. Some
estimates are made. The second part of the paper
is dedicated to storage systems that should hold
initial, temporary and fi nal images. These storage
systems must be properly designed for high
scalability on clusters.
15th International Scientifi c and Technical Conference “From imagery to map: digital photogrammetric technologies”
25
Updating the Thematic Content of Touristic Maps Using Satellite ImagesRoman Shevchenko
Kyiv National University of Trade and Economics, The Tourism Department, Ukraine
Most national touristic maps in Ukraine are old,
outdated, and largely exist in analogue form. Due
to the high cost of aerial photography, these maps
have not been updated for many years and as such
are not useful for planning and navigation purposes
in tourism. Therefore, there is an urgent need to
produce new maps or update existing ones. The
National Centre for Mapping of Touristic Objects
for Development of Ukraine (NCMTD) has a wide
experience in rapid and cost-effective updating
of touristic maps using high resolution satellite
data. The method entails: undertaking preliminary
interpretation of georeferenced satellite imagery
based on predefi ned classifi cation and aided
by secondary; ancillary data; identifi cation of
sample points that prompt Wikimapia Geoportal
facilitated ”ground truthing”; conducting the fi nal
image interpretation; development of database
driven thematic map layers; mosaicing of all the
thematic touristic layers to form country-level
thematic maps; integration of these datasets with
administrative boundaries.
In this thesis, the updating of the National
Touristic map of the Ukraine using the 20 by 20
meter resolution OKEAN-O satellite imagery is
given as a case study. The successful completion of
the project not only demonstrates the capabilities
and potential of satellite remote sensing in modern
day mapping but also illustrates the fl exibility and
dynamism of GIS generated map databases in
the provision of value-added products for quality
planning and decision making.
In Ukraine the fi rst commercial high-resolution
satellite sensors were heralded in the mid 2000s,
mapping agencies have shown a keen interest in
the possible use of satellite imagery in their data
collection programmes. Since as long ago as 2006
(reported in Ridley et al, 2007) Ordnance Survey
has been investigating this potential, initially
using images synthesized from aerial photography,
more recently using satellite imagery from the
DNIPRO-1, IKONOS and QuickBird sensors. A
recently-published OEEPE (now EuroSDR) report
presented fi ndings of an investigation into the
potential of IKONOS data for touristic mapping,
undertaken by several European mapping agencies
and institutions (Holland et al. 2013). The results
suggested that there is potential in this fi eld,
especially in rural areas at scales between 1:10 000
and 1:50 000.
The results of this project were as follows:
I) A cost-effective and rapidly updated National
Touristic Map of the Ukraine was produced using
SPOT satellite imagery at the scale of 1:250000.
The map carried eight land touristic cover classes,
touristic-hydrological features, the transportation
infrastructure, sacred towns, and the administrative
boundaries.
II) A rich GIS database containing both spatial
and aspatial information was developed. From the
fl exibility of scale and thematic overlays, scalable
thematic Touristic Maps of the Ukraine can be
generated at fairly short notice from the massive
database.
III) Despite various limitations, the
appropriateness of this mapping methodology was
tested, refi ned and is thus suitable for Nation wide
mapping of East-European countries especially
considering the socio-economic inadequacies
perpetually inherent in this countries.
IV) The satellite image interpretation accuracy
was about 80% indicating that the methodology is
robust and reliable if well executed.
The results of this project indicate that high
resolution data can be reliably and rapidly used
to update touristic maps at both National and
Regional Levels. However, it should be noted that
use of remote sensing data has certain limitations.
These include:
I) Geometric inaccuracies and errors: satellite
mapping carries high possibilities of inheriting and
cumulatively propagating inaccuracies and errors
through both the source data and methodology. It is
therefore important that potential users are aware
of these limitations and thus use the Touristic Maps
as a general information source and not for site
specifi c studies. As with any earth resource issue,
regulatory and policy decisions demanding the
most accurate and precise information will require
more detailed data, especially those from ground
observations.
It should also be recognized that the spatial
October 26-29, 2015, Yucatan, Mexico
26
27
15th International Scientifi c and Technical Conference “From imagery to map: digital photogrammetric technologies”
properties of the fi nal land touristic cover data are
a combination of the geometries of the individual
source data layers i.e (a) different paths and rows
of DNIPRO-2 data; (b) the use of geocoded and
in-house geometrically-corrected data; and (c)
the integration of ancillary data whose geometry
has been altered somewhat in the raster-to-vector
conversion. However the geometric fi delity of
each dataset, combination of datasets, and products
derived through image processing operations in
this case were carefully scrutinized at each stage of
the mapping project to maintain the highest level
of co-registration possible.
II) Effect of cloud cover: The use of satellite
touristic mapping is sometimes limited by various
atmospheric noises of which cloud cover especially
in the coastal regions is the most signifi cant. In
such cases there tend to be an excessive reliance on
collateral data majority of which are usually old.
Field observation in this case is most suitable
but is usually confi ned to the more accessible
areas. On the other hand aerial photography,
though expensive, may also be used. Despite the
limitations, high resolution satellite data can be
used effectively and rapidly to update old touristic
maps. The resulting touristic maps provide useful
and general information that is necessary for
planning and decision-making at National and
Regional Levels. Digitization of the fi nal touristic
interpretation was done on a scene by scene and
theme by theme basis using Arc/Info and ArcView
GIS software. Touristic cover polygons, rafting-
hydrological features and the road network were
thus digitized as independent thematic layers. Each
thematic touristic layer was then edited to eliminate
digitization errors and thereafter coded and
georeferenced. Prints of the preliminary digitization
were then made at the same scale as the original
images so as to allow direct 1:1 overlay evaluation
of the quality and accuracy of the digitization
and coding. Whenever errors were identifi ed, the
necessary correction was made. Additional feature
information was then input and appended to the
GIS database. Following approval of the quality
of the digitized themes, adjacent digital themes
were edge-matched and joined together to produce
single nationwide thematic mosaics of the entire
Touristic Regions of the Ukraine. Using ArcView,
all the different National map layers were overlaid
to produce a single multi-thematic map of Ukraine
Touristic View at the scale of 1:250000.
Summary. The results of this project are
encouraging and confi rm the utility of SPOT
& SICH-3 satellite data (and indeed other high
resolution satellite data like Landsat TM, Ikonos,
Eros, etc) in updating statewide GPS-touristic
maps and monitoring change.
Since the successful launch of DNIPRO-3 in
2009, a new source of imagery has been available
to the touristic user. In many parts of the world
high resolution satellite imagery from IKONOS,
QuickBird and, more recently, ORBVIEW 3, has
proved to be auseful data source for the creation
of ort horectifi ed images and associated touristic
mapping products. One of the great advantages
of satellite imagery is the ease of access to areas
which have previously been too remote or too
dangerous to reach using conventional aerial
photography. However, for areas of the Earth
which are not diffi cult to reach, and which have
a tradition of high resolution mapping from aerial
photography, this advantage is of rather limited
importance. Ordnance Survey, Ukrainian National
Mapping Agency, currently makes extensive use
of aerial imagery in the collection of large scale
geospatial data.
In 2015, a project was initiated which would
determine whether satellite imagery could replace,
or complement, aerial photography in this data
collection process; or could be used in other
ways within a production tourism environment to
make the process more effi cient. Interim results
of this research are presented in this thesis. The
results described in this paper have indicated
that QuickBird Imagery can play a role in all the
processes investigated.
Imagery of this resolution can be used to update
mid-scale touristic maps (1:6 000 to 1:10 000 scale)
as long as small linear features are excluded from
the touristic mapping specifi cation. This imagery
can also be used in the detection of change, and
in the quality checking of existing map data.
However, in each case there are disadvantages,
which indicate that QuickBird imagery should
be used in a supplementary way, rather than as
the main source of data. For example, QuickBird
could be used to obtain frequent snapshots of
rapidly changing urban areas, enabling change to
be detected more readily than is possible by other
methods.

15th International Scientifi c and Technical Conference “From imagery to map: digital photogrammetric technologies”
29
Creation of a 3D Model of the City of Krasnoyarsk as Part of Cartographic Support of Urban Planning and Property Complex Management
Aleksandr Voitenko, Igor Koshechkin
KADASTRSYOMKA, Irkutsk, Russia
Over the period since fall 2013 to spring 2015,
our company performed a set of work for update
of cartographic information related to the territory
of Krasnoyarsk, developed digital aerial survey
maps of the city's territory in scale 1:500, 3D
topographical maps in scale 1:2000, and plotted
TrueOrtho maps in scale 1:500 based on the city's
vector 3D model, as well as developed a vector 3D
photorealistic model of the city of Krasnoyarsk.
This work has been performed with the purpose to
create an up-to-date, consolidated, highly accurate
cartographic basis required to develop the new
general layout of the city of Krasnoyarsk, which
is scheduled to host the 29th World Winter Student
Games in 2019.
Krasnoyarsk is a city in Russia with population
of over one, one of the largest cultural, economic,
industrial and educational centers of the Central
and East Siberia. Total area of the city is 353.9
sq.m. Elevation about sea level - 287 m. The terrain
of the city and its surroundings is diverse. The
city is predominantly composed of 5 to 9-storied
buildings.
The fi rst stage of work was create a single
geodetic basis for the city of homogeneous
accuracy, which included 452 reference points
(on the basis of triangulation network, elevation
references and the city's polygonal network). The
created reference geodetic network enables to
utilize its points as reference in performance of
geodetic work both by classical methods – with
electronic tachymeters, and using GLONASS/GPS
technologies.
The second stage to obtain a digital cartographic
basis was digital aerial survey and aerial laser
scanning. Aerial laser scanning was performed
with a Leica ALS60 set of equipment. Digital
aerial survey with RCD30 camera was performed
simultaneously. Total surveyed area amounted to
633.59 sq.m.
During the third stage of works, we created
digital orthophotomaps in the local coordinates
system in scale 1:500, with terrain resolution of 6
cm, using TerraSolid and PHOTOMOD software.
TerraSolid was required to calculate the parameters
of external image orientation and classifi cation of
laser refl ection points, while PHOTOMOD was
used to remedy cuts, to compensate color palette
and plot digital orthophotomaps. Coverage with
digital orthophotomaps amounted to 382 square
kilometers.
Laser survey parameters
Flight speed: 150 km/h
Flight height: 550-600 m
Scanning angle, scanning rate: 56°, 120000 Hz
Average point density per 1 sq.m. of surface:
30 points
Average point density per 1 sq.m. of terrain
surface : ~ 5 points
Accuracy of plan point position: 0.09 cm
Elevation scanning accuracy: 0.07 cm
Transverse overlap of laser scanning runs: 35%
Key technical parameters of aerial photo camera
and survey mode:
Flight height: 550-600 m
Image size: 8956px*6708px
Lens focal distance: 52 mm
Camera pixel size: 6 µm
Acquisition interval: 4.8 sec
Calibration: RCD30 incorporates photogram-
metric calibration data
Average pixel size on terrain (GSD): 0.068 m
Total number of images: 32559
Longitudinal image overlap: 80%
Transversal image overlap: 70%
During the third stage of works, we created
digital orthophotomaps in the local coordinates
system in scale 1:500, with terrain resolution of 6
cm, using TerraSolid and PHOTOMOD software.
TerraSolid was required to calculate the parameters
of external image orientation and classifi cation of
laser refl ection points, while PHOTOMOD was
used to remedy cuts, to compensate color palette
and plot digital orthophotomaps. Coverage with
digital orthophotomaps amounted to 382 square
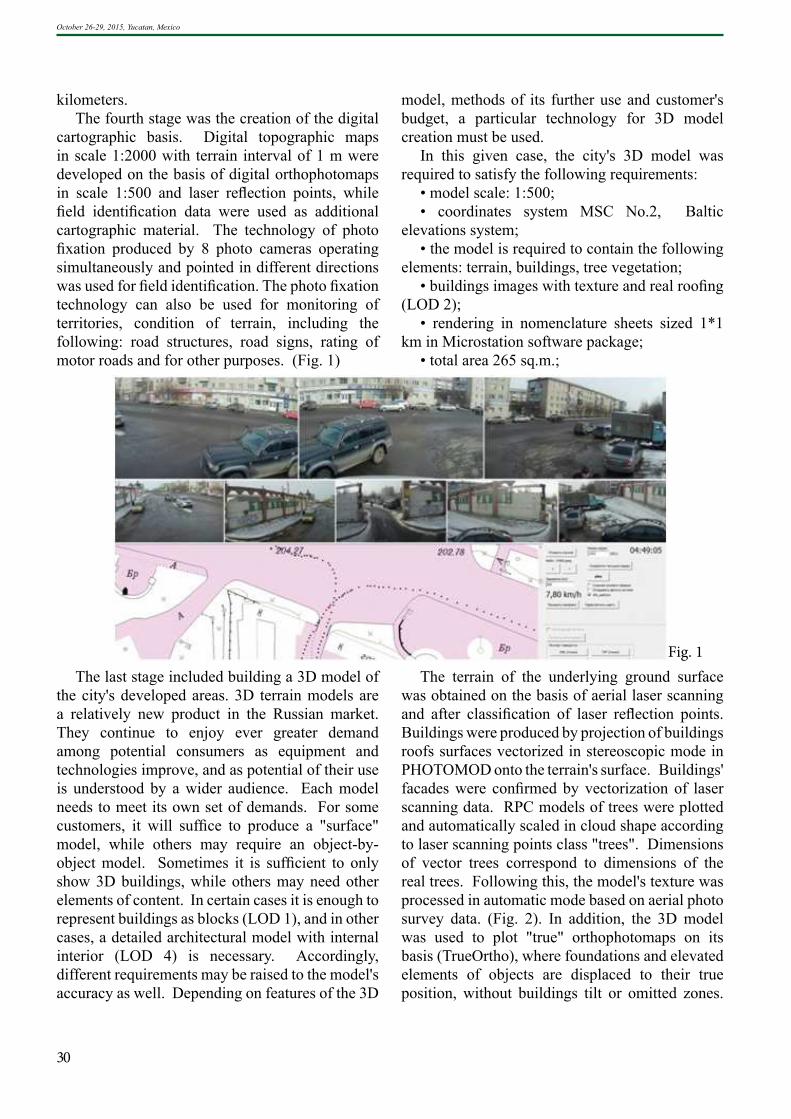
kilometers.
The fourth stage was the creation of the digital
cartographic basis. Digital topographic maps
in scale 1:2000 with terrain interval of 1 m were
developed on the basis of digital orthophotomaps
in scale 1:500 and laser refl ection points, while
fi eld identifi cation data were used as additional
cartographic material. The technology of photo
fi xation produced by 8 photo cameras operating
simultaneously and pointed in different directions
was used for fi eld identifi cation. The photo fi xation
technology can also be used for monitoring of
territories, condition of terrain, including the
following: road structures, road signs, rating of
motor roads and for other purposes. (Fig. 1)
The last stage included building a 3D model of
the city's developed areas. 3D terrain models are
a relatively new product in the Russian market.
They continue to enjoy ever greater demand
among potential consumers as equipment and
technologies improve, and as potential of their use
is understood by a wider audience. Each model
needs to meet its own set of demands. For some
customers, it will suffi ce to produce a "surface"
model, while others may require an object-by-
object model. Sometimes it is suffi cient to only
show 3D buildings, while others may need other
elements of content. In certain cases it is enough to
represent buildings as blocks (LOD 1), and in other
cases, a detailed architectural model with internal
interior (LOD 4) is necessary. Accordingly,
different requirements may be raised to the model's
accuracy as well. Depending on features of the 3D
model, methods of its further use and customer's
budget, a particular technology for 3D model
creation must be used.
In this given case, the city's 3D model was
required to satisfy the following requirements:
• model scale: 1:500;
• coordinates system MSC No.2, Baltic
elevations system;
• the model is required to contain the following
elements: terrain, buildings, tree vegetation;
• buildings images with texture and real roofi ng
(LOD 2);
• rendering in nomenclature sheets sized 1*1
km in Microstation software package;
• total area 265 sq.m.;
The terrain of the underlying ground surface
was obtained on the basis of aerial laser scanning
and after classifi cation of laser refl ection points.
Buildings were produced by projection of buildings
roofs surfaces vectorized in stereoscopic mode in
PHOTOMOD onto the terrain's surface. Buildings'
facades were confi rmed by vectorization of laser
scanning data. RPC models of trees were plotted
and automatically scaled in cloud shape according
to laser scanning points class "trees". Dimensions
of vector trees correspond to dimensions of the
real trees. Following this, the model's texture was
processed in automatic mode based on aerial photo
survey data. (Fig. 2). In addition, the 3D model
was used to plot "true" orthophotomaps on its
basis (TrueOrtho), where foundations and elevated
elements of objects are displaced to their true
position, without buildings tilt or omitted zones.
30
Fig. 1
October 26-29, 2015, Yucatan, Mexico
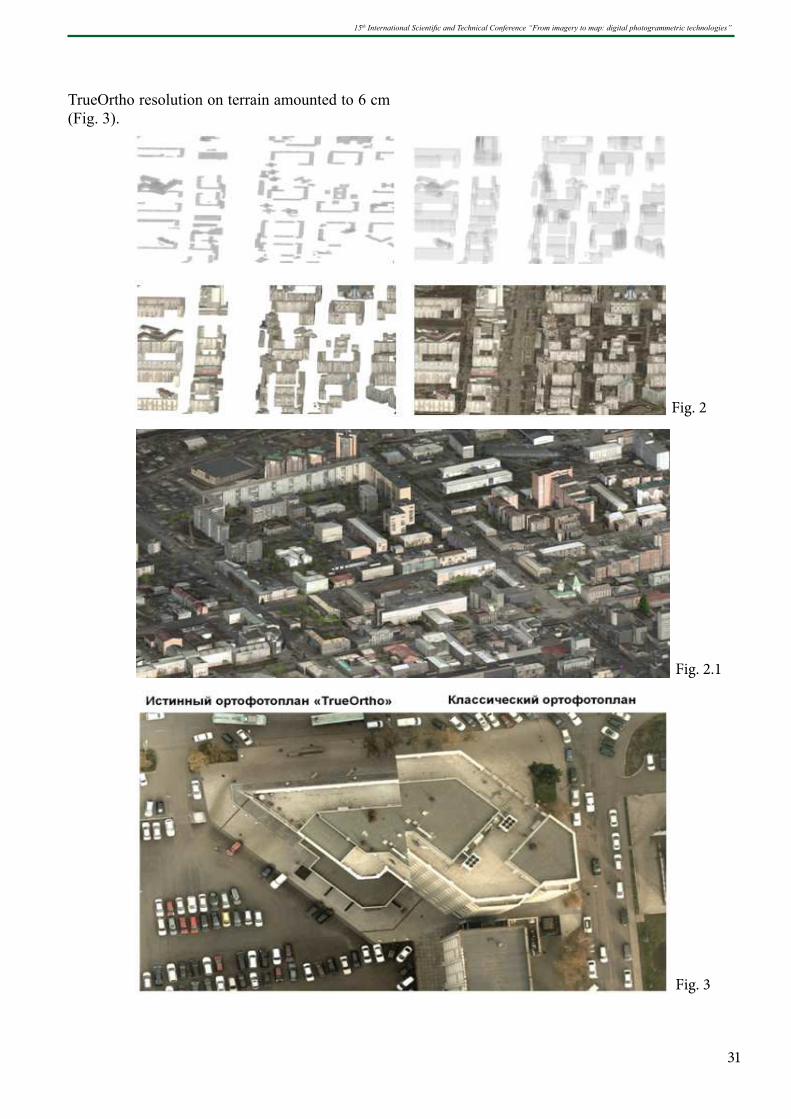
15th International Scientifi c and Technical Conference “From imagery to map: digital photogrammetric technologies”
TrueOrtho resolution on terrain amounted to 6 cm
(Fig. 3).
Fig. 2
Fig. 2.1
Fig. 3
31


15th International Scientifi c and Technical Conference “From imagery to map: digital photogrammetric technologies”
33
Real World Information Addressing Global ChallengesIlya Yudin
DigitalGlobe, USA
We live in an age of unprecedented challenges
to our world and opportunities to safeguard it.
Our growing needs for food, water, and energy
are driving a rapidly changing global dynamic
upon which natural diversity, human health, and
prosperity depends. When it comes to improving
lives around the world, DigitalGlobe provides
you with a unique opportunity to address the key
global challenges of our time. This presentation
will showcase the latest in base layer information,
rapid three dimensional visualization, the highest
quality satellite imagery at 30cm and the potential
application for SWIR.


October 26-29, 2015, Yucatan, Mexico
Real World Information Addressing Global ChallengesIlya Yudin
DigitalGlobe, USA
We live in an age of unprecedented challenges
to our world and opportunities to safeguard it.
Our growing needs for food, water, and energy
are driving a rapidly changing global dynamic
upon which natural diversity, human health, and
prosperity depends. When it comes to improving
lives around the world, DigitalGlobe provides
you with a unique opportunity to address the key
global challenges of our time. This presentation
will showcase the latest in base layer information,
rapid three dimensional visualization, the highest
quality satellite imagery at 30cm and the potential
application for SWIR.
Mozgovaya E.; Freire T.; Iankov K., “ESCANEO LIDAR Y FOTOGRAMÉTRICO CON CÁMARA DIGITAL DE BARRIDO, UN AVANCE TECNOLÓGICO EN LA AEROTOPOGRAFÍA”
ESCANEO LIDAR Y FOTOGRAMÉTRICO CON CÁMARA DIGITAL DE
BARRIDO, UN AVANCE TECNOLÓGICO EN LA AEROTOPOGRAFÍA
SCANNING LIDAR AND PHOTOGRAMMETRYC WITH IMAGE PUSHBROOM SENSOR,
AS TECHNOLOGICAL ADVANCE IN AEROTOPOGRAPHY
Elena Mozgovaya - [email protected] Tamara Freire Cuesta - [email protected], Krassimir Iankov - [email protected]
Sistemas Avanzados y Proyectos S.A. de C.V. Ciudad de México - México
RESUMEN
La demanda de datos topográficos exactos crece cada vez más, ya que el diseño de proyectos
de ingeniería como los viales, líneas de transmisión, cálculos volumétricos y detección de cambios, etc.
requieren que estos sean de alta fiabilidad y calidad. Por otro lado, no se cuenta con el tiempo y
presupuesto suficientes para ejecutar un levantamiento topográfico tradicional con la cantidad de
información suficiente que permita detectar todos los detalles del terreno y de los objetos sobre este.
La tecnología LiDAR y los levantamientos fotogramétricos aéreos permiten la adquisición de datos
topográficos y la creación de mapas y modelos de terreno más rápidamente.
El LiDAR aerotransportado se compara favorablemente con varias tecnologías, ante todo
debido a su exactitud, cualidad de sensor activo y capacidad de penetrar el dosel forestal; brindando
tres características esenciales a los levantamientos topográficos: exactitud, rapidez y detalle (cantidad
de información). La exactitud que provee el levantamiento LiDAR puede llegar a menos de 10 cm.
Este artículo se enfoca en la innovación tecnológica del escaneo simultáneo con LiDAR,
cámara fotogramétrica digital de barrido (push-broom camera) y sistema GPS/IMU, formando un
sistema integrado eficiente que permite obtener datos de alta calidad con el mismo ancho y largo de
franja del escaneo. Lo anterior evita la multiplicidad de fotografías que tomaría una cámara digital
convencional por cada franja de LiDAR, lo que obliga a disponer de gran cantidad de puntos de
control tomados en campo para el proceso de aerotriangulación, implicando tiempo y costos
adicionales. Con este sistema, se obtienen además otro tipo de productos como estéreopares sintéticos
creados a partir de los datos LiDAR y ortofotos, logrando con ello un alto grado de precisión para el
proceso de restitución fotogramétrica.
La empresa Sistemas Avanzados y Proyectos se implemento esta tecnología de punta para los
proyectos de alta precisión e importancia para el país desde el año 2012, realizando primer proyecto
relevante con esta tecnología en los meses agosto – diciembre del 2012 para la empresa DCR
Consultoría Y Construcción S.A. de C.V. denominado “Levantamiento Topográfico Mediante Láser
Aerotransportado (LIDAR) e imagen aérea para obtener la cartografía básica de 636.72 Km lineales
de las carreteras: Magdalena-Nogales, Cananea-Imuris, Altar-Caborca, Caborca-Sonoyta, Sonoyta-
San Luis Rio Colorado Y Sonoyta-Puerto Peñasco, en el estado de Sonora”
Palabras Clave: Aerotopografía, LiDAR, cámara digital de barrido, GPS/IMU, modelo digital de
superficie, imágenes estéreo sintéticas, restitución fotogramétrica, precisión topográfica.
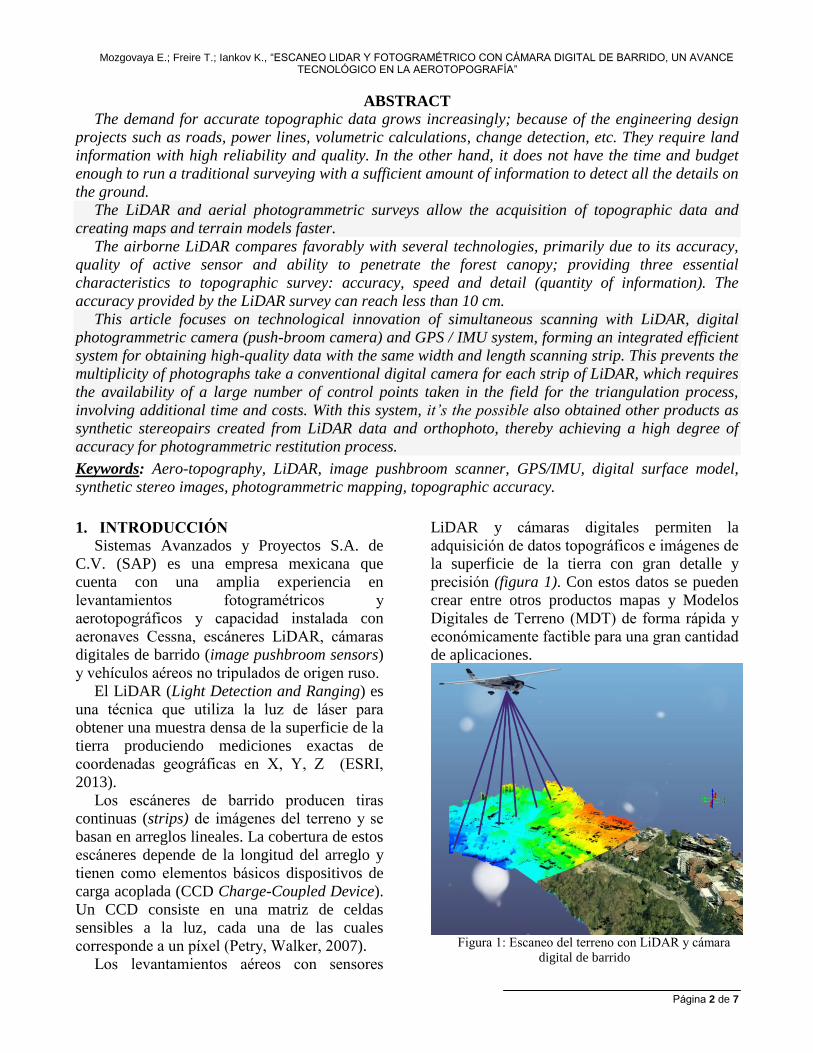
Mozgovaya E.; Freire T.; Iankov K., “ESCANEO LIDAR Y FOTOGRAMÉTRICO CON CÁMARA DIGITAL DE BARRIDO, UN AVANCE TECNOLÓGICO EN LA AEROTOPOGRAFÍA”
Página 2 de 7
ABSTRACT
The demand for accurate topographic data grows increasingly; because of the engineering design
projects such as roads, power lines, volumetric calculations, change detection, etc. They require land
information with high reliability and quality. In the other hand, it does not have the time and budget
enough to run a traditional surveying with a sufficient amount of information to detect all the details on
the ground.
The LiDAR and aerial photogrammetric surveys allow the acquisition of topographic data and
creating maps and terrain models faster.
The airborne LiDAR compares favorably with several technologies, primarily due to its accuracy,
quality of active sensor and ability to penetrate the forest canopy; providing three essential
characteristics to topographic survey: accuracy, speed and detail (quantity of information). The
accuracy provided by the LiDAR survey can reach less than 10 cm.
This article focuses on technological innovation of simultaneous scanning with LiDAR, digital
photogrammetric camera (push-broom camera) and GPS / IMU system, forming an integrated efficient
system for obtaining high-quality data with the same width and length scanning strip. This prevents the
multiplicity of photographs take a conventional digital camera for each strip of LiDAR, which requires
the availability of a large number of control points taken in the field for the triangulation process,
involving additional time and costs. With this system, it’s the possible also obtained other products as
synthetic stereopairs created from LiDAR data and orthophoto, thereby achieving a high degree of
accuracy for photogrammetric restitution process.
Keywords: Aero-topography, LiDAR, image pushbroom scanner, GPS/IMU, digital surface model,
synthetic stereo images, photogrammetric mapping, topographic accuracy.
1. INTRODUCCIÓN
Sistemas Avanzados y Proyectos S.A. de
C.V. (SAP) es una empresa mexicana que
cuenta con una amplia experiencia en
levantamientos fotogramétricos y
aerotopográficos y capacidad instalada con
aeronaves Cessna, escáneres LiDAR, cámaras
digitales de barrido (image pushbroom sensors)
y vehículos aéreos no tripulados de origen ruso.
El LiDAR (Light Detection and Ranging) es
una técnica que utiliza la luz de láser para
obtener una muestra densa de la superficie de la
tierra produciendo mediciones exactas de
coordenadas geográficas en X, Y, Z (ESRI,
2013).
Los escáneres de barrido producen tiras
continuas (strips) de imágenes del terreno y se
basan en arreglos lineales. La cobertura de estos
escáneres depende de la longitud del arreglo y
tienen como elementos básicos dispositivos de
carga acoplada (CCD Charge-Coupled Device).
Un CCD consiste en una matriz de celdas
sensibles a la luz, cada una de las cuales
corresponde a un píxel (Petry, Walker, 2007).
Los levantamientos aéreos con sensores
LiDAR y cámaras digitales permiten la
adquisición de datos topográficos e imágenes de
la superficie de la tierra con gran detalle y
precisión (figura 1). Con estos datos se pueden
crear entre otros productos mapas y Modelos
Digitales de Terreno (MDT) de forma rápida y
económicamente factible para una gran cantidad
de aplicaciones.
Figura 1: Escaneo del terreno con LiDAR y cámara
digital de barrido

Mozgovaya E.; Freire T., Iankov K., “ESCANEO LIDAR Y FOTOGRAMÉTRICO CON CÁMARA DIGITAL DE BARRIDO, UN AVANCE TECNOLÓGICO EN LA AEROTOPOGRAFÍA”
Página 3 de 7
El objetivo de este documento es dar a
conocer un innovador sistema integrado por un
escáner LiDAR y un sensor aéreo de barrido
para la obtención simultánea de líneas de vuelo
(strips) de nubes de puntos e imágenes digitales
a color con ancho de franja y longitud similares
(figura 2), permitiendo una toma eficiente de
los datos con el consiguiente ahorro de tiempo y
recursos, ya que no se necesitan realizar dos
tipos de vuelo para captar los datos
provenientes de estos sensores. Por otro lado
con una imagen de barrido el número de puntos
de control para el proceso de aerotriangulación
(alineación), se reduce considerablemente (en
un 90% aproximadamente), ya que se necesitan
puntos solamente para la alineación entre strips
y no para un ajuste transversal (figura 3).
Figura 2: Productos obtenidos con el sistema LiDAR,
cámara fotogramétrica de barrido y GPS / IMU
Figura 3: Puntos de control para aerotriangulación
(fotografías de cámara) y alineación (imágenes de barrido)
Durante el período que se ha trabajado con
este sistema ha dado excelentes resultados en
cuanto a reducción de tiempo y costos con un
valor agregado importante como la obtención
de productos finales de alta calidad y precisión,
pues la precisión de los datos LiDAR ha llegado
inclusive a menos de 10 cm, lo que también
beneficia el proceso de restitución
fotogramétrica, ya que éste se realiza en un
ambiente tridimensional, utilizando un
estéreopar sintético que se crea a partir de la
nube de puntos LiDAR.
2. SISTEMA INTEGRADO PARA
ESCANEO SIMULTÁNEO DE LIDAR
E SENSOR DE IMÁGENES DE
BARRIDO
Para la integración del sistema se
consideraron los siguientes equipos:
Cámara digital de barrido (sistema
pushbroom) de mediano formato del
fabricante Geosystem™, modelo 1-DAS-1,
que consta de una matriz lineal fija de
muchos sensores que se barre a través de un
área por el movimiento de la plataforma, de
tal modo construyendo una imagen. Se basa
en sensores cuya respuesta y lectura es casi
instantáneo (CCD), de modo que la franja
de imagen puede segmentarse en píxeles.
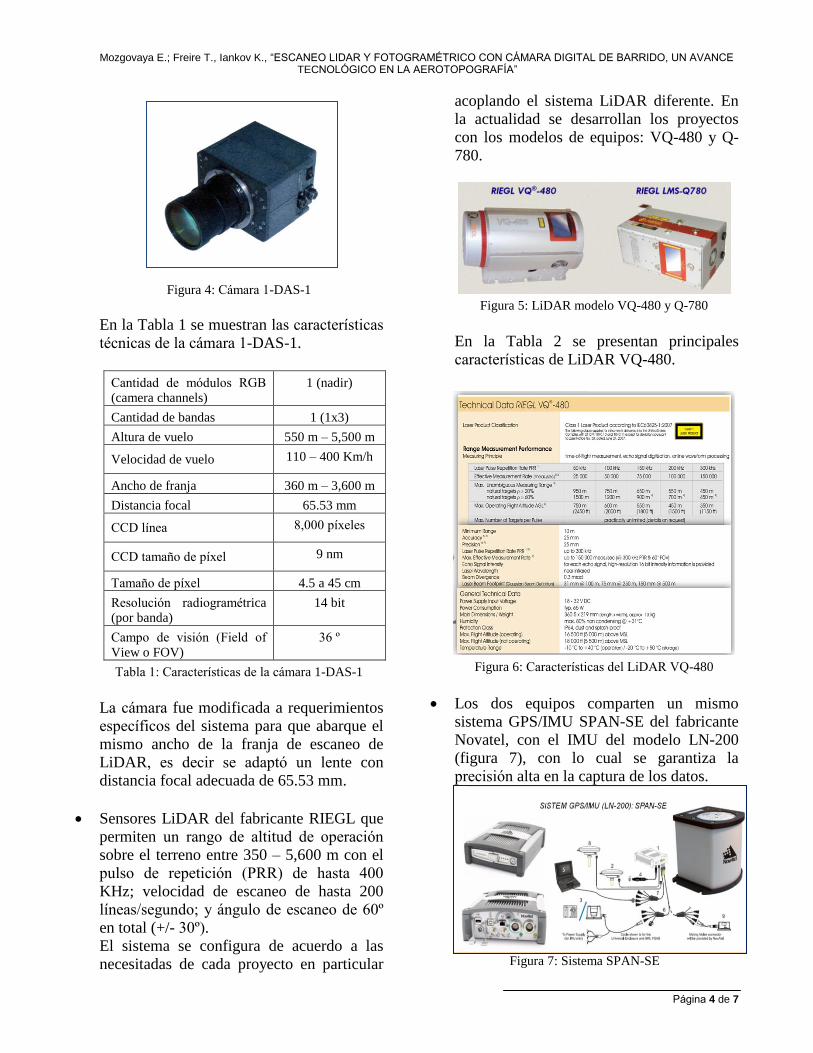
Mozgovaya E.; Freire T., Iankov K., “ESCANEO LIDAR Y FOTOGRAMÉTRICO CON CÁMARA DIGITAL DE BARRIDO, UN AVANCE TECNOLÓGICO EN LA AEROTOPOGRAFÍA”
Página 4 de 7
Figura 4: Cámara 1-DAS-1
En la Tabla 1 se muestran las características
técnicas de la cámara 1-DAS-1.
Cantidad de módulos RGB (camera channels)
1 (nadir)
Cantidad de bandas 1 (1x3)
Altura de vuelo 550 m – 5,500 m
Velocidad de vuelo 110 – 400 Km/h
Ancho de franja 360 m – 3,600 m
Distancia focal 65.53 mm
CCD línea 8,000 píxeles
CCD tamaño de píxel 9 nm
Tamaño de píxel 4.5 a 45 cm
Resolución radiogramétrica (por banda)
14 bit
Campo de visión (Field of View o FOV)
36 º
Tabla 1: Características de la cámara 1-DAS-1
La cámara fue modificada a requerimientos
específicos del sistema para que abarque el
mismo ancho de la franja de escaneo de
LiDAR, es decir se adaptó un lente con
distancia focal adecuada de 65.53 mm.
Sensores LiDAR del fabricante RIEGL que
permiten un rango de altitud de operación
sobre el terreno entre 350 – 5,600 m con el
pulso de repetición (PRR) de hasta 400
KHz; velocidad de escaneo de hasta 200
líneas/segundo; y ángulo de escaneo de 60º
en total (+/- 30º).
El sistema se configura de acuerdo a las
necesitadas de cada proyecto en particular
acoplando el sistema LiDAR diferente. En
la actualidad se desarrollan los proyectos
con los modelos de equipos: VQ-480 y Q-
780.
Figura 5: LiDAR modelo VQ-480 y Q-780
En la Tabla 2 se presentan principales
características de LiDAR VQ-480.
Figura 6: Características del LiDAR VQ-480
Los dos equipos comparten un mismo
sistema GPS/IMU SPAN-SE del fabricante
Novatel, con el IMU del modelo LN-200
(figura 7), con lo cual se garantiza la
precisión alta en la captura de los datos.
Figura 7: Sistema SPAN-SE
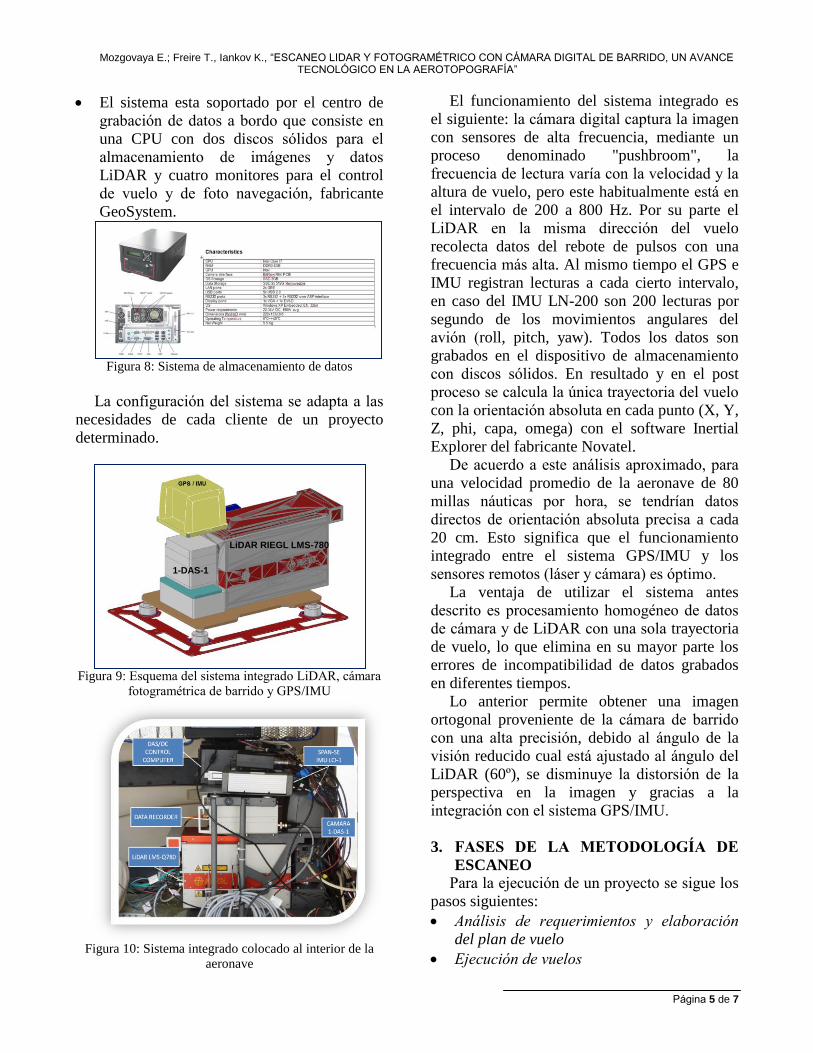
Mozgovaya E.; Freire T., Iankov K., “ESCANEO LIDAR Y FOTOGRAMÉTRICO CON CÁMARA DIGITAL DE BARRIDO, UN AVANCE TECNOLÓGICO EN LA AEROTOPOGRAFÍA”
Página 5 de 7
El sistema esta soportado por el centro de
grabación de datos a bordo que consiste en
una CPU con dos discos sólidos para el
almacenamiento de imágenes y datos
LiDAR y cuatro monitores para el control
de vuelo y de foto navegación, fabricante
GeoSystem.
Figura 8: Sistema de almacenamiento de datos
La configuración del sistema se adapta a las
necesidades de cada cliente de un proyecto
determinado.
Figura 9: Esquema del sistema integrado LiDAR, cámara fotogramétrica de barrido y GPS/IMU
Figura 10: Sistema integrado colocado al interior de la
aeronave
El funcionamiento del sistema integrado es
el siguiente: la cámara digital captura la imagen
con sensores de alta frecuencia, mediante un
proceso denominado "pushbroom", la
frecuencia de lectura varía con la velocidad y la
altura de vuelo, pero este habitualmente está en
el intervalo de 200 a 800 Hz. Por su parte el
LiDAR en la misma dirección del vuelo
recolecta datos del rebote de pulsos con una
frecuencia más alta. Al mismo tiempo el GPS e
IMU registran lecturas a cada cierto intervalo,
en caso del IMU LN-200 son 200 lecturas por
segundo de los movimientos angulares del
avión (roll, pitch, yaw). Todos los datos son
grabados en el dispositivo de almacenamiento
con discos sólidos. En resultado y en el post
proceso se calcula la única trayectoria del vuelo
con la orientación absoluta en cada punto (X, Y,
Z, phi, capa, omega) con el software Inertial
Explorer del fabricante Novatel.
De acuerdo a este análisis aproximado, para
una velocidad promedio de la aeronave de 80
millas náuticas por hora, se tendrían datos
directos de orientación absoluta precisa a cada
20 cm. Esto significa que el funcionamiento
integrado entre el sistema GPS/IMU y los
sensores remotos (láser y cámara) es óptimo.
La ventaja de utilizar el sistema antes
descrito es procesamiento homogéneo de datos
de cámara y de LiDAR con una sola trayectoria
de vuelo, lo que elimina en su mayor parte los
errores de incompatibilidad de datos grabados
en diferentes tiempos.
Lo anterior permite obtener una imagen
ortogonal proveniente de la cámara de barrido
con una alta precisión, debido al ángulo de la
visión reducido cual está ajustado al ángulo del
LiDAR (60º), se disminuye la distorsión de la
perspectiva en la imagen y gracias a la
integración con el sistema GPS/IMU.
3. FASES DE LA METODOLOGÍA DE
ESCANEO
Para la ejecución de un proyecto se sigue los
pasos siguientes:
Análisis de requerimientos y elaboración
del plan de vuelo
Ejecución de vuelos
1-DAS-1
LiDAR RIEGL LMS-780

Mozgovaya E.; Freire T., Iankov K., “ESCANEO LIDAR Y FOTOGRAMÉTRICO CON CÁMARA DIGITAL DE BARRIDO, UN AVANCE TECNOLÓGICO EN LA AEROTOPOGRAFÍA”
Página 6 de 7
Trabajo de campo
Cálculo de trayectorias de vuelo
Procesamiento de los datos LiDAR
Clasificación de la nube de puntos LiDAR
Procesamiento de imágenes digitales
Generación del estéreopar sintético
Restitución planimétrica
Figura 11: Flujo de trabajo para un proyecto de Líneas de
Transmisión
4. VENTAJAS
Con lo antes descrito, se puede vislumbrar la
multiplicidad de ventajas de la aplicación de la
tecnología LiDAR y de las imágenes de barrido,
y la potenciación y ahorro de recursos cuando
se utilizan en forma conjunta. A continuación
se mencionan algunas de ellas:
Configuración precisa del terreno,
facilitando la proyección de alternativas
para proyectos viales, de líneas de
transmisión, gasoductos, detección de
cambios, etc.; incluso en aquellas zonas
donde existe vegetación alta y densa.
Plazos de entrega cortos, comparado con
levantamientos topográficos terrestres,
puesto que se trata de un sistema
aerotransportado capaz de adquirir datos
sobre cientos de km2 en un solo día.
La información generada se puede utilizar
para otros fines, como por ejemplo modelar
bosques, edificios y otros elementos
antropogénicos; permitiendo identificar
inclusive zonas arqueológicas, suelos con
carsticidad y realizar cálculos de biomasa;
datos que sin duda ofrecen una importante
aportación para determinar la factibilidad
total o parcial de un proyecto.
Esta tecnología ofrece el beneficio de no
requerir acceso directo por tierra a la zona
de interés, lo que conlleva ventajas tanto de
seguridad como de reducción de costos en
zonas inaccesibles o de mucho tránsito.
Al combinar el LiDAR con fotogrametría, la
extracción de la planimetría es mucho más
fácil y exacta porque el operador de
fotogrametría sigue los elementos visibles y
puede compilar con gran exactitud las líneas
de ruptura donde existen cambios
topográficos abruptos.
5. DESVENTAJAS
La tecnología LiDAR, por sí sola, es costosa
para proyectos con extensiones de terreno muy
pequeñas.
Para aplicaciones con requerimientos de
precisión milimétrica es preferible un
levantamiento terrestre, sobre todo en terrenos
con pendientes abruptas.
6. CONCLUSIONES
La tecnología del sensor LiDAR combinada
con cámara digital de barrido, asegura obtener
productos adicionales para complementar el
levantamiento aerotopográfico de grandes
extensiones de terreno, reduciendo costos y
tiempo de ejecución. Por otro lado, la
fotogrametría se beneficia de la precisión de los
datos LiDAR, permitiendo generar productos
fotogramétricos de altísima calidad y precisión
centimétrica (en algunos casos menores a 10
cm.)
El levantamiento de la topografía del terreno
con LiDAR e imágenes de barrido, de manera
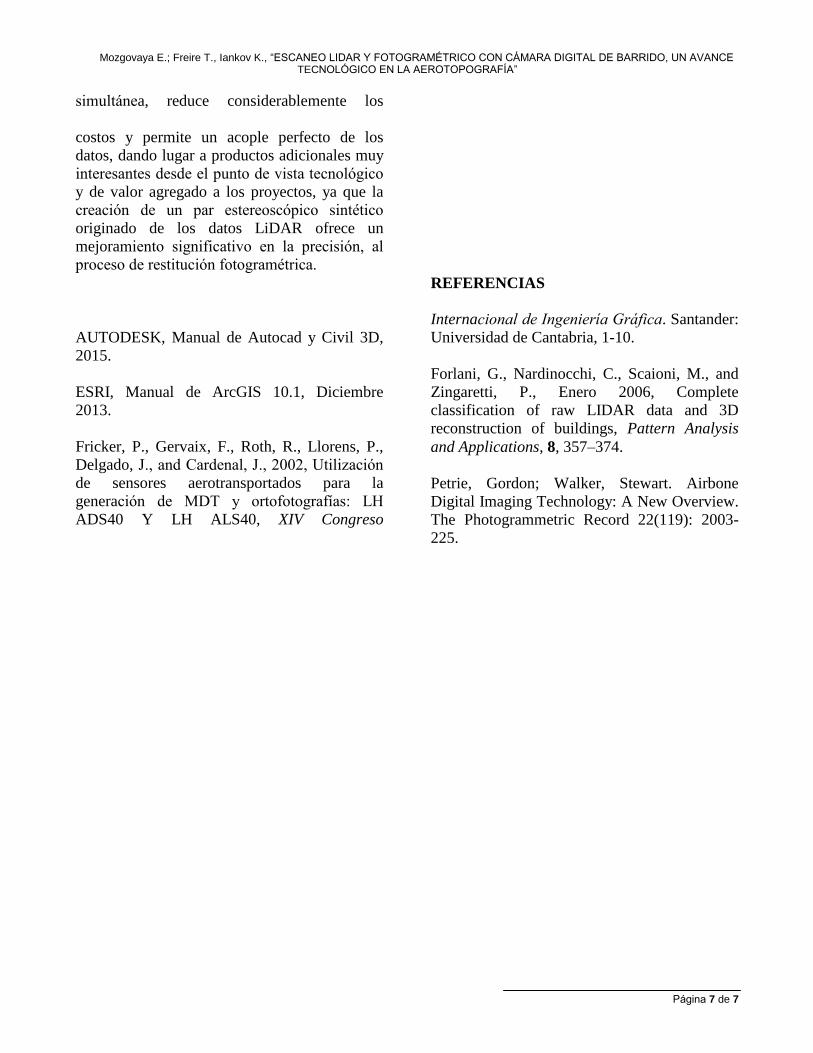
Mozgovaya E.; Freire T., Iankov K., “ESCANEO LIDAR Y FOTOGRAMÉTRICO CON CÁMARA DIGITAL DE BARRIDO, UN AVANCE TECNOLÓGICO EN LA AEROTOPOGRAFÍA”
Página 7 de 7
simultánea, reduce considerablemente los
costos y permite un acople perfecto de los
datos, dando lugar a productos adicionales muy
interesantes desde el punto de vista tecnológico
y de valor agregado a los proyectos, ya que la
creación de un par estereoscópico sintético
originado de los datos LiDAR ofrece un
mejoramiento significativo en la precisión, al
proceso de restitución fotogramétrica.
REFERENCIAS
AUTODESK, Manual de Autocad y Civil 3D,
2015.
ESRI, Manual de ArcGIS 10.1, Diciembre
2013.
Fricker, P., Gervaix, F., Roth, R., Llorens, P.,
Delgado, J., and Cardenal, J., 2002, Utilización
de sensores aerotransportados para la
generación de MDT y ortofotografías: LH
ADS40 Y LH ALS40, XIV Congreso
Internacional de Ingeniería Gráfica. Santander:
Universidad de Cantabria, 1-10.
Forlani, G., Nardinocchi, C., Scaioni, M., and
Zingaretti, P., Enero 2006, Complete
classification of raw LIDAR data and 3D
reconstruction of buildings, Pattern Analysis
and Applications, 8, 357–374.
Petrie, Gordon; Walker, Stewart. Airbone
Digital Imaging Technology: A New Overview.
The Photogrammetric Record 22(119): 2003-
225.