Engineering the collected field for single- molecule ...ldavis.utsi.edu/PDFs/Engineering the...
14
Engineering the collected field for single- molecule orientation determination Zbigniew Sikorski * and Lloyd M. Davis Center for Laser Applications, University of Tennessee Space Institute, Tullahoma, TN 37388 * Corresponding author: [email protected] http://www.utsi.edu Abstract: We theoretically investigate the use of spatial light modulators (SLMs) for transformation of the collected fluorescence field in a high numerical aperture confocal microscope, for improved molecular orientation determination in single-molecule spectroscopy. The electric vector field in the back aperture of the microscope objective is calculated using the Weyl representation and taking into account components emitted at angles above the critical angle of the coverglass-immersion fluid interface. The coherently imaged fluorescence undergoes spatially-dependent phase and polarization transformation by the SLMs, before it passes to a polarization beamsplitter, and is subsequently focused onto two pinholes and single- photon detectors. ©2008 Optical Society of America OCIS codes: (999.9999) Spectroscopy, single-molecule; (170.6280) Spectroscopy, fluorescence and luminescence; (170.1790) Confocal microscopy; (320.7150) Ultrafast spectroscopy; (170.3880) Medical and biological imaging; (230.6120) Spatial light modulators; (260.1960) Diffraction theory; (260.5430) Polarization. References and links 1. D. Axelrod, “Total Internal Reflection Fluorescence Microscopy,” in Methods in Cell Biology (Academic Press, Vol. 30., 1989), Chap. 9. 2. D. Axelrod and E. D. Hellen, “Emission of Fluorescence at an Interface,” in Methods in Cell Biology (Academic Press, Vol. 30., 1989), Chap. 15. 3. B. Richards and E. Wolf, “Electromagnetic diffraction in optical systems. II. Structure of the image field in an aplanatic system,” Proc. Roy. Soc. A. 253, 358-379 (1959). 4. K. S. Youngworth and T. G. Brown, “Focusing of high numerical aperture cylindrical-vector beams,” Opt. Express 7, 77-87 (2000), http://www.opticsinfobase.org/abstract.cfm?URI=oe-7-2-77 . 5. S. Quabis, R. Dorn, M. Eberler, O. Glockl, and G. Leuchs, “Focusing light to a tighter spot,” Opt. Commun. 179, 1-7 (2000). 6. M. Stalder, and M. Schadt, “Linearly polarized light with axial symmetry generated by liquid-crystal polarization converters,” Opt. Lett. 21, 1948-1950 (1996). 7. M. Hashimoto, K. Yamada, and T. Araki, “Proposition of single molecular orientation determination using polarization controlled beam by liquid crystal spatial light modulators,” Opt. Rev. 12, 37-41 (2005). 8. A. P. Bartko and R. M. Dickson, “Imaging Three-Dimensional Single Molecule Orientations,” J. Phys. Chem. B , 103, 11237-11241 (1999). 9. M. Bohmer and J. Enderlein, “Orientation imaging of single molecules by wide-field epifluorescence microscopy,”J. Opt. Soc. Am. B 20, 554-559 (2003). 10. M. A. Lieb, J. M. Zavislan, and L. Novotny, “Single-molecule orientations determined by direct emission pattern imaging,” J. Opt. Soc. Am. B 21, 1210-1215 (2004). 11. J. Enderlein, T. Ruckstuhl, and S. Seeger, “Highly efficient optical detection of surface-generated fluorescence,” Appl. Opt. 38, 724-732 (1999). 12. E. Hecht, Optics (Addison-Wesley, Reading, MA, 1990). 13. M. Leutenegger, R. Rao, R. A. Leitgeb, and T. Lasser, “Fast focus field calculations,” Opt. Express 14, 11277-11291 (2006), http://www.opticsinfobase.org/abstract.cfm?URI=oe-14-23-11277 .
Transcript of Engineering the collected field for single- molecule ...ldavis.utsi.edu/PDFs/Engineering the...

Engineering the collected field for single-molecule orientation determination
Zbigniew Sikorski* and Lloyd M. Davis
Center for Laser Applications, University of Tennessee Space Institute, Tullahoma, TN 37388 *Corresponding author: [email protected]
http://www.utsi.edu
Abstract: We theoretically investigate the use of spatial light modulators (SLMs) for transformation of the collected fluorescence field in a high numerical aperture confocal microscope, for improved molecular orientation determination in single-molecule spectroscopy. The electric vector field in the back aperture of the microscope objective is calculated using the Weyl representation and taking into account components emitted at angles above the critical angle of the coverglass-immersion fluid interface. The coherently imaged fluorescence undergoes spatially-dependent phase and polarization transformation by the SLMs, before it passes to a polarization beamsplitter, and is subsequently focused onto two pinholes and single-photon detectors.
©2008 Optical Society of America
OCIS codes: (999.9999) Spectroscopy, single-molecule; (170.6280) Spectroscopy, fluorescence and luminescence; (170.1790) Confocal microscopy; (320.7150) Ultrafast spectroscopy; (170.3880) Medical and biological imaging; (230.6120) Spatial light modulators; (260.1960) Diffraction theory; (260.5430) Polarization.
References and links
1. D. Axelrod, “Total Internal Reflection Fluorescence Microscopy,” in Methods in Cell Biology (Academic Press, Vol. 30., 1989), Chap. 9.
2. D. Axelrod and E. D. Hellen, “Emission of Fluorescence at an Interface,” in Methods in Cell Biology (Academic Press, Vol. 30., 1989), Chap. 15.
3. B. Richards and E. Wolf, “Electromagnetic diffraction in optical systems. II. Structure of the image field in an aplanatic system,” Proc. Roy. Soc. A. 253, 358-379 (1959).
4. K. S. Youngworth and T. G. Brown, “Focusing of high numerical aperture cylindrical-vector beams,” Opt. Express 7, 77-87 (2000), http://www.opticsinfobase.org/abstract.cfm?URI=oe-7-2-77.
5. S. Quabis, R. Dorn, M. Eberler, O. Glockl, and G. Leuchs, “Focusing light to a tighter spot,” Opt. Commun. 179, 1-7 (2000).
6. M. Stalder, and M. Schadt, “Linearly polarized light with axial symmetry generated by liquid-crystal polarization converters,” Opt. Lett. 21, 1948-1950 (1996).
7. M. Hashimoto, K. Yamada, and T. Araki, “Proposition of single molecular orientation determination using polarization controlled beam by liquid crystal spatial light modulators,” Opt. Rev. 12, 37-41 (2005).
8. A. P. Bartko and R. M. Dickson, “Imaging Three-Dimensional Single Molecule Orientations,” J. Phys. Chem. B , 103, 11237-11241 (1999).
9. M. Bohmer and J. Enderlein, “Orientation imaging of single molecules by wide-field epifluorescence microscopy,”J. Opt. Soc. Am. B 20, 554-559 (2003).
10. M. A. Lieb, J. M. Zavislan, and L. Novotny, “Single-molecule orientations determined by direct emission pattern imaging,” J. Opt. Soc. Am. B 21, 1210-1215 (2004).
11. J. Enderlein, T. Ruckstuhl, and S. Seeger, “Highly efficient optical detection of surface-generated fluorescence,” Appl. Opt. 38, 724-732 (1999).
12. E. Hecht, Optics (Addison-Wesley, Reading, MA, 1990). 13. M. Leutenegger, R. Rao, R. A. Leitgeb, and T. Lasser, “Fast focus field calculations,” Opt. Express 14,
11277-11291 (2006), http://www.opticsinfobase.org/abstract.cfm?URI=oe-14-23-11277.

1. Introduction
The study of fluorescent molecules near surfaces by optical methods has a long history [1, 2]. Past research has concerned both the efficient optical excitation of the molecule and its anisotropic fluorescence emission. Also, formulas governing the transformation of a polarized beam of light on imaging through an aplanatic optical system have been presented in a seminal paper [3]. In more recent work, radially and azimuthally polarized beams with high-numerical aperture (NA) optical systems have been studied and used to achieve superresolution and to manipulate the polarization of the focused optical field [4, 5]. The application of liquid crystal spatial light modulators to adjust the spatial profile of the polarization of the incident laser field and thereby to control the direction of the electric field at the focus was proposed [6], and simulations of the intensity pattern at the microscope image plane that results from a single-molecule dipole at given orientations excited by such polarization-engineered beams have been presented [7]. Defocused imaging in a wide-field optical microscope was used to infer single-molecule orientations without polarization optics [8] and wave-optical modeling of the imaging was presented [9]. Also, the dipole-emission intensity-pattern in the back aperture of the objective has been used for determination of the molecule emission-dipole orientation by fitting the observed image of the intensity profile with theoretical calculations [10]. Theoretical comparison of the fluorescence collection efficiency of a surface-bound molecule using a parabolic mirror and high-NA microscope objective have emphasized the importance of the so-called “forbidden light” emitted at angles above the critical angle in single-molecule detection [11].
In this work, we extend these previous studies to consider spatially-dependent phase and polarization manipulation of the collected electric field-amplitude components of a single photon that is emitted from a single-molecule dipole near an interface. Following the spatially-dependent manipulation, the field-amplitude contributions are split into two beams by a polarization beamsplitter and then coherently summed by focusing each beam to a point detector. Without the manipulation, the optical field collected by a high-NA objective will contain contributions emitted in different angles that have different polarizations and phases. Thus the superposition of these contributions is in general elliptically polarized and each photon then has a statistical probability to be registered at each of the two detectors. Appropriate engineering of the collected electric field can recover an electric field with pure linear polarization from a molecular dipole of any chosen orientation so that every photon falls to the same detector. Thus polarization pupil engineering of collected fluorescence would provide improved fidelity in fluorescence polarization anisotropy measurements with high-NA optical collection.
In Section 2 we describe briefly the angular distribution and polarization of light emitted by a dipole in the vicinity of the coverglass-immersion fluid interface. The proposed optical system to manipulate the spatial profile of phase and polarization of the collected optical field is described in Section 3. A mathematical description and computational illustrations of the electric field in the exit pupil of the single-molecule microscope are presented in Section 4. The phase and polarization transformations, which may be implemented by a phase retarder and polarization rotator, are derived in Sections 5 and 6, respectively. Section 7 discusses polarization transformations due to focusing of the light onto the detectors and shows how the detected signal is calculated. In Section 8, we demonstrate that the proposed polarization engineering of the collected single-molecule emission leads to unambiguous determination of molecule orientation and maximization of the degree of polarization for the targeted dipole orientation. Section 9 summarizes the advantages of the proposed polarization engineering technique for low photon budget single-molecule spectroscopy.
2. Dipole emission near a planar interface
The optical field collected with a low numerical aperture lens from a dipole oriented laterally (perpendicular to the optical axis) is approximately linearly polarized, as shown in Fig. 1(a). However, as shown in Section 4, for a high-NA lens, the collected field varies across the pupil

of the lens and in the marginal zone it is elliptically polarized. A high-NA lens also collects longitudinal components of emission, and for a dipole at focus oriented longitudinally (along the optical axis), the collected field is radially polarized, as shown in Fig. 1(b). If the dipole is located within a fraction of a wavelength λ from a planar interface, such as a microscope cover-glass, then emission occurs preferentially into the interface at angles above the critical angle, crθ , as shown in Fig. 1(c). If collected, this so-called forbidden light is dominant and is in general elliptically polarized. Overall, the field varies in phase and polarization across the pupil of the lens, no matter what the orientation of the emitting dipole may be. However, spatial light modulators may be used to transform the phase and polarization of the field so that it becomes spatially homogeneous and linear, as described in Section 3.
Fig. 1. (a) The field collected from a laterally-oriented dipole by a low-NA lens is linearly polarized in the direction of the dipole, (b) The field collected from a longitudinally-oriented dipole by a high-NA lens is radially polarized, (c) A plot of the field amplitude versus emission direction from a lateral or longitudinal-oriented dipole close to an interface (e.g., microscope coverglass). The amplitude of the field is greatest at angles close to the critical angle.
3. Polarization engineering of collected light
An optical system for implementing the polarization and phase engineering in the back aperture of the objective is presented in Fig. 2. The phase and polarization of the collected light is to be manipulated so that for any chosen targeted dipole orientation (TDO) every photon will fall to the same detector while for any other dipole orientation (ODO) photons will fall to both of the two detectors. The emission of the dipole P, located a small distance above the coverglass COG, which is at the focal point of a high-NA objective OBJ, is collected by the objective into a collimated beam. (The axial locations of subsequent components are hence non-critical.) The beam passes to a polarizing beamsplitter PBS1, which directs the electric field components with vertical polarization (parallel to the η-axis) into one arm (η-arm) of an interferometer and with horizontal polarization (parallel to the ξ-axis) into the other arm (ξ-arm). For the TDO, a spatial light modulator (SLM) that acts as a spatially-dependent phase retarder RET adjusts the phase of the optical field components in the η-arm with respect to those in the ξ-arm, so that when the two beams are combined at the polarizing beam combiner PBC the resulting field is linearly polarized throughout the cross section of the beam. Generally, for any ODO, the beam in the marginal zone of the exit pupil will remain elliptically polarized. The beam then passes to a second SLM that acts as a spatially-dependent polarization rotator ROT so that for the TDO the resulting beam becomes linearly polarized in the same direction throughout the cross section of the beam. Sections 5
(c)
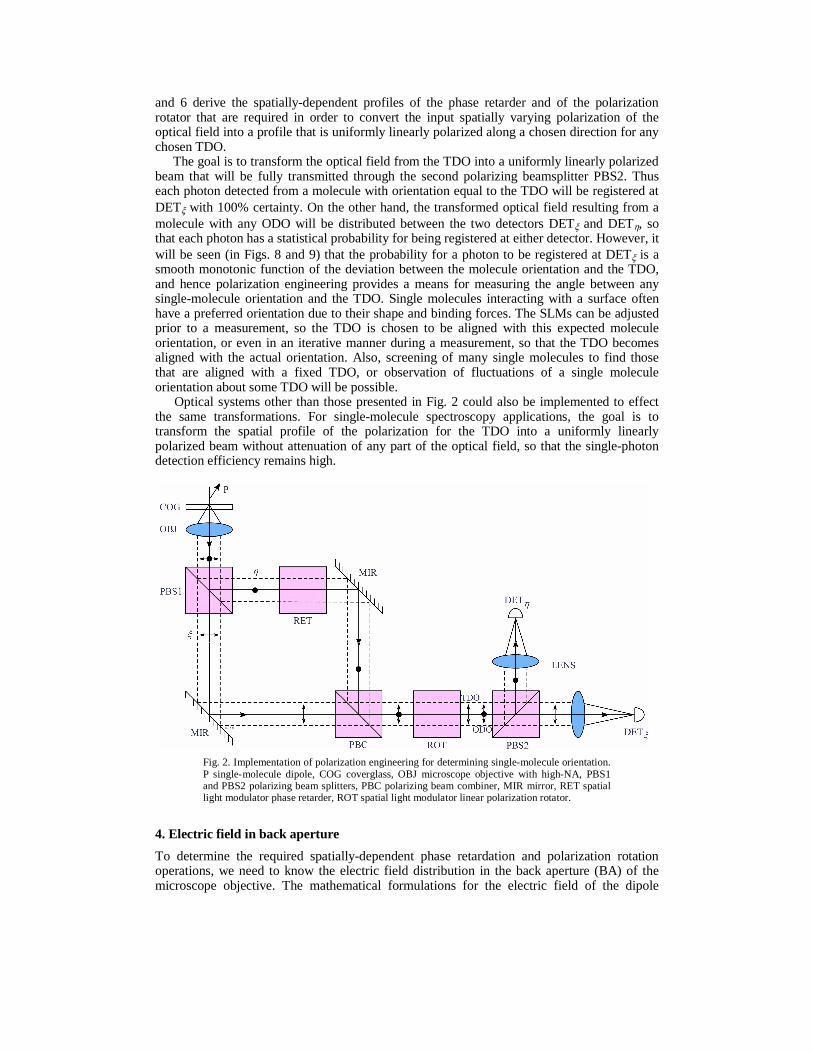
and 6 derive the spatially-dependent profiles of the phase retarder and of the polarization rotator that are required in order to convert the input spatially varying polarization of the optical field into a profile that is uniformly linearly polarized along a chosen direction for any chosen TDO.
The goal is to transform the optical field from the TDO into a uniformly linearly polarized beam that will be fully transmitted through the second polarizing beamsplitter PBS2. Thus each photon detected from a molecule with orientation equal to the TDO will be registered at DETξ with 100% certainty. On the other hand, the transformed optical field resulting from a molecule with any ODO will be distributed between the two detectors DETξ and DETη, so that each photon has a statistical probability for being registered at either detector. However, it will be seen (in Figs. 8 and 9) that the probability for a photon to be registered at DETξ is a smooth monotonic function of the deviation between the molecule orientation and the TDO, and hence polarization engineering provides a means for measuring the angle between any single-molecule orientation and the TDO. Single molecules interacting with a surface often have a preferred orientation due to their shape and binding forces. The SLMs can be adjusted prior to a measurement, so the TDO is chosen to be aligned with this expected molecule orientation, or even in an iterative manner during a measurement, so that the TDO becomes aligned with the actual orientation. Also, screening of many single molecules to find those that are aligned with a fixed TDO, or observation of fluctuations of a single molecule orientation about some TDO will be possible.
Optical systems other than those presented in Fig. 2 could also be implemented to effect the same transformations. For single-molecule spectroscopy applications, the goal is to transform the spatial profile of the polarization for the TDO into a uniformly linearly polarized beam without attenuation of any part of the optical field, so that the single-photon detection efficiency remains high.
Fig. 2. Implementation of polarization engineering for determining single-molecule orientation. P single-molecule dipole, COG coverglass, OBJ microscope objective with high-NA, PBS1 and PBS2 polarizing beam splitters, PBC polarizing beam combiner, MIR mirror, RET spatial light modulator phase retarder, ROT spatial light modulator linear polarization rotator.
4. Electric field in back aperture
To determine the required spatially-dependent phase retardation and polarization rotation operations, we need to know the electric field distribution in the back aperture (BA) of the microscope objective. The mathematical formulations for the electric field of the dipole

emission collected in the BA of an aplanatic objective are given in several papers [3, 10, 11]. Here we follow Ref. [10]. Fig. 3 introduces the notation.
The time independent part of the optical field in the BA, ( )ηξ ,E is composed of vector components along the local sp, coordinate system:
( ) sspp eEeE ˆˆ, +=ηξE . (1)
From reference [10], the complex amplitudes of the p- and s-polarized components of the field, for emission from a dipole located a small distance δ < λ above the interface, may be expressed as
Fig. 3. The coordinate system used to describe emission from a dipole P located within refractive index ni just above the coverglass (COG), with refractive index n, and oriented with polar and azimuthal angles Θ, Φ. The diagram considers the optical field that is emitted into the COG substrate along a ray in a direction with polar (with respect to –z-axis) and azimuthal angles θ, φ. The angle θi is given by Snell’s law as sin−1((n/ni)sinθ) and will be imaginary for θ greater than the critical angle θcr = sin−1(ni/n). The field is redirected by the aplanatic objective (OBJ) to a point η,ξ in the back aperture (BA) of the objective. It is comprised of components along the unit vectors êp and ês , which are parallel and perpendicular to the plane of incidence of the ray, respectively. From here, the polarization and phase of the field may be altered before it is focused by a lens (LENS) to a detector (DET).
( )( ) θφθθ coscoscossinsincos)/( Φ−Θ+Θ= ipp nncE , (2)
( ) θφ cossinsin Φ−Θ= ss cE , (3)
where
( )ip
iip t
n
nc θ
θθ Π=
cos
cos, (4)
( )i
tii
n
nc s
s θθθ Π=
cos
cos, (5)
and the phase shift due to distance from the interface is
( ) ( )δθθ iiii nki cosexp=Π , (6)

with λπ /2 ii nk = , where λ is the vacuum wavelength. The quotient of θcos at the end of Eqns. (2) and (3) accounts for the conservation of energy of the beam as it is refracted by an
aplanatic lens [3]. In Eqns. (4) and (5), pt and st are the Fresnel transmission coefficients for p- and s-polarized light [12], given by
)cos()sin(
sincos2
θθθθθθ
−+=
ii
ipt , (7)
)sin(
sincos2
θθθθ
+=
i
ist . (8)
These coefficients are complex for crθθ > . Note that emission characteristics of a dipole far
from an interface can be deduced by setting in = n in the above equations.
To express the optical field in the BA in terms of the global ξ,η coordinate system, with unit vectors ξe and ηe , the following equations are inserted into Eqn. (1):
ηξ φφ eeep ˆsinˆcosˆ += , (9)
ηξ φφ eeesˆcosˆsinˆ +−= , (10)
where
22cos ηξξφ += , 22sin ηξηφ += . (11)
Also, the angle θ in Eqns. (2) and (3) is given as
( )f/sin 221 ηξθ += − , (12)
where f is the effective focal length of the objective, and θ is limited by the numerical
aperture NA of the objective and the refractive index n to )/(sin 1max nNA−=< θθ . When
Eqns. (9 -12) are inserted into Eqns. (1), (2), and (3), the optical field in the BA plane will be expressed in terms of the global coordinates:
( ) ( ) ( ) ( ) ( )η
ηξϕηξ
ηξϕξ
ηξ ηξηξηξ eeEeeEii ˆ,ˆ,,
,, +=E , (13)
where ξE and ηE denote the magnitudes and ξϕ and ηϕ the phases of the components of
the field along the ξe and ηe unit vector directions.
The polarization of the electric field is elliptical if the phase difference ε between the η
and ξ components, in the range [0,π) , differs from 0 , where
( ) ( ) ( )[ ]πηξϕηξϕηξε ξη ,,,mod, −= . (14)
Thus for for crθθ < , the electric field polarization is linear, but with a direction that varies
with φθ , . However for crθθ > , the field is in general elliptically polarized, as the Fresnel
coefficients pt and st are complex with different phases for the incident evanescent waves. The electric field polarization is linear throughout the whole back aperture, albeit with a direction that depends on φ , only for one special case, that for which the dipole is

perpendicular to the surface ( 0=θ ). In this case, the field in the BA is radially (p-) polarized, as shown in Fig. 1(b).
A program in MATLAB was developed to compute the electric field distribution in the BA by insertion of Eqns. (2), (3), (9), and (10) into Eqn. (1). The magnitude of the field amplitude, the polarization, and the phase difference between the components of the electric field, ε given by Eqn. (14), are shown in Fig. 4 for three selected orientations of the dipole. The crucial role of the forbidden light collection is apparent in these Figs from the large magnitude of the field for angles crθθ > . All results shown are for an oil immersion objective of numerical aperture NA = 1.4 with a coverglass refractive index of n = 1.52, an emission wavelength of 532 nm, and with the molecule embedded in a medium with refractive index ni = 1.33.
-1 0 1
-1
-0.5
0
0.5
1
ξ
η
-1 0 1
-1
-0.5
0
0.5
1
ξ
η
-1 0 1
-1
-0.5
0
0.5
1
ξ
η
Fig. 4. Theoretical predictions for the field in the back aperture of the objective from a dipole with (a) longitudinal orientation, 0=Θ , (b) horizontal orientation, 090=Θ , 00=Φ : and (c) oblique orientation, 030=Θ , 045=Φ . The left column shows the electric field magnitude normalized to the peak value; the middle column shows the electric field polarization (right-handed elliptical polarization is magenta and left-handed is green); the right column shows ε , the phase difference between the η and ξ components of the electric field, modulo π.
5. Polarization engineering by phase retardation
The role of the phase retarder RET is to change the phase ( )ηξϕη , of the beam in the η
branch to make the combined beam leaving the polarizing beam combiner PBC linearly polarized for the targeted dipole orientation (TDO), which is at TT ΦΘ , . This may be accomplished by the following transformation:
(a)
(b)
(c)

( ) ( ) ( )[ ]πηξεηξϕηξϕ ηη ,,,mod, −=′ TDOTDO . (15)
The transformation retards the phase ( )ηξϕη , at the back aperture points where the electric
field ( )ηξ ,E is elliptically polarized. The phase retardation to be programmed onto the spatial
light modulator RET is given by Eqn. (14) and is in the range [0,π). The action of the phase retarder on the beams for other dipole orientations (ODO) at ΦΘ, , may be described by the following formula:
( ) ( ) ( ) ( )[ ]ηξϕηξϕηξϕηξϕ ξηηη ,,,, TDOTDOODOODO −′+=′ . (16)
The electric field leaving the PBC will read
( ) ( ) ( ) ( ) ( )η
ηξϕηξ
ηξϕξ
ηξ ηξηξηξ eeEeeEii ˆ,ˆ,,
,, ′+=′E . (17)
This electric-field polarization is linear (albeit with different directions) at all points of the back aperture for the TDO; however for any ODO it may be (and in most cases is) elliptically polarized for the back aperture points of crθθ > .
6. Polarization rotator
The polarization rotator ROT makes the polarization of the TDO electric field components collinear with the ξ axis. The beam polarized parallel to the ξ axis will be fully transmitted
through the polarizing beamsplitter PBS2 and focused on detector DETξ . Moreover, the polarization transformation by polarization rotator ROT ensures that the instantaneous electric field vectors in the whole exit pupil are directed in the same (positive) ξ direction to support a constructive coherent addition of the electric field components parallel to the detector
surface upon focusing by a low NA lens. The rotated electric field TDOE ′′ is described by the
following expression:
( ) ⎥⎦
⎤⎢⎣
⎡
′′
=⎥⎦
⎤⎢⎣
⎡
′′′′
=′′TDO
TDO
TDO
TDOTDO E
E
E
Erot
η
ξϕ
η
ξηξ RE , , (18)
where
⎥⎦
⎤⎢⎣
⎡ −=
rotrot
rotrot
rot ϕϕϕϕ
ϕ cossin
sincosR , (19)
and the angle ( )ηξϕ ,rot is given by the formula:
( )( ) ( )( )( ) ( ) 0cosand0cos
0cos
0cosand0cos
for
0
2
atan,
<′>′<′
>′>′
⎪⎩
⎪⎨
⎧
+⎟⎟
⎠
⎞
⎜⎜
⎝
⎛
′′
−=
ηξ
ξ
ηξ
ξ
η
ϕϕϕ
ϕϕππ
ηξϕTDO
TDOrot E
E. (20)
The angle rotϕ is positive for counterclockwise rotation of the vector. The necessary phase
shift to be implemented by ROT is in the [ )π2,0 range. Polarization of the electric field components emitted by ODO dipoles may not be
collinear with the ξ axis after passing the polarization rotator ROT, moreover they may be
elliptically polarized for the back aperture points corresponding to crθθ > . Their electric vector is described by the following general formula:

( ) ( ) ( ) ( ) ( )η
ηξϕηξ
ηξϕξ
ηξ ηξηξηξ eeEeeEii ˆ,ˆ,,
,, ′′′′ ′′+′′=′′E . (21)
Figure 5(a) shows that the transformed field from a dipole with orientation ΦΘ, , equal to that of a TDO (in this case with TΘ = 30º, TΦ = 45º, but with any choice of orientation possible), is linearly polarized along the ξ axis throughout the BA, so that it would pass PBS2 and fall
entirely on DETξ, whereas Figs 5(b) and 5(c) show two examples in which the same transformation yields inhomogeneous polarization profiles for ODOs, which would result in a statistical division of photons between the DETξ and DETη.
-1 0 1-1
-0.5
0
0.5
1
ξ
η
-1 0 1
-1
-0.5
0
0.5
1
ξ
η
-1 0 1
-1
-0.5
0
0.5
1
ξ
η
(a) TDO , 030=ΘT
, 045=Φ T (b) ODO , 00=Θ , 00=Φ (c) ODO, 090=Θ , 00=Φ
Fig. 5. Polarization engineered electric field in the back aperture for (a) targeted dipole orientation (TDO) and (b) and (c) other dipole orientations (right-handed elliptical polarization is magenta and left-handed is green) for the example when the TDO is 030=ΘT
, 045=Φ T.
7. Focusing of beam onto detector
In order to calculate the probability of photon detection at each detector, we evaluate the z-component of time-averaged Poynting vector from the electric and magnetic field components at each of the detectors. To this end, we first compute the polarization components of the electric field ( )ηξ ,tE transmitted through the focusing lens (LENS in Fig.
2) of each of detectors DETξ and DETη and projected onto a reference spherical surface with the vertex point in the exit pupil of lens and the sphere center at the detector. The transformed field ( )ηξ ,tE is the plane wave spectrum of the focused field at the detector, thus the focused
field can be computed from the weighted Fourier transform of the aperture field ( )ηξ ,tE [13].
To compute a change of the electric-field polarization upon transmission through the focusing lens, the incident field is decomposed into p - and s - polarization components:
( ) ( )( ) ( ) ,sin,,
,cos,,
,
,
ξηξ
ξηξ
ϕηξηξ
ϕηξηξξ
ξ
ps
DET
s
psDETp
EE
EE
′′−=
′′= (22)
( ) ( )( ) ( ) ,cos,,
,sin,,
,
,
ξηη
ξηη
ϕηξηξ
ϕηξηξη
η
ps
DET
s
psDETp
EE
EE
′′=
′′= (23)
where ( )ηξϕ ξη ,,ps is the angle between the p axis of the local sp, coordinate system and the
ξ axis of the ηξ , coordinate system. A positive angle ( )ηξϕ ξη ,,ps describes counterclockwise
rotation of the coordinate system. The s-polarization component does not change its orientation on passing through the lens; however, the vector of the p-polarization component

is rotated by tθ , as shown in Fig. 3. The ξ and η components of the electric field after passing the lens are described by the following formulas
( ) ( ) ( )( ) ( ) ( ) ,cos,cossin,,
,sin,coscos,,
,,
,,
ξηξη
ξηξη
ϕηξθϕηξηξ
ϕηξθϕηξηξξξξ
η
ξξξ
ξ
psDETstps
DETp
DET
psDETstps
DETp
DET
EEE
EEE
t
t
+=
−= (24)
( ) ( ) ( )( ) ( ) ( ) .cos,cossin,,
,sin,coscos,,
,,
,,
ξηξη
ξηξη
ϕηξθϕηξηξ
ϕηξθϕηξηξηηη
η
ηηη
ξ
psDETstps
DETp
DET
psDETstps
DETp
DET
EEE
EEE
t
t
+=
−= (25)
The electric field at a given point ( )ηξ , in the back aperture is proportional to the spatial frequency ( )ππ ηξ 2,2 tt kk −− component of the spectrum of the electric field at the detector.
The magnetic field vector ( ) ( )( )ηξηξ ηξ ,,, tt HH for each spatial frequency is calculated from the
electric field for that spatial frequency (which may be interpreted as a plane wave) and the wave impedance of the medium. The electric and magnetic fields in the detector plane are calculated using the inverse Fourier transform representation of the Debye diffraction integral [13]:
( ) ( ) ( )[ ]∫∫ +−= yxyxttt
dkdkykxkik
ifyx exp,
cos
1,
20
ηξθλ
EE , (26)
( ) ( ) ( )[ ]∫∫ +−= yxyxttt
dkdkykxkik
ifyx exp,
cos
1,
20
ηξθλ
HH , (27)
where f is the focal length, 0λ is the wavelength, xk and yk are the wave vector components.
The time averaged z-component of the Poynting vector is then evaluated using the formula
( ) ( )xyyxz HEHEyxS **Re2
1, −= . (28)
Formulas (26-28) hold for both detectors. Superscripts ξDET and ηDET were omitted to
simplify the notation.
8. Detection of molecule orientation
We define the signed degree of polarization ( SDP ) as a rational measure to infer dipole orientation ΦΘ,
( )ηξ
ηξ
PP
PPSDP
+−
=ΦΘ, , (29)
where ξP and ηP are the normalized and time averaged z-components of the Poynting vectors
integrated over the detector surface for DETξ and DETη , respectively
( ) ( )
( ) ( ) ,,|,;,1
,
,,|,;,1
,
σ
σ
η
ξ
ηη
ξξ
dyxSP
P
dyxSP
P
D
TTzn
D
TTzn
∫
∫
ΦΘΦΘ=ΦΘ
ΦΘΦΘ=ΦΘ
(30)

Here, the Poynting vector S at each detector plane is that for a dipole with orientation ΦΘ, , whose field has been engineered by SLMs set for a TDO with orientation TT ΦΘ , . Also, the
normalization factor nP is the integral over the detector DETξ surface of the time averaged z-components of the Poynting vectors computed for a dipole oriented longitudinally ( )0,0 =Φ=Θ and for no polarization engineering employed:
( ) σξ
ξ dyxSPD
zn ∫= 0,0;, . (31)
The value of nP would be the same if DETη would be chosen in the above definition due to radial symmetry of the longitudinal dipole emission.
The advantages of the presented polarization engineering technique may be demonstrated by a comparison with a simple polarization beamsplitting in the back aperture and focusing the polarized beams onto two detectors DETξ and DETη. For this benchmark technique, many and very different orientations give us the same signals on the detectors. For example, the signals ξP and ηP for the TDO of �� 45,30 =Φ=Θ TT cannot be distinguished from those of
many other angles ΦΘ, , as shown in Fig. 6. This makes it impossible to solve the inverse problem: infer the orientation of the dipole from the measurements. Figure 7 shows the SDP for the simple beamsplitting technique. We can observe that a single value of the SDP corresponds to a large range of ( )ΦΘ, values located on the magenta-colored lines (at
�45±=Φ ) in Fig. 7(b). Thus without polarization engineering, it is impossible to determine
Θ when �45±=Φ , yet in many applications, the angle of inclination Θ is particularly of interest. The signal on the detectors and the degree of polarization corresponding to the TDO are marked by a blue dot in Figs 6 to 9.
The proposed polarization engineering technique directs all photons for the TDO to the detector DETξ , as shown in Fig. 8. Thus the SDP is equal to 1 for this dipole orientation, i.e., the solution of the inverse problem is unambiguous. A small change in the dipole orientation in the vicinity of the TDO results in a small change in the SDP, as shown in Fig. 9. The SDP is a smooth monotonic function in the vicinity of the TDO, so that the polarization engineering enables a stable solution of the inverse problem, i.e., a measure of the SDP can determine the deviation of the dipole orientation ΦΘ, from that of the TDO TT ΦΘ , within a range of ΦΘ, values around the TDO. The contours around the peak in Fig. 9(a) or 9(b) give an indication of the deviation of the dipole orientation ΦΘ, from that of the TDO
TT ΦΘ , when the measured SDP is less than 1. For example, if the SDP equals 0.9, then the dipole orientation is determined to be about 25º from that of the TDO.
For single-molecule experiments with low photon counts, the precision of the SDP may be limited by shot noise, particularly if the measured SDP differs from 1. For statistically efficient analysis of such measurements, maximum-likelihood (ML) methods can be used to determine the range of possible values that the orientation ΦΘ, could be, within a given
statistical confidence. With the SLMs set for detection of a given TDO TT ΦΘ , , if the dipole
orientation is actually ΦΘ, , the probability that a photon falls to DETξ is given by
( )( ) ( ) ( )( )ηξηξξξ BBPPBPp ++ΦΘ+ΦΘ+ΦΘ=ΦΘ ,,,),( , (32)

0 45 90180
270360
030
60900
0.5
1
Φ[o]Θ [o]
0 45 90180
270360
030
60900
0.5
1
Φ[o]Θ [o]
(a) Signal ( )ΦΘ,ξP (b) Signal ( )ΦΘ,ηP
Fig. 6. Dependence of the signal detected by (a) DETξ and (b) DETη on the dipole orientation for the simple beamsplitting technique.
�45=Φ
⎥⎦⎤
⎢⎣⎡Θ �
30 90
⎟⎠⎞
⎜⎝⎛ ΦΘ,SDP
�45=Φ
⎥⎦⎤
⎢⎣⎡Θ �
30 90
⎟⎠⎞
⎜⎝⎛ ΦΘ,SDP ⎟
⎠⎞
⎜⎝⎛ ΦΘ,SDP
(a) ( )ΦΘ,SDP (b) ( )ΦΘ,SDP , contour plot
Fig. 7. Dependence of the degree of polarization on the dipole orientation for the simple beamsplitting technique.
where ξB and ηB are the probabilities for background at each detector. The above probability
is inserted into the binomial distribution to determine the probability for ηξ nn , photon counts
if the orientation were ΦΘ,
( ) ηξ
ηξ
ηξηξ
nn ppnn
nnnn )1(
!!
)!(,|,Pr −
+=ΦΘ . (33)
This function is normalized to find the probability density function that the orientation is within ΦΘΘ ddsin of ΦΘ, :
( ) ( ) ( ) ΦΘΘΦΘΦΘΘΦΘ=ΦΘΘΦΘ ∫∫ ddnnddnndd sin,|,Prsin,|,Prsin,Pdf ηξηξ . (34)
A contour plot of this probability density function gives the confidence intervals that the orientation is within a given range of values.
( )ΦΘ,ξP ( )ΦΘ,ηP

0 45 90180
270360
030
60900
0.5
1
1.5
2
Φ[o]Θ [o] 0 45 90
180270
360
030
60900
0.5
1
Φ[o]Θ [o]
(a) Signal ( )ΦΘ,ξP (b) Signal ( )ΦΘ,ηP
Fig. 8. Dependence of the signal detected by (a) DETξ and (b) DETη on the dipole orientation
for the case of TDO with orientation 030=ΘT, 045=ΦT .
�45=Φ
⎥⎦⎤
⎢⎣⎡Θ �
3090
⎟⎠
⎞⎜⎝
⎛ ΦΘ,SDP
�45=Φ
⎥⎦⎤
⎢⎣⎡Θ �
3090
⎟⎠
⎞⎜⎝
⎛ ΦΘ,SDP
(a) ( )ΦΘ,SDP (b) ( )ΦΘ,SDP , contour plot
Fig. 9. Dependence of the signed degree of polarization on the dipole orientation for the polarization engineering technique for the case of TDO with orientation
TΘ = 30º, ΦT = 45º.
The above results were computed for infinitely large detectors. The proposed polarization
engineering technique provides an additional advantage for confocal detection through a pinhole or small detectors. Uniform orientation of linear polarization in the focusing lens aperture leads to an on-axis constructive interference in the focal region of a low-NA focusing lens and a high detection efficiency. Contrary to this, a variation in orientation of the linear polarization leads to destructive on-axis interference and focusing of photons outside a small detector.
9. Conclusions
In this paper we proposed a polarization engineering technique implemented in the back aperture of a high-NA microscope to simultaneously perform single-molecule spectroscopy and unambiguous single-molecule orientation detection. The technique applies spatially-dependent phase and polarization manipulation of the collected electric field-amplitude components of a single photon that is emitted from a dipole near an interface, for example, with the use of spatial light modulators. The field-amplitude contributions in the back aperture are split into two beams by a polarization beamsplitter and the phase of one of these beams is manipulated in a spatially-dependent manner to enable conversion of the elliptical polarization
( )ΦΘ,ξP ( )ΦΘ,ηP

of the forbidden light into a field with linear polarization but spatially varying orientation. Both beams are combined, and then a spatially-dependent polarization rotation is implemented followed by a second polarizing beamsplitting operation. The obtained optical fields are coherently summed by focusing each beam to a detector.
Without the manipulation, the optical field collected by a high-NA objective will contain contributions emitted in different angles that have different polarizations and phases, so that the superposition of these contributions is in general elliptically polarized. Appropriate engineering of the collected electric field can recover an electric field with uniform linear polarization from a molecular dipole of any chosen targeted orientation. All photons emitted by a molecule with the emission dipole orientation of interest will be collected onto one of the two detectors. The polarization and phase engineering makes determination of the molecule orientation unambiguous and improves the statistical fidelity of single-molecule spectroscopy measurements. On the other hand, photons emitted by a molecule at some other dipole orientation will be statistically distributed between both detectors. However, the polarization and phase engineering enables a measure of the deviation of the molecule from the targeted orientation, as the fractions of photons that fall on each detector are smooth monotonic functions of the deviation. It is worth to mention, that the method is not based on an image recording which is difficult at low photon levels and requires image recording and processing hardware. Our further work will include implementation of the theoretically demonstrated polarization engineering using subwavelength diffractive optical elements.
Acknowledgments
This project was supported by the Center for Laser Applications at the University of Tennessee Space Institute and DARPA grant W911NF-07-1-0046.