
ENGINEERING - sam.usace.army.mil · Sweetwater Creek Feasibility Report . 1 . 1. Introduction . The...
156
Sweetwater Creek Feasibility Report SWEETWATER CREEK FEASIBILITY REPORT APPENDIX B - ENGINEERING March 2018
Transcript of ENGINEERING - sam.usace.army.mil · Sweetwater Creek Feasibility Report . 1 . 1. Introduction . The...

Sweetwater Creek Feasibility Report
SWEETWATER CREEK FEASIBILITY REPORT
APPENDIX B - ENGINEERING
March 2018

i
TABLE OF CONTENTS
1. Introduction ....................................................................................................................... 1
2. Study Area ......................................................................................................................... 1
2.1. Watershed Characteristics ........................................................................................ 2
Drainage Area Description .................................................................................. 2
Flooding History .................................................................................................. 3
Hydrology/Runoff Characteristics ...................................................................... 4
Stream Hydraulics: Conveyance and Regulation ............................................. 5
Land Use ............................................................................................................... 6
Alluvium and Soils ............................................................................................... 7
Geology and Soils ................................................................................................ 7
Groundwater ......................................................................................................... 7
3. Formulation of Alternatives ............................................................................................. 7
3.1. Problems and Opportunities ..................................................................................... 7
Problem Identification ......................................................................................... 8
Opportunities ....................................................................................................... 8
3.2. Study Goals, Objectives, and Constraints ............................................................... 8
Specific Objectives .............................................................................................. 8
Constraints ........................................................................................................... 9
3.3. General Types of Flood Risk Management Measures Considered ........................ 9
Non-Structural Measures .................................................................................. 10
Structural Measures .......................................................................................... 10
Screening of General Measures ....................................................................... 12
3.4. Description of Site Specific Measures Considered for the Final Array of Alternatives ......................................................................................................................... 13
Non-Structural (Buyouts) .................................................................................. 15
Structural ............................................................................................................ 15
Channel Modification ......................................................................................... 33
3.5. Final Array of Alternatives ....................................................................................... 36
3.6. Alternative Comparison ........................................................................................... 37
3.7. Recommended Plan ................................................................................................. 37
3.8. Climate Change ........................................................................................................ 37

Sweetwater Creek Feasibility Report
ii
Introduction ........................................................................................................ 37
Literature Review ............................................................................................... 37
Stationarity Assessment ................................................................................... 38
Climate Hydrology Assessment Tool ............................................................... 41
3.9. HTRW Analysis ......................................................................................................... 42
4. Hydrologic and Hydraulic Modeling .............................................................................. 42
4.1. Terrain and Geometric Data..................................................................................... 42
Digital Terrain Development ............................................................................. 42
Field Reconnaissance and Survey Data .......................................................... 43
4.2. Rainfall Data and Reconstruction ........................................................................... 43
Historical Events ................................................................................................ 44
Design Rainfall ................................................................................................... 47
4.3. Hydrologic Model ..................................................................................................... 48
Basin Delineation ............................................................................................... 48
Rainfall Losses ................................................................................................... 49
Sub-basin Response ......................................................................................... 52
Reach Routing .................................................................................................... 53
Gage analysis ..................................................................................................... 53
HMS Calibration ................................................................................................. 54
Design Storm Events ......................................................................................... 57
4.4. Hydraulic Modeling Approach ................................................................................. 59
Boundary Conditions and Tie-ins ..................................................................... 60
Cross Sections ................................................................................................... 60
Structures ........................................................................................................... 61
Ineffective Flow Areas ....................................................................................... 62
Channel Roughness Values .............................................................................. 62
HEC-RAS Results and Calibration .................................................................... 63
4.5. Future Without-Project Conditions ......................................................................... 68
5. Cost Estimates ................................................................................................................ 70
6. Summary and Conclusions ............................................................................................ 71
APPENDIX B1: WATER SURFACE PROFILES .................................................................... 73
APPENDIX B2: ALTERNATIVE SCHEMATICS ................................................................... 145

Sweetwater Creek Feasibility Report
iii
APPENDIX B3: SUMMARY OF PROPOSED STRUCTURAL MEASURES ........................ 149
7. References ..................................................................................................................... 150
LIST OF FIGURES
Figure 1: Study Area .................................................................................................................. 1 Figure 2: Sweetwater Creek Basin Map .................................................................................... 2 Figure 3: 2009 Sweetwater Creek flooding at Veterans Memorial Highway .............................. 3 Figure 4: Annual Peaks for USGS 02337000 ............................................................................ 4 Figure 5: Typical Sweetwater Creek Hydrograph ...................................................................... 5 Figure 6: Sweetwater Creek Watershed NLCD Overview ........................................................ 6 Figure 7: Possible Retention Sites ........................................................................................... 11 Figure 8: Channel Modification and Diversion Measures......................................................... 12 Figure 9. Map of Measures ...................................................................................................... 14 Figure 10. Wall Angle Refinement ........................................................................................... 16 Figure 11: Approximate Location of SC1 ................................................................................. 18 Figure 12: Example of Slot Dam Configuration from Mark Avenue Project in Cobb County .... 19 Figure 13: Approximate Location of SC1s ............................................................................... 20 Figure 14:Approximate Location of SC2 .................................................................................. 22 Figure 15: Approximate Location of SC6 ................................................................................. 24 Figure 16: Approximate Location of MC2 ................................................................................ 26 Figure 17: Approximate Location of MC5 ................................................................................ 28 Figure 18:Aerial Photography of MC5 (Existing Pine Valley Lake) taken on 9/7/2017 ............ 29 Figure 19: Approximate Location of PC2 ................................................................................. 30 Figure 20: Approximate Location of OC1................................................................................. 32 Figure 21: Approximate Channel Modification Extents ............................................................ 34 Figure 22: Profile view of Channelization Alternative ............................................................... 35 Figure 23: Sample Channel Modification Cross Section .......................................................... 35 Figure 24: Sample Channel Modification Cross Section .......................................................... 36 Figure 25: Stationarity test results on qualifying gages. .......................................................... 39 Figure 26: Water Year Peak Streamflow at the SW Creek USGS gage near Austell, Georgia.40 Figure 27: Annual Peak Instantaneous Streamflow for Sweetwater Creek Near Austell, GA .. 41 Figure 28. Mean Projected Annual Max Monthly Streamflow for HUC 0313- Apalachicola ..... 42 Figure 29: Field Reconnaissance collected at Bennett Road along Mill .................................. 43 Figure 30: Stream gage height for the Olley Creek USGS station during the September 2009 event. ....................................................................................................................................... 45 Figure 31: Accumulated precipitation at several rainfall gages within the basin). .................... 45 Figure 32: Comparison of observed and reconstructed rainfall for the September 2009 event 46 Figure 33:Comparison of observed and reconstructed rainfall for the November 2009 event . 47 Figure 34: Comparison of observed and reconstructed rainfall for the July 2005 event .......... 47 Figure 35: Sweetwater Creel Basin with subbasin deliniation.................................................. 49 Figure 36: Calibration at USGS gage on Sweetwater Creek ................................................... 56

Sweetwater Creek Feasibility Report
iv
Figure 37: Calibration at USGS gage on Sweetwater Creek ................................................... 56 Figure 38: Calibration at USGS gage on Sweetwater Creek ................................................... 57 Figure 39: Flow Comparison at Sweetwater Creek near Austell, GA. ..................................... 58 Figure 40: Brownsville Road Structure in Effective Model ....................................................... 61 Figure 41: Brownsville Road Structure in Revised Model ........................................................ 62 Figure 42: Observed vs. Modeled Hydrograph for Noses Creek XS 17633............................. 63 Figure 43: Observed vs. Modeled Hydrograph for Olley Creek XS 5126 ................................ 64 Figure 44: Observed vs. Modeled Hydrograph for Powder Springs Creek XS 16955 ............. 64 Figure 45: Observed vs. Modeled Hydrograph for Sweetwater Creek XS 124657 .................. 64 Figure 46: Observed vs. Modeled Hydrograph for Sweetwater Creek XS 37986 .................... 65 Figure 47: Observed vs. Modeled Hydrograph for Sweetwater Creek XS 5327 ...................... 65
LIST OF TABLES
Table 1: Measures Considered .................................................................................................. 9 Table 2: Final measures with description................................................................................. 13 Table 3: Array of Alternatives Based on Measures .................................................................. 36 Table 4: Summary of Calibration Events ................................................................................. 44 Table 5: Historical storms used for the Sweetwater Basin study ............................................. 44 Table 6: Design rainfall values, before and after applying the ARF to the NOAA Atlas 14 rainfall amount..................................................................................................................................... 47 Table 7: Initial Deficits of Calibration Events and Frequency Events ....................................... 49 Table 8: Constant Loss Rates for Calibration Events and Frequency Events.......................... 51 Table 9: Transform Parameters for Subbasin Response ......................................................... 52 Table 10: 100-Year Frequency Flows using Multiple Methods ................................................ 54 Table 11: Gage Estimate of Flows at USGS Gage # 02337000 .............................................. 54 Table 12: Nash-Sutcliffe Values from HEC-HMS Calibration Events ....................................... 55 Table 13: Comparison of Frequency Flows using Various Methods ........................................ 57 Table 14: Summary of Existing Conditions Discharges throughout Basin ............................... 58 Table 15: Best Available HEC-RAS Models ............................................................................ 59 Table 16: Manning's n values .................................................................................................. 62 Table 17: November 2009 Calibration Results ........................................................................ 65 Table 18: July 2005 Calibration Results .................................................................................. 66 Table 19: September 2009 Calibration Results ....................................................................... 66 Table 20: Percent Impervious Values ...................................................................................... 68 Table 21: Comparison of Existing and Future Without Project Conditions Flows .................... 69 Table 22: Summary of Future Without Project Conditions Discharges Throughout Basin ....... 70 Table 23: Total Project Cost Summary for Each Alternative .................................................... 70

Sweetwater Creek Feasibility Report
1
1. Introduction
The U.S. Army Corps of Engineers (USACE), Mobile District, in partnership with Cobb County, Georgia (the Non-Federal Sponsor), is conducting a general investigation Flood Risk Management (FRM) study to evaluate the feasibility of reducing the flooding risks in the Sweetwater Creek Basin. The specific focus of the study is to identify measures with the potential to reduce the level of flooding risk incurred by structures adjacent to Sweetwater Creek and its tributaries. A team comprised of engineering technical experts from the USACE Mobile District and Dewberry engineering firm were charged with (1) characterizing the existing and future (with- and without-project) hydraulic, hydrologic, and geologic conditions of the study area, (2) developing of the hydrologic and hydraulic models used to evaluate the effects/benefits of potential alternatives, (3) producing concept and feasibility level designs for the various alternatives considered, and (4) generating feasibility level cost estimates for all potential alternatives for use in the plan formulation process. Details of the engineering efforts to satisfy items (1) – (3) are discussed below in this appendix. The efforts to support item (4) are discussed in a separate Cost Engineering Appendix. 2. Study Area
The study area is made up of the entire 264 square mile Sweetwater Creek Watershed (Figure 1); which covers portions of Cobb, Douglas, Paulding and Carroll Counties in Georgia. While the study considers the entire watershed, the focus for flood risk reductions is the Cobb County portion of the basin. The Cobb County portion includes the cities of Marietta, Austell, and Powder Springs as well as a portion of unincorporated Cobb County, Georgia. Located inside the study area are 14 public schools, 7 senior care facilities, and 1 hospital.
Figure 1: Study Area

Sweetwater Creek Feasibility Report
2
2.1. Watershed Characteristics
Drainage Area Description
The Sweetwater Creek Watershed is located in the upper reaches of the Middle Chattahoochee-Lake Harding HUC8 basin. The watershed is 264 square miles, and drains south east into the Chattahoochee River. It covers portions of Cobb, Douglas, Paulding and Carroll Counties and the cities of Austell, Powder Springs, Hiram, Douglasville, Villa Rica, and Marietta. The main stem of Sweetwater Creek is approximately 46 miles long and has approximately 58 miles of main tributaries. Buttermilk Creek, Mill Creek, Noses Creek, Olley Creek, and Powder Springs Creek are all tributaries of Sweetwater Creek and are predominantly located in Cobb County, Georgia. Figure 2 shows a map of the Sweetwater Creek watershed.
Figure 2: Sweetwater Creek Basin Map

Sweetwater Creek Feasibility Report
3
Flooding History
Based on the Cobb County Flood Insurance Study (FIS) Report, dated March 4, 2013, the city of Powder Springs experienced severe flooding in June 1999 from a slow-moving thunderstorm over a three hour period resulting in approximately $1.2 million in property damage (FEMA 2013). In September 2004, rainfall associated with Hurricane Ivan inundated Cobb County with six to ten inches of rain, with a majority of it falling during one afternoon and evening. Many streams experienced record flooding, and parts of the Chattahoochee River crested at more than eight feet above normal stage. Portions of Six Flags amusement park in Austell were also flooded. Shortly after this event, remnants of Tropical Storm Jeanne also hit the Sweetwater Creek basin, causing additional damages to homes that were impacted by Hurricane Ivan (FEMA 2013).
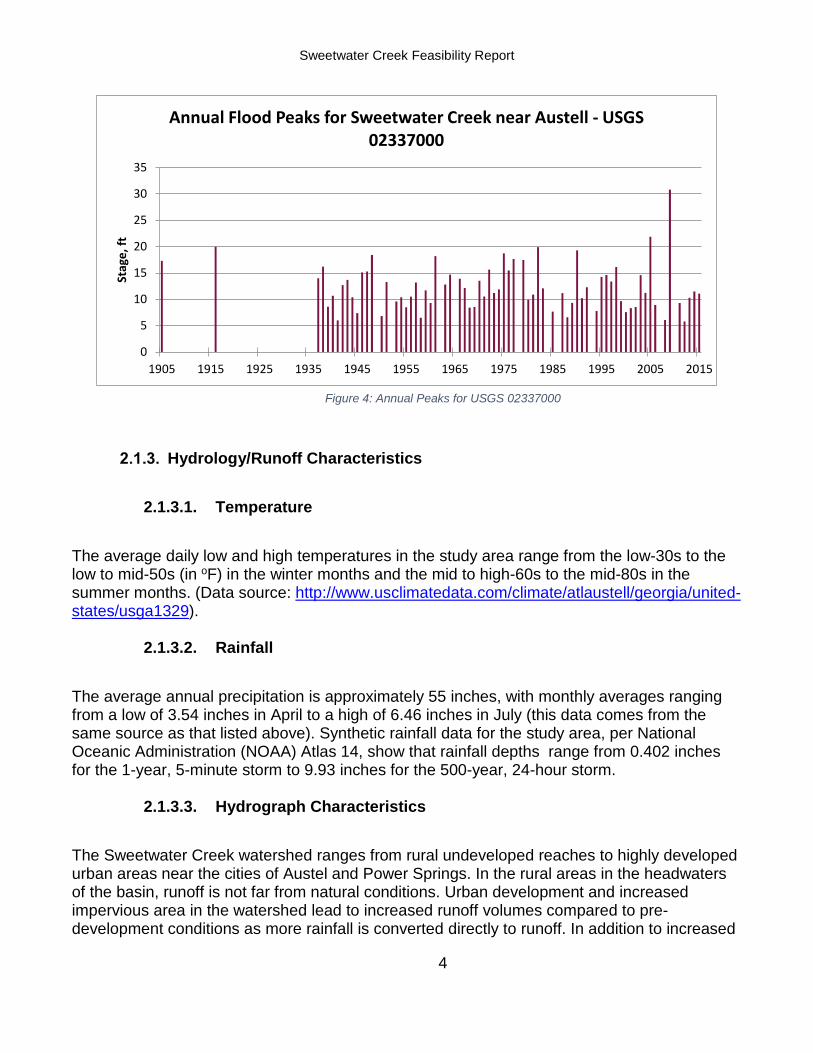
Most recently, the Sweetwater Creek basin experienced a historical flooding event in September 2009, where portions of the county saw flooding that exceeded the 0.2-percent-chance-annual exceedance event (FEMA 2013). The areas in and around Austell, GA, where Sweetwater Creek confluences with Noses Creek and Olley Creek, were significantly impacted. Figure 3 shows the flooding experienced at Veterans Memorial Highway along Sweetwater Creek near Austell. Figure 4 shows the annual flood peaks for the USGS gage 02337000 Sweetwater Creek near Austell, GA from
1905-2015. During its period of record, the gage recorded 11 major floods (17 foot stage or greater), 21 moderate floods (13-17 foot crest), and 25 minor floods (10-13 foot crest).
Figure 3: 2009 Sweetwater Creek flooding at Veterans Memorial Highway
Sweetwater Creek Feasibility Report
4
Figure 4: Annual Peaks for USGS 02337000
Hydrology/Runoff Characteristics
2.1.3.1. Temperature
The average daily low and high temperatures in the study area range from the low-30s to the low to mid-50s (in oF) in the winter months and the mid to high-60s to the mid-80s in the summer months. (Data source: http://www.usclimatedata.com/climate/atlaustell/georgia/united-states/usga1329).
2.1.3.2. Rainfall
The average annual precipitation is approximately 55 inches, with monthly averages ranging from a low of 3.54 inches in April to a high of 6.46 inches in July (this data comes from the same source as that listed above). Synthetic rainfall data for the study area, per National Oceanic Administration (NOAA) Atlas 14, show that rainfall depths range from 0.402 inches for the 1-year, 5-minute storm to 9.93 inches for the 500-year, 24-hour storm.
2.1.3.3. Hydrograph Characteristics
The Sweetwater Creek watershed ranges from rural undeveloped reaches to highly developed urban areas near the cities of Austel and Power Springs. In the rural areas in the headwaters of the basin, runoff is not far from natural conditions. Urban development and increased impervious area in the watershed lead to increased runoff volumes compared to pre-development conditions as more rainfall is converted directly to runoff. In addition to increased
0
5
10
15
20
25
30
35
1905 1915 1925 1935 1945 1955 1965 1975 1985 1995 2005 2015
Stag
e, ft
Annual Flood Peaks for Sweetwater Creek near Austell - USGS 02337000

Sweetwater Creek Feasibility Report
5
runoff volumes, the timing of rainfall runoff is also impacted by development. Runoff is delivered to streams much more quickly through stormwater pipes and impervious areas, resulting in “flashy” or “spikey” hydrographs that quickly rise and fall with each storm event. The result is more frequent and higher “flood” events. A typical “flashy” hydrograph from the USGS gage on Sweetwater Creek is shown in Figure 5. Stormwater management measures such as detention ponds mitigate the impacts of development, but these features few in the Sweetwater Creek Basin.
Figure 5: Typical Sweetwater Creek Hydrograph
Stream Hydraulics: Conveyance and Regulation
The Sweetwater Creek basin is a fairly diverse basin. In the headwaters of the basin are heavily wooded with mostly rural areas. Water conveys very slowly through the top of the basin. The lower end of the basin, which is far more urbanized experiences flashy hydrographs and much higher stream velocities. Large sections of Sweetwater Creek near the town of Austel, Ga have experienced significant channel degradation. Much of this is tied to the September 2009 flood.
Many areas along Sweetwater Creek and its tributaries exceed bankfull capacity on an annual basis. Areas around Austel and Powder Springs experience out of bank flows as frequently as every year, however, do not experience damages as a result of smaller events below the 2 year event. There are no significant flood reregulation structures on Sweetwater Creek or its major tributaries.
Sweetwater Creek Feasibility Report
6
Land Use
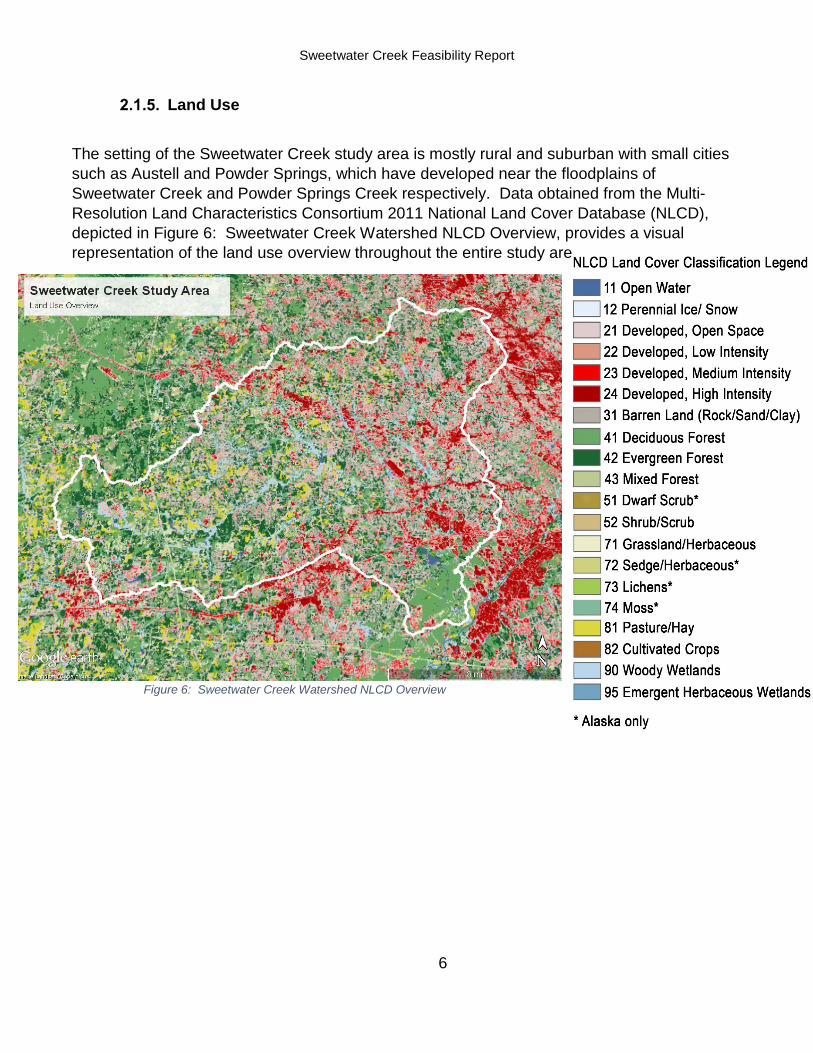
The setting of the Sweetwater Creek study area is mostly rural and suburban with small cities such as Austell and Powder Springs, which have developed near the floodplains of Sweetwater Creek and Powder Springs Creek respectively. Data obtained from the Multi-Resolution Land Characteristics Consortium 2011 National Land Cover Database (NLCD), depicted in Figure 6: Sweetwater Creek Watershed NLCD Overview, provides a visual representation of the land use overview throughout the entire study area.
Figure 6: Sweetwater Creek Watershed NLCD Overview

Sweetwater Creek Feasibility Report
7
Alluvium and Soils
The study area is located in what is known as the upper Piedmont physiographic province. This area is in what can be considered the foothills of the Appalachian Mountains. The Piedmont is a region of moderate-to-high-grade metamorphic rocks, such as schists, amphibolites, gneisses, and migmatites, and igneous rocks like granite. Topographically, the Piedmont mostly consists of rolling hills. Piedmont soils are commonly a red color for which Georgia is famous. Those soils consist of kaolinite and halloysite (1:1 aluminosilicate clay minerals) and of iron oxides. They result from the intense weathering of feldspar-rich igneous and metamorphic rocks. This intense weathering dissolves or alters nearly all minerals and leaves behind a residue of aluminum-bearing clays and iron-bearing iron oxides because of the low solubilities of aluminum and iron at earth-surface conditions. Those iron oxides give the red color to the clay-rich soil.
Geology and Soils
Sweetwater Creek Watershed is a tributary to the Chattahoochee River which runs parallel to the Brevard Fault Zone which a prominent geologic feature of the Southeast United States formed through seismic activity (Vauchez 1987). Bedrock in the USEPA defined Piedmont Ecoregion consists of Precambrian and Paleozoic metamorphic and igneous rocks such as granite, gneiss, and marble (GWRD 2001).
Soils of the USEPA defined Piedmont Ecoregion are comprised of fine grained saprolites and ultisols which are chemically weathered rocks and leached acidic sandy or loams soils respectively. Ultisols of the Piedmont Ecoregion range in color from bright red or reddish-yellow to orange or pale yellow-brown. Due to 19th century farming practices, topsoil erosion has led to the exposure of these soils which were formed through the weathering of igneous and metamorphic bedrock.
Groundwater 3. Formulation of Alternatives
3.1. Problems and Opportunities
The USACE project delivery team (PDT), through coordination with the non-federal sponsor and other interested stakeholders, identified flooding problems and opportunities within the Sweetwater Creek watershed. These were elicited during the planning charrette and stakeholder coordination meetings, and were further investigated and refined through on-site field assessments. The specific problems and opportunities identified through these efforts are discussed in the following sections.

Sweetwater Creek Feasibility Report
8
Problem Identification
The existing problems in the study area include:
• Routine rainfall events cause flooding along Sweetwater Creek increasing flood risk and damaging residential and commercial structures throughout Cobb County
o The cities of Austell and Powder Springs and the surrounding areas experience the most extensive and frequent flooding in the study area
• Emergency services disrupted during routine flood events • Reduced channel conveyance from continual sedimentation from erosion and run-off •
Opportunities
The existing opportunities in the study area include:
• Reduce flood damages along Sweetwater Creek and its tributaries within Cobb County • Reduce impacts to emergency services during flood events • Reduce stream bank erosion • Improve flood risk communication among stakeholders
3.2. Study Goals, Objectives, and Constraints
The study goal of this feasibility study is to meet specific objectives within the constraints set forth by policy, the study PDT and with input from the sponsor. The specific objectives and constraints of this study are discussed below.
Specific Objectives
The planning objectives for the 50-year period of analysis from 2023 to 2073, within the Sweetwater Creek watershed inside Cobb County, are:
1. Reduce average annual flood damages 2. Reduce number of structures impacted 3. Reduce response times for emergency services during flood events 4. Increase access to emergency services during flood events

Sweetwater Creek Feasibility Report
9
Constraints
Impacts to the below planning constraints should be avoided when able, minimized where possible, and mitigated if there are any resulting impacts.
1. Induced flooding in developed areas 2. Impacts to cultural resources 3. HTRW sites 4. Impacts to Threatened and Endangered Species
3.3. General Types of Flood Risk Management Measures Considered
A number of non-structural and structural measures were considered for alternative plan development. The measures considered were based on local input, local conditions, and professional judgment. The measures considered for Sweetwater Creek consisted are shown in Table 15.
Table 1: Measures Considered
Measure Various Methods to Develop Measure
Non
-Str
uctu
ral
Mea
sure
s
Structure Relocation/Evacuation (Buyouts)
Elevating Structures
Flood Proofing Structures
Flood Warning System
Flood Plain Regulation
Stru
ctur
al M
easu
res Modifying Channel Capacity
Clearing and snagging, Channel deepening and/or widening, Modifying bridge crossings and culverts
Retention/Attenuation In-channel/Off-channel, Rehabilitation/Modification of existing dams
Levees/Floodwalls
Diversion High flow, Full flow, Channelized tunnel

Sweetwater Creek Feasibility Report
10
Non-Structural Measures
3.3.1.1. Structure Relocation/Evacuation (Buyouts)
Purchasing residential and commercial structures affected by flooding at various probable ACEs. Those ranged from the 10% to the 1% ACE. Buyouts are discussed in more detail in the main report as well as the real estate and economics appendices of this report.
3.3.1.2. Elevating Structures
Elevation of structures was briefly considered as a measure. However, this was screened out as it was clear that many of the structures in the basin that would likely need to be elevated were masonry on slab, making it unfeasible to raise them. Therefore, this was screened out as a measure.
3.3.1.3. Flood Proofing Structures
Flood proofing was discussed however, it was determined that there was no easy and cost effective way to flood proof numerous isolated individual structures throughout the basin. Therefore, this was screened out as a measure.
3.3.1.4. Flood Warning System
A reverse 911 style flood warning system, that could send a text to a cell phone, would help alert those in the area to the potential for a flood event. Sweetwater Creek, Powder Springs Creek, Noses Creek, and Olley Creek all have USGS stream gauges that could be used to trigger the notifications for an area while allowing time for those in the area to avoid the flood waters. This does not address all of the objectives but would enhance any of them to reduce the flood risk in the area
Structural Measures
3.3.2.1. Modifying Channel Capacity
Channel modification of Sweetwater Creek beginning upstream of the City of Austell extending downstream until induced flooding can be mitigated or does not occur. The objective of the measure is to increase channel conveyance through the creation of a more optimal channel design that will reduce flood elevations and concurrently provide a more stable channel.
Sweetwater Creek Feasibility Report
11
Clearing and snagging was eliminated since it would not achieve the project objectives. Modifying bridges and culverts was removed since the ponding that occurs on the upstream side of the structures does not appear to be causing damages to adjacent property owners. Sweetwater Creek has a small elevation change from the Cobb/Paulding County line to Sweetwater Creek State Park. In the 44,000 feet of creek the elevation drops by only 20 feet. The small elevation changes in the area make it so that there is large areas of induced flooding caused by the increased flow of a channel deepening and/or widening if it is not connected to the rapids and falls in the state park. The location of the channel modification is shown in Figure 8.
3.3.2.2. Retention/Attenuation
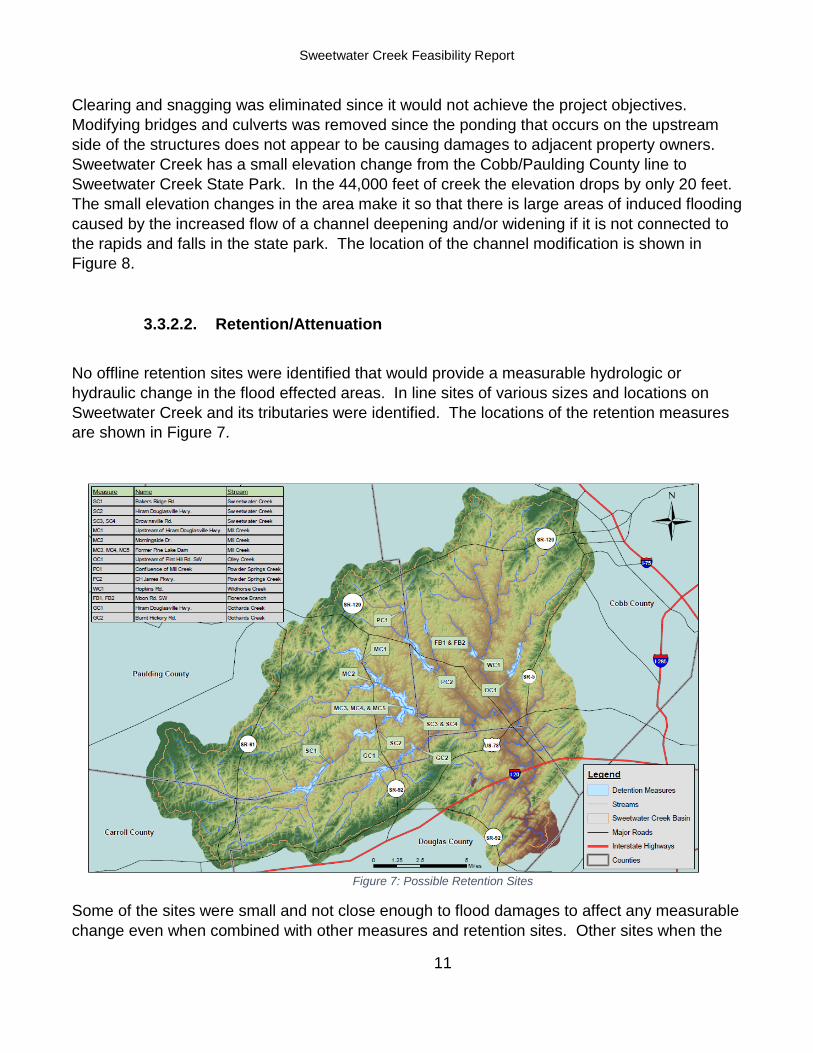
No offline retention sites were identified that would provide a measurable hydrologic or hydraulic change in the flood effected areas. In line sites of various sizes and locations on Sweetwater Creek and its tributaries were identified. The locations of the retention measures are shown in Figure 7.
Figure 7: Possible Retention Sites
Some of the sites were small and not close enough to flood damages to affect any measurable change even when combined with other measures and retention sites. Other sites when the

Sweetwater Creek Feasibility Report
12
retention structure was made large enough to affect a change did not have high enough ground to tie into. Those sites were removed from further consideration.
Combinations of retention sites were developed as part of capturing additional benefits through modified designs of the same structure. One retention combination was to combine all the sites to determine a relative maximum effect from retention
3.3.2.3. Levees/Floodwalls
Levees at some locations where briefly considered but were determined to by not likely cost effective.
3.3.2.4. Diversions
Diversion channel alternatives were investigated. Alignments included connecting tributaries, such as Noses and Ollie Creek, as well as by passing developed areas on Sweetwater Creek itself. One alignment would require a tunnel under the City of Austell that would be 3 12x12 foot culverts in order to pass sufficient flow. The diversion alignments are shown in Figure 8.
Figure 8: Channel Modification and Diversion Measures
Screening of General Measures
Sweetwater Creek Feasibility Report
13
The criteria for screening the initial measures by using professional judgement including 1) was it implementable, 2) not likely to induce flooding, 3) meet the project objectives and 4) relative effectiveness to other measures. Elevating structures and flood proofing were removed because the type of construction (i.e. slab on grade foundations) in the flood prone areas does not allow for elevating the structures. Flood plain regulation has already been implemented by the NFS and so was not carried forward.
3.4. Description of Site Specific Measures Considered for the Final Array of Alternatives
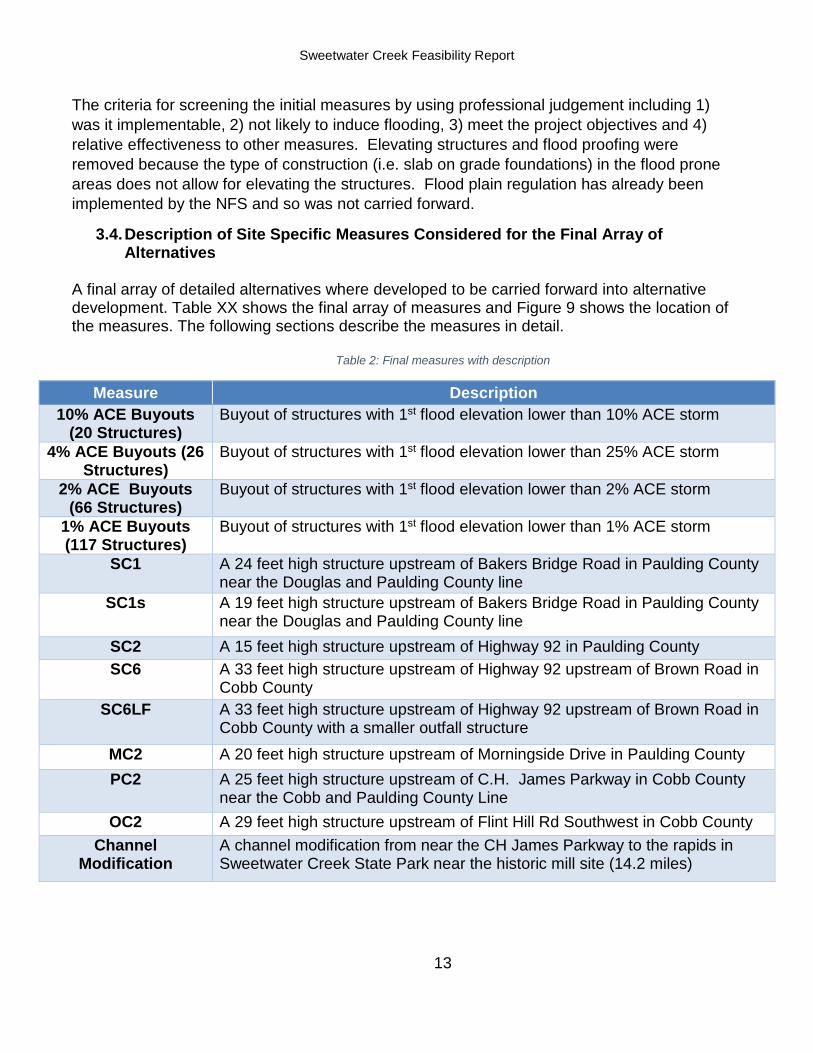
A final array of detailed alternatives where developed to be carried forward into alternative development. Table XX shows the final array of measures and Figure 9 shows the location of the measures. The following sections describe the measures in detail.
Table 2: Final measures with description
Measure Description 10% ACE Buyouts
(20 Structures) Buyout of structures with 1st flood elevation lower than 10% ACE storm
4% ACE Buyouts (26 Structures)
Buyout of structures with 1st flood elevation lower than 25% ACE storm
2% ACE Buyouts (66 Structures)
Buyout of structures with 1st flood elevation lower than 2% ACE storm
1% ACE Buyouts (117 Structures)
Buyout of structures with 1st flood elevation lower than 1% ACE storm
SC1 A 24 feet high structure upstream of Bakers Bridge Road in Paulding County near the Douglas and Paulding County line
SC1s A 19 feet high structure upstream of Bakers Bridge Road in Paulding County near the Douglas and Paulding County line
SC2 A 15 feet high structure upstream of Highway 92 in Paulding County SC6 A 33 feet high structure upstream of Highway 92 upstream of Brown Road in
Cobb County SC6LF A 33 feet high structure upstream of Highway 92 upstream of Brown Road in
Cobb County with a smaller outfall structure MC2 A 20 feet high structure upstream of Morningside Drive in Paulding County PC2 A 25 feet high structure upstream of C.H. James Parkway in Cobb County
near the Cobb and Paulding County Line OC2 A 29 feet high structure upstream of Flint Hill Rd Southwest in Cobb County
Channel Modification
A channel modification from near the CH James Parkway to the rapids in Sweetwater Creek State Park near the historic mill site (14.2 miles)

Sweetwater Creek Feasibility Report
14
Figure 9. Map of Measures

Sweetwater Creek Feasibility Report
15
Non-Structural (Buyouts)
Purchasing residential and commercial structures affected by flooding at various probable ACEs. The 10%, 5%, 2% and 1% ACE where considered. Buyouts are discussed in more detail in the main report as well as the real estate and economics appendices of this report.
Structural
3.4.2.1. Detention Structures
3.4.2.1.1. Modeling
In-line detention structures SC1, SC2, and SC1S were modeled hydrologically as a reservoir element using HEC-HMS version 4.2.1 within HEC-WAT. All storage and elevations data was estimated from low-quality digital terrain data obtained through the USGS National Elevation Dataset. Higher quality LiDAR was not available for the area of the Basin within Paulding County. The slots through the dam, discussed in detail in the following sections, were modeled as outflow structures using the broad crested weir equation. A downstream rating curve was applied to the weirs as a tail water boundary condition using the effective FEMA flood profile elevations for various return periods with corresponding Flood Insurance Study discharges. This enabled submergence considerations to be simply modeled within HEC-HMS, refining the accuracy of the model.
In-line detention structures SC6, MC2, MC5, OC1, and PC2 were modeled dynamically using HEC-RAS version 5.0.3 within HEC-WAT. All storage and elevation data was estimated using cross sections derived from a combination of high quality digital terrain provided by Cobb County and lower quality data obtained through the USGS National Elevation Dataset for portions of the flood pool extending into Paulding County. The slots through the dam were modeled as inline structures within HEC-RAS using the broad crested weir equation.
3.4.2.1.2. Future Detail Design Considerations for Detention Structures
The concept of PC2 developed during the feasibility study was developed in line with the principles of SMART planning which generally defer all detail design from the feasibility phase of a study to the preconstruction phase. Key considerations, recommendations, and requirements for detailed hydraulic and civil design include:

Sweetwater Creek Feasibility Report
16
1. Refinement of the storage-elevation information that HEC-RAS determines to give greater detail by:
• Performing a basic tree survey to develop a storage area reduction factor for the reservoir to account for the loss of volume associated with trees (assuming that clear cutting of trees will not be performed beyond the footprint of the dam structure and a permanent easement around the dam required to allow construction, inspection, and maintenance access). This would be modeled within HEC-RAS as cross section flow obstructions.
2. Refinement of the design and size of the dam outlet work slots by: • Using HEC-RAS, develop a 2D model of the structure and flow through the outlet
works slot. This will enable the slot to be more accurately designed and optimized using energy flow methods rather than weir flow as it is currently modeled. Since the slot elevation extends below the invert of the channel, true weir flow will not be experienced through the low-stage weir and would therefore be more suited to energy flows. A rating curve would then be determined from the 2D model and applied to the cross section immediately upstream of the dam in lieu of the existing in-line structure. The detailed design of the slot will require:
i. Determining the wall angles to enable the smooth contraction and expansion of flows into and through the throat of the slot. When the wall angles and longitudinal length of the slot throat have been determined as shown in Figure 10, the width of the slot will need to be modified slightly to achieve similar hydrologic performance to the original HEC-RAS model that used weir methods.
3. Determining the hazard potential classification of the dam to determine the required spillway design flood and spillway size by:
• Developing a sunny day dam failure hydraulic model in accordance with the the US Army Corps of Engineers dam safety guidelines and Georgia Safe Dams Program Engineering Guidelines to determine the hazard potential classification and required spillway design flood.
Figure 10. Wall Angle Refinement

Sweetwater Creek Feasibility Report
17
• Once the spillway design flood is determined, the high stage slot width will need to be modified to accommodate the spillway design flood. Alternatively, to preserve the flood attenuation benefits of the high stage slot, an auxiliary spillway could potentially be added to bypass flow over or around the dam structure. Wherever possible, the high-stage slot/weir or auxiliary spillway should be located to the side of the dam to allow flow to bypass the dam face. If the high stage slot/weir cannot be located to the side of the structure, a concrete chute spillway and stilling basin will be required for overtopping and downstream channel protection. It should be noted that widening of the high-stage slot will likely result in a decrease in flood attenuation for flood events greater than the 1% annual chance discharge.
3.4.2.1.3. Site Descriptions of Measures
Measure SC1 Measure SC1s is a conceptual online dry detention facility on Sweetwater Creek, located approximately 1 mile upstream of Bakers Bridge Road in Paulding County, creating up to 5,720 acre-feet of flood storage. It is located at the same location as SC1 with a smaller configuration that provides protection for events below the 2% annual chance exceedance. The objective of the measure is to temporarily detain floodwaters from the approximately 42 square miles that drain to the facility location. By temporarily detaining floodwaters, the facility will reduce the peak downstream discharges in addition to delaying the timing of the hydrograph peak. The delaying of the hydrograph at the facility will have the additional benefit of allowing Mill Creek, which confluences with Sweetwater Creek approximately 7.5 miles downstream of the facility, to drain longer before the peak discharge of Sweetwater Creek reaches the confluence, resulting in less coincidental peaks and reducing the combined peak downstream of the confluence for most flood events. This concept would reduce flood risk along a section of Sweetwater Creek and along the Tributaries of Mill Creek, Power Springs Creek, Noses Creek, and Olley Creek to name a few which experience large depths of backwater flooding as a result of Sweetwater Creek. Figure 11 below illustrates the approximate location and alignment of measure SC1.
Figure 12 illustrates the approximate location and alignment of measure SC1.

Sweetwater Creek Feasibility Report
18
Figure 11: Approximate Location of SC1

Sweetwater Creek Feasibility Report
19
Measure SC1 Configuration The facility would consist of a 1,500 feet long, 24 feet high earthen or concrete dam (roller compacted or traditional concrete) built approximately perpendicular to Sweetwater Creek and its adjoining floodplain. The outlet works of the dam would consist of a multi-stage concrete slot with vertical side walls discharging into a stilling basin downstream of the dam. The slot was sized to allow smaller storm events to freely pass through the structure, allowing maximum storage for the larger events, and adjusted as needed for maximum potential attenuation. The slot would begin with an approximately 8-feet wide low-stage section extending to the top of the dam with the invert of the slot sunken approximately 2 feet or more below the channel invert. The sinking of the slot below the channel invert will allow for sediment backfill, creating a more natural channel bottom through the dam supporting the unrestricted passage of various aquatic species including fish. The high-stage slot would be approximately 50-feet wide beginning at an elevation of 954 feet, extending upwards to the top of dam elevation of 959 feet and would only be expected to engage when the 1% annual chance flood discharges are exceeded and is not intended to provide significant flood attenuation. An example of a similar slot dam structure is shown in Figure 12, which is a recently completed project located at Mark Avenue in Cobb County. The facility is estimated to provide 7,660 acre-feet of storage during the peak elevation of the 1% annual chance flood elevation of 956 feet and 10,015 acre-feet of storage at the top of dam elevation of 959 feet.
Figure 12: Example of Slot Dam Configuration from Mark Avenue Project in Cobb County
Sweetwater Creek Feasibility Report
20
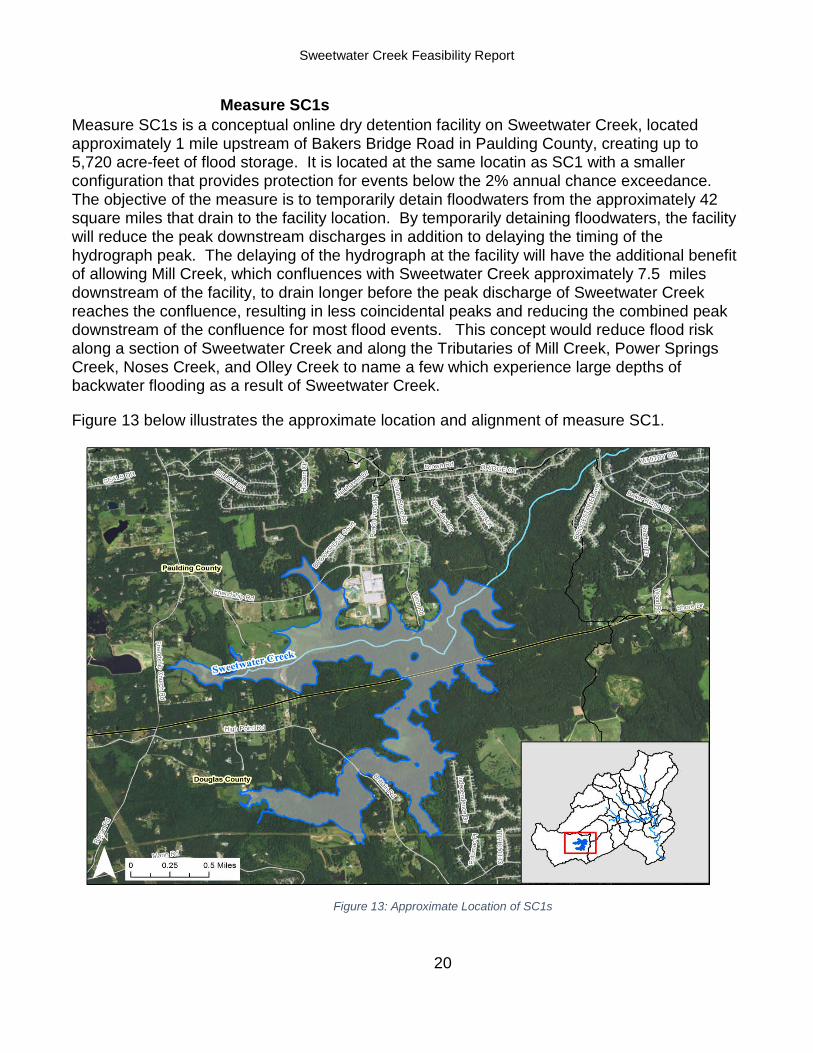
Measure SC1s Measure SC1s is a conceptual online dry detention facility on Sweetwater Creek, located approximately 1 mile upstream of Bakers Bridge Road in Paulding County, creating up to 5,720 acre-feet of flood storage. It is located at the same locatin as SC1 with a smaller configuration that provides protection for events below the 2% annual chance exceedance. The objective of the measure is to temporarily detain floodwaters from the approximately 42 square miles that drain to the facility location. By temporarily detaining floodwaters, the facility will reduce the peak downstream discharges in addition to delaying the timing of the hydrograph peak. The delaying of the hydrograph at the facility will have the additional benefit of allowing Mill Creek, which confluences with Sweetwater Creek approximately 7.5 miles downstream of the facility, to drain longer before the peak discharge of Sweetwater Creek reaches the confluence, resulting in less coincidental peaks and reducing the combined peak downstream of the confluence for most flood events. This concept would reduce flood risk along a section of Sweetwater Creek and along the Tributaries of Mill Creek, Power Springs Creek, Noses Creek, and Olley Creek to name a few which experience large depths of backwater flooding as a result of Sweetwater Creek.
Figure 13 below illustrates the approximate location and alignment of measure SC1.
Figure 13: Approximate Location of SC1s

Sweetwater Creek Feasibility Report
21
Measure SC1s Configuration The facility would consist of a 1,500 feet long, 19 feet high earthen or concrete dam (roller compacted or traditional concrete) built approximately perpendicular to Sweetwater Creek and its adjoining floodplain. The outlet works of the dam would consist of a single stage concrete slot with vertical side walls discharging into a stilling basin downstream of the dam. The slot was sized to allow smaller storm events to freely pass through the structure, allowing maximum storage for the larger events up to the 50 year storm, and adjusted as needed for maximum potential attenuation. The slot would begin with an approximately 8-feet wide low-stage section extending to the top of the dam with the invert of the slot sunken approximately 2 feet or more below the channel invert. The sinking of the slot below the channel invert will allow for sediment backfill, creating a more natural channel bottom through the dam supporting the unrestricted passage of various aquatic species including fish This configureation does not contain an upper stage slot for larger events. The dam would be armored to fully overtop in an event exceeding the 50 year storm. The facility is geared towards providing reduced damages to smallers storms and is estimated to provide 5,720 acre-feet of storage during the peak elevation of the 2% annual chance flood elevation of 954 which corresponds to the top of dam elevation.

Sweetwater Creek Feasibility Report
22
Measure SC2 Measure SC2 is a conceptual online dry detention facility on Sweetwater Creek, located just upstream of Hiram Douglasville Highway in Paulding County, creating up to 2,260 acre-feet of flood storage. The objective of the measure is to temporarily detain floodwaters from the approximately 51 square miles that drain to the facility location. By temporarily detaining floodwaters, the facility will reduce the peak downstream discharges. This concept would reduce flood risk along a section of Sweetwater Creek and along the Tributaries of Power Springs Creek, Noses Creek, and Olley Creek to name a few which experience large depths of backwater flooding as a result of Sweetwater Creek.
Figure 14 below illustrates the approximate location and alignment of measure SC2.
Figure 14:Approximate Location of SC2
Sweetwater Creek Feasibility Report
23
Measure SC2 Configuration The facility would consist of a 1,600 feet long, 15 feet high earthen or concrete dam (roller compacted or traditional concrete) built approximately perpendicular to Sweetwater Creek and its adjoining floodplain. The outlet works of the dam would consist of a multi-stage concrete slot with vertical side walls discharging into a stilling basin downstream of the dam. The slot was sized to allow smaller storm events to freely pass through the structure, allowing maximum storage for the larger events, and adjusted as needed for maximum potential attenuation. The slot would begin with an approximately 10-feet wide low-stage section extending to the top of the dam with the invert of the slot sunken approximately 2 feet or more below the channel invert. The sinking of the slot below the channel invert will allow for sediment backfill, creating a more natural channel bottom through the dam supporting the unrestricted passage of various aquatic species including fish. The high-stage slot would vary approximately 100 feet wide beginning at an elevation of 923 feet, extending upwards to the top of dam elevation of 929 feet and would only be expected to engage when the 1% annual chance flood discharges are exceeded and is not intended to provide significant flood attenuation. The facility is estimated to provide 2,260 acre-feet of storage during the peak elevation of the 1% annual chance flood elevation of 926 feet and 3,050 acre-feet of storage at the top of dam elevation of 929 feet.

Sweetwater Creek Feasibility Report
24
Measure SC6 and SC6LF Measures SC6 and SC6LF is a conceptual online dry detention facility on Sweetwater Creek, located just upstream of Brown Road in Cobb County, creating up to 9,000 acre-feet of flood storage. The objective of the measure is to temporarily detain floodwaters from the approximately 100 square miles that drain to the facility location. By temporarily detaining floodwaters, the facility will reduce the peak downstream discharges. This concept would reduce flood risk along a section of Sweetwater Creek and along the Tributaries of Power Springs Creek, Noses Creek, and Olley Creek to name a few which experience large depths of backwater flooding as a result of Sweetwater Creek.
Figure 15 below illustrates the approximate location and alignment of measure SC6.
Figure 15: Approximate Location of SC6

Sweetwater Creek Feasibility Report
25
Measure SC6 and SC6LF Configuration The facility would consist of a 1,400 feet long, 33 feet high earthen or concrete dam (roller compacted or traditional concrete) built approximately perpendicular to Sweetwater Creek and its adjoining floodplain. The outlet works of the dam would consist of a multi-stage concrete slot with vertical side walls discharging into a stilling basin downstream of the dam. The slot was sized to allow smaller storm events to freely pass through the structure, allowing maximum storage for the larger events, and adjusted as needed for maximum potential attenuation. Depending on the alternative it is a part of, the outlet configurations for SC6 will vary to achieve maximum storage while working in combination. Therefore SC6LF is the same structure with a larger weir configuration. The slot would vary between an approximately 10-20-feet wide low-stage section extending to the top of the dam with invert of the slot sunken approximately 2 feet or more below the channel invert. The sinking of the slot below the channel invert will allow for sediment backfill, creating a more natural channel bottom through the dam supporting the unrestricted passage of various aquatic species including fish. The high-stage slot would vary between approximately 500-1000 feet wide beginning at an elevation of 914.5 feet, extending upwards to the top of dam elevation of 917 feet and would only be expected to engage when the 1% annual chance flood discharges are exceeded and is not intended to provide significant flood attenuation. The facility is estimated to provide 9,000 acre-feet of storage during the peak elevation of the 1% annual chance flood elevation of 914 feet and 12,592 acre-feet of storage at the top of dam elevation of 917 feet.
Measure MC2 Measure MC2 is a conceptual online dry detention facility on Mill Creek, located just upstream of Morningside Drive in Paulding County, creating up to 1,370 acre-feet of flood storage. The objective of the measure is to temporarily detain floodwaters from the approximately 37 square

Sweetwater Creek Feasibility Report
26
miles that drain to the facility location. By temporarily detaining floodwaters, the facility will reduce the peak downstream discharges in addition to delaying the timing of the hydrograph peak. This concept would reduce flood risk along a section of Sweetwater Creek and along the Tributary of Mill Creek.
Figure 16 below illustrates the approximate location and alignment of measure MC2.
Figure 16: Approximate Location of MC2

Sweetwater Creek Feasibility Report
27
Measure MC2 Configuration The facility would consist of a 1,300 feet long, 19.5 feet high earthen or concrete dam (roller compacted or traditional concrete) built approximately perpendicular to Mill Creek and its adjoining floodplain. The outlet works of the dam would consist of a multi-stage concrete slot with vertical side walls discharging into a stilling basin downstream of the dam. The slot was sized to allow smaller storm events to freely pass through the structure, allowing maximum storage for the larger events, and adjusted as needed for maximum potential attenuation. The slot would begin with an approximately 25-feet wide low-stage section extending to the top of the dam with the invert of the slot sunken approximately 2 feet or more below the channel invert. The sinking of the slot below the channel invert will allow for sediment backfill, creating a more natural channel bottom through the dam supporting the unrestricted passage of various aquatic species including fish. The high-stage slot would be approximately 75-feet wide beginning at an elevation of 919 feet, extending upwards to the top of dam elevation of 925 feet and would only be expected to engage when the 1% annual chance flood discharges are exceeded and is not intended to provide significant flood attenuation.

Sweetwater Creek Feasibility Report
28
Measure MC5 Measure MC5 is a conceptual rehabilitation and retrofit of the existing Pine Valley Lake, which is located on Mill Creek in Paulding County, approximately 250 feet upstream of the confluence with Sweetwater Creek. The dam is partially breached but retains a reduced normal pool. The objective of the measure is to structurally rehabilitate the dam and retrofit the outlet works to create a dedicated flood pool to temporarily detain floodwaters from the approximately 42 square miles that drain to the facility. This can include lowering the current normal pool to further increase the flood pool. By temporarily detaining floodwaters, the facility will reduce the peak downstream discharges. This concept would reduce flood risk along a section of Sweetwater Creek and along the Tributaries of Power Springs Creek, Noses Creek and Olley Creek to name a few which experience large depths of backwater flooding as a result of Sweetwater Creek.
Figure 17 illustrates the approximate location and alignment of measure MC5.
Figure 17: Approximate Location of MC5
Sweetwater Creek Feasibility Report
29
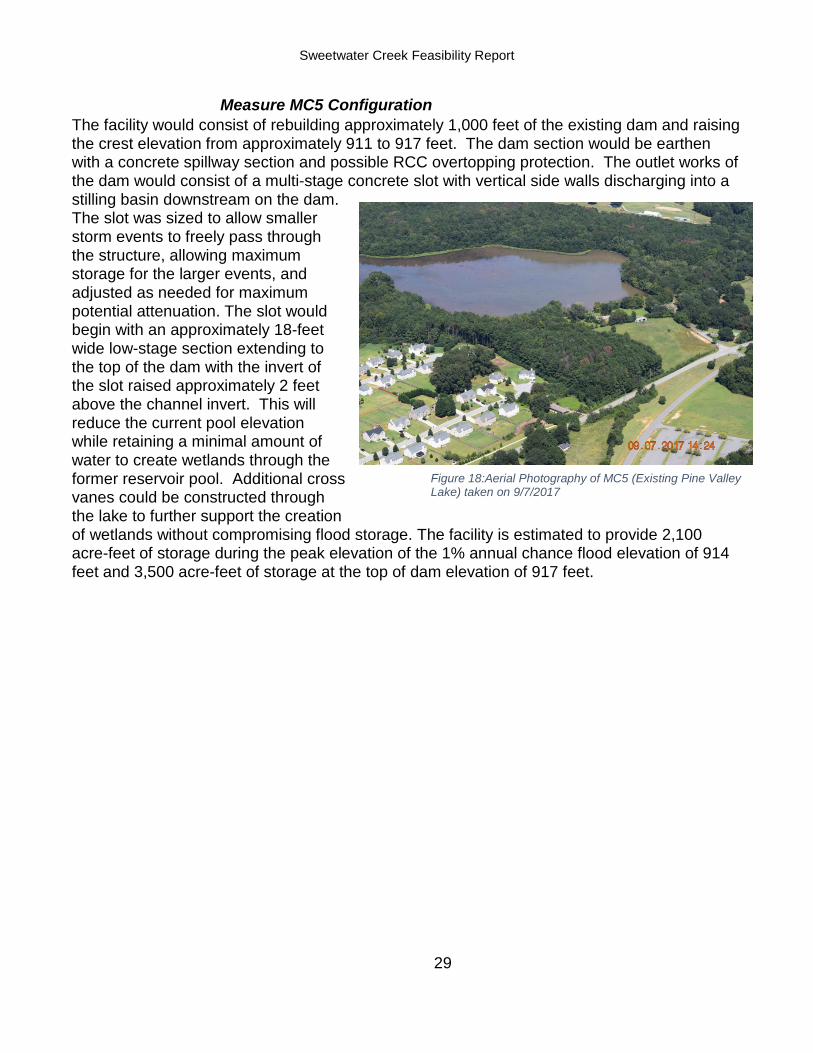
Measure MC5 Configuration The facility would consist of rebuilding approximately 1,000 feet of the existing dam and raising the crest elevation from approximately 911 to 917 feet. The dam section would be earthen with a concrete spillway section and possible RCC overtopping protection. The outlet works of the dam would consist of a multi-stage concrete slot with vertical side walls discharging into a stilling basin downstream on the dam. The slot was sized to allow smaller storm events to freely pass through the structure, allowing maximum storage for the larger events, and adjusted as needed for maximum potential attenuation. The slot would begin with an approximately 18-feet wide low-stage section extending to the top of the dam with the invert of the slot raised approximately 2 feet above the channel invert. This will reduce the current pool elevation while retaining a minimal amount of water to create wetlands through the former reservoir pool. Additional cross vanes could be constructed through the lake to further support the creation of wetlands without compromising flood storage. The facility is estimated to provide 2,100 acre-feet of storage during the peak elevation of the 1% annual chance flood elevation of 914 feet and 3,500 acre-feet of storage at the top of dam elevation of 917 feet.
Figure 18:Aerial Photography of MC5 (Existing Pine Valley Lake) taken on 9/7/2017

Sweetwater Creek Feasibility Report
30
Measure PC2 Measure PC2 is a conceptual online dry detention facility on Powder Springs Creek, located just upstream of CH James Parkway in Cobb County, creating up to 2,700 acre-feet of flood storage. The objective of the measure is to temporarily detain floodwaters from the approximately 18 square miles that drain to the facility location. By temporarily detaining floodwaters, the facility will reduce the peak downstream discharges. This concept would reduce flood risk along sections of Powder Springs Creek and Sweetwater Creek.
Figure 19 below illustrates the approximate location and alignment of measure PC2.
Figure 19: Approximate Location of PC2

Sweetwater Creek Feasibility Report
31
Measure PC2 Configuration The facility would consist of a 1,400 feet long, 25 feet high earthen or concrete dam (roller compacted or traditional concrete) built approximately perpendicular to Powder Springs Creek and its adjoining floodplain. The outlet works of the dam would consist of a multi-stage concrete slot with vertical side walls discharging into a stilling basin downstream of the dam. The slot was sized to allow smaller storm events to freely pass through the structure, allowing maximum storage for the larger events, and adjusted as needed for maximum potential attenuation. The slot would begin with an approximately 8-feet wide low-stage section extending to the top of the dam elevation with the invert of the slot sunken approximately 2 feet or more below the channel invert. The sinking of the slot below the channel invert will allow for sediment backfill, creating a more natural channel bottom through the dam supporting the unrestricted passage of various aquatic species including fish. The high-stage slot would be approximately 30 feet wide beginning at an elevation of 920 feet, extending upwards to the top of dam elevation of 925 feet and would only be expected to engage when the 1% annual chance flood discharges are exceeded and is not intended to provide significant flood attenuation. The facility is estimated to provide 2,700 acre-feet of storage during the peak elevation of the 1% annual chance flood elevation of 922 feet and 3,800 acre-feet of storage at the top of dam elevation of 925 feet.

Sweetwater Creek Feasibility Report
32
Measure OC2 Measure OC1 is a conceptual online dry detention facility on Olley Creek, located approximately 500 feet upstream of Flint Hill Road in Cobb County, creating up to 2,050 acre-feet of flood storage. The objective of the measure is to temporarily detain floodwaters from the approximately 12 square miles that drain to the facility location. By temporarily detaining floodwaters, the facility will reduce the peak downstream discharges. This concept would reduce flood risk along sections of Olley Creek and Sweetwater Creek.
Figure 20 below illustrates the approximate location and alignment of measure OC1.
Figure 20: Approximate Location of OC1

Sweetwater Creek Feasibility Report
33
Measure OC1 Configuration The facility would consist of a 600 feet long, 29 feet high earthen or concrete dam (roller compacted or traditional concrete) built approximately perpendicular to Olley Creek and its adjoining floodplain. The outlet works of the dam would consist of a multi-stage concrete slot with vertical side walls discharging into a stilling basin downstream of the dam. The slot was sized to allow smaller storm events to freely pass through the structure, allowing maximum storage for the larger events, and adjusted as needed for maximum potential attenuation. The slot would begin with an approximately 8-feet wide low-stage section extending to the top of the dam elevation of 917 with the invert of the slot sunken approximately 2 feet or more below the channel invert. The sinking of the slot below the channel invert will allow for sediment backfill, creating a more natural channel bottom through the dam supporting the unrestricted passage of various aquatic species including fish. The facility is estimated to provide 2,050 acre-feet of storage during the peak elevation of the 1% annual chance flood elevation of 914 feet and 2,800 acre-feet of storage at the top of dam elevation of 917 feet.
Channel Modification
3.4.3.1. Modeling
Measure SC9 was modeled dynamically using HEC-RAS version 5.0.3. The concept channel was designed using the HEC-RAS Hydraulic Design – Stable Channel method.
3.4.3.2. Future Detail Design Considerations for Detention Structures
The concept of SC9 developed during the feasibility study was developed in line with the principles of SMART planning, which generally defer all detail design from the feasibility phase of a study to the preconstruction phase. Key considerations, recommendations, and requirements for detailed hydraulic and civil design include:
1. Detailed optimization of channel design throughout the channelization reach to ensure that floodplain management objectives, environmental considerations, and operation and maintenance considerations are met through:
• Performance of a detailed stable channel design in coordination with environmental engineers that considers the geology of the channel, water quality, and habitat enhancements.
• Consideration of sediment transport to minimize operations and maintenance needs.
2. Optimization of channelization extent by performing a sensitivity analysis • Varying the upstream and downstream extent of channelization to determine
whether the reach can be shorted without compromising benefits.

Sweetwater Creek Feasibility Report
34
3.4.3.3. Description
Measure SC9 is a conceptual 14 mile long channelization of Sweetwater Creek beginning from a point approximately 3 miles downstream of Interstate 20 and extending upstream to a point approximately 800 feet downstream of Hiram Lithia Springs Road. The objective of the measure is to increase channel conveyance through the creation of a more optimal channel design that will reduce flood elevations and concurrently provide a more stable channel. This concept would reduce flood risk along a section of Sweetwater Creek and along the Tributaries of Power Springs Creek, Noses Creek, and Olley Creek to name a few which experience large depths of backwater flooding as a result of Sweetwater Creek.
Figure 21 below illustrates the approximate extent of the channelization.
Measure SC9 Configuration The channelization would consist of approximately 14.2 miles of improved channel with an average excavation depth of 2.2 feet and an estimated excavation volume of 2.5 million cubic
Figure 21: Approximate Channel Modification Extents
Sweetwater Creek Feasibility Report
35
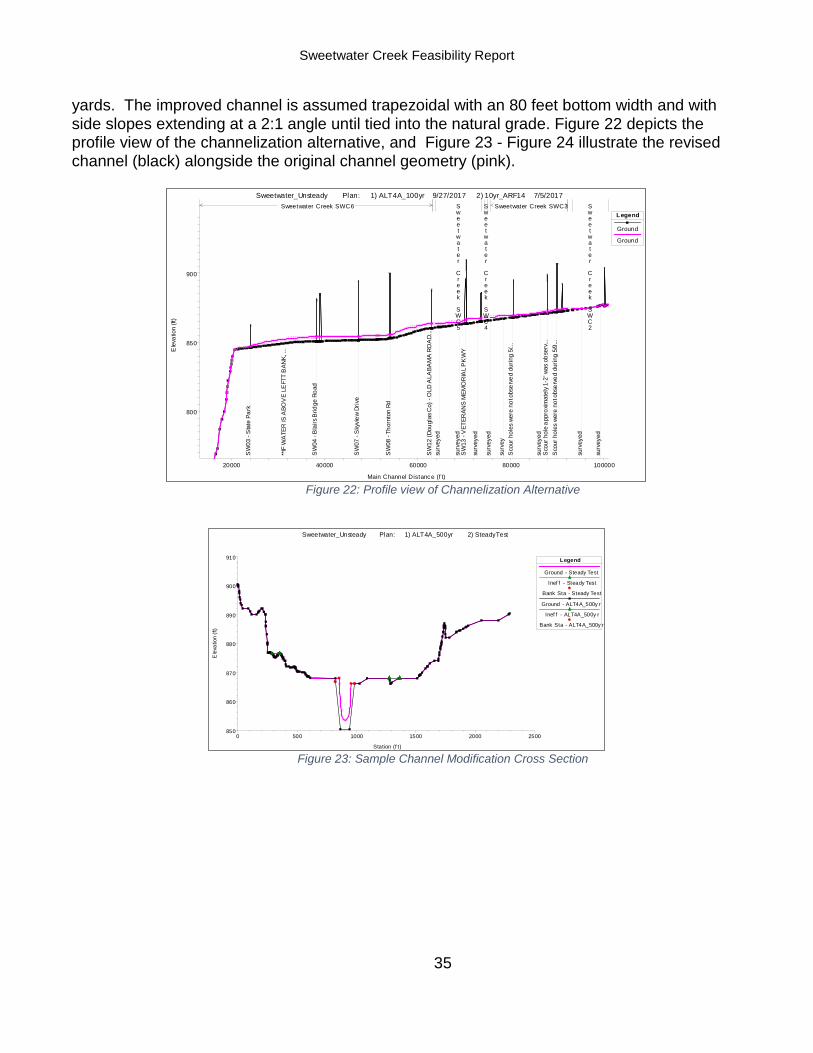
yards. The improved channel is assumed trapezoidal with an 80 feet bottom width and with side slopes extending at a 2:1 angle until tied into the natural grade. Figure 22 depicts the profile view of the channelization alternative, and Figure 23 - Figure 24 illustrate the revised channel (black) alongside the original channel geometry (pink).
Figure 22: Profile view of Channelization Alternative
Figure 23: Sample Channel Modification Cross Section
20000 40000 60000 80000 100000
800
850
900
Sweetwater_Unsteady Plan: 1) ALT4A_100yr 9/27/2017 2) 10yr_ARF14 7/5/2017
Main Channel Distance (f t)
Ele
vatio
n (ft
)
Legend
Ground
GroundS
W03
- S
tate
Par
k
**IF
WA
TER
IS A
BOV
E LE
FTT
BAN
K, ...
SW
04 -
Bla
irs B
ridge
Roa
d
SW
07 -
Sky
view
Driv
e
SW
08 -
Thor
nton
Rd
SW
12 (D
ougl
as C
o) -
OLD
ALA
BAM
A RO
AD.
..su
rvey
ed
surv
eyed
SW
13 -
VET
ERAN
S M
EMO
RIA
L P
KW
Y
surv
eyed
surv
eyed
surv
eyS
cour
hol
es w
ere
not o
bser
ved
durin
g 5/
...
surv
eyed
Sco
ur h
ole
appr
oxim
atel
y 1-2
' was
obs
erv..
.S
cour
hol
es w
ere
not o
bser
ved
durin
g 5/
9...
surv
eyed
surv
eyed
Sweetwater Creek SWC6 Sweetwater Creek SWC5
Sweetwater Creek SWC4
Sweetwater Creek SWC3 Sweetwater Creek SWC2
0 500 1000 1500 2000 2500850
860
870
880
890
900
910
Sweetwater_Unsteady Plan: 1) ALT4A_500yr 2) SteadyTest
Station (f t)
Ele
vatio
n (ft
)
Legend
Ground - Steady Test
Inef f - Steady Test
Bank Sta - Steady Test
Ground - ALT4A_500y r
Inef f - ALT4A_500y r
Bank Sta - ALT4A_500y r

Sweetwater Creek Feasibility Report
36
Figure 24: Sample Channel Modification Cross Section
3.5. Final Array of Alternatives
Using the measures discussed above, an array of alternatives was created from a single measure or, combination of a number of measures. The alternatives carried forward are listed in Table 3 below.
Table 3: Array of Alternatives Based on Measures
Alternative SC1s SC1 SC2 SC6LF SC6 MC2 PC1 OC1 Channel Mod (SC9)
Buyouts (10-Year)
Future Without Project (No
Action)
Alternative 1 Alternative 2 Alternative 4
Alternative 5D Alternative 5H Alternative 5J
0 200 400 600 800 1000 1200 1400 1600860
880
900
920
940
960
Sweetwater_Unsteady Plan: 1) ALT4A_500yr 2) SteadyTest
Station (f t)
Ele
vatio
n (ft
)
Legend
Ground - Steady Test
Bank Sta - Steady Test
Ground - ALT4A_500y r
Bank Sta - ALT4A_500y r

Sweetwater Creek Feasibility Report
37
3.6. Alternative Comparison
3.7. Recommended Plan
Alternative 1 is the NED plan that reasonably maximizes net benefits. Of the two justified alternatives, it has the least uncertainty in benefits with the highest possible net benefits of all the plans. This feature consists of buying out structures whose first floor elevations are lower than the anticipated water surface elevation of the 10% ACE floodplain. This is a total of 20 structures throughout Cobb County, the City of Austell, and the City of Powder Springs. Details of the recommended plan are available in the main report.
3.8. Climate Change
Introduction
In 2016, USACE issued Engineering and Construction Bulletin No. 2016-25 (hereafter, ECB 2016-25), which stipulated that climate change be considered for all federally funded projects in planning stages. A qualitative analysis of historical climate trends, as well as assessment of future projections was provisioned by ECB 2016-25. Even if climate change does not appear to be an impact for a particular region of interest, the formal analysis outlined in ECB 2016-25 results in better informed planning and engineering decisions. In accordance with ECB 2016-25, a stationarity analysis was performed to determine if there are long-term changes in rainfall and streamflow statistics within the Sweetwater basin and its vicinity. Assessing rainfall stationarity allows for an identification of long-term climate variability and/or climate change. Meanwhile, assessing streamflow stationarity includes other components, most notably land cover changes and associated differences in impervious area as well as changes in water control structures.
Literature Review
A January 2015 report conducted by the USACE Institute for Water Resources summarizes the available literature for the South Atlantic-Gulf Region, which includes the Sweetwater Creek Basin. The report focuses on both observed climatic trends, as well as projected future findings. While the observed trends may prove to be of some importance, it is the projected findings which are of the most significance. The report finds a strong consensus supporting trends of increasing air temperatures. Projected increases of mean annual air temperature range from 2 to 4ºC by the latter half of the 21st century for the South Atlantic-Gulf Region. The region is expected to experience the largest increases in the summer months. There is also a consensus that there will be an
Sweetwater Creek Feasibility Report
38
increase in extreme temperature events such as more frequent, longer, hotter summer heat waves. Projections regarding precipitation and hydrologic streamflow trends lack a clear consensus, with some models showing increases and others showing decreases. However, there is moderate consensus that future storm events may be more intense and more frequent than in the past.
Stationarity Assessment
Rainfall The Global Historical Climatology Network (GHCN; Menne et al. 2012) of rain gages was used to determine long term trends in the region. Although there are many network rain gages in the area, the following strict guidelines were established to retain long-term gages with sufficient data coverage:
• within 150 miles of the Sweetwater basin, • less than 10 missing days in any given year, • at least 60 qualifying years of data, • the last qualifying year must be 2007 or later.
After imposing the guidelines above, 38 qualifying gages were found. Three stationarity tests were performed on each gage’s daily rainfall data: (1) trend in Annual Maximum Series, (2) changes in the 99th percentile [roughly 2.8 – 3.1 inches per day] of daily rainfall between 1955-1984 and 1985-2016, and (3) trend in the number of days exceeding 1.5 inches of precipitation per year, termed the Peaks Over Threshold. For all tests, the null hypothesis was no change in the variable’s value, implying that stationarity can be accepted over the historical period. For tests (1) and (3), a trend was classified as significant if it exceeded the 95% confidence level. A rejection of the null hypothesis suggests that the stationarity assumption may be violated. In turn, a rejection of the null hypothesis also suggests that a more in-depth analysis may be warranted to attribute the reasons why the null hypothesis was rejected.

Sweetwater Creek Feasibility Report
39
Results are shown in Figure 25. Overall, it was determined that stationarity is a reasonable assumption for the area. There were no significant spatially prevalent trends in the Annual Maximum Series. Slightly more stations showed weak decreases, compared to increases in the 99th percentile of daily rainfall, though the magnitude of the changes was not statistically significant. Finally, only 3 out of 38 stations showed significant upward trends in Peaks Over Threshold, which is not significant enough to disprove the null hypothesis of stationarity in the basin. It is important to note, however, that these trends may not hold in the future, and it is recommended that these analyses be re-assessed every few years as more data is collected and/or more gages can serve as a “qualifying” gage.
Streamflow The USACE Non-Stationarity Tool tests were used to assess possible trends and change points in peak streamflow at the long-record USGS gage on Sweetwater Creek near Austell, Georgia. Figure 26 shows the time series of Annual Peak Streamflow (APF).
Figure 25: Stationarity test results on qualifying gages: (a) trend in Annual Maximum Series, (b) change in the 99th percentile of daily rainfall, and (c) trend in Peaks Over Threshold [1.5 inches per day]. The Sweetwater basin is shown in green.

Sweetwater Creek Feasibility Report
40
Figure 26: Water Year Peak Streamflow at the Sweetwater Creek USGS gage near Austell, Georgia.
The following 16 tests were conducted on the APF time series shown in Figure 16. Tests 1-12 are used to detect change points in the distribution, mean, and variance of the time series. These can be useful in detecting addition/removal of water control structures, as well as changes in land cover. Meanwhile, tests 13-16 are used to analyze long term trends. As with the rainfall analysis, the null hypothesis was stationarity over the period of record. The variety of tests is essential for increasing confidence in the overall stationarity analysis. Significant findings in one or two tests are generally not enough to declare non-stationarity.
• Cramer-von-Mises distribution • Kolmogorov-Smirnov distribution • LePage distribution • Energy Divisive distribution • Lombard (Wilcoxon) abrupt mean • Pettitt mean • Mann-Whitney mean • Bayesian mean • Lombard (Mood) abrupt variance • Mood variance • Lombard (Wilcoxon) smooth mean • Lombard (Mood) smooth variance • Mann-Kendall trend • Spearman rank trend • Parametric trend • Sen’s slope trend

Sweetwater Creek Feasibility Report
41
Of the 16 tests, only tests 5 and 9 produced a result that rejected the null hypothesis and suggested non-stationarity. Test 5 showed 1937 as a potential change point year in the mean, though this was dismissed due to the long period of missing data in the 1910s and 1920s. Test 9 suggested 2011 as a potential change point in the variance, though this was also dismissed because it appeared that this may be a statistical artifact of the very high flow in 2009. However, it is recommended that the variance changes should be closely monitored in the coming years to see if the 2009 peak was indeed an anomaly. Importantly, none of the four trend tests showed non-stationarity.
Climate Hydrology Assessment Tool
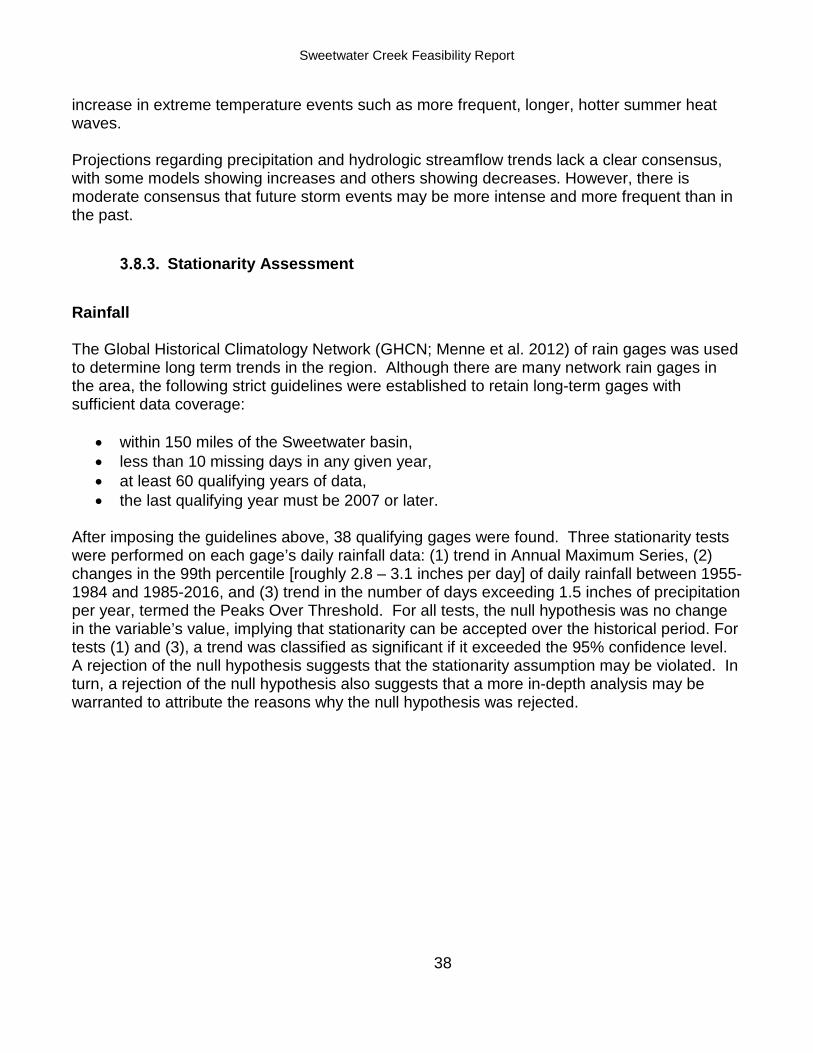
In addition to the stationarity assessment, the USACE Climate Hydrology Assessment Tool (PROD v1.2) was also used to assist in the determination of future streamflow conditions. This analysis indicated no statistical significance for annual peak instantaneous streamflow in the basin as indicated by a high p-value. Figure 27 shows the Climate Hydrology Assessment Tool output. A HUC-4 level analysis for mean projected annual maximum monthly streamflow indicated upward trends for the Apalachicola Basin projections, as shown in Figure 28. This finding suggests there may be potential for increased flood risk in the future, however this result is qualitative only. Given the absence of significant trends in rainflow and streamflow from the Stationarity assessment as well as and the annual peak instantaneous streamflow from the Climate Hydrology tool, it is appropriate to assume the potential impacts of climate change fall within the uncertainty of the hydrologic method.
Figure 27: Annual Peak Instantaneous Streamflow for Sweetwater Creek Near Austell, GA
Value = 5.51962*Water Year-5908.66 R-Squared: 0.0013405 P-Value: 0.745554
Sweetwater Creek Feasibility Report
42
Figure 28. Mean Projected Annual Max Monthly Streamflow for HUC 0313- Apalachicola
Monthly Flow = 36.6179*Year of Water Year-7345.69 R-Squared: 0.14232 P-Value: 0.0001085
3.9. HTRW Analysis
The phase 1 HTRW analysis is currently underway. Results of this analysis will be included in future reports.
4. Hydrologic and Hydraulic Modeling
4.1. Terrain and Geometric Data
Digital Terrain Development
A basin wide terrain was developed for the Sweetwater Creek watershed based on best available digital terrain data sources including: Cobb County 2015 LiDAR data, Douglas County 2003 2-foot contours, and USGS National Elevation Dataset (NED) for Paulding and Carroll Counties. These three datasets were combined into a seamless terrain using USA Contiguous Albers Equal Area Conic USGS version and the North American Vertical Datum of 1988. Due to the unavailability of LiDAR data in Paulding County, USGS NED data was considered the best available data. However this topographic information is less accurate than the other sources, which may result in less accurate modeling along those reaches in Paulding County.

Sweetwater Creek Feasibility Report
43
Field Reconnaissance and Survey Data
Field reconnaissance was performed for structures located along study reaches that differed from the structures modeled in the effective studies, for any newly added structures, and for structures along new limited detail reaches. Basic dimensions were estimated and structures were updated within the hydraulic model. Additionally, after the September 2009 flood, survey data was collected along Sweetwater Creek, which indicated large scour holes at bridges. Since the effective FEMA HEC-RAS model reflected these scour locations, field reconnaissance was performed to confirm their current existence after significant time had passed to allow for deposition of sediment and filling in of the scour holes. The effective models were
4.2. Rainfall Data and Reconstruction
Three historic rainfall events which resulted in significant flood discharges along major sections of Sweetwater Creek were utilized to support the without-project conditions hydrologic and hydraulic model calibration. These events were selected to enable calibration to be performed for a variety of flow conditions incrementally from the smallest flood discharges to the highest flood discharges. In addition to these three observed rainfall events, smaller events which resulted in flood discharges being contained within the channel were utilized to calibrate in-channel n-values incrementally utilizing vertical variations in Manning’s n value to optimize the timing and attenuation of in-channel flows. The observed hydrographs for these smaller events were input directly into the HEC-RAS model. Performing calibrations incrementally from the smallest in-channel discharges to the largest out-of-bank flooding events enabled the impacts of calibration actions to be separated for the in-channel and overbank characteristics. Table 4 summarizes the events used for calibration and validation. While other rainfall events with significant flooding have been observed as documented by USGS gage annual maximum discharge records, more recent events were selected due to the availability of more detailed rainfall observations through a combination of ground based precipitation gages and the availability of NOAA Stage IV Radar. Additionally, the availability of full hydrographs at gages, documented highwater marks, and witness accounts were utilized to select events.
Figure 29: Field Reconnaissance collected at Bennett Road along Mill

Sweetwater Creek Feasibility Report
44
Since the September 2009 flood event was estimated to be greater than a 0.2% annual chance flood with a very large uncertainty in the 17C statistical analysis (Table 8), this event was utilized for validation and demonstration purposes only and was not used to calibrate runs.
Table 4: Summary of Calibration Events
Flood Event Primary Purpose of Calibration Event
Peak Discharge in Austell (cfs) at Gage
02337000
Estimated Peak Flood Recurrence Interval (based on Table 8)
November 2014 storm event
Calibration of low-flow near bank-full channel routing using
observed hydrograph 1,280 <50%
June 2013 storm event Calibration of low-flow in-channel routing using observed
hydrograph 1,690 <50%
February 2016 event Calibration of low-flow near bank-full channel routing using
observed hydrograph 1,960 <50%
November 2009 Flood (2010 water year)
Rainfall-runoff calibration of minor overbank flooding 6,120 20%
July 2005 Flood (2005 water year)
Rainfall-runoff calibration of major flooding 7,600* 10%
September 2009 Flood (2009 water year)
Rainfall-runoff validation of extreme flooding event 31,500* >0.2%
*Value is estimated by USGS
Historical Events
Rainfall reconstructions were completed for the Annual Peak Streamflow events corresponding to the 2005, 2009, and 2010 water years. Table 5 shows the temporal extent of rainfall collection for each event.
Table 5: Historical storms used for the Sweetwater Basin study
The temporal extents of rainfall, of critical importance for subsequent H&H modeling, were subjectively determined using time series of rainfall and streamflow data within and in close proximity to the basin. For example, Figure 30 shows the streamflow time series from the September 2009 event. Note that despite multiple streamflow spikes over the September 15-21 period, the main event occurred from midnight of September 20th through the afternoon of

Sweetwater Creek Feasibility Report
45
September 21st. Figure 31 shows the core precipitation period used for analysis identified by the vertical black lines.
Figure 30: Stream gage height for the Olley Creek USGS station during the September 2009 event.
Figure 31: Accumulated precipitation at several rainfall gages within the basin (note that several gages stopped working on September 20th).

Sweetwater Creek Feasibility Report
46
After each event’s temporal period was determined, NOAA Stage IV gridded precipitation data was obtained from the UCAR data server (https://data.eol.ucar.edu/dataset/113.003). Stage IV is an hourly quality controlled rainfall product available on a 4 km (2.6 mile) grid across the United States. The hourly rainfall data was bi-linearly spatially interpolated to a 1 km grid. In addition, the hourly data was temporally linearly disaggregated to a 15-minute timestep (i.e. hourly precipitation was equally divided into four 15-minute bins). All processing was done using R statistical software (version 3.2.2). The gridded rainfall reconstruction was quality controlled using rain gages from a variety of data streams. The primary sources are listed below, although not all sites have data for every event:
• USGS - https://waterdata.usgs.gov/ga/nwis/rt
• NCEI - https://www.ncei.noaa.gov/ • Community Collaborative Rain, Hail & Snow Network (CoCoRaHS) - www.cocorahs.org • Weather Underground Personal Weather Stations – http://www.wunderground.com • MesoWest -http://www.wunderground.com/ http://mesowest.utah.edu/index.html • RAWS - http://www.raws.dri.edu/index.html • NADP - http://nadp.sws.uiuc.edu/
Figure 8 shows the reconstructed and observed rainfall data for each event. For illustrative purposes, the September 2009 event (8a) is shown on the raw Stage IV 4-km grid, while the other two events are shown on the final 1-km grid. Due to the ubiquitous highly inhomogeneous nature of heavy rainfall, along with limited rain gages, a perfect rainfall reconstruction is virtually impossible. However, a 10% error margin was used as a threshold to validate the reconstruction. As Figure 33 shows, this was attained at the majority of the rain gages used for quality control. There were some areas where underestimates were noted, though these occurred mainly in regions with strong gradients in accumulation. These underestimates were reduced after the interpolation to the 1-km grid (not shown). Thus, aside from spatial and temporal interpolation,
Figure 32: Comparison of observed and reconstructed rainfall for the September 2009 event

Sweetwater Creek Feasibility Report
47
no additional processing of Stage IV data was warranted as the interpolated grids were deemed reasonable to serve as input into the H&H modeling.
Design Rainfall
Because each heavy rainfall event is unique with high variability across even a small area, a “design storm” is used to create a more objective and homogenous rainfall pattern that can be used for engineering purposes. NOAA Atlas 14 (Atlas 14) was used to develop design storms for the following Annual Exceedance Probabilities: 50%, 20%, 10%, 4%, 2%, 1%, 0.5%, and 0.2%. Due to the Sweetwater basin’s relatively small area (260 sq. mi.), a single precipitation value was used over the full basin (it was confirmed that there is negligible variability in Atlas 14 guidance across the basin). Because Atlas 14 estimates are “point-specific”, an Areal Reduction Factor (ARF) was required in order to reduce the value by accounting for increasing basin area size. The following ARF equation, obtained from Allen and Degaetno, (2005) was used:
where t is event duration (hour) and A is area (km2). The coefficients a and c as well as the exponent b are empirically fit with a=-1.1, c=2.59490E-2 and b=0.25. With t = 24 hours and A = 670 km2, an ARF of 0.91 was obtained. Table 6 shows the design rainfall values, before and after applying the ARF, used for the 24-hour and 48-hour design storms.
Table 6: Design rainfall values, before and after applying the ARF to the NOAA Atlas 14 rainfall amount
24-hour 48-hour
AEP Return Period Atlas 14 With ARF Atlas 14 With ARF
Figure 33:Comparison of observed and reconstructed rainfall for the November 2009 event
Figure 34: Comparison of observed and reconstructed rainfall for the July 2005 event
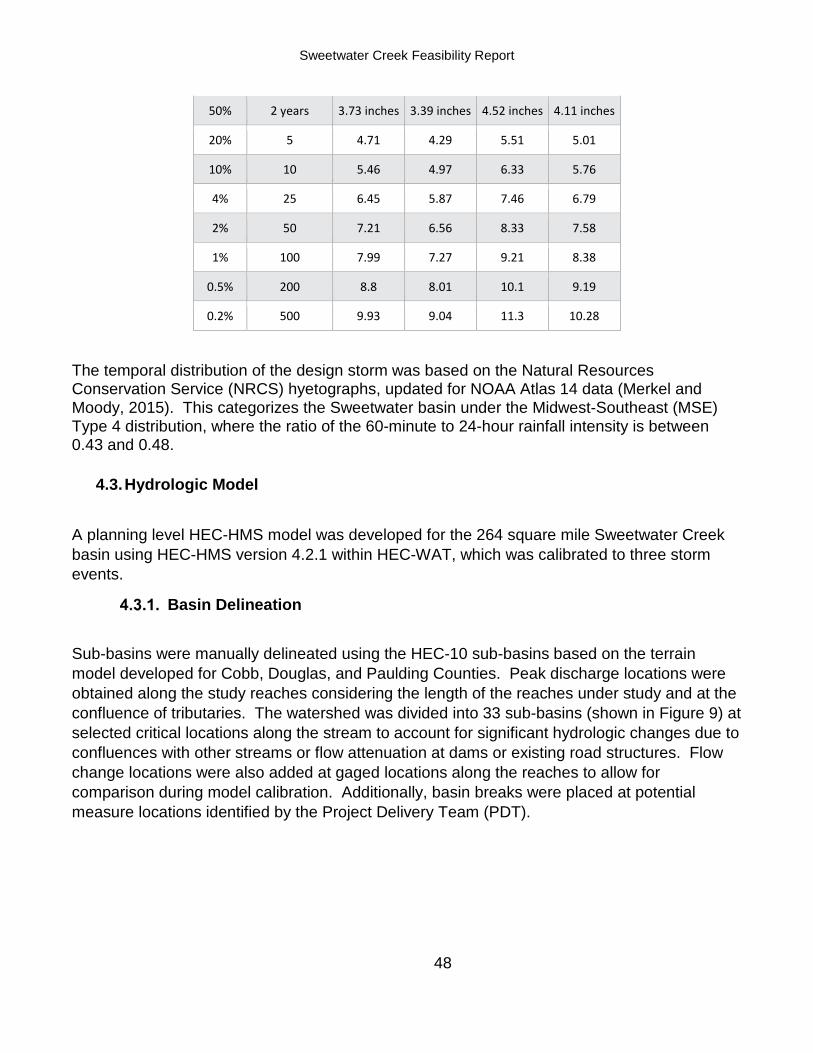
Sweetwater Creek Feasibility Report
48
50% 2 years 3.73 inches 3.39 inches 4.52 inches 4.11 inches
20% 5 4.71 4.29 5.51 5.01
10% 10 5.46 4.97 6.33 5.76
4% 25 6.45 5.87 7.46 6.79
2% 50 7.21 6.56 8.33 7.58
1% 100 7.99 7.27 9.21 8.38
0.5% 200 8.8 8.01 10.1 9.19
0.2% 500 9.93 9.04 11.3 10.28
The temporal distribution of the design storm was based on the Natural Resources Conservation Service (NRCS) hyetographs, updated for NOAA Atlas 14 data (Merkel and Moody, 2015). This categorizes the Sweetwater basin under the Midwest-Southeast (MSE) Type 4 distribution, where the ratio of the 60-minute to 24-hour rainfall intensity is between 0.43 and 0.48.
4.3. Hydrologic Model
A planning level HEC-HMS model was developed for the 264 square mile Sweetwater Creek basin using HEC-HMS version 4.2.1 within HEC-WAT, which was calibrated to three storm events.
Basin Delineation
Sub-basins were manually delineated using the HEC-10 sub-basins based on the terrain model developed for Cobb, Douglas, and Paulding Counties. Peak discharge locations were obtained along the study reaches considering the length of the reaches under study and at the confluence of tributaries. The watershed was divided into 33 sub-basins (shown in Figure 9) at selected critical locations along the stream to account for significant hydrologic changes due to confluences with other streams or flow attenuation at dams or existing road structures. Flow change locations were also added at gaged locations along the reaches to allow for comparison during model calibration. Additionally, basin breaks were placed at potential measure locations identified by the Project Delivery Team (PDT).
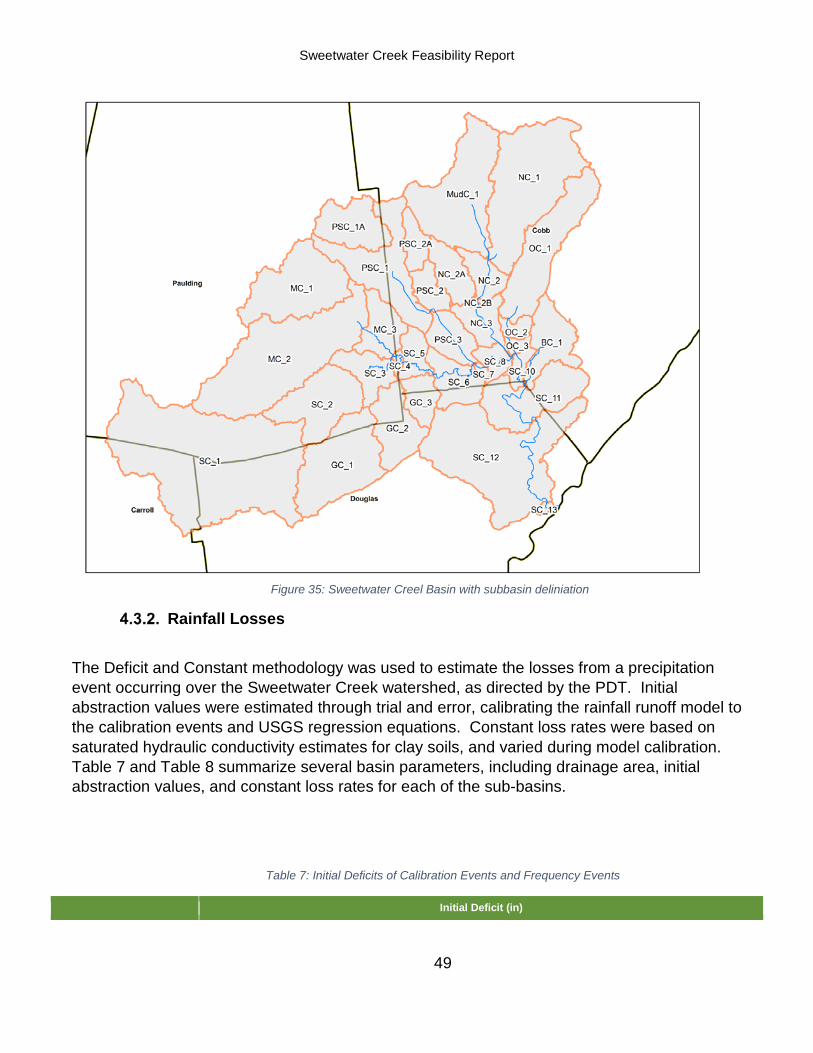
Sweetwater Creek Feasibility Report
49
Rainfall Losses
The Deficit and Constant methodology was used to estimate the losses from a precipitation event occurring over the Sweetwater Creek watershed, as directed by the PDT. Initial abstraction values were estimated through trial and error, calibrating the rainfall runoff model to the calibration events and USGS regression equations. Constant loss rates were based on saturated hydraulic conductivity estimates for clay soils, and varied during model calibration. Table 7 and Table 8 summarize several basin parameters, including drainage area, initial abstraction values, and constant loss rates for each of the sub-basins.
Table 7: Initial Deficits of Calibration Events and Frequency Events
Initial Deficit (in)
Figure 35: Sweetwater Creel Basin with subbasin deliniation

Sweetwater Creek Feasibility Report
50
Sub-basin Drainage Area (sq. mi) Nov-09 Jul-05 Sep-09 50% 20% 10% 4% 2% 1% 0.5% 0.2%
SC 1 41.8 2.4 2.4 2.4 1.9 1.8 1.8 1.6 0.75 0.4 0.3 0.2
SC 2 9.7 2.4 2.4 2.4 1.9 1.8 1.8 1.6 0.75 0.4 0.3 0.2
SC_3 4.3 2.4 2.4 2.4 1.9 1.8 1.8 1.6 0.75 0.4 0.3 0.2
MC_1 24.2 2.4 2.4 2.4 1.9 1.8 1.8 1.6 0.75 0.4 0.3 0.2
MC 2 12.7 2.4 2.4 2.4 1.9 1.8 1.8 1.6 0.75 0.4 0.3 0.2
MC 3 4.8 2.4 2.4 2.4 1.9 1.8 1.8 1.6 0.75 0.4 0.3 0.2
SC_4 0.5 2.2 2.2 2.2 1.9 1.8 1.8 1.6 0.75 0.4 0.3 0.2
SC_5 2.8 2.2 2.2 2.2 1.9 1.8 1.8 1.6 0.75 0.4 0.3 0.2
GC_1 13.2 2.2 2.2 2.2 1.9 1.8 1.8 1.6 0.75 0.4 0.3 0.2
GC 2 6.7 2.2 2.2 2.2 1.9 1.8 1.8 1.6 0.75 0.4 0.3 0.2
GC 3 3.2 2.2 2.2 2.2 1.9 1.8 1.8 1.6 0.75 0.4 0.3 0.2
SC_6 4.9 2.2 2.2 2.2 1.9 1.8 1.8 1.6 0.75 0.4 0.3 0.2
PSC_1A 11.3 2.6 2.6 2.6 1.9 1.8 1.8 1.6 0.75 0.4 0.3 0.2
PSC_1 6.5 2.6 2.6 2.6 1.9 1.8 1.8 1.6 0.75 0.4 0.3 0.2
PSC 2A 3.3 2.6 2.6 2.6 1.9 1.8 1.8 1.6 0.75 0.4 0.3 0.2
PSC_2 2.6 2.6 2.6 2.6 1.9 1.8 1.8 1.6 0.75 0.4 0.3 0.2
PSC_3 4.2 2.6 2.6 2.6 1.9 1.8 1.8 1.6 0.75 0.4 0.3 0.2
SC_7 0.4 2.6 2.6 2.6 1.9 1.8 1.8 1.6 0.75 0.4 0.3 0.2
SC 8 2.0 2.6 2.6 2.6 1.9 1.8 1.8 1.6 0.75 0.4 0.3 0.2
NC 1 20.1 2.5 2.5 2.5 1.9 1.8 1.8 1.6 0.75 0.4 0.3 0.2
MudC_1 16.3 2.5 2.5 2.5 1.9 1.8 1.8 1.6 0.75 0.4 0.3 0.2
NC_2 3.4 2.3 2.3 2.3 1.9 1.8 1.8 1.6 0.75 0.4 0.3 0.2
NC_2A 4.2 2.3 2.3 2.3 1.9 1.8 1.8 1.6 0.75 0.4 0.3 0.2
NC 3 3.8 3 3 3 1.9 1.8 1.8 1.6 0.75 0.4 0.3 0.2
OC_1 12.3 2.1 2.1 2.1 1.9 1.8 1.8 1.6 0.75 0.4 0.3 0.2
OC_2 1.3 1.8 1.8 1.8 1.9 1.8 1.8 1.6 0.75 0.4 0.3 0.2
OC_3 0.8 1.8 1.8 1.8 1.9 1.8 1.8 1.6 0.75 0.4 0.3 0.2
SC 9 0.02 1.8 1.8 1.8 1.9 1.8 1.8 1.6 0.75 0.4 0.3 0.2
SC 10 1.5 1.8 1.8 1.8 1.9 1.8 1.8 1.6 0.75 0.4 0.3 0.2
BC_1 6.2 1.8 1.8 1.8 1.9 1.8 1.8 1.6 0.75 0.4 0.3 0.2
SC_11 9.8 1.8 1.8 1.8 1.9 1.8 1.8 1.6 0.75 0.4 0.3 0.2
SC_12 24.6 1.8 1.8 1.8 1.9 1.8 1.8 1.6 0.75 0.4 0.3 0.2
SC 13 0.4 1.8 1.8 1.8 1.9 1.8 1.8 1.6 0.75 0.4 0.3 0.2

Sweetwater Creek Feasibility Report
51
Table 8: Constant Loss Rates for Calibration Events and Frequency Events
Sub-basin Nov-09 Jul-05 Sep-09 50% - 0.2% Design Storm Events
SC_1 0.03 0.03 0.03 0.03
SC 2 0.03 0.03 0.03 0.03
SC 3 0.03 0.03 0.03 0.03
MC 1 0.03 0.03 0.03 0.03
MC_2 0.03 0.03 0.03 0.03
MC_3 0.03 0.03 0.03 0.03
SC_4 0.03 0.03 0.03 0.03
SC 5 0.03 0.03 0.03 0.03
GC_1 0.03 0.03 0.03 0.03
GC_2 0.03 0.03 0.03 0.03
GC_3 0.03 0.03 0.03 0.03
SC 6 0.03 0.03 0.03 0.03
PSC 1A 0.07 0.07 0.07 0.03
PSC_1 0.07 0.07 0.07 0.03
PSC_2A 0.07 0.07 0.07 0.03
PSC_2 0.07 0.07 0.07 0.03
PSC 3 0.07 0.07 0.07 0.03
SC_7 0.07 0.07 0.07 0.03
SC_8 0.07 0.07 0.07 0.03
NC_1 0.1 0.1 0.1 0.03
MudC 1 0.1 0.1 0.1 0.03
NC 2 0.1 0.1 0.1 0.03
NC_2A 0.1 0.1 0.1 0.03
NC_3 0.1 0.1 0.1 0.03
OC_1 0.03 0.03 0.03 0.03
OC 2 0.03 0.03 0.03 0.03
OC_3 0.03 0.03 0.03 0.03
SC_9 0.03 0.03 0.03 0.03
SC_10 0.03 0.03 0.03 0.03
BC 1 0.03 0.03 0.03 0.03
SC 11 0.03 0.03 0.03 0.03
SC_12 0.03 0.03 0.03 0.03
SC_13 0.03 0.03 0.03 0.03

Sweetwater Creek Feasibility Report
52
Sub-basin Response
The ModClark transform method was used for this study. The initial time of concentration values for each sub-basin were calculated following the methodology given in USGS Lagtime Relations For Urban Streams in Georgia (WRIR 00-4049), and were adjusted to match the observed hydrographs at gaged locations. Final times of concentration and storage coefficients for this basin are shown in Table 9.
Table 9: Transform Parameters for Subbasin Response
Sub-basin Time of Concentration
Storage
SC 1 10 25
SC 2 7 16.7
SC 3 5 12
MC 1 7 21.8
MC 2 8 18.2
MC 3 5 12.6
SC 4 3.8 10
SC 5 5.2 15
GC 1 9.5 20
GC 2 5.1 18
GC 3 4.1 18
SC 6 7.1 21
PSC 1A 5 10
PSC 1 4 9
PSC 2A 2 6
PSC 2 2.5 9
PSC 3 3.7 10
SC 7 1.4 9
SC 8 3.5 11
NC 1 5.1 14
MudC 1 5 14
NC 2 3.5 12
NC 2A 3 12
NC 3 3.5 12
OC 1 6.6 18
OC 2 2.1 10
OC 3 1.4 9

Sweetwater Creek Feasibility Report
53
SC 9 1 9
SC 10 2.6 15
BC 1 4.2 15
SC 11 6.4 23
SC 12 8.7 25
SC 13 1.8 14
Reach Routing
Where FEMA effective models or new limited detailed models were available, Modified Puls reach routing was applied, utilizing the discharge-storage curves generated by these models. However, since these reaches were dynamically routed in HEC-RAS, modified Puls routing was only used for initial HEC-HMS model calibrations. For hydrology only reaches along upstream portions of Sweetwater Creek and Mill Creek that did not have HEC-RAS models available, sub-basin reach routings were estimated using the Muskingum-Cunge method with Eight Point cross section shape. The seamless terrain data was used to determine cross sections profile, slope, and length of the reaches for the studied streams. Aerial imagery was used to estimate the Manning’s n-value for the reach routing.
Gage analysis
There are seven USGS stream gages in the Sweetwater Creek watershed, however only the gage along Sweetwater Creek near Austell, GA (02337000) has an adequate period of record for a frequency analysis of rare flood events with 101 years of record. The gage along Noses Creek at Powder Springs Road near Powder Springs, GA (02336968) has 17 years of record but the gage can only record up to 3000 cfs, which has been exceeded twice. Therefore, the data is only suitable for hydraulic model calibration, and gage analysis was only evaluated for the gage at Sweetwater Creek near Austell, GA (02337000).
For the Sweetwater Creek near Austell, GA gage, there are two gaps in the data record for this site. The record has flows for 1904, 1905, 1916 and 1937-2016, and so the analysis considered several options. When there are flow events in the record prior to the continuous record, the events can be either Historical events or simply additional data points. A Historical event by definition is the largest event between that date and the end of the subsequent gap. The 1904 and 1905 flows were not flagged as historical events in the USGS record. These events also extend the period of record to 113 years, resulting in frequency flow estimates that are smaller than those obtained using the shorter but continuous period of record (1937-2016). These values can be eliminated because it is not certain that there were no larger events

Sweetwater Creek Feasibility Report
54
between 1905 and 1916. The 1916 event is listed as a historical event, however, it was not an exceptionally large event, and it extends the period of record by 21 years. The net effect is a reduction in the various frequency flow estimates.
The US Army Corps of Engineers (USACE) Statistical Software Package (HEC-SSP) program was used to calculate the frequency flows. Table 10 shows a comparison of 100-year peak discharges obtained by varying skew and period of record variables.
Table 10: 100-Year Frequency Flows using Multiple Methods
Program Skew Period Years of Record
# of Events
Historical Events
1% Flows (cfs)
HEC-SSP 17C EMA Station 1916-2016 101 81 0 17,845
HEC-SSP 17C EMA Weighted 1916-2016 101 81 1 16,003
HEC-SSP 17C EMA Station 1937-2016 80 80 0 18,300
2009-5043 Report Regression Equation
(246 sq mi)
n/a n/a n/a n/a n/a 20,400
The regression equations for Georgia produce results that are very similar to the HEC-SSP analysis of the 1937-2016 systematic record with the Station skew. Therefore, the HEC-SSP result for the period 1937 to 2016 with Station skew was used as the gage estimate. The results are shown in Table 11.
Table 11: Gage Estimate of Flows at USGS Gage # 02337000
Frequency 50% Flows
20% Flows
10% Flows 4% Flows 2% Flows 1% Flows 0.5% Flows 0.2% Flows
Gage Flow, cfs 3,780 6,157 8,241 11,572 14,645 18,300 22,249 29,682
HMS Calibration
Hydrologic and hydraulic models were calibrated in conjunction with each other based on observed flow hydrographs as well as observed stage for the three specified events in order to consider the effects of routing in the unsteady RAS model. Within the HMS model, the initial values for the time of concentration (Tc) used in the Mod-Clark transform method were calculated from the formula given in USGS Lagtime Relations For Urban Stream in Georgia (WRIR 00-4049). The initial storage coefficients were set at 2 times the Tc. The Initial Soil Deficit and Constant Loss were set at 2 inches and 0.03 inches per hour, respectively. These parameters were then adjusted to match the observed hydrographs at the gage locations

Sweetwater Creek Feasibility Report
55
within RAS where available. Due to the unavailability of data for the July 2005 event and uncertainty in flow and stage estimates for the September 2009 event, the weight of the HMS calibration focused on the November 2009 event. Using the parameters established during the November 2009 calibration resulted in flows that matched reasonably well for the July 2005 and September 2009 events. Table 12 summarizes the calculated Nash-Sutcliffe values provided at gaged locations from the HMS model where observed hydrographs were available. Nash-Sutcliffe values provide an indication of model accuracy and can range from 0 – 1, where the closer the value is to 1, the more accurate the match is to the observed data. Figure 36- Figure 38 graphically display the HMS calibration model output compared to the available observed data.
Table 12: Nash-Sutcliffe Values from HEC-HMS Calibration Events
Event Node Nash-Sutcliffe Value
November 2009
J6 0.972
J12 0.938
J_18 0.946
J_26 0.731
J_27 0.977
July 2005 N/A N/A
September 2009
N/A N/A

Sweetwater Creek Feasibility Report
56
Figure 36: Calibration at USGS gage on Sweetwater Creek
Figure 37: Calibration at USGS gage on Sweetwater Creek

Sweetwater Creek Feasibility Report
57
Figure 38: Calibration at USGS gage on Sweetwater Creek
Design Storm Events
Rain grids for the 24-hour and 48-hour storms were created for the 50%, 20%, 10%, 4%, 2%, 1%, 0.5% and 0.2% storm events. The 48-hour analysis resulted in lower flows than the 24-hour storms, and therefore the 24-hour storms were selected for further analysis. In order to calibrate the design storms to USGS regression equations and gage analysis results, initial abstraction values were varied as described in Table 4. Models were also run using grids with and without ARF applied. Results using ARF grids generated flows that were generally low compared to the USGS regression and gage analysis results, therefore the design rainfall grids for this model did not use any areal reduction factors. Table 13 and Figure 39 compare the regression equation and gage analysis results to the HEC-WAT model output. Table 14 summarizes the flows at several locations throughout the existing conditions basin after routing through HEC-RAS.
Table 13: Comparison of Frequency Flows using Various Methods
Percent chance exceedance
Regression Percent chance exceedance
flow, in ft3/s*
Regression Lower 95% prediction interval flow, in
ft3/s*
Regression Upper 95% prediction interval flow, in
ft3/s* Gage Analysis
flow, in ft3/s HEC-WAT
flow, in ft3/s

Sweetwater Creek Feasibility Report
58
50 5,540 2,880 10,600 3,780 4,260
20 9,140 4,800 17,400 6,157 6,829
10 11,700 6,030 22,700 8,241 8,716
4 14,800 7,320 29,900 11,572 11,738
2 17,600 8,380 37,000 14,645 15,037
1 20,100 9,200 43,900 18,300 17,492
0.5 22,400 9,840 51,000 22,649 18,598
0.2 26,100 10,800 62,900 29,682 21,080
*Based on USGS Magnitude and Frequency of Rural Floods in Southeastern United States, 2006: Volume 1.
Figure 39: Flow Comparison at Sweetwater Creek near Austell, GA.
Error bars indicate upper and lower 95% confidence intervals.
Table 14: Summary of Existing Conditions Discharges throughout Basin
Station ID & Name XS Area (sq. mi)
50% (cfs)
20% (cfs)
10% (cfs)
4% (cfs)
2% (cfs)
1% (cfs)
0.50% (cfs)
0.20% (cfs)
0
10000
20000
30000
40000
50000
60000
70000
80000
90000
100000
1 10 100 1000
Flow
, cfs
Return Period
Sweetwater Creek near Austell, GA (02337000)
Design Flows Gage Analysis Flows Regression Flows with 95% Confidence Interval

Sweetwater Creek Feasibility Report
59
SC 130930.8 55.75 1,312 2,374 3,149 4,310 5,846 6,958 8,250 8,880
MC 184.7 41.74 1,086 1,747 2,259 3,281 4,189 4,727 5,088 6,048
02336840 - SC at Brownsville Rd SC 124657.1 97.95 2,282 3,898 5,070 7,536 9,443 10,375 11,558 13,822
SC 113107.7 100.76 1,988 3,528 4,696 6,426 7,671 9,669 11,293 12,792
SC 93306.57 128.73 2,382 4,246 5,628 7,952 9,594 11,777 13,527 15,259
02336870 - PSC near Powder Springs PSC 16955.77 23.78 1,541 2,436 3,003 3,952 5,066 5,696 5,906 6,501
PSC 79.1615 27.99 1,109 2,077 2,426 3,706 4,582 4,918 5,041 5,434
02336910 - SC USRR bridge at Austell SC 88432.13 157.09 2,634 4,551 5,936 8,823 10,886 13,107 14,781 17,059
SC 75678.23 159.08 2,718 4,641 5,967 8,693 10,776 12,984 14,663 16,710
02336968 - NC at Powder Springs NC 17633.95 43.94 1,636 2,846 3,710 5,097 6,675 8,468 9,472 10,545
NC 2193.528 47.77 1,505 2,429 3,013 4,113 5,130 6,124 7,219 8,237
OC 778.4826 14.42 420 592 753 1,006 1,155 1,200 1,350 1,352
SC 63836.73 222.74 4,115 6,648 8,458 11,410 14,523 16,976 18,750 20,758
02337000 - SC near Austell SC 37865.18 238.73 4,261 6,829 8,716 11,738 15,037 17,492 18,598 21,081
02337040 - SC below Austell SC 5327.794 263.35 4,558 7,256 9,269 12,517 16,140 18,470 19,715 22,337
SC 1538.054 263.73 4,555 7,256 9,270 12,520 16,147 18,477 19,724 22,344
4.4. Hydraulic Modeling Approach
Utilizing best available hydraulic models for the study area, a single network HEC-RAS model was developed for the study reaches. The models listed in Table 15 were upgraded to a HEC-RAS version 5.0.3 unsteady state model. Additionally, 5 miles of new limited detail study reaches were developed along the upstream portions of Sweetwater Creek and Mill Creek. For the hydraulic simulations, all structures were assumed to remain fully functional and have unobstructed flows.
Table 15: Best Available HEC-RAS Models
Creek Name Model Date
Model Name/Source HEC-RAS Version
Miles Studied

Sweetwater Creek Feasibility Report
60
Geometry was revised where necessary to better tie into the more recent topographic data. Structures were verified during field reconnaissance and new structures were added if not reflected in the effective models. Numerous structures along Powder Springs Creek appeared to be modeled using older HEC hydraulic programs and did not appear to reflect existing conditions. These structures were updated with refined cross sections and deck information estimated from aerial imagery, topographic information and field reconnaissance.
Boundary Conditions and Tie-ins
Reach connectivity for the individual studies was established by modeling the confluences of the study reaches as junctions. The downstream boundary condition where Sweetwater Creek confluences with the Chattahoochee River was modeled using the normal depth method, where the energy slope was estimated by measuring the channel bed slope along the downstream end of Sweetwater Creek. This will enable a direct comparison of project impacts along Sweetwater Creek without the backwater conditions of the Chattahoochee River.
Cross Sections
Cross sections from effective models were reviewed to ensure that they would be considered appropriate for an unsteady state model with updated flows. Modifications were made to the
Sweetwater Creek (Cobb County)
2010 Sweetwater_Oct2010.prj/ Cobb County
4.0 12.9
Sweetwater Creek (Douglas County)
2010 SweetwaterCreekDouglasCounty.prj/ FEMA
4.0 12.3
Powder Springs Creek 2006 Powder2006.prj/ Cobb County
3.1.3 6.7
Noses Creek 2006 NosesCreek.prj/ Cobb County 3.1.3 6.3
Mud Creek 2006 MudCreek_CH06.prj/ Cobb County
3.1.3 2.9
Olley Creek 2005 Olley.prj/ Cobb County 3.1.1 2.8
Buttermilk Creek 2012 LDSTaskA.prj/ Cobb County 4.1.0 2.6
Mill Creek 2017 New Limited Detail 5.0.3 2.8
Sweetwater Creek (Paulding County)
2017 New Limited Detail 5.0.3 2.2
Total Miles 51.5

Sweetwater Creek Feasibility Report
61
cross section layout to capture any significant storage that may occur up tributaries to the main reaches and were generated utilizing the terrain developed for this watershed. Additional cross sections were added in locations that experienced approximately 3-5 feet of vertical change in energy grade. Cross sections for new limited detail reaches were modeled with similar methodologies.
Structures
All hydraulic structures along the study reaches were included in the combined unsteady state model. Several structures no longer reflected the existing conditions and were revised based on field reconnaissance, aerial imagery, and updated topographic information. This was particularly evident on Powder Springs Creek, where the structures appeared to be modeled using older HEC hydraulic programs. As an example, Figure 40 and Figure 41 show the difference between unrevised and revised bridge geometry for the structure at Brownsville Road.
The contraction and expansion coefficients of 0.3 and 0.5, respectively, were used for two cross sections upstream and one cross section downstream of a hydraulic structure. All other contraction and expansion values were kept at 0.1 and 0.3, respectively.
Figure 40: Brownsville Road Structure in Effective Model
0 200 400 600 800 1000 1200 1400 1600 1800890
895900
905
910915
920925
RS=16836.73Upstream (Bridge)
Ele
vatio
n (ft
)
Legend
Ground
Inef f
Bank Sta
0 200 400 600 800 1000 1200 1400 1600 1800890
895
900905
910
915
920925
RS=16836.73Downstream (Bridge)
Station (f t)
Ele
vatio
n (ft
)
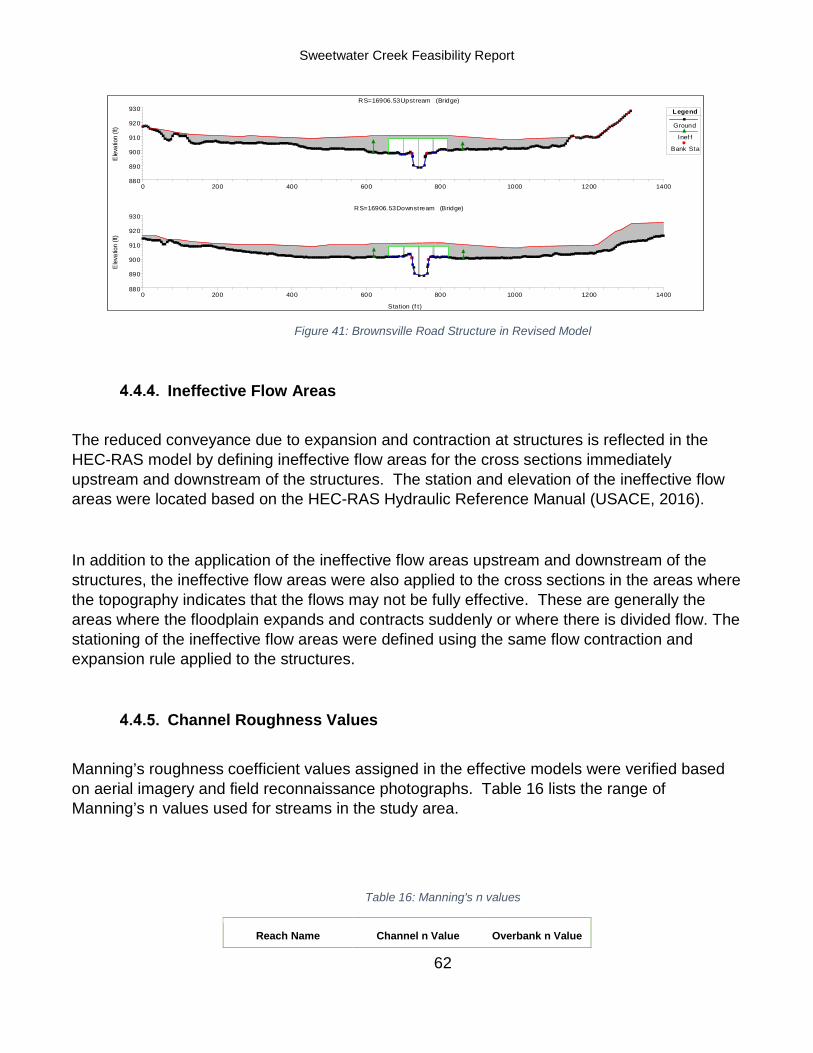
Sweetwater Creek Feasibility Report
62
Figure 41: Brownsville Road Structure in Revised Model
Ineffective Flow Areas
The reduced conveyance due to expansion and contraction at structures is reflected in the HEC-RAS model by defining ineffective flow areas for the cross sections immediately upstream and downstream of the structures. The station and elevation of the ineffective flow areas were located based on the HEC-RAS Hydraulic Reference Manual (USACE, 2016).
In addition to the application of the ineffective flow areas upstream and downstream of the structures, the ineffective flow areas were also applied to the cross sections in the areas where the topography indicates that the flows may not be fully effective. These are generally the areas where the floodplain expands and contracts suddenly or where there is divided flow. The stationing of the ineffective flow areas were defined using the same flow contraction and expansion rule applied to the structures.
Channel Roughness Values
Manning’s roughness coefficient values assigned in the effective models were verified based on aerial imagery and field reconnaissance photographs. Table 16 lists the range of Manning’s n values used for streams in the study area.
Table 16: Manning's n values
Reach Name Channel n Value Overbank n Value
0 200 400 600 800 1000 1200 1400880
890
900
910
920
930RS=16906.53Upstream (Bridge)
Elev
atio
n (ft
)Legend
Ground
Inef f
Bank Sta
0 200 400 600 800 1000 1200 1400880
890
900
910
920
930RS=16906.53Downstream (Bridge)
Station (f t)
Elev
atio
n (ft
)
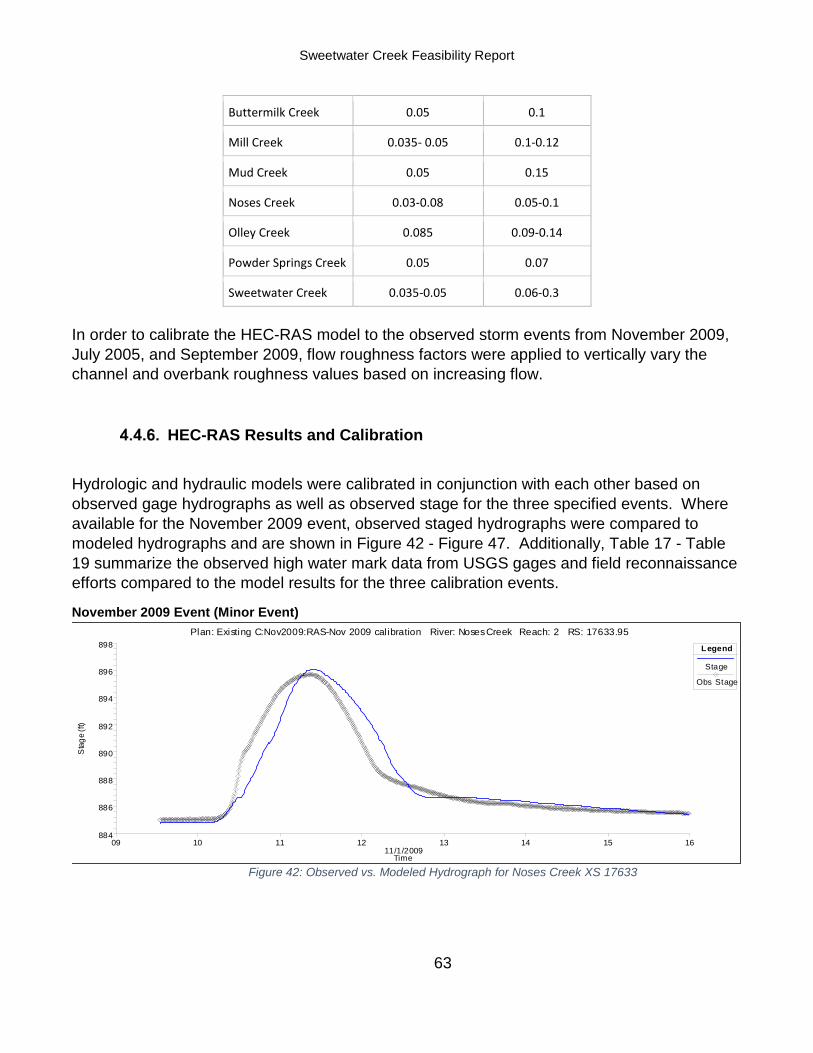
Sweetwater Creek Feasibility Report
63
Buttermilk Creek 0.05 0.1
Mill Creek 0.035- 0.05 0.1-0.12
Mud Creek 0.05 0.15
Noses Creek 0.03-0.08 0.05-0.1
Olley Creek 0.085 0.09-0.14
Powder Springs Creek 0.05 0.07
Sweetwater Creek 0.035-0.05 0.06-0.3
In order to calibrate the HEC-RAS model to the observed storm events from November 2009, July 2005, and September 2009, flow roughness factors were applied to vertically vary the channel and overbank roughness values based on increasing flow.
HEC-RAS Results and Calibration
Hydrologic and hydraulic models were calibrated in conjunction with each other based on observed gage hydrographs as well as observed stage for the three specified events. Where available for the November 2009 event, observed staged hydrographs were compared to modeled hydrographs and are shown in Figure 42 - Figure 47. Additionally, Table 17 - Table 19 summarize the observed high water mark data from USGS gages and field reconnaissance efforts compared to the model results for the three calibration events.
November 2009 Event (Minor Event)
Figure 42: Observed vs. Modeled Hydrograph for Noses Creek XS 17633
09 10 11 12 13 14 15 1611/1/2009
884
886
888
890
892
894
896
898Plan: Existing C:Nov2009:RAS-Nov 2009 calibration River: Noses Creek Reach: 2 RS: 17633.95
Time
Sta
ge (f
t)
Legend
Stage
Obs Stage

Sweetwater Creek Feasibility Report
64
Figure 43: Observed vs. Modeled Hydrograph for Olley Creek XS 5126
Figure 44: Observed vs. Modeled Hydrograph for Powder Springs Creek XS 16955
Figure 45: Observed vs. Modeled Hydrograph for Sweetwater Creek XS 124657
09 10 11 12 13 14 15 1611/1/2009
880
881
882
883
884
885
886
887
888Plan: Existing C:Nov2009:RAS-Nov 2009 calibration River: Olley Creek Reach: 1 RS: 5126.284
Time
Sta
ge (f
t)
Legend
Stage
Obs Stage
Missing Data
09 10 11 12 13 14 15 1611/1/2009
890
892
894
896
898
900
902Plan: Existing C:Nov2009:RAS-Nov 2009 calibration River: PowderSpringsCrk Reach: 1 RS: 16955.77
Time
Sta
ge (f
t)
Legend
Stage
Obs Stage
09 10 11 12 13 14 15 1611/1/2009
888
890
892
894
896
898
900
902Plan: Existing C:Nov2009:RAS-Nov 2009 calibration River: Sweetwater Creek Reach: 2 RS: 124657.1
Time
Sta
ge (f
t)
Legend
Stage
Obs Stage
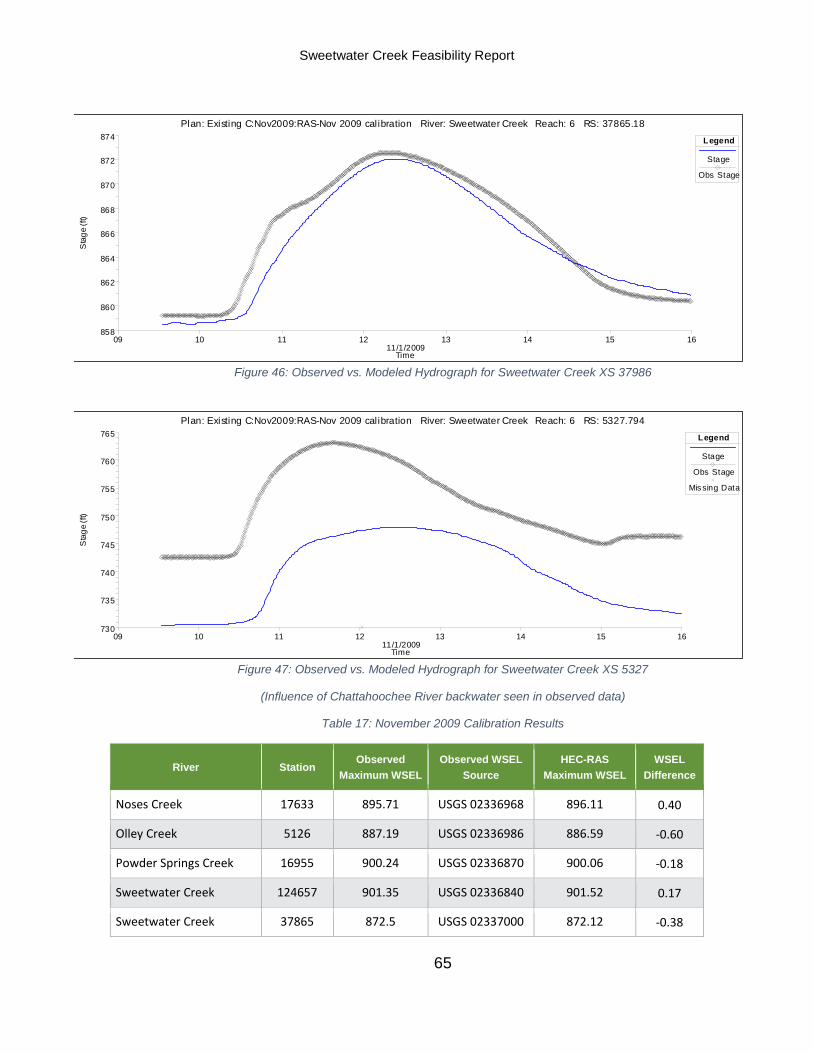
Sweetwater Creek Feasibility Report
65
Figure 46: Observed vs. Modeled Hydrograph for Sweetwater Creek XS 37986
Figure 47: Observed vs. Modeled Hydrograph for Sweetwater Creek XS 5327
(Influence of Chattahoochee River backwater seen in observed data)
Table 17: November 2009 Calibration Results
River Station Observed
Maximum WSEL Observed WSEL
Source HEC-RAS
Maximum WSEL WSEL
Difference
Noses Creek 17633 895.71 USGS 02336968 896.11 0.40
Olley Creek 5126 887.19 USGS 02336986 886.59 -0.60
Powder Springs Creek 16955 900.24 USGS 02336870 900.06 -0.18
Sweetwater Creek 124657 901.35 USGS 02336840 901.52 0.17
Sweetwater Creek 37865 872.5 USGS 02337000 872.12 -0.38
09 10 11 12 13 14 15 1611/1/2009
858
860
862
864
866
868
870
872
874Plan: Existing C:Nov2009:RAS-Nov 2009 calibration River: Sweetwater Creek Reach: 6 RS: 37865.18
Time
Sta
ge (f
t)
Legend
Stage
Obs Stage
09 10 11 12 13 14 15 1611/1/2009
730
735
740
745
750
755
760
765Plan: Existing C:Nov2009:RAS-Nov 2009 calibration River: Sweetwater Creek Reach: 6 RS: 5327.794
Time
Sta
ge (f
t)
Legend
Stage
Obs Stage
Missing Data
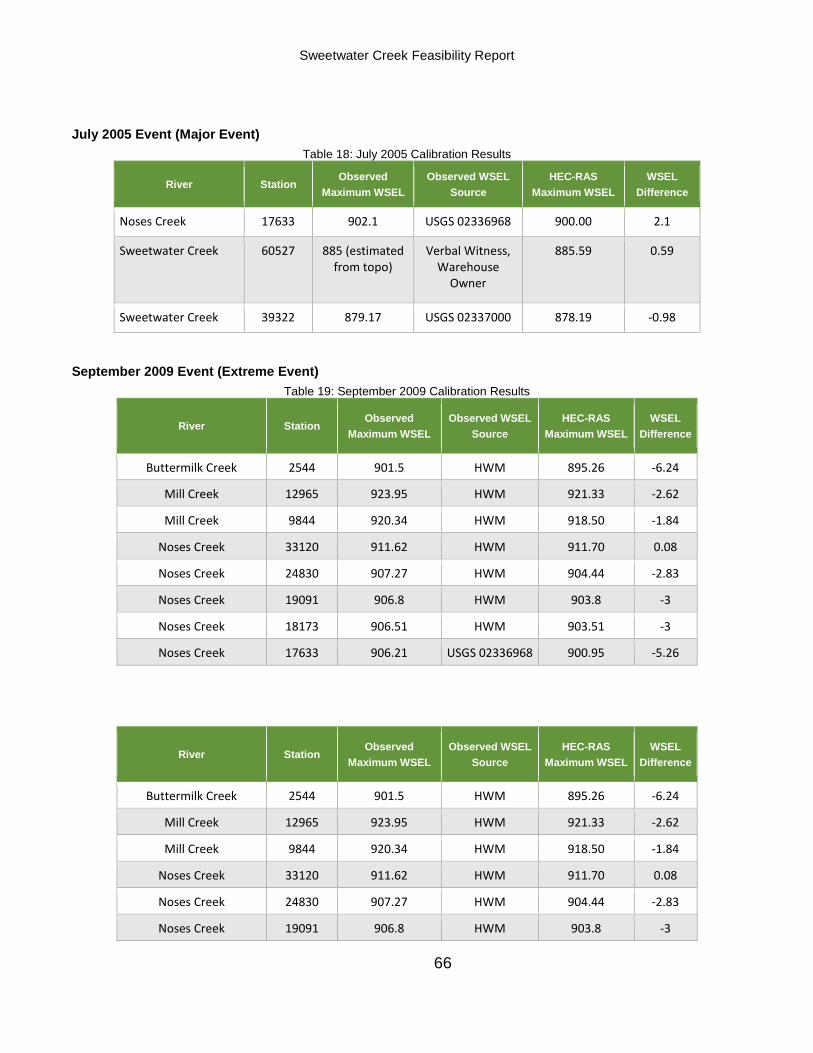
Sweetwater Creek Feasibility Report
66
July 2005 Event (Major Event) Table 18: July 2005 Calibration Results
River Station Observed
Maximum WSEL Observed WSEL
Source HEC-RAS
Maximum WSEL WSEL
Difference
Noses Creek 17633 902.1 USGS 02336968 900.00 2.1
Sweetwater Creek 60527 885 (estimated from topo)
Verbal Witness, Warehouse
Owner
885.59 0.59
Sweetwater Creek 39322 879.17 USGS 02337000 878.19 -0.98
September 2009 Event (Extreme Event) Table 19: September 2009 Calibration Results
River Station Observed
Maximum WSEL Observed WSEL
Source HEC-RAS
Maximum WSEL WSEL
Difference
Buttermilk Creek 2544 901.5 HWM 895.26 -6.24
Mill Creek 12965 923.95 HWM 921.33 -2.62
Mill Creek 9844 920.34 HWM 918.50 -1.84
Noses Creek 33120 911.62 HWM 911.70 0.08
Noses Creek 24830 907.27 HWM 904.44 -2.83
Noses Creek 19091 906.8 HWM 903.8 -3
Noses Creek 18173 906.51 HWM 903.51 -3
Noses Creek 17633 906.21 USGS 02336968 900.95 -5.26
River Station Observed
Maximum WSEL Observed WSEL
Source HEC-RAS
Maximum WSEL WSEL
Difference
Buttermilk Creek 2544 901.5 HWM 895.26 -6.24
Mill Creek 12965 923.95 HWM 921.33 -2.62
Mill Creek 9844 920.34 HWM 918.50 -1.84
Noses Creek 33120 911.62 HWM 911.70 0.08
Noses Creek 24830 907.27 HWM 904.44 -2.83
Noses Creek 19091 906.8 HWM 903.8 -3

Sweetwater Creek Feasibility Report
67
River Station Observed
Maximum WSEL Observed WSEL
Source HEC-RAS
Maximum WSEL WSEL
Difference
Noses Creek 18173 906.51 HWM 903.51 -3
Noses Creek 17633 906.21 USGS 02336968 900.95 -5.26
Noses Creek 17465 905.89 HWM 900.73 -5.16
Noses Creek 8100 905.57 HWM 898.75 -6.82
Olley Creek 5126 905.69 USGS 02336986 898.64 -7.05
Powder Springs Creek 18223 912.75 HWM 910.53 -2.22
Powder Springs Creek 16829 911.52 USGS 02336870 907.15 -4.82
Powder Springs Creek 13268 911.71 HWM 907.00 -4.71
Powder Springs Creek 9235 910.39 HWM 906.41 -3.98
Powder Springs Creek 8261 910.36 HWM 905.95 -4.41
Sweetwater Creek 136255 918.57 HWM 918.02 -0.55
Sweetwater Creek 131579 917.5 HWM 916.85 -0.65
Sweetwater Creek 124657 917.4 USGS 02336840 915.59 -1.81
Sweetwater Creek 94319 910.75 HWM 905.09 -5.66
Sweetwater Creek 92326 908.28 HWM 904.64 -3.64
Sweetwater Creek 91169 909.2 HWM 904.32 -4.88
Sweetwater Creek 84556 906.15 HWM 901.12 -5.03
Sweetwater Creek 73637 905.4 HWM 898.57 -6.83
Sweetwater Creek 65820 902.14 HWM 895.62 -6.52
Sweetwater Creek 54413 896.42 HWM 891.56 -4.86
Sweetwater Creek 39322 888.21 USGS 02337000 887.84 -0.37
Sweetwater Creek 37446 885.32 HWM 883.31 -2.01
Sweetwater Creek 24876 870.45 HWM 871.32 0.87
Sweetwater Creek 24108 869.17 HWM 870.56 1.39
Sweetwater Creek 1538 761.19 HWM 752.78 -8.41*
*Influence of Chattahoochee Backwater
Due to the large uncertainty in flow estimates from the USGS for the September 2009 storm event in combination with potential blockage of structures, larger variations between observed and modeled water surface elevations are seen along the middle section of Sweetwater Creek, and the downstream reaches of tributaries near their confluences. For these reasons, this

Sweetwater Creek Feasibility Report
68
event was utilized for validation and demonstration purposes only and was not used to calibrate runs.
4.5. Future Without-Project Conditions
Since the stationarity analysis based on qualifying gage data did not indicate any significant trends in rainfall or streamflow for the Sweetwater Creek Basin, changes in land use and increased development will likely be the main contributor to changes in the hydrology of the basin in the future. In order to estimate the future land use conditions of the basin, the EPA’s Integrated Climate and Land-Use Scenarios (ICLUS) percent impervious surface projections dataset (Ver 1.3.2) was used. This dataset utilizes population projections through the end of the century, reflecting different assumptions about fertility, mortality, and immigration to determine the demand for new homes, and estimates the amount of impervious surface that can be expected. Average future impervious percentages for each sub-basin were calculated for the Sweetwater Creek Basin using this ICLUS dataset, and areas of anticipated increased development were verified using aerial imagery to assess if these areas could in fact become more developed. These adjusted values were applied to the Existing Conditions hydrologic model to represent the Future Without Project Conditions model. Table 20 compares the percent impervious for the Existing and Future Without Project conditions, and Table 21 compares the flow results for each model for the 1% storm. The geometry that these flows were applied to remained unchanged between the Existing and Future Without Project conditions. Table 22 summarizes the Future Without Project Conditions flows throughout the basin.
Table 20: Percent Impervious Values
Basin Existing
Future Without
Basin Existing
Future Without
SC 1 10 22.6 SC 7 18 28.6
SC 2 15 26.3 SC 8 30 35.5
SC 3 15 25.4 NC 1 20 30.4
MC 2 15 29.6 MudC 1 22 27.6
MC 1 10.4 24.8 NC 2 22 28.3
MC 3 12 22 NC 2A 22 27.5
SC 4 9 16.1 NC 3 28 34.6
SC 5 14 22.4 OC 1 28 30.3
GC 1 14 27.2 OC 2 24 27.5
GC 2 16 24.7 OC 3 24 29.3
GC 3 11 18.2 SC 9 20 25.8
SC 6 17 27.4 SC 10 28 32.2
PSC 1 21 29.4 BC 1 28 34

Sweetwater Creek Feasibility Report
69
Table 21: Comparison of Existing and Future Without Project Conditions Flows
Station ID & Name XS Area (sq. mi)
Existing Conditions
1% (cfs)
Future Without Project
Conditions 1% (cfs)
SC 130930.8 55.75 6,958 7,144
MC 184.7 41.74 4,727 4,783
02336840 - SC at Brownsville Rd SC 124657.1 97.95 10,375 10,451
SC 113107.7 100.76 9,669 9,863
SC 93306.57 128.73 11,777 12,031
02336870 - PSC near Powder Springs PSC 16955.77 23.78 5,696 5,723
PSC 79.1615 27.99 4,918 4,947
02336910 - SC USRR bridge at Austell SC 88432.13 157.09 13,107 13,315
SC 75678.23 159.08 12,984 13,309
02336968 – NC at Powder Springs NC 17633.95 43.94 8,468 8,555
NC 2193.528 47.77 6,124 6,146
OC 778.4826 14.42 1,200 1,210
SC 63836.73 222.74 16,976 17,190
02337000 - SC near Austell SC 37865.18 238.73 17,492 17,639
02337040 - SC below Austell SC 5327.794 263.35 18,470 18,617
SC 1538.054 263.73 18,477 18,624
PSC 1A 21 33.8 SC 11 31 34.5
PSC 2 23 26.6 SC 12 25 28.2
PSC 2A 23 27.6 SC 13 18 19.5
PSC 3 21 26.2

Sweetwater Creek Feasibility Report
70
Table 22: Summary of Future Without Project Conditions Discharges Throughout Basin
Station ID & Name XS Area (sq. mi)
50% (cfs)
20% (cfs)
10% (cfs)
4% (cfs)
2% (cfs)
1% (cfs)
0.50% (cfs)
0.20% (cfs)
SC 130930.8 55.75 1,577 2,635 3,414 4,541 5,965 7,144 8,319 8,890
MC 184.7 41.74 1,293 1,945 2,421 3,488 4,282 4,783 5,139 6,138
02336840 - SC at Brownsville Rd SC 124657.1 97.95 2,713 4,305 5,436 7,931 9,584 10,451 11,760 13,971
SC 113107.7 100.76 2,417 3,736 5,055 6,573 8,117 9,863 11,470 12,895
SC 93306.57 128.73 2,864 4,535 6,061 8,198 9,912 12,031 13,575 15,441
02336870 - PSC near Powder Springs PSC 16955.77 23.78 1,705 2,536 3,150 4,063 5,105 5,724 5,915 6,519
PSC 79.1615 27.99 1,212 2,162 2,457 3,793 4,583 4,946 5,043 5,472
02336910 - SC USRR bridge at Austell SC 88432.13 157.09 3,040 4,884 6,415 9,200 11,102 13,315 14,947 17,263
SC 75678.23 159.08 3,143 4,998 6,447 9,031 11,048 13,309 14,800 16,858
02336968 - NC at Powder Springs NC 17633.95 43.94 1,779 3,008 3,902 5,269 6,765 8,555 9,522 10,594
NC 2193.528 47.77 1,611 2,528 3,159 4,191 5,147 6,146 7,269 8,265
OC 778.4826 14.42 450 598 756 1,040 1,157 1,210 1,350 1,352
SC 63836.73 222.74 4,576 7,037 8,943 11,817 14,781 17,190 18,890 20,925
02337000 - SC near Austell SC 37865.18 238.73 4,701 7,234 9,209 12,171 15,293 17,639 18,673 21,308
02337040 - SC below Austell SC 5327.794 263.35 4,985 7,676 9,769 12,960 16,395 18,617 19,790 22,583
SC 1538.054 263.73 4,981 7,677 9,771 12,964 16,402 18,624 19,799 22,590
5. Cost Estimates
The cost engineer, with support from the PDT, generated cost estimates for each alternative carried forward. The construction cost estimates were combined with the Real Estate costs, contingency costs, PED costs, and CM costs using an EXCEL workbook to determine the total cost of the project. The total project cost for each alternative is shown in Table 23 below. Details of the cost estimating approach, along with the estimates for all costs considered during the alternative screening process, are provided in the Cost Appendix.
Table 23: Total Project Cost Summary for Each Alternative

Sweetwater Creek Feasibility Report
71
6. Summary and Conclusions
The engineering team was charged with supporting the development and evaluation of flood risk management alternatives for the Sweetwater Creek Basin Georgia. The Sweetwater Creek The basin covers a 254 square mile area consisting of many small tributaries along with several other minor perennial features. The headwaters of the watershed are relatively rural while the middle and southern end of the basin contain pockets of urban sprawl and small towns. Specific tasks completed by the engineering team, as documented in this appendix, include (1) characterization of the existing and future (with- and without-project) hydraulic, hydrologic, and geologic conditions of the study area, (2) production of concept- and feasibility-level designs for the various flood risk management alternatives considered, and (3) a summation of the feasibility level cost estimates for all alternatives for use in the plan formulation process. To identify the existing and future (with- and without-project) hydrologic and hydraulic conditions of the study area, the PDT utilized the latest HEC-HMS and HEC-RAS models developed by FEMA for the Flood Inundation Study (FIS) encompassing the Sweetwater Creek watershed. These models were evaluated and updated, as necessary, to represent the
ESTIMATED D E S C R I P T I O N AMOUNT
Alternatives Project Cost
1 Relocations - 10% ACE 4,669,100$
1.1 Relocations - 4% ACE 5,674,100$
1.2 Relocations - 2% ACE 15,708,300$
1.3 Relocations - 1% ACE 23,028,400$
2 Retention Structure at Brown Road 22,653,000$
3 Channel Modification 134,178,600$
4 Multibasin Retention 33,141,000$
5 Multibasin Retention 152,267,600$
6Short Retention Structure Upstream of Bakers Bridge Road 8,631,000$
Notes:Price Level, FY-18

Sweetwater Creek Feasibility Report
72
current conditions within the watershed and possible future with-project conditions due to the implementation of the recommended plan. As the recommended plan consists of non-structural buyouts of the 10-year flood plain, the future-without and future-with hydrology and hydraulics models remain the same. Finally, the team produced concept level designs and cost estimates for each of the focused array of alternatives and, using this information, determined a recommended plan. The final recommended plan of buyouts of the 10-year flood plain consists of the purchase and removal of 20 structures costing $4,669,100.

Sweetwater Creek Feasibility Report
73
APPENDIX B1: WATER SURFACE PROFILES

Sweetwater Creek Feasibility Report
74
Existing Conditions
0 2000 4000 6000 8000 10000860
870
880
890
900
910
Sweetwater_Unsteady Pl an: 1) Exist ing C:05yr_event:RAS-05yr_ARF14 8/18/2017 2) Existing C:ExistingS t:RAS-02yr_ARF14 8/18/2017 3) Exi sti ng C:10yr_event :RAS-10yr_ARF14 8/18/2017 4) Existing C:25yr_event:RAS-25yr_ARF14 8/18/2017 5) Exi sti ng C:50yr_event :RAS-50yr_ARF14 8/18/2017 6) Exist ing C:100yr_even:RAS-100yr_ARF14 8/18/2017 7) Existing C:200yr_even:RAS-200yr_ARF14 8/18/2017 8) Existing C:500yr_even:RAS-500yr_ARF14 8/18/2017
Main Channel Distance (f t)
Ele
vatio
n (ft
)
Legend
WS Max WS - Ex is ting C:500y r_even:RAS-500y r_ARF
WS Max WS - Ex is ting C:200y r_even:RAS-200y r_ARF
WS Max WS - Ex is ting C:100y r_even:RAS-100y r_ARF
WS Max WS - Ex is ting C:50y r_ev ent:RAS-50y r_ARF1
WS Max WS - Ex is ting C:25y r_ev ent:RAS-25y r_ARF1
WS Max WS - Ex is ting C:10y r_ev ent:RAS-10y r_ARF1
WS Max WS - Ex is ting C:05y r_ev ent:RAS-05y r_ARF1
WS Max WS - Ex is ting C:Ex istingSt:RAS-02y r_ARF14
Ground
Max
ham
Roa
d - D
imen
sions
...
VET
ER
ANS
MEM
ORI
AL H
WY
- Dim
ensio
ns v
erfie
d wi
th a
ppro
xim
ate
fie...
Col
lins B
lvd -
App
roxi
mat
e fie
ld su
rvey
colle
cted
5/9/
17
Butterm ilk Creek BMC1

Sweetwater Creek Feasibility Report
75
0 2000 4000 6000 8000 10000 12000 14000 16000
885
890
895
900
905
910
915
920
925
Sweetwater_Unsteady Pl an: 1) Exist ing C:05yr_event:RAS-05yr_ARF14 8/18/2017 2) Existing C:ExistingS t:RAS-02yr_ARF14 8/18/2017 3) Exi sti ng C:10yr_event :RAS-10yr_ARF14 8/18/2017 4) Existing C:25yr_event:RAS-25yr_ARF14 8/18/2017 5) Exi sti ng C:50yr_event :RAS-50yr_ARF14 8/18/2017 6) Exist ing C:100yr_even:RAS-100yr_ARF14 8/18/2017 7) Existing C:200yr_even:RAS-200yr_ARF14 8/18/2017 8) Existing C:500yr_even:RAS-500yr_ARF14 8/18/2017
Main Channel Distance (f t)
Ele
vatio
n (ft
)
Legend
WS Max WS - Ex is ting C:500y r_even:RAS-500y r_ARF
WS Max WS - Ex is ting C:200y r_even:RAS-200y r_ARF
WS Max WS - Ex is ting C:100y r_even:RAS-100y r_ARF
WS Max WS - Ex is ting C:50y r_ev ent:RAS-50y r_ARF1
WS Max WS - Ex is ting C:25y r_ev ent:RAS-25y r_ARF1
WS Max WS - Ex is ting C:10y r_ev ent:RAS-10y r_ARF1
WS Max WS - Ex is ting C:05y r_ev ent:RAS-05y r_ARF1
WS Max WS - Ex is ting C:Ex istingSt:RAS-02y r_ARF14
Ground
MillCrk MIC1

Sweetwater Creek Feasibility Report
76
0 1000 2000 3000 4000 5000 6000890
895
900
905
910
915
920
Sweetwater_Unsteady Pl an: 1) Exist ing C:05yr_event:RAS-05yr_ARF14 8/18/2017 2) Existing C:ExistingS t:RAS-02yr_ARF14 8/18/2017 3) Exi sti ng C:10yr_event :RAS-10yr_ARF14 8/18/2017 4) Existing C:25yr_event:RAS-25yr_ARF14 8/18/2017 5) Exi sti ng C:50yr_event :RAS-50yr_ARF14 8/18/2017 6) Exist ing C:100yr_even:RAS-100yr_ARF14 8/18/2017 7) Existing C:200yr_even:RAS-200yr_ARF14 8/18/2017 8) Existing C:500yr_even:RAS-500yr_ARF14 8/18/2017
Main Channel Distance (f t)
Ele
vatio
n (ft
)
Legend
WS Max WS - Ex is ting C:500y r_even:RAS-500y r_ARF
WS Max WS - Ex is ting C:200y r_even:RAS-200y r_ARF
WS Max WS - Ex is ting C:100y r_even:RAS-100y r_ARF
WS Max WS - Ex is ting C:50y r_ev ent:RAS-50y r_ARF1
WS Max WS - Ex is ting C:25y r_ev ent:RAS-25y r_ARF1
WS Max WS - Ex is ting C:10y r_ev ent:RAS-10y r_ARF1
WS Max WS - Ex is ting C:05y r_ev ent:RAS-05y r_ARF1
WS Max WS - Ex is ting C:Ex istingSt:RAS-02y r_ARF14
Ground
0 M
outh
at N
oses
...
1690
Thi
s is
a RE
PEA
TED
se...
Mac
land
Roa
d18
11
1870
4920
ASS
UME
this
is co
nflu
ence
of L
uthe
r War
d
Mud Creek MDC1

Sweetwater Creek Feasibility Report
77
0 5000 10000 15000 20000 25000 30000 35000860
870
880
890
900
910
920
930
Sweetwater_Unsteady Pl an: 1) Exist ing C:05yr_event:RAS-05yr_ARF14 8/18/2017 2) Existing C:ExistingS t:RAS-02yr_ARF14 8/18/2017 3) Exi sti ng C:10yr_event :RAS-10yr_ARF14 8/18/2017 4) Existing C:25yr_event:RAS-25yr_ARF14 8/18/2017 5) Exi sti ng C:50yr_event :RAS-50yr_ARF14 8/18/2017 6) Exist ing C:100yr_even:RAS-100yr_ARF14 8/18/2017 7) Existing C:200yr_even:RAS-200yr_ARF14 8/18/2017 8) Existing C:500yr_even:RAS-500yr_ARF14 8/18/2017
Main Channel Distance (f t)
Ele
vatio
n (ft
)
Legend
WS Max WS - Ex is ting C:500y r_even:RAS-500y r_ARF
WS Max WS - Ex is ting C:200y r_even:RAS-200y r_ARF
WS Max WS - Ex is ting C:100y r_even:RAS-100y r_ARF
WS Max WS - Ex is ting C:50y r_ev ent:RAS-50y r_ARF1
WS Max WS - Ex is ting C:25y r_ev ent:RAS-25y r_ARF1
WS Max WS - Ex is ting C:10y r_ev ent:RAS-10y r_ARF1
WS Max WS - Ex is ting C:05y r_ev ent:RAS-05y r_ARF1
WS Max WS - Ex is ting C:Ex istingSt:RAS-02y r_ARF14
Ground
CLA
Y R
D, B
RID
GE
SKEW
NES.
..
Silv
er C
omet
Tra
il
PO
WD
ER
SPRI
NG R
D
Sur
veye
d X
S
Sur
veye
d X
S
ERN
EST
BARR
ETT
PKW
Y,SK
EW
NESS
IS A
PPLI
ED
Noses Creek NCC2 Noses Creek NCC1

Sweetwater Creek Feasibility Report
78
0 2000 4000 6000 8000 10000 12000 14000860
880
900
920
940
960
Sweetwater_Unsteady Pl an: 1) Exist ing C:05yr_event:RAS-05yr_ARF14 8/18/2017 2) Existing C:ExistingS t:RAS-02yr_ARF14 8/18/2017 3) Exi sti ng C:10yr_event :RAS-10yr_ARF14 8/18/2017 4) Existing C:25yr_event:RAS-25yr_ARF14 8/18/2017 5) Exi sti ng C:50yr_event :RAS-50yr_ARF14 8/18/2017 6) Exist ing C:100yr_even:RAS-100yr_ARF14 8/18/2017 7) Existing C:200yr_even:RAS-200yr_ARF14 8/18/2017 8) Existing C:500yr_even:RAS-500yr_ARF14 8/18/2017
Main Channel Distance (f t)
Ele
vatio
n (ft
)
Legend
WS Max WS - Ex is ting C:500y r_even:RAS-500y r_ARF
WS Max WS - Ex is ting C:200y r_even:RAS-200y r_ARF
WS Max WS - Ex is ting C:100y r_even:RAS-100y r_ARF
WS Max WS - Ex is ting C:50y r_ev ent:RAS-50y r_ARF1
WS Max WS - Ex is ting C:25y r_ev ent:RAS-25y r_ARF1
WS Max WS - Ex is ting C:10y r_ev ent:RAS-10y r_ARF1
WS Max WS - Ex is ting C:05y r_ev ent:RAS-05y r_ARF1
WS Max WS - Ex is ting C:Ex istingSt:RAS-02y r_ARF14
Ground
OC-
1
B19
1136
069,
Cla
y Roa
d...
OC-
3
B19
1011
070,
Flin
t Hill
Road
...
B17
0136
079,
Silv
er C
omet
RR
Brid
g...
Olley Creek OLC1

Sweetwater Creek Feasibility Report
79
0 5000 10000 15000 20000 25000 30000 35000870
880
890
900
910
920
930
940
Sweetwater_Unsteady Pl an: 1) Exist ing C:05yr_event:RAS-05yr_ARF14 8/18/2017 2) Existing C:ExistingS t:RAS-02yr_ARF14 8/18/2017 3) Exi sti ng C:10yr_event :RAS-10yr_ARF14 8/18/2017 4) Existing C:25yr_event:RAS-25yr_ARF14 8/18/2017 5) Exi sti ng C:50yr_event :RAS-50yr_ARF14 8/18/2017 6) Exist ing C:100yr_even:RAS-100yr_ARF14 8/18/2017 7) Existing C:200yr_even:RAS-200yr_ARF14 8/18/2017 8) Existing C:500yr_even:RAS-500yr_ARF14 8/18/2017
Main Channel Distance (f t)
Ele
vatio
n (ft
)
Legend
WS Max WS - Ex is ting C:500y r_even:RAS-500y r_ARF
WS Max WS - Ex is ting C:200y r_even:RAS-200y r_ARF
WS Max WS - Ex is ting C:100y r_even:RAS-100y r_ARF
WS Max WS - Ex is ting C:50y r_ev ent:RAS-50y r_ARF1
WS Max WS - Ex is ting C:25y r_ev ent:RAS-25y r_ARF1
WS Max WS - Ex is ting C:10y r_ev ent:RAS-10y r_ARF1
WS Max WS - Ex is ting C:05y r_ev ent:RAS-05y r_ARF1
WS Max WS - Ex is ting C:Ex istingSt:RAS-02y r_ARF14
Ground
0.37
B -
...
0.74
C -
...
0.83
Thi
s is .
..
0.93
***
VAL
LEY.
..
1.16
D -
***
FI...
1.63
E -
FIS
-E ..
.
1.73
D
.S. O
GLE
SBY
R...
2.17
G -
FI
S-G
VAL
L...
Stru
ctur
e re
vised
bas
ed o
n...
2.81
I -
FIS
-I U.
S. L
ON
G ...
adj in
vert
3.15
B
ROW
NSV
ILLE
RO
AD
D.S
.;...
adj in
vert
3.39
K -
FIS
-K V
ALL
EY
SEC
TIO
N .
..S
weet
wat
er A
ve -
New
ly a
dded
stru
ctur
...
3.78
L -
***
XS
EC 3
.83
FIS
-L D
.S. T
HO
...
4.31
M -
***
FIS-
M V
ALL
EY
SEC
TIO
N
***...
4.51
..
.4.
61 T
his i
s a R
EPEA
TED
sect
ion.
4.72
N
&S R
AILW
AY
D.S
.
...
4.76
O -
FIS
-O V
ALL
EY
SEC
TIO
N U
.S. U
S 27
8
...
4.86
...
5.06
P -
Thi
s is
a R
EPE
ATED
secti
on.
5.21
..
.
5.32
C
SX R
AILW
AY
D.S
.
...
5.42
***
US
278
CU
LV D
.S.
**
*NE
W***
*****
...5.
49 *
** V
ALLE
Y SE
CTIO
N
*
**NEW
*****
***
.
..
5.75
R -
***
FIS-
R V
ALLE
Y S
ECT
ION
***
MO
DIF
IED*
**
...
6.02
S -
FIS
-S V
ALL
EY
SEC
TIO
N
...
PowderSpringsCrk PSC1

Sweetwater Creek Feasibility Report
80
0 10000 20000 30000 40000 50000 60000 70000700
750
800
850
900
Sweetwater_Unsteady Pl an: 1) Exist ing C:05yr_event:RAS-05yr_ARF14 8/18/2017 2) Existing C:ExistingS t:RAS-02yr_ARF14 8/18/2017 3) Exi sti ng C:10yr_event :RAS-10yr_ARF14 8/18/2017 4) Existing C:25yr_event:RAS-25yr_ARF14 8/18/2017 5) Exi sti ng C:50yr_event :RAS-50yr_ARF14 8/18/2017 6) Exist ing C:100yr_even:RAS-100yr_ARF14 8/18/2017 7) Existing C:200yr_even:RAS-200yr_ARF14 8/18/2017 8) Existing C:500yr_even:RAS-500yr_ARF14 8/18/2017
Main Channel Distance (f t)
Ele
vatio
n (ft
)
Legend
WS Max WS - Ex is ting C:500y r_even:RAS-500y r_ARF
WS Max WS - Ex is ting C:200y r_even:RAS-200y r_ARF
WS Max WS - Ex is ting C:100y r_even:RAS-100y r_ARF
WS Max WS - Ex is ting C:50y r_ev ent:RAS-50y r_ARF1
WS Max WS - Ex is ting C:25y r_ev ent:RAS-25y r_ARF1
WS Max WS - Ex is ting C:10y r_ev ent:RAS-10y r_ARF1
WS Max WS - Ex is ting C:05y r_ev ent:RAS-05y r_ARF1
WS Max WS - Ex is ting C:Ex istingSt:RAS-02y r_ARF14
Ground
SW
02 -
Rive
rs...
SW
03 -
Sta
te P
ark
**IF
WA
TER
IS A
BOV
E LE
FTT
BAN
K, D
ELET
E AL
L LE
FT L
EVEE
S TH
ROU
GH
2580
8
SW
04 -
Bla
irs B
ridge
Roa
dS
W05
- In
ters
tate
20
SW
07 -
Sky
view
Driv
e
SW
08 -
Thor
nton
Rd
SW
12 (D
ougl
as C
o) -
OLD
ALA
BAM
A R
OAD
Sweetwater Creek SWC6

Sweetwater Creek Feasibility Report
81
* Main Channel Distance (ft) values should be added to STA 63230 from SWC6 reach above for a continuous profile.
Future Without Project
0 20000 40000 60000 80000860
870
880
890
900
910
920
930
Sweetwater_Unsteady Pl an: 1) Exist ing C:05yr_event:RAS-05yr_ARF14 8/18/2017 2) Existing C:ExistingS t:RAS-02yr_ARF14 8/18/2017 3) Exi sti ng C:10yr_event :RAS-10yr_ARF14 8/18/2017 4) Existing C:25yr_event:RAS-25yr_ARF14 8/18/2017 5) Exi sti ng C:50yr_event :RAS-50yr_ARF14 8/18/2017 6) Exist ing C:100yr_even:RAS-100yr_ARF14 8/18/2017 7) Existing C:200yr_even:RAS-200yr_ARF14 8/18/2017 8) Existing C:500yr_even:RAS-500yr_ARF14 8/18/2017
Main Channel Distance (f t)
Ele
vatio
n (ft
)
Legend
WS Max WS - Ex is ting C:500y r_even:RAS-500y r_ARF
WS Max WS - Ex is ting C:200y r_even:RAS-200y r_ARF
WS Max WS - Ex is ting C:100y r_even:RAS-100y r_ARF
WS Max WS - Ex is ting C:50y r_ev ent:RAS-50y r_ARF1
WS Max WS - Ex is ting C:25y r_ev ent:RAS-25y r_ARF1
WS Max WS - Ex is ting C:10y r_ev ent:RAS-10y r_ARF1
WS Max WS - Ex is ting C:05y r_ev ent:RAS-05y r_ARF1
WS Max WS - Ex is ting C:Ex istingSt:RAS-02y r_ARF14
Ground
surv
ey...
surv
eye.
..S
cour
hol
...su
rvey
ed
surv
eyed
surv
eyed
surv
ey
Sco
ur h
oles
wer
...su
rvey
ed
surv
eyed
Sco
ur h
ole
appr
ox...
Sco
ur h
oles
wer
e no
t ...
Sco
ur h
oles
wer
e no
t o...
surv
eyed
surv
eyed
SW
20 -
HIR
AM L
ITHI
A SP
RIN
GS.
..
surv
eyed
Sco
ur h
oles
wer
e no
t obs
erve
d du
...su
rvey
ed
surv
eyed
surv
eyed
Sco
ur h
oles
wer
e no
t obs
erve
d du
ring
5/9/
2017
...
FIS
XS B
FIS
XS D
FIS
XS E
FIS
XS F
Sweetwater Creek SWC5
Sweetwater Creek SWC4
Sweetwater Creek SWC3 Sweetwater Creek SWC2 Sweetwater Creek SWC1

Sweetwater Creek Feasibility Report
82
0 2000 4000 6000 8000 10000860
870
880
890
900
910
Sweetwater_Unsteady Pl an: 1) Future Wit :02yr_event :RAS-02yr_FUTURE 8/19/2017 2) Future Wi t:05yr_event:RAS-05yr_FUTURE 8/18/2017 3) Future Wit:10yr_event:RAS-10yr_FUTURE 8/18/2017 4) Future Wit:25yr_event:RAS-25yr_FUTURE 8/18/2017 5) Future Wit:50yr_event:RAS-50yr_FUTURE 8/18/2017 6) Future Wit :100yr_even:RAS-100yr_FUTURE 8/18/2017 7) Future Wit :200yr_even:RAS-200yr_FUTURE 8/18/2017 8) Future Wit :500yr_even:RAS-500yr_FUTURE 8/18/2017
Main Channel Distance (f t)
Ele
vatio
n (ft
)
Legend
WS Max WS - Future Wit:500y r_even:RAS-500y r_FUTUR
WS Max WS - Future Wit:200y r_even:RAS-200y r_FUTUR
WS Max WS - Future Wit:100y r_even:RAS-100y r_FUTUR
WS Max WS - Future Wit:50y r_event:RAS-50y r_FUTUR
WS Max WS - Future Wit:25y r_event:RAS-25y r_FUTUR
WS Max WS - Future Wit:10y r_event:RAS-10y r_FUTUR
WS Max WS - Future Wit:05y r_event:RAS-05y r_FUTUR
WS Max WS - Future Wit:02y r_event:RAS-02y r_FUTUR
Ground
Max
ham
Roa
d - D
imen
sions
...
VET
ER
ANS
MEM
ORI
AL H
WY
- Dim
ensio
ns v
erfie
d wi
th a
ppro
xim
ate
fie...
Col
lins B
lvd -
App
roxi
mat
e fie
ld su
rvey
colle
cted
5/9/
17
Butterm ilk Creek BMC1

Sweetwater Creek Feasibility Report
83
0 2000 4000 6000 8000 10000 12000 14000 16000885
890
895
900
905
910
915
920
925
Sweetwater_Unsteady Pl an: 1) Future Wit :02yr_event :RAS-02yr_FUTURE 8/19/2017 2) Future Wi t:05yr_event:RAS-05yr_FUTURE 8/18/2017 3) Future Wit:10yr_event:RAS-10yr_FUTURE 8/18/2017 4) Future Wit:25yr_event:RAS-25yr_FUTURE 8/18/2017 5) Future Wit:50yr_event:RAS-50yr_FUTURE 8/18/2017 6) Future Wit :100yr_even:RAS-100yr_FUTURE 8/18/2017 7) Future Wit :200yr_even:RAS-200yr_FUTURE 8/18/2017 8) Future Wit :500yr_even:RAS-500yr_FUTURE 8/18/2017
Main Channel Distance (f t)
Ele
vatio
n (ft
)
Legend
WS Max WS - Future Wit:500y r_even:RAS-500y r_FUTUR
WS Max WS - Future Wit:200y r_even:RAS-200y r_FUTUR
WS Max WS - Future Wit:100y r_even:RAS-100y r_FUTUR
WS Max WS - Future Wit:50y r_event:RAS-50y r_FUTUR
WS Max WS - Future Wit:25y r_event:RAS-25y r_FUTUR
WS Max WS - Future Wit:10y r_event:RAS-10y r_FUTUR
WS Max WS - Future Wit:05y r_event:RAS-05y r_FUTUR
WS Max WS - Future Wit:02y r_event:RAS-02y r_FUTUR
Ground
MillCrk MIC1

Sweetwater Creek Feasibility Report
84
0 1000 2000 3000 4000 5000 6000
890
895
900
905
910
915
920
Sweetwater_Unsteady Pl an: 1) Future Wit :02yr_event :RAS-02yr_FUTURE 8/19/2017 2) Future Wi t:05yr_event:RAS-05yr_FUTURE 8/18/2017 3) Future Wit:10yr_event:RAS-10yr_FUTURE 8/18/2017 4) Future Wit:25yr_event:RAS-25yr_FUTURE 8/18/2017 5) Future Wit:50yr_event:RAS-50yr_FUTURE 8/18/2017 6) Future Wit :100yr_even:RAS-100yr_FUTURE 8/18/2017 7) Future Wit :200yr_even:RAS-200yr_FUTURE 8/18/2017 8) Future Wit :500yr_even:RAS-500yr_FUTURE 8/18/2017
Main Channel Distance (f t)
Ele
vatio
n (ft
)
Legend
WS Max WS - Future Wit:500y r_even:RAS-500y r_FUTUR
WS Max WS - Future Wit:200y r_even:RAS-200y r_FUTUR
WS Max WS - Future Wit:100y r_even:RAS-100y r_FUTUR
WS Max WS - Future Wit:50y r_event:RAS-50y r_FUTUR
WS Max WS - Future Wit:25y r_event:RAS-25y r_FUTUR
WS Max WS - Future Wit:10y r_event:RAS-10y r_FUTUR
WS Max WS - Future Wit:05y r_event:RAS-05y r_FUTUR
WS Max WS - Future Wit:02y r_event:RAS-02y r_FUTUR
Ground
0 M
outh
at N
oses
...
1690
Thi
s is
a RE
PEA
TED
se...
Mac
land
Roa
d18
11
1870
4920
ASS
UME
this
is co
nflu
ence
of L
uthe
r War
d
Mud Creek MDC1

Sweetwater Creek Feasibility Report
85
0 5000 10000 15000 20000 25000 30000 35000860
870
880
890
900
910
920
930
Sweetwater_Unsteady Pl an: 1) Future Wit :02yr_event :RAS-02yr_FUTURE 8/19/2017 2) Future Wi t:05yr_event:RAS-05yr_FUTURE 8/18/2017 3) Future Wit:10yr_event:RAS-10yr_FUTURE 8/18/2017 4) Future Wit:25yr_event:RAS-25yr_FUTURE 8/18/2017 5) Future Wit:50yr_event:RAS-50yr_FUTURE 8/18/2017 6) Future Wit :100yr_even:RAS-100yr_FUTURE 8/18/2017 7) Future Wit :200yr_even:RAS-200yr_FUTURE 8/18/2017 8) Future Wit :500yr_even:RAS-500yr_FUTURE 8/18/2017
Main Channel Distance (f t)
Ele
vatio
n (ft
)
Legend
WS Max WS - Future Wit:500y r_even:RAS-500y r_FUTUR
WS Max WS - Future Wit:200y r_even:RAS-200y r_FUTUR
WS Max WS - Future Wit:100y r_even:RAS-100y r_FUTUR
WS Max WS - Future Wit:50y r_event:RAS-50y r_FUTUR
WS Max WS - Future Wit:25y r_event:RAS-25y r_FUTUR
WS Max WS - Future Wit:10y r_event:RAS-10y r_FUTUR
WS Max WS - Future Wit:05y r_event:RAS-05y r_FUTUR
WS Max WS - Future Wit:02y r_event:RAS-02y r_FUTUR
Ground
CLA
Y R
D, B
RID
GE
SKEW
NES.
..
Silv
er C
omet
Tra
il
PO
WD
ER
SPRI
NG R
D
Sur
veye
d X
S
Sur
veye
d X
S
ERN
EST
BARR
ETT
PKW
Y,SK
EW
NESS
IS A
PPLI
ED
Noses Creek NCC2 Noses Creek NCC1

Sweetwater Creek Feasibility Report
86
0 2000 4000 6000 8000 10000 12000 14000
860
880
900
920
940
960
Sweetwater_Unsteady Pl an: 1) Future Wit :02yr_event :RAS-02yr_FUTURE 8/19/2017 2) Future Wi t:05yr_event:RAS-05yr_FUTURE 8/18/2017 3) Future Wit:10yr_event:RAS-10yr_FUTURE 8/18/2017 4) Future Wit:25yr_event:RAS-25yr_FUTURE 8/18/2017 5) Future Wit:50yr_event:RAS-50yr_FUTURE 8/18/2017 6) Future Wit :100yr_even:RAS-100yr_FUTURE 8/18/2017 7) Future Wit :200yr_even:RAS-200yr_FUTURE 8/18/2017 8) Future Wit :500yr_even:RAS-500yr_FUTURE 8/18/2017
Main Channel Distance (f t)
Ele
vatio
n (ft
)
Legend
WS Max WS - Future Wit:500y r_even:RAS-500y r_FUTUR
WS Max WS - Future Wit:200y r_even:RAS-200y r_FUTUR
WS Max WS - Future Wit:100y r_even:RAS-100y r_FUTUR
WS Max WS - Future Wit:50y r_event:RAS-50y r_FUTUR
WS Max WS - Future Wit:25y r_event:RAS-25y r_FUTUR
WS Max WS - Future Wit:10y r_event:RAS-10y r_FUTUR
WS Max WS - Future Wit:05y r_event:RAS-05y r_FUTUR
WS Max WS - Future Wit:02y r_event:RAS-02y r_FUTUR
Ground
OC-
1
B19
1136
069,
Cla
y Roa
d...
OC-
3
B19
1011
070,
Flin
t Hill
Road
...
B17
0136
079,
Silv
er C
omet
RR
Brid
g...
Olley Creek OLC1

Sweetwater Creek Feasibility Report
87
0 5000 10000 15000 20000 25000 30000 35000
870
880
890
900
910
920
930
940
Sweetwater_Unsteady Pl an: 1) Future Wit :02yr_event :RAS-02yr_FUTURE 8/19/2017 2) Future Wi t:05yr_event:RAS-05yr_FUTURE 8/18/2017 3) Future Wit:10yr_event:RAS-10yr_FUTURE 8/18/2017 4) Future Wit:25yr_event:RAS-25yr_FUTURE 8/18/2017 5) Future Wit:50yr_event:RAS-50yr_FUTURE 8/18/2017 6) Future Wit :100yr_even:RAS-100yr_FUTURE 8/18/2017 7) Future Wit :200yr_even:RAS-200yr_FUTURE 8/18/2017 8) Future Wit :500yr_even:RAS-500yr_FUTURE 8/18/2017
Main Channel Distance (f t)
Ele
vatio
n (ft
)
Legend
WS Max WS - Future Wit:500y r_even:RAS-500y r_FUTUR
WS Max WS - Future Wit:200y r_even:RAS-200y r_FUTUR
WS Max WS - Future Wit:100y r_even:RAS-100y r_FUTUR
WS Max WS - Future Wit:50y r_event:RAS-50y r_FUTUR
WS Max WS - Future Wit:25y r_event:RAS-25y r_FUTUR
WS Max WS - Future Wit:10y r_event:RAS-10y r_FUTUR
WS Max WS - Future Wit:05y r_event:RAS-05y r_FUTUR
WS Max WS - Future Wit:02y r_event:RAS-02y r_FUTUR
Ground
0.37
B -
...
0.74
C -
...
0.83
Thi
s is .
..
0.93
***
VAL
LEY.
..
1.16
D -
***
FI...
1.63
E -
FIS
-E ..
.
1.73
D
.S. O
GLE
SBY
R...
2.17
G -
FI
S-G
VAL
L...
Stru
ctur
e re
vised
bas
ed o
n...
2.81
I -
FIS
-I U.
S. L
ON
G ...
adj in
vert
3.15
B
ROW
NSV
ILLE
RO
AD
D.S
.;...
3.39
K -
FIS
-K V
ALL
EY
SEC
TIO
N .
..S
weet
wat
er A
ve -
New
ly a
dded
stru
ctur
...
3.78
L -
***
XS
EC 3
.83
FIS
-L D
.S. T
HO
...
4.31
M -
***
FIS-
M V
ALL
EY
SEC
TIO
N
***...
4.51
..
.4.
61 T
his i
s a R
EPEA
TED
sect
ion.
4.72
N
&S R
AILW
AY
D.S
.
...
4.76
O -
FIS
-O V
ALL
EY
SEC
TIO
N U
.S. U
S 27
8
...
4.86
...
5.06
P -
Thi
s is
a R
EPE
ATED
secti
on.
5.21
..
.
5.32
C
SX R
AILW
AY
D.S
.
...
5.42
***
US
278
CU
LV D
.S.
**
*NE
W***
*****
...5.
49 *
** V
ALLE
Y SE
CTIO
N
*
**NEW
*****
***
.
..
5.75
R -
***
FIS-
R V
ALLE
Y S
ECT
ION
***
MO
DIF
IED*
**
...
6.02
S -
FIS
-S V
ALL
EY
SEC
TIO
N
...
PowderSpringsCrk PSC1

Sweetwater Creek Feasibility Report
88
0 10000 20000 30000 40000 50000 60000 70000
700
750
800
850
900
Sweetwater_Unsteady Pl an: 1) Future Wit :02yr_event :RAS-02yr_FUTURE 8/19/2017 2) Future Wi t:05yr_event:RAS-05yr_FUTURE 8/18/2017 3) Future Wit:10yr_event:RAS-10yr_FUTURE 8/18/2017 4) Future Wit:25yr_event:RAS-25yr_FUTURE 8/18/2017 5) Future Wit:50yr_event:RAS-50yr_FUTURE 8/18/2017 6) Future Wit :100yr_even:RAS-100yr_FUTURE 8/18/2017 7) Future Wit :200yr_even:RAS-200yr_FUTURE 8/18/2017 8) Future Wit :500yr_even:RAS-500yr_FUTURE 8/18/2017
Main Channel Distance (f t)
Ele
vatio
n (ft
)
Legend
WS Max WS - Future Wit:500y r_even:RAS-500y r_FUTUR
WS Max WS - Future Wit:200y r_even:RAS-200y r_FUTUR
WS Max WS - Future Wit:100y r_even:RAS-100y r_FUTUR
WS Max WS - Future Wit:50y r_event:RAS-50y r_FUTUR
WS Max WS - Future Wit:25y r_event:RAS-25y r_FUTUR
WS Max WS - Future Wit:10y r_event:RAS-10y r_FUTUR
WS Max WS - Future Wit:05y r_event:RAS-05y r_FUTUR
WS Max WS - Future Wit:02y r_event:RAS-02y r_FUTUR
Ground
SW
02 -
Rive
rs...
SW
03 -
Sta
te P
ark
**IF
WA
TER
IS A
BOV
E LE
FTT
BAN
K, D
ELET
E AL
L LE
FT L
EVEE
S TH
ROU
GH
2580
8
SW
04 -
Bla
irs B
ridge
Roa
dS
W05
- In
ters
tate
20
SW
07 -
Sky
view
Driv
e
SW
08 -
Thor
nton
Rd
SW
12 (D
ougl
as C
o) -
OLD
ALA
BAM
A R
OAD
Sweetwater Creek SWC6

Sweetwater Creek Feasibility Report
89
* Main Channel Distance (ft) values should be added to STA 63230 from SWC6 reach above for a continuous profile
Alternative 2
0 20000 40000 60000 80000860
870
880
890
900
910
920
930
Sweetwater_Unsteady Pl an: 1) Future Wit :02yr_event :RAS-02yr_FUTURE 8/19/2017 2) Future Wi t:05yr_event:RAS-05yr_FUTURE 8/18/2017 3) Future Wit:10yr_event:RAS-10yr_FUTURE 8/18/2017 4) Future Wit:25yr_event:RAS-25yr_FUTURE 8/18/2017 5) Future Wit:50yr_event:RAS-50yr_FUTURE 8/18/2017 6) Future Wit :100yr_even:RAS-100yr_FUTURE 8/18/2017 7) Future Wit :200yr_even:RAS-200yr_FUTURE 8/18/2017 8) Future Wit :500yr_even:RAS-500yr_FUTURE 8/18/2017
Main Channel Distance (f t)
Ele
vatio
n (ft
)
Legend
WS Max WS - Future Wit:500y r_even:RAS-500y r_FUTUR
WS Max WS - Future Wit:200y r_even:RAS-200y r_FUTUR
WS Max WS - Future Wit:100y r_even:RAS-100y r_FUTUR
WS Max WS - Future Wit:50y r_event:RAS-50y r_FUTUR
WS Max WS - Future Wit:25y r_event:RAS-25y r_FUTUR
WS Max WS - Future Wit:10y r_event:RAS-10y r_FUTUR
WS Max WS - Future Wit:05y r_event:RAS-05y r_FUTUR
WS Max WS - Future Wit:02y r_event:RAS-02y r_FUTUR
Ground
surv
ey...
surv
eye.
..S
cour
hol
...su
rvey
ed
surv
eyed
surv
eyed
surv
ey
Sco
ur h
oles
wer
...su
rvey
ed
surv
eyed
Sco
ur h
ole
appr
ox...
Sco
ur h
oles
wer
e no
t ...
Sco
ur h
oles
wer
e no
t o...
surv
eyed
surv
eyed
SW
20 -
HIR
AM L
ITHI
A SP
RIN
GS.
..
surv
eyed
Sco
ur h
oles
wer
e no
t obs
erve
d du
...su
rvey
ed
surv
eyed
surv
eyed
Sco
ur h
oles
wer
e no
t obs
erve
d du
ring
5/9/
2017
...
FIS
XS B
FIS
XS D
FIS
XS E
FIS
XS F
Sweetwater Creek SWC5
Sweetwater Creek SWC4
Sweetwater Creek SWC3 Sweetwater Creek SWC2 Sweetwater Creek SWC1
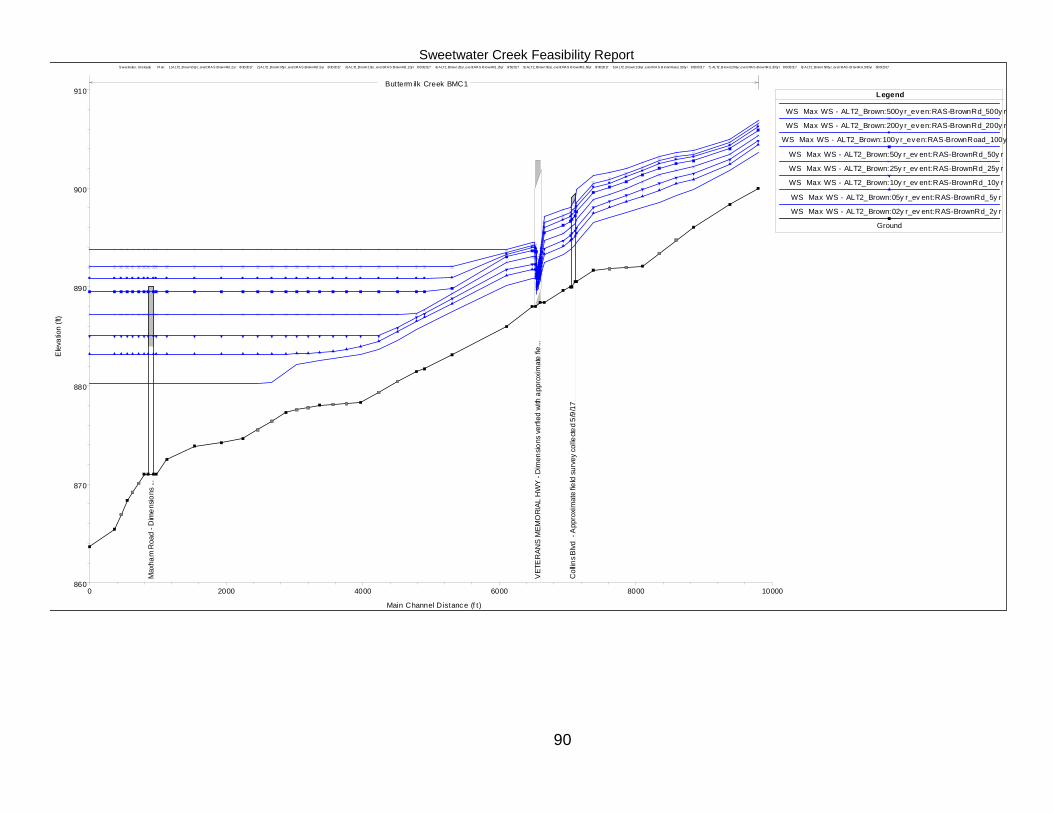
Sweetwater Creek Feasibility Report
90
0 2000 4000 6000 8000 10000860
870
880
890
900
910
Sweetwater_Unsteady Pl an: 1) ALT2_Brown:02yr_event:RAS-BrownRd_2yr 8/30/2017 2) ALT2_Brown:05yr_event:RAS-BrownRd_5yr 8/30/2017 3) ALT2_Brown:10yr_event:RAS-BrownRd_10yr 8/30/2017 4) ALT2_Brown:25yr_event:RAS-BrownRd_25yr 9/5/2017 5) ALT2_Brown:50yr_event:RAS-BrownRd_50yr 8/30/2017 6) ALT2_Brown:100yr_even:RAS-BrownRoad_100yr 8/30/2017 7) ALT2_Brown:200yr_even:RAS-BrownRd_200yr 8/30/2017 8) ALT2_Brown:500yr_even:RAS-BrownRd_500yr 8/30/2017
Main Channel Distance (f t)
Ele
vatio
n (ft
)
Legend
WS Max WS - ALT2_Brown:500y r_even:RAS-BrownRd_500y r
WS Max WS - ALT2_Brown:200y r_even:RAS-BrownRd_200y r
WS Max WS - ALT2_Brown:100y r_even:RAS-BrownRoad_100y
WS Max WS - ALT2_Brown:50y r_ev ent:RAS-BrownRd_50y r
WS Max WS - ALT2_Brown:25y r_ev ent:RAS-BrownRd_25y r
WS Max WS - ALT2_Brown:10y r_ev ent:RAS-BrownRd_10y r
WS Max WS - ALT2_Brown:05y r_ev ent:RAS-BrownRd_5y r
WS Max WS - ALT2_Brown:02y r_ev ent:RAS-BrownRd_2y r
Ground
Max
ham
Roa
d - D
imen
sions
...
VET
ER
ANS
MEM
ORI
AL H
WY
- Dim
ensio
ns v
erfie
d wi
th a
ppro
xim
ate
fie...
Col
lins B
lvd -
App
roxi
mat
e fie
ld su
rvey
colle
cted
5/9/
17
Butterm ilk Creek BMC1
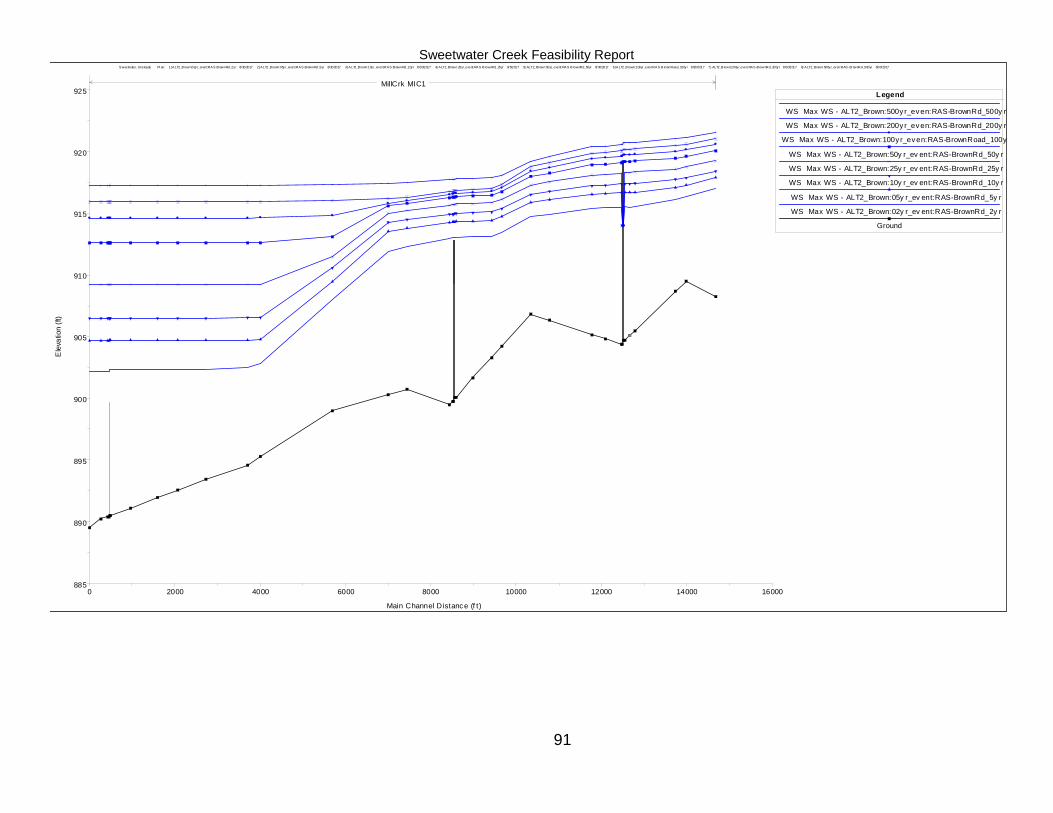
Sweetwater Creek Feasibility Report
91
0 2000 4000 6000 8000 10000 12000 14000 16000
885
890
895
900
905
910
915
920
925
Sweetwater_Unsteady Pl an: 1) ALT2_Brown:02yr_event:RAS-BrownRd_2yr 8/30/2017 2) ALT2_Brown:05yr_event:RAS-BrownRd_5yr 8/30/2017 3) ALT2_Brown:10yr_event:RAS-BrownRd_10yr 8/30/2017 4) ALT2_Brown:25yr_event:RAS-BrownRd_25yr 9/5/2017 5) ALT2_Brown:50yr_event:RAS-BrownRd_50yr 8/30/2017 6) ALT2_Brown:100yr_even:RAS-BrownRoad_100yr 8/30/2017 7) ALT2_Brown:200yr_even:RAS-BrownRd_200yr 8/30/2017 8) ALT2_Brown:500yr_even:RAS-BrownRd_500yr 8/30/2017
Main Channel Distance (f t)
Ele
vatio
n (ft
)
Legend
WS Max WS - ALT2_Brown:500y r_even:RAS-BrownRd_500y r
WS Max WS - ALT2_Brown:200y r_even:RAS-BrownRd_200y r
WS Max WS - ALT2_Brown:100y r_even:RAS-BrownRoad_100y
WS Max WS - ALT2_Brown:50y r_ev ent:RAS-BrownRd_50y r
WS Max WS - ALT2_Brown:25y r_ev ent:RAS-BrownRd_25y r
WS Max WS - ALT2_Brown:10y r_ev ent:RAS-BrownRd_10y r
WS Max WS - ALT2_Brown:05y r_ev ent:RAS-BrownRd_5y r
WS Max WS - ALT2_Brown:02y r_ev ent:RAS-BrownRd_2y r
Ground
MillCrk MIC1

Sweetwater Creek Feasibility Report
92
0 1000 2000 3000 4000 5000 6000
890
895
900
905
910
915
920
Sweetwater_Unsteady Pl an: 1) ALT2_Brown:02yr_event:RAS-BrownRd_2yr 8/30/2017 2) ALT2_Brown:05yr_event:RAS-BrownRd_5yr 8/30/2017 3) ALT2_Brown:10yr_event:RAS-BrownRd_10yr 8/30/2017 4) ALT2_Brown:25yr_event:RAS-BrownRd_25yr 9/5/2017 5) ALT2_Brown:50yr_event:RAS-BrownRd_50yr 8/30/2017 6) ALT2_Brown:100yr_even:RAS-BrownRoad_100yr 8/30/2017 7) ALT2_Brown:200yr_even:RAS-BrownRd_200yr 8/30/2017 8) ALT2_Brown:500yr_even:RAS-BrownRd_500yr 8/30/2017
Main Channel Distance (f t)
Ele
vatio
n (ft
)
Legend
WS Max WS - ALT2_Brown:500y r_even:RAS-BrownRd_500y r
WS Max WS - ALT2_Brown:200y r_even:RAS-BrownRd_200y r
WS Max WS - ALT2_Brown:100y r_even:RAS-BrownRoad_100y
WS Max WS - ALT2_Brown:50y r_ev ent:RAS-BrownRd_50y r
WS Max WS - ALT2_Brown:25y r_ev ent:RAS-BrownRd_25y r
WS Max WS - ALT2_Brown:10y r_ev ent:RAS-BrownRd_10y r
WS Max WS - ALT2_Brown:05y r_ev ent:RAS-BrownRd_5y r
WS Max WS - ALT2_Brown:02y r_ev ent:RAS-BrownRd_2y r
Ground
0 M
outh
at N
oses
...
1690
Thi
s is
a RE
PEA
TED
se...
Mac
land
Roa
d18
11
1870
4920
ASS
UME
this
is co
nflu
ence
of L
uthe
r War
d
Mud Creek MDC1
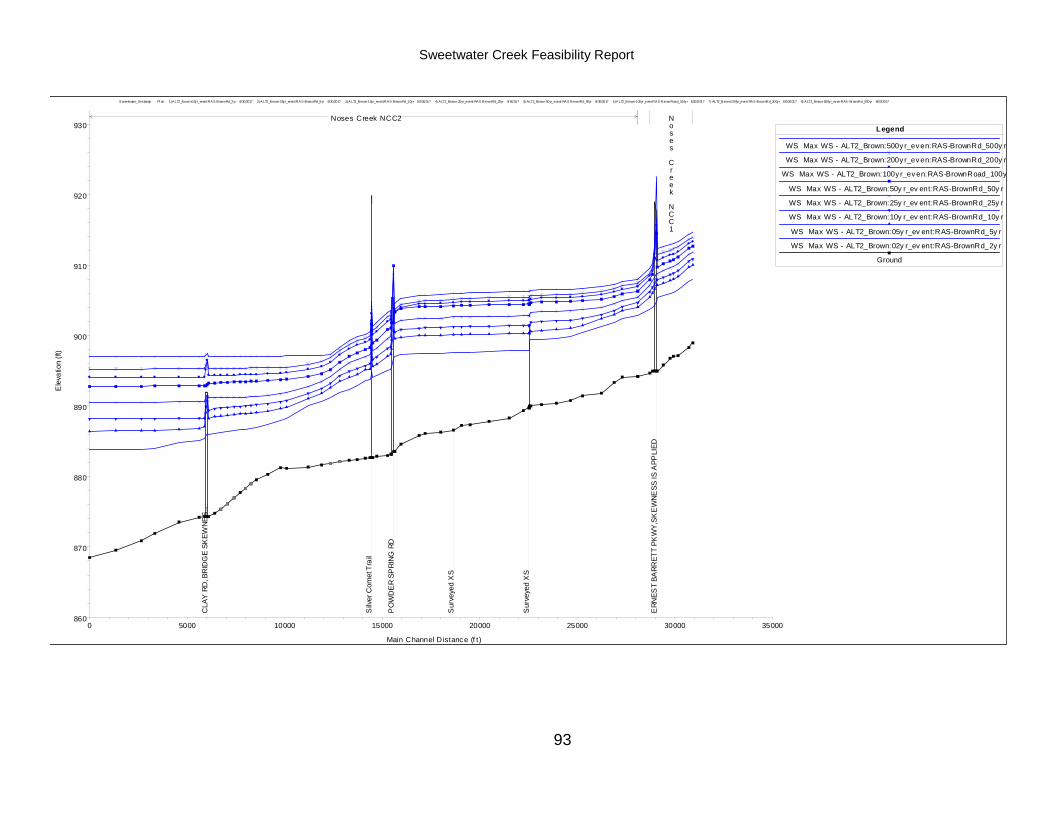
Sweetwater Creek Feasibility Report
93
0 5000 10000 15000 20000 25000 30000 35000
860
870
880
890
900
910
920
930
Sweetwater_Unsteady Pl an: 1) ALT2_Brown:02yr_event:RAS-BrownRd_2yr 8/30/2017 2) ALT2_Brown:05yr_event:RAS-BrownRd_5yr 8/30/2017 3) ALT2_Brown:10yr_event:RAS-BrownRd_10yr 8/30/2017 4) ALT2_Brown:25yr_event:RAS-BrownRd_25yr 9/5/2017 5) ALT2_Brown:50yr_event:RAS-BrownRd_50yr 8/30/2017 6) ALT2_Brown:100yr_even:RAS-BrownRoad_100yr 8/30/2017 7) ALT2_Brown:200yr_even:RAS-BrownRd_200yr 8/30/2017 8) ALT2_Brown:500yr_even:RAS-BrownRd_500yr 8/30/2017
Main Channel Distance (f t)
Ele
vatio
n (ft
)
Legend
WS Max WS - ALT2_Brown:500y r_even:RAS-BrownRd_500y r
WS Max WS - ALT2_Brown:200y r_even:RAS-BrownRd_200y r
WS Max WS - ALT2_Brown:100y r_even:RAS-BrownRoad_100y
WS Max WS - ALT2_Brown:50y r_ev ent:RAS-BrownRd_50y r
WS Max WS - ALT2_Brown:25y r_ev ent:RAS-BrownRd_25y r
WS Max WS - ALT2_Brown:10y r_ev ent:RAS-BrownRd_10y r
WS Max WS - ALT2_Brown:05y r_ev ent:RAS-BrownRd_5y r
WS Max WS - ALT2_Brown:02y r_ev ent:RAS-BrownRd_2y r
Ground
CLA
Y R
D, B
RID
GE
SKEW
NES.
..
Silv
er C
omet
Tra
il
PO
WD
ER
SPRI
NG R
D
Sur
veye
d X
S
Sur
veye
d X
S
ERN
EST
BARR
ETT
PKW
Y,SK
EW
NESS
IS A
PPLI
ED
Noses Creek NCC2 Noses Creek NCC1

Sweetwater Creek Feasibility Report
94
0 2000 4000 6000 8000 10000 12000 14000
860
880
900
920
940
960
Sweetwater_Unsteady Pl an: 1) ALT2_Brown:02yr_event:RAS-BrownRd_2yr 8/30/2017 2) ALT2_Brown:05yr_event:RAS-BrownRd_5yr 8/30/2017 3) ALT2_Brown:10yr_event:RAS-BrownRd_10yr 8/30/2017 4) ALT2_Brown:25yr_event:RAS-BrownRd_25yr 9/5/2017 5) ALT2_Brown:50yr_event:RAS-BrownRd_50yr 8/30/2017 6) ALT2_Brown:100yr_even:RAS-BrownRoad_100yr 8/30/2017 7) ALT2_Brown:200yr_even:RAS-BrownRd_200yr 8/30/2017 8) ALT2_Brown:500yr_even:RAS-BrownRd_500yr 8/30/2017
Main Channel Distance (f t)
Ele
vatio
n (ft
)
Legend
WS Max WS - ALT2_Brown:500y r_even:RAS-BrownRd_500y r
WS Max WS - ALT2_Brown:200y r_even:RAS-BrownRd_200y r
WS Max WS - ALT2_Brown:100y r_even:RAS-BrownRoad_100y
WS Max WS - ALT2_Brown:50y r_ev ent:RAS-BrownRd_50y r
WS Max WS - ALT2_Brown:25y r_ev ent:RAS-BrownRd_25y r
WS Max WS - ALT2_Brown:10y r_ev ent:RAS-BrownRd_10y r
WS Max WS - ALT2_Brown:05y r_ev ent:RAS-BrownRd_5y r
WS Max WS - ALT2_Brown:02y r_ev ent:RAS-BrownRd_2y r
Ground
OC-
1
B19
1136
069,
Cla
y Roa
d...
OC-
3
B19
1011
070,
Flin
t Hill
Road
...
B17
0136
079,
Silv
er C
omet
RR
Brid
g...
Olley Creek OLC1

Sweetwater Creek Feasibility Report
95
0 5000 10000 15000 20000 25000 30000 35000
870
880
890
900
910
920
930
940
Sweetwater_Unsteady Pl an: 1) ALT2_Brown:02yr_event:RAS-BrownRd_2yr 8/30/2017 2) ALT2_Brown:05yr_event:RAS-BrownRd_5yr 8/30/2017 3) ALT2_Brown:10yr_event:RAS-BrownRd_10yr 8/30/2017 4) ALT2_Brown:25yr_event:RAS-BrownRd_25yr 9/5/2017 5) ALT2_Brown:50yr_event:RAS-BrownRd_50yr 8/30/2017 6) ALT2_Brown:100yr_even:RAS-BrownRoad_100yr 8/30/2017 7) ALT2_Brown:200yr_even:RAS-BrownRd_200yr 8/30/2017 8) ALT2_Brown:500yr_even:RAS-BrownRd_500yr 8/30/2017
Main Channel Distance (f t)
Ele
vatio
n (ft
)
Legend
WS Max WS - ALT2_Brown:500y r_even:RAS-BrownRd_500y r
WS Max WS - ALT2_Brown:200y r_even:RAS-BrownRd_200y r
WS Max WS - ALT2_Brown:100y r_even:RAS-BrownRoad_100y
WS Max WS - ALT2_Brown:50y r_ev ent:RAS-BrownRd_50y r
WS Max WS - ALT2_Brown:25y r_ev ent:RAS-BrownRd_25y r
WS Max WS - ALT2_Brown:10y r_ev ent:RAS-BrownRd_10y r
WS Max WS - ALT2_Brown:05y r_ev ent:RAS-BrownRd_5y r
WS Max WS - ALT2_Brown:02y r_ev ent:RAS-BrownRd_2y r
Ground
0.37
B -
...
0.74
C -
...
0.83
Thi
s is .
..
0.93
***
VAL
LEY.
..
1.16
D -
***
FI...
1.63
E -
FIS
-E ..
.
1.73
D
.S. O
GLE
SBY
R...
2.17
G -
FI
S-G
VAL
L...
Stru
ctur
e re
vised
bas
ed o
n...
2.81
I -
FIS
-I U.
S. L
ON
G ...
adj in
vert
3.15
B
ROW
NSV
ILLE
RO
AD
D.S
.;...
3.39
K -
FIS
-K V
ALL
EY
SEC
TIO
N .
..S
weet
wat
er A
ve -
New
ly a
dded
stru
ctur
...
3.78
L -
***
XS
EC 3
.83
FIS
-L D
.S. T
HO
...
4.31
M -
***
FIS-
M V
ALL
EY
SEC
TIO
N
***...
4.51
..
.4.
61 T
his i
s a R
EPEA
TED
sect
ion.
4.72
N
&S R
AILW
AY
D.S
.
...
4.76
O -
FIS
-O V
ALL
EY
SEC
TIO
N U
.S. U
S 27
8
...
4.86
...
5.06
P -
Thi
s is
a R
EPE
ATED
secti
on.
5.21
..
.
5.32
C
SX R
AILW
AY
D.S
.
...
5.42
***
US
278
CU
LV D
.S.
**
*NE
W***
*****
...5.
49 *
** V
ALLE
Y SE
CTIO
N
*
**NEW
*****
***
.
..
5.75
R -
***
FIS-
R V
ALLE
Y S
ECT
ION
***
MO
DIF
IED*
**
...
6.02
S -
FIS
-S V
ALL
EY
SEC
TIO
N
...
PowderSpringsCrk PSC1

Sweetwater Creek Feasibility Report
96
0 10000 20000 30000 40000 50000 60000 70000
700
750
800
850
900
Sweetwater_Unsteady Pl an: 1) ALT2_Brown:02yr_event:RAS-BrownRd_2yr 8/30/2017 2) ALT2_Brown:05yr_event:RAS-BrownRd_5yr 8/30/2017 3) ALT2_Brown:10yr_event:RAS-BrownRd_10yr 8/30/2017 4) ALT2_Brown:25yr_event:RAS-BrownRd_25yr 9/5/2017 5) ALT2_Brown:50yr_event:RAS-BrownRd_50yr 8/30/2017 6) ALT2_Brown:100yr_even:RAS-BrownRoad_100yr 8/30/2017 7) ALT2_Brown:200yr_even:RAS-BrownRd_200yr 8/30/2017 8) ALT2_Brown:500yr_even:RAS-BrownRd_500yr 8/30/2017
Main Channel Distance (f t)
Ele
vatio
n (ft
)
Legend
WS Max WS - ALT2_Brown:500y r_even:RAS-BrownRd_500y r
WS Max WS - ALT2_Brown:200y r_even:RAS-BrownRd_200y r
WS Max WS - ALT2_Brown:100y r_even:RAS-BrownRoad_100y
WS Max WS - ALT2_Brown:50y r_ev ent:RAS-BrownRd_50y r
WS Max WS - ALT2_Brown:25y r_ev ent:RAS-BrownRd_25y r
WS Max WS - ALT2_Brown:10y r_ev ent:RAS-BrownRd_10y r
WS Max WS - ALT2_Brown:05y r_ev ent:RAS-BrownRd_5y r
WS Max WS - ALT2_Brown:02y r_ev ent:RAS-BrownRd_2y r
Ground
SW
02 -
Rive
rs...
SW
03 -
Sta
te P
ark
**IF
WA
TER
IS A
BOV
E LE
FTT
BAN
K, D
ELET
E AL
L LE
FT L
EVEE
S TH
ROU
GH
2580
8
SW
04 -
Bla
irs B
ridge
Roa
dS
W05
- In
ters
tate
20
SW
07 -
Sky
view
Driv
e
SW
08 -
Thor
nton
Rd
SW
12 (D
ougl
as C
o) -
OLD
ALA
BAM
A R
OAD
Sweetwater Creek SWC6

Sweetwater Creek Feasibility Report
97
*Main Channel Distance (ft) values should be added to STA 63230 from SWC6 reach above for a continuous profile.
Alternative 4
0 20000 40000 60000 80000860
870
880
890
900
910
920
930
Sweetwater_Unsteady Pl an: 1) ALT2_Brown:02yr_event:RAS-BrownRd_2yr 8/30/2017 2) ALT2_Brown:05yr_event:RAS-BrownRd_5yr 8/30/2017 3) ALT2_Brown:10yr_event:RAS-BrownRd_10yr 8/30/2017 4) ALT2_Brown:25yr_event:RAS-BrownRd_25yr 9/5/2017 5) ALT2_Brown:50yr_event:RAS-BrownRd_50yr 8/30/2017 6) ALT2_Brown:100yr_even:RAS-BrownRoad_100yr 8/30/2017 7) ALT2_Brown:200yr_even:RAS-BrownRd_200yr 8/30/2017 8) ALT2_Brown:500yr_even:RAS-BrownRd_500yr 8/30/2017
Main Channel Distance (f t)
Ele
vatio
n (ft
)
Legend
WS Max WS - ALT2_Brown:500y r_even:RAS-BrownRd_500y r
WS Max WS - ALT2_Brown:200y r_even:RAS-BrownRd_200y r
WS Max WS - ALT2_Brown:100y r_even:RAS-BrownRoad_100y
WS Max WS - ALT2_Brown:50y r_ev ent:RAS-BrownRd_50y r
WS Max WS - ALT2_Brown:25y r_ev ent:RAS-BrownRd_25y r
WS Max WS - ALT2_Brown:10y r_ev ent:RAS-BrownRd_10y r
WS Max WS - ALT2_Brown:05y r_ev ent:RAS-BrownRd_5y r
WS Max WS - ALT2_Brown:02y r_ev ent:RAS-BrownRd_2y r
Ground
surv
ey...
surv
eye.
..S
cour
hol
...su
rvey
ed
surv
eyed
surv
eyed
surv
ey
Sco
ur h
oles
wer
...su
rvey
ed
surv
eyed
Sco
ur h
ole
appr
ox...
Sco
ur h
oles
wer
e no
t ...
Sco
ur h
oles
wer
e no
t o...
surv
eyed
surv
eyed
SW
20 -
HIR
AM L
ITHI
A SP
RIN
GS.
..
surv
eyed
Sco
ur h
oles
wer
e no
t obs
erve
d du
...su
rvey
ed
surv
eyed
Bro
wn R
oad
surv
eyed
Sco
ur h
oles
wer
e no
t obs
erve
d du
ring
5/9/
2017
...
FIS
XS B
FIS
XS D
FIS
XS E
FIS
XS F
Sweetwater Creek SWC5
Sweetwater Creek SWC4
Sweetwater Creek SWC3 Sweetwater Creek SWC2 Sweetwater Creek SWC1

Sweetwater Creek Feasibility Report
98
0 2000 4000 6000 8000 10000
860
870
880
890
900
910
Sweetwater_Unsteady Plan: 1) ALT4A_100yr 9/27/2017 2) ALT4A_2yr 9/27/2017 3) ALT4A_5yr 9/27/2017 4) ALT4A_10yr 9/27/2017 5) ALT4A_25yr 9/27/2017 6) ALT4A_50yr 9/27/2017 7) ALT4A_200yr 9/27/2017 8) ALT4A_500yr 9/27/2017
Main Channel Distance (f t)
Ele
vatio
n (ft
)
Legend
WS Max WS - ALT4A_500y r
WS Max WS - ALT4A_200y r
WS Max WS - ALT4A_100y r
WS Max WS - ALT4A_50y r
WS Max WS - ALT4A_25y r
WS Max WS - ALT4A_10y r
WS Max WS - ALT4A_5y r
WS Max WS - ALT4A_2y r
Ground
Max
ham
Roa
d - D
imen
sions
...
VET
ER
ANS
MEM
ORI
AL H
WY
- Dim
ensio
ns v
erfie
d wi
th a
ppro
xim
ate
fie...
Col
lins B
lvd -
App
roxi
mat
e fie
ld su
rvey
colle
cted
5/9/
17
Butterm ilk Creek BMC1

Sweetwater Creek Feasibility Report
99
0 2000 4000 6000 8000 10000 12000 14000 16000
885
890
895
900
905
910
915
920
925
Sweetwater_Unsteady Plan: 1) ALT4A_100yr 9/27/2017 2) ALT4A_2yr 9/27/2017 3) ALT4A_5yr 9/27/2017 4) ALT4A_10yr 9/27/2017 5) ALT4A_25yr 9/27/2017 6) ALT4A_50yr 9/27/2017 7) ALT4A_200yr 9/27/2017 8) ALT4A_500yr 9/27/2017
Main Channel Distance (f t)
Ele
vatio
n (ft
)
Legend
WS Max WS - ALT4A_500y r
WS Max WS - ALT4A_200y r
WS Max WS - ALT4A_100y r
WS Max WS - ALT4A_50y r
WS Max WS - ALT4A_25y r
WS Max WS - ALT4A_10y r
WS Max WS - ALT4A_5y r
WS Max WS - ALT4A_2y r
Ground
MillCrk MIC1
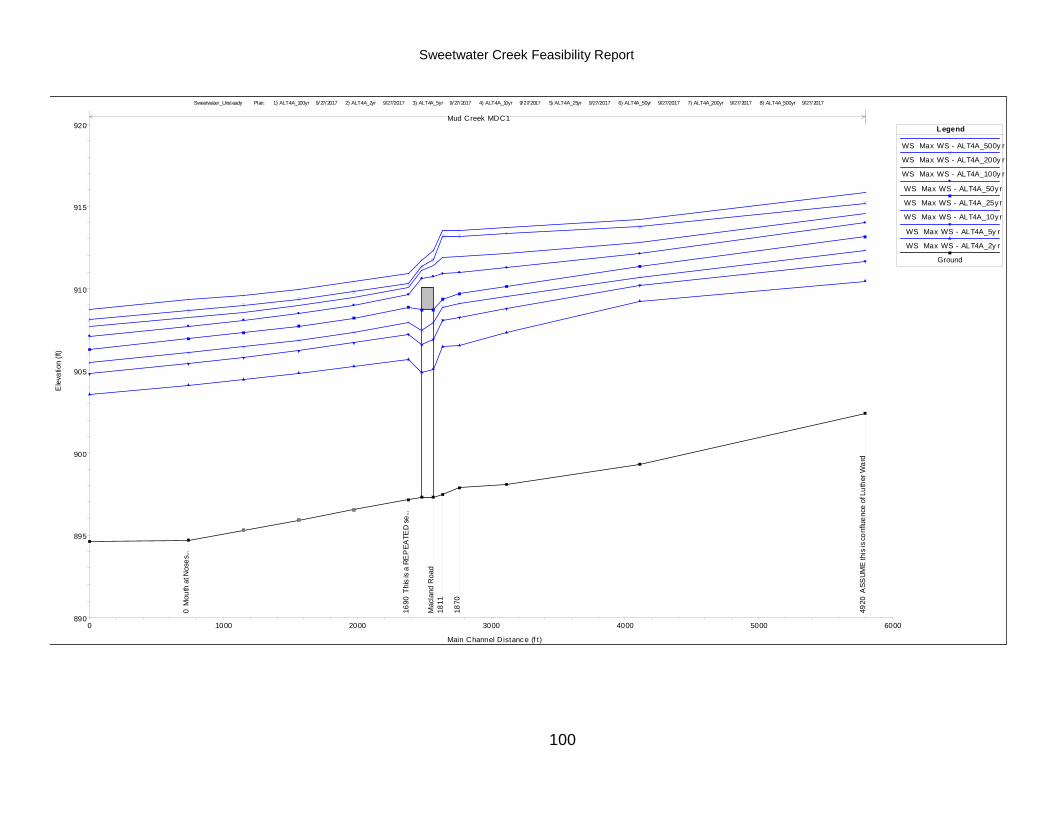
Sweetwater Creek Feasibility Report
100
0 1000 2000 3000 4000 5000 6000
890
895
900
905
910
915
920
Sweetwater_Unsteady Plan: 1) ALT4A_100yr 9/27/2017 2) ALT4A_2yr 9/27/2017 3) ALT4A_5yr 9/27/2017 4) ALT4A_10yr 9/27/2017 5) ALT4A_25yr 9/27/2017 6) ALT4A_50yr 9/27/2017 7) ALT4A_200yr 9/27/2017 8) ALT4A_500yr 9/27/2017
Main Channel Distance (f t)
Ele
vatio
n (ft
)
Legend
WS Max WS - ALT4A_500y r
WS Max WS - ALT4A_200y r
WS Max WS - ALT4A_100y r
WS Max WS - ALT4A_50y r
WS Max WS - ALT4A_25y r
WS Max WS - ALT4A_10y r
WS Max WS - ALT4A_5y r
WS Max WS - ALT4A_2y r
Ground
0 M
outh
at N
oses
...
1690
Thi
s is
a RE
PEA
TED
se...
Mac
land
Roa
d18
11
1870
4920
ASS
UME
this
is co
nflu
ence
of L
uthe
r War
d
Mud Creek MDC1

Sweetwater Creek Feasibility Report
101
0 5000 10000 15000 20000 25000 30000 35000
860
870
880
890
900
910
920
930
Sweetwater_Unsteady Plan: 1) ALT4A_100yr 9/27/2017 2) ALT4A_2yr 9/27/2017 3) ALT4A_5yr 9/27/2017 4) ALT4A_10yr 9/27/2017 5) ALT4A_25yr 9/27/2017 6) ALT4A_50yr 9/27/2017 7) ALT4A_200yr 9/27/2017 8) ALT4A_500yr 9/27/2017
Main Channel Distance (f t)
Ele
vatio
n (ft
)
Legend
WS Max WS - ALT4A_500y r
WS Max WS - ALT4A_200y r
WS Max WS - ALT4A_100y r
WS Max WS - ALT4A_50y r
WS Max WS - ALT4A_25y r
WS Max WS - ALT4A_10y r
WS Max WS - ALT4A_5y r
WS Max WS - ALT4A_2y r
Ground
CLA
Y R
D, B
RID
GE
SKEW
NES.
..
Silv
er C
omet
Tra
il
PO
WD
ER
SPRI
NG R
D
Sur
veye
d X
S
Sur
veye
d X
S
ERN
EST
BARR
ETT
PKW
Y,SK
EW
NESS
IS A
PPLI
ED
Noses Creek NCC2 Noses Creek NCC1

Sweetwater Creek Feasibility Report
102
0 2000 4000 6000 8000 10000 12000 14000
860
880
900
920
940
960
Sweetwater_Unsteady Plan: 1) ALT4A_100yr 9/27/2017 2) ALT4A_2yr 9/27/2017 3) ALT4A_5yr 9/27/2017 4) ALT4A_10yr 9/27/2017 5) ALT4A_25yr 9/27/2017 6) ALT4A_50yr 9/27/2017 7) ALT4A_200yr 9/27/2017 8) ALT4A_500yr 9/27/2017
Main Channel Distance (f t)
Ele
vatio
n (ft
)
Legend
WS Max WS - ALT4A_500y r
WS Max WS - ALT4A_200y r
WS Max WS - ALT4A_100y r
WS Max WS - ALT4A_50y r
WS Max WS - ALT4A_25y r
WS Max WS - ALT4A_10y r
WS Max WS - ALT4A_5y r
WS Max WS - ALT4A_2y r
Ground
OC-
1
B19
1136
069,
Cla
y Roa
d...
OC-
3
B19
1011
070,
Flin
t Hill
Road
...
B17
0136
079,
Silv
er C
omet
RR
Brid
g...
Olley Creek OLC1

Sweetwater Creek Feasibility Report
103
0 5000 10000 15000 20000 25000 30000 35000
870
880
890
900
910
920
930
940
Sweetwater_Unsteady Plan: 1) ALT4A_100yr 9/27/2017 2) ALT4A_2yr 9/27/2017 3) ALT4A_5yr 9/27/2017 4) ALT4A_10yr 9/27/2017 5) ALT4A_25yr 9/27/2017 6) ALT4A_50yr 9/27/2017 7) ALT4A_200yr 9/27/2017 8) ALT4A_500yr 9/27/2017
Main Channel Distance (f t)
Ele
vatio
n (ft
)
Legend
WS Max WS - ALT4A_500y r
WS Max WS - ALT4A_200y r
WS Max WS - ALT4A_100y r
WS Max WS - ALT4A_50y r
WS Max WS - ALT4A_25y r
WS Max WS - ALT4A_10y r
WS Max WS - ALT4A_5y r
WS Max WS - ALT4A_2y r
Ground
0.37
B -
...
0.74
C -
...
0.83
Thi
s is .
..
0.93
***
VAL
LEY.
..
1.16
D -
***
FI...
1.63
E -
FIS
-E ..
.
1.73
D
.S. O
GLE
SBY
R...
2.17
G -
FI
S-G
VAL
L...
Stru
ctur
e re
vised
bas
ed o
n...
2.81
I -
FIS
-I U.
S. L
ON
G ...
adj in
vert
3.15
B
ROW
NSV
ILLE
RO
AD
D.S
.;...
adj in
vert
3.39
K -
FIS
-K V
ALL
EY
SEC
TIO
N .
..
Swe
etw
ater
Ave
- N
ewly
add
ed s
truct
ur...
3.78
L -
***
XS
EC 3
.83
FIS
-L D
.S. T
HO
...3.
889
Thi
s is
a R
EPE
ATE
D se
ctio
n.
4.31
M -
***
FIS-
M V
ALL
EY
SEC
TIO
N
***...
4.51
..
.
4.61
Thi
s is a
REP
EATE
D se
ctio
n.
4.72
N
&S R
AILW
AY
D.S
.
...
4.76
O -
FIS
-O V
ALL
EY
SEC
TIO
N U
.S. U
S 27
8
...
4.86
...
5.06
P -
Thi
s is
a R
EPE
ATED
secti
on.
5.21
..
.
5.32
C
SX R
AILW
AY
D.S
.
...
5.42
***
US
278
CU
LV D
.S.
**
*NE
W***
*****
...5.
49 *
** V
ALLE
Y SE
CTIO
N
*
**NEW
*****
***
.
..
5.75
R -
***
FIS-
R V
ALLE
Y S
ECT
ION
***
MO
DIF
IED*
**
...
6.02
S -
FIS
-S V
ALL
EY
SEC
TIO
N
...
PowderSpringsCrk PSC1

Sweetwater Creek Feasibility Report
104
0 10000 20000 30000 40000 50000 60000 70000
700
750
800
850
900
Sweetwater_Unsteady Plan: 1) ALT4A_100yr 9/27/2017 2) ALT4A_2yr 9/27/2017 3) ALT4A_5yr 9/27/2017 4) ALT4A_10yr 9/27/2017 5) ALT4A_25yr 9/27/2017 6) ALT4A_50yr 9/27/2017 7) ALT4A_200yr 9/27/2017 8) ALT4A_500yr 9/27/2017
Main Channel Distance (f t)
Ele
vatio
n (ft
)
Legend
WS Max WS - ALT4A_500y r
WS Max WS - ALT4A_200y r
WS Max WS - ALT4A_100y r
WS Max WS - ALT4A_50y r
WS Max WS - ALT4A_25y r
WS Max WS - ALT4A_10y r
WS Max WS - ALT4A_5y r
WS Max WS - ALT4A_2y r
Ground
SW
02 -
Rive
rs...
SW
03 -
Sta
te P
ark
**IF
WA
TER
IS A
BOV
E LE
FTT
BAN
K, D
ELET
E AL
L LE
FT L
EVEE
S TH
ROU
GH
2580
8
SW
04 -
Bla
irs B
ridge
Roa
dS
W05
- In
ters
tate
20
SW
07 -
Sky
view
Driv
e
SW
08 -
Thor
nton
Rd
SW
12 (D
ougl
as C
o) -
OLD
ALA
BAM
A R
OAD
Sweetwater Creek SWC6

Sweetwater Creek Feasibility Report
105
* Main Channel Distance (ft) values should be added to STA 63230 from SWC6 reach above for a continuous profile
Alternative 5D
0 20000 40000 60000 80000860
870
880
890
900
910
920
930
Sweetwater_Unsteady Plan: 1) ALT4A_100yr 9/27/2017 2) ALT4A_2yr 9/27/2017 3) ALT4A_5yr 9/27/2017 4) ALT4A_10yr 9/27/2017 5) ALT4A_25yr 9/27/2017 6) ALT4A_50yr 9/27/2017 7) ALT4A_200yr 9/27/2017 8) ALT4A_500yr 9/27/2017
Main Channel Distance (f t)
Ele
vatio
n (ft
)
Legend
WS Max WS - ALT4A_500y r
WS Max WS - ALT4A_200y r
WS Max WS - ALT4A_100y r
WS Max WS - ALT4A_50y r
WS Max WS - ALT4A_25y r
WS Max WS - ALT4A_10y r
WS Max WS - ALT4A_5y r
WS Max WS - ALT4A_2y r
Ground
su...
surv
e...
Sco
ur...
surv
ey...
surv
eye.
..S
W15
- P
...
surv
eyed
surv
ey
Sco
ur h
oles
w...
surv
eyed
surv
eyed
Sco
ur h
ole
appr
oxi..
.
Sco
ur h
oles
wer
e no
...S
cour
hol
es w
ere
not...
surv
eyed
surv
eyed
SW
20 -
HIR
AM L
ITHI
A SP
RIN
GS.
..
surv
eyed
Sco
ur h
oles
wer
e no
t obs
erve
d du
...su
rvey
ed
surv
eyed
SW
22 -
BRO
WN
RO
AD
surv
eyed
Sco
ur h
oles
wer
e no
t obs
erve
d du
ring
5/9/
2017
...
FIS
XS B
FIS
XS D
FIS
XS E
FIS
XS F
Sweetwater Creek SWC5 Sweetwater Creek SWC4
Sweetwater Creek SWC3 Sweetwater Creek SWC2 Sweetwater Creek SWC1

Sweetwater Creek Feasibility Report
106
0 2000 4000 6000 8000 10000860
870
880
890
900
910
Sweetwater_Unsteady Pl an: 1) ALT 5D_Mul:02yr_event :RAS-ALT_5D_2yr 9/8/2017 2) ALT 5D_Mul:05yr_event:RAS-ALT_5D_5yr 9/8/2017 3) ALT 5D_Mul:10yr_event:RAS-ALT_5D_10yr 9/8/2017 4) ALT 5D_Mul:25yr_event:RAS-ALT_5D_25yr 9/8/2017 5) ALT 5D_Mul:50yr_event:RAS-ALT_5D_50yr 9/8/2017 6) ALT 5D_Mul :100yr_even:RAS-ALT_5D_100yr 9/8/2017 7) ALT 5D_Mul :200yr_even:RAS-ALT_5D_200yr 9/8/2017 8) ALT 5D_Mul :500yr_even:RAS-ALT_5D_500yr 9/8/2017
Main Channel Distance (f t)
Ele
vatio
n (ft
)
Legend
WS Max WS - ALT 5D_Mul:500y r_ev en:RAS-ALT_5D_500y
WS Max WS - ALT 5D_Mul:200y r_ev en:RAS-ALT_5D_200y
WS Max WS - ALT 5D_Mul:100y r_ev en:RAS-ALT_5D_100y
WS Max WS - ALT 5D_Mul:50y r_ev ent:RAS-ALT_5D_50y
WS Max WS - ALT 5D_Mul:25y r_ev ent:RAS-ALT_5D_25y
WS Max WS - ALT 5D_Mul:10y r_ev ent:RAS-ALT_5D_10y
WS Max WS - ALT 5D_Mul:05y r_ev ent:RAS-ALT_5D_5y r
WS Max WS - ALT 5D_Mul:02y r_ev ent:RAS-ALT_5D_2y r
Ground
Max
ham
Roa
d - D
imen
sions
...
VET
ER
ANS
MEM
ORI
AL H
WY
- Dim
ensio
ns v
erfie
d wi
th a
ppro
xim
ate
fie...
Col
lins B
lvd -
App
roxi
mat
e fie
ld su
rvey
colle
cted
5/9/
17
Butterm ilk Creek BMC1
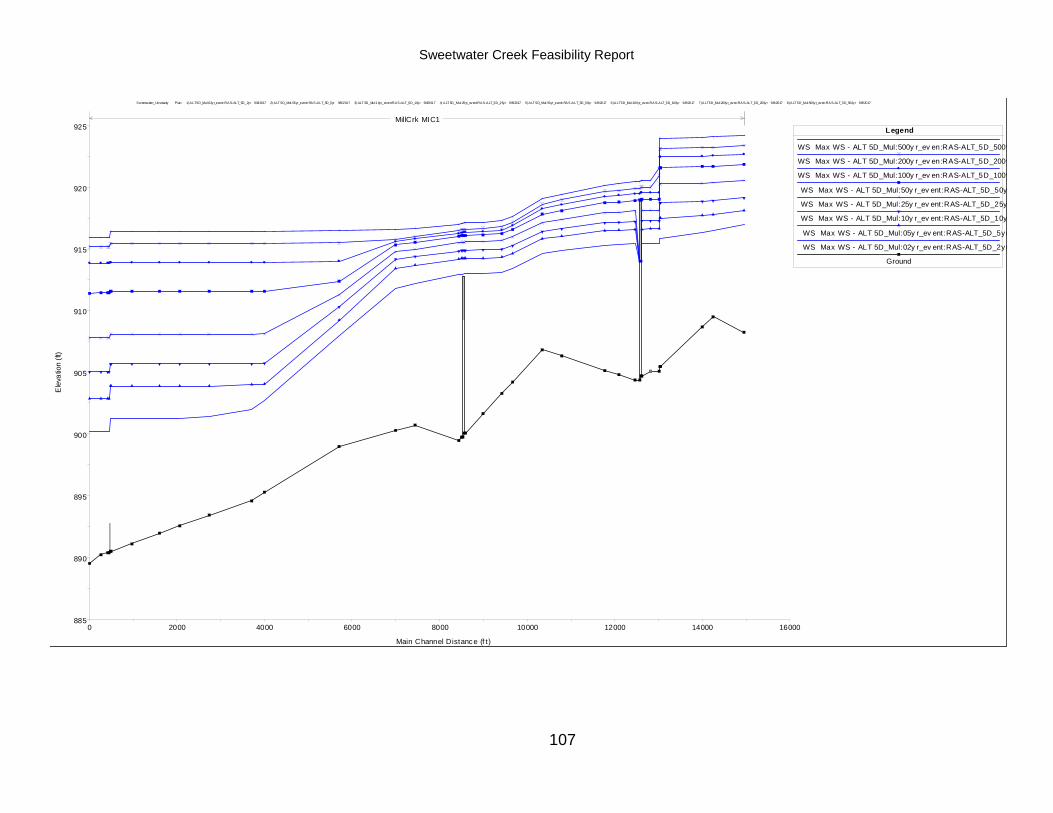
Sweetwater Creek Feasibility Report
107
0 2000 4000 6000 8000 10000 12000 14000 16000
885
890
895
900
905
910
915
920
925
Sweetwater_Unsteady Pl an: 1) ALT 5D_Mul:02yr_event :RAS-ALT_5D_2yr 9/8/2017 2) ALT 5D_Mul:05yr_event:RAS-ALT_5D_5yr 9/8/2017 3) ALT 5D_Mul:10yr_event:RAS-ALT_5D_10yr 9/8/2017 4) ALT 5D_Mul:25yr_event:RAS-ALT_5D_25yr 9/8/2017 5) ALT 5D_Mul:50yr_event:RAS-ALT_5D_50yr 9/8/2017 6) ALT 5D_Mul :100yr_even:RAS-ALT_5D_100yr 9/8/2017 7) ALT 5D_Mul :200yr_even:RAS-ALT_5D_200yr 9/8/2017 8) ALT 5D_Mul :500yr_even:RAS-ALT_5D_500yr 9/8/2017
Main Channel Distance (f t)
Ele
vatio
n (ft
)
Legend
WS Max WS - ALT 5D_Mul:500y r_ev en:RAS-ALT_5D_500y
WS Max WS - ALT 5D_Mul:200y r_ev en:RAS-ALT_5D_200y
WS Max WS - ALT 5D_Mul:100y r_ev en:RAS-ALT_5D_100y
WS Max WS - ALT 5D_Mul:50y r_ev ent:RAS-ALT_5D_50y
WS Max WS - ALT 5D_Mul:25y r_ev ent:RAS-ALT_5D_25y
WS Max WS - ALT 5D_Mul:10y r_ev ent:RAS-ALT_5D_10y
WS Max WS - ALT 5D_Mul:05y r_ev ent:RAS-ALT_5D_5y r
WS Max WS - ALT 5D_Mul:02y r_ev ent:RAS-ALT_5D_2y r
Ground
MillCrk MIC1

Sweetwater Creek Feasibility Report
108
0 1000 2000 3000 4000 5000 6000
890
895
900
905
910
915
920
Sweetwater_Unsteady Pl an: 1) ALT 5D_Mul:02yr_event :RAS-ALT_5D_2yr 9/8/2017 2) ALT 5D_Mul:05yr_event:RAS-ALT_5D_5yr 9/8/2017 3) ALT 5D_Mul:10yr_event:RAS-ALT_5D_10yr 9/8/2017 4) ALT 5D_Mul:25yr_event:RAS-ALT_5D_25yr 9/8/2017 5) ALT 5D_Mul:50yr_event:RAS-ALT_5D_50yr 9/8/2017 6) ALT 5D_Mul :100yr_even:RAS-ALT_5D_100yr 9/8/2017 7) ALT 5D_Mul :200yr_even:RAS-ALT_5D_200yr 9/8/2017 8) ALT 5D_Mul :500yr_even:RAS-ALT_5D_500yr 9/8/2017
Main Channel Distance (f t)
Ele
vatio
n (ft
)
Legend
WS Max WS - ALT 5D_Mul:500y r_ev en:RAS-ALT_5D_500y
WS Max WS - ALT 5D_Mul:200y r_ev en:RAS-ALT_5D_200y
WS Max WS - ALT 5D_Mul:100y r_ev en:RAS-ALT_5D_100y
WS Max WS - ALT 5D_Mul:50y r_ev ent:RAS-ALT_5D_50y
WS Max WS - ALT 5D_Mul:25y r_ev ent:RAS-ALT_5D_25y
WS Max WS - ALT 5D_Mul:10y r_ev ent:RAS-ALT_5D_10y
WS Max WS - ALT 5D_Mul:05y r_ev ent:RAS-ALT_5D_5y r
WS Max WS - ALT 5D_Mul:02y r_ev ent:RAS-ALT_5D_2y r
Ground
0 M
outh
at N
oses
...
1690
Thi
s is
a RE
PEA
TED
se...
Mac
land
Roa
d18
11
1870
4920
ASS
UME
this
is co
nflu
ence
of L
uthe
r War
d
Mud Creek MDC1

Sweetwater Creek Feasibility Report
109
0 5000 10000 15000 20000 25000 30000 35000
860
870
880
890
900
910
920
930
Sweetwater_Unsteady Pl an: 1) ALT 5D_Mul:02yr_event :RAS-ALT_5D_2yr 9/8/2017 2) ALT 5D_Mul:05yr_event:RAS-ALT_5D_5yr 9/8/2017 3) ALT 5D_Mul:10yr_event:RAS-ALT_5D_10yr 9/8/2017 4) ALT 5D_Mul:25yr_event:RAS-ALT_5D_25yr 9/8/2017 5) ALT 5D_Mul:50yr_event:RAS-ALT_5D_50yr 9/8/2017 6) ALT 5D_Mul :100yr_even:RAS-ALT_5D_100yr 9/8/2017 7) ALT 5D_Mul :200yr_even:RAS-ALT_5D_200yr 9/8/2017 8) ALT 5D_Mul :500yr_even:RAS-ALT_5D_500yr 9/8/2017
Main Channel Distance (f t)
Ele
vatio
n (ft
)
Legend
WS Max WS - ALT 5D_Mul:500y r_ev en:RAS-ALT_5D_500y
WS Max WS - ALT 5D_Mul:200y r_ev en:RAS-ALT_5D_200y
WS Max WS - ALT 5D_Mul:100y r_ev en:RAS-ALT_5D_100y
WS Max WS - ALT 5D_Mul:50y r_ev ent:RAS-ALT_5D_50y
WS Max WS - ALT 5D_Mul:25y r_ev ent:RAS-ALT_5D_25y
WS Max WS - ALT 5D_Mul:10y r_ev ent:RAS-ALT_5D_10y
WS Max WS - ALT 5D_Mul:05y r_ev ent:RAS-ALT_5D_5y r
WS Max WS - ALT 5D_Mul:02y r_ev ent:RAS-ALT_5D_2y r
Ground
CLA
Y R
D, B
RID
GE
SKEW
NES.
..
Silv
er C
omet
Tra
il
PO
WD
ER
SPRI
NG R
D
Sur
veye
d X
S
Sur
veye
d X
S
ERN
EST
BARR
ETT
PKW
Y,SK
EW
NESS
IS A
PPLI
ED
Noses Creek NCC2 Noses Creek NCC1

Sweetwater Creek Feasibility Report
110
0 2000 4000 6000 8000 10000 12000 14000
860
880
900
920
940
960
Sweetwater_Unsteady Pl an: 1) ALT 5D_Mul:02yr_event :RAS-ALT_5D_2yr 9/8/2017 2) ALT 5D_Mul:05yr_event:RAS-ALT_5D_5yr 9/8/2017 3) ALT 5D_Mul:10yr_event:RAS-ALT_5D_10yr 9/8/2017 4) ALT 5D_Mul:25yr_event:RAS-ALT_5D_25yr 9/8/2017 5) ALT 5D_Mul:50yr_event:RAS-ALT_5D_50yr 9/8/2017 6) ALT 5D_Mul :100yr_even:RAS-ALT_5D_100yr 9/8/2017 7) ALT 5D_Mul :200yr_even:RAS-ALT_5D_200yr 9/8/2017 8) ALT 5D_Mul :500yr_even:RAS-ALT_5D_500yr 9/8/2017
Main Channel Distance (f t)
Ele
vatio
n (ft
)
Legend
WS Max WS - ALT 5D_Mul:500y r_ev en:RAS-ALT_5D_500y
WS Max WS - ALT 5D_Mul:200y r_ev en:RAS-ALT_5D_200y
WS Max WS - ALT 5D_Mul:100y r_ev en:RAS-ALT_5D_100y
WS Max WS - ALT 5D_Mul:50y r_ev ent:RAS-ALT_5D_50y
WS Max WS - ALT 5D_Mul:25y r_ev ent:RAS-ALT_5D_25y
WS Max WS - ALT 5D_Mul:10y r_ev ent:RAS-ALT_5D_10y
WS Max WS - ALT 5D_Mul:05y r_ev ent:RAS-ALT_5D_5y r
WS Max WS - ALT 5D_Mul:02y r_ev ent:RAS-ALT_5D_2y r
Ground
OC-
1
B19
1136
069,
Cla
y Roa
d...
OC-
3
B19
1011
070,
Flin
t Hill
Road
...
Gol
f Cou
rse
B17
0136
079,
Silv
er C
omet
RR
Brid
g...
Olley Creek OLC1
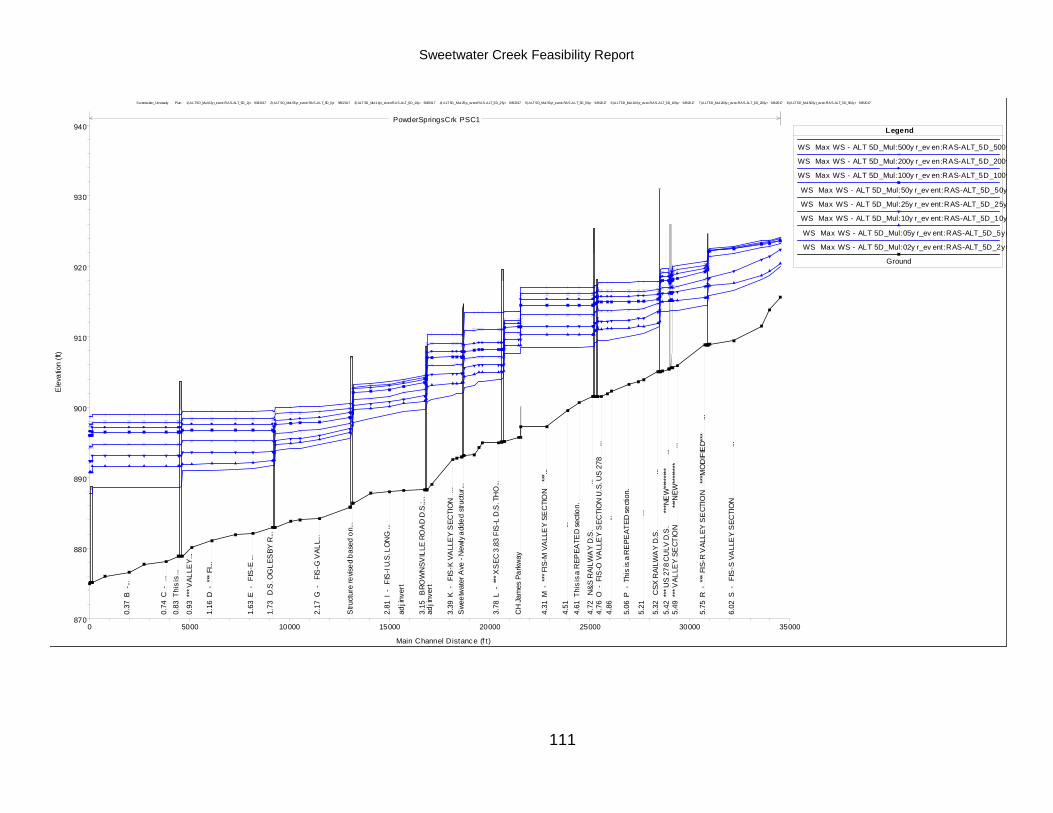
Sweetwater Creek Feasibility Report
111
0 5000 10000 15000 20000 25000 30000 35000
870
880
890
900
910
920
930
940
Sweetwater_Unsteady Pl an: 1) ALT 5D_Mul:02yr_event :RAS-ALT_5D_2yr 9/8/2017 2) ALT 5D_Mul:05yr_event:RAS-ALT_5D_5yr 9/8/2017 3) ALT 5D_Mul:10yr_event:RAS-ALT_5D_10yr 9/8/2017 4) ALT 5D_Mul:25yr_event:RAS-ALT_5D_25yr 9/8/2017 5) ALT 5D_Mul:50yr_event:RAS-ALT_5D_50yr 9/8/2017 6) ALT 5D_Mul :100yr_even:RAS-ALT_5D_100yr 9/8/2017 7) ALT 5D_Mul :200yr_even:RAS-ALT_5D_200yr 9/8/2017 8) ALT 5D_Mul :500yr_even:RAS-ALT_5D_500yr 9/8/2017
Main Channel Distance (f t)
Ele
vatio
n (ft
)
Legend
WS Max WS - ALT 5D_Mul:500y r_ev en:RAS-ALT_5D_500y
WS Max WS - ALT 5D_Mul:200y r_ev en:RAS-ALT_5D_200y
WS Max WS - ALT 5D_Mul:100y r_ev en:RAS-ALT_5D_100y
WS Max WS - ALT 5D_Mul:50y r_ev ent:RAS-ALT_5D_50y
WS Max WS - ALT 5D_Mul:25y r_ev ent:RAS-ALT_5D_25y
WS Max WS - ALT 5D_Mul:10y r_ev ent:RAS-ALT_5D_10y
WS Max WS - ALT 5D_Mul:05y r_ev ent:RAS-ALT_5D_5y r
WS Max WS - ALT 5D_Mul:02y r_ev ent:RAS-ALT_5D_2y r
Ground
0.37
B -
...
0.74
C -
...
0.83
Thi
s is .
..
0.93
***
VAL
LEY.
..
1.16
D -
***
FI...
1.63
E -
FIS
-E ..
.
1.73
D
.S. O
GLE
SBY
R...
2.17
G -
FI
S-G
VAL
L...
Stru
ctur
e re
vised
bas
ed o
n...
2.81
I -
FIS
-I U.
S. L
ON
G ...
adj in
vert
3.15
B
ROW
NSV
ILLE
RO
AD
D.S
.;...
adj in
vert
3.39
K -
FIS
-K V
ALL
EY
SEC
TIO
N .
..S
weet
wat
er A
ve -
New
ly a
dded
stru
ctur
...
3.78
L -
***
XS
EC 3
.83
FIS
-L D
.S. T
HO
...
CH
Jam
es P
arkw
ay
4.31
M -
***
FIS-
M V
ALL
EY
SEC
TIO
N
***...
4.51
..
.4.
61 T
his i
s a R
EPEA
TED
sect
ion.
4.72
N
&S R
AILW
AY
D.S
.
...
4.76
O -
FIS
-O V
ALL
EY
SEC
TIO
N U
.S. U
S 27
8
...
4.86
...
5.06
P -
Thi
s is
a R
EPE
ATED
secti
on.
5.21
..
.
5.32
C
SX R
AILW
AY
D.S
.
...
5.42
***
US
278
CU
LV D
.S.
**
*NE
W***
*****
...5.
49 *
** V
ALLE
Y SE
CTIO
N
*
**NEW
*****
***
.
..
5.75
R -
***
FIS-
R V
ALLE
Y S
ECT
ION
***
MO
DIF
IED*
**
...
6.02
S -
FIS
-S V
ALL
EY
SEC
TIO
N
...
PowderSpringsCrk PSC1

Sweetwater Creek Feasibility Report
112
0 10000 20000 30000 40000 50000 60000 70000
700
750
800
850
900
Sweetwater_Unsteady Pl an: 1) ALT 5D_Mul:02yr_event :RAS-ALT_5D_2yr 9/8/2017 2) ALT 5D_Mul:05yr_event:RAS-ALT_5D_5yr 9/8/2017 3) ALT 5D_Mul:10yr_event:RAS-ALT_5D_10yr 9/8/2017 4) ALT 5D_Mul:25yr_event:RAS-ALT_5D_25yr 9/8/2017 5) ALT 5D_Mul:50yr_event:RAS-ALT_5D_50yr 9/8/2017 6) ALT 5D_Mul :100yr_even:RAS-ALT_5D_100yr 9/8/2017 7) ALT 5D_Mul :200yr_even:RAS-ALT_5D_200yr 9/8/2017 8) ALT 5D_Mul :500yr_even:RAS-ALT_5D_500yr 9/8/2017
Main Channel Distance (f t)
Ele
vatio
n (ft
)
Legend
WS Max WS - ALT 5D_Mul:500y r_ev en:RAS-ALT_5D_500y
WS Max WS - ALT 5D_Mul:200y r_ev en:RAS-ALT_5D_200y
WS Max WS - ALT 5D_Mul:100y r_ev en:RAS-ALT_5D_100y
WS Max WS - ALT 5D_Mul:50y r_ev ent:RAS-ALT_5D_50y
WS Max WS - ALT 5D_Mul:25y r_ev ent:RAS-ALT_5D_25y
WS Max WS - ALT 5D_Mul:10y r_ev ent:RAS-ALT_5D_10y
WS Max WS - ALT 5D_Mul:05y r_ev ent:RAS-ALT_5D_5y r
WS Max WS - ALT 5D_Mul:02y r_ev ent:RAS-ALT_5D_2y r
Ground
SW
02 -
Rive
rs...
SW
03 -
Sta
te P
ark
**IF
WA
TER
IS A
BOV
E LE
FTT
BAN
K, D
ELET
E AL
L LE
FT L
EVEE
S TH
ROU
GH
2580
8
SW
04 -
Bla
irs B
ridge
Roa
dS
W05
- In
ters
tate
20
SW
07 -
Sky
view
Driv
e
SW
08 -
Thor
nton
Rd
SW
12 (D
ougl
as C
o) -
OLD
ALA
BAM
A R
OAD
Sweetwater Creek SWC6

Sweetwater Creek Feasibility Report
113
* Main Channel Distance (ft) values should be added to STA 63230 from SWC6 reach above for a continuous profile.
Alternative 5F
0 20000 40000 60000 80000860
870
880
890
900
910
920
Sweetwater_Unsteady Pl an: 1) ALT 5D_Mul:02yr_event :RAS-ALT_5D_2yr 9/8/2017 2) ALT 5D_Mul:05yr_event:RAS-ALT_5D_5yr 9/8/2017 3) ALT 5D_Mul:10yr_event:RAS-ALT_5D_10yr 9/8/2017 4) ALT 5D_Mul:25yr_event:RAS-ALT_5D_25yr 9/8/2017 5) ALT 5D_Mul:50yr_event:RAS-ALT_5D_50yr 9/8/2017 6) ALT 5D_Mul :100yr_even:RAS-ALT_5D_100yr 9/8/2017 7) ALT 5D_Mul :200yr_even:RAS-ALT_5D_200yr 9/8/2017 8) ALT 5D_Mul :500yr_even:RAS-ALT_5D_500yr 9/8/2017
Main Channel Distance (f t)
Ele
vatio
n (ft
)
Legend
WS Max WS - ALT 5D_Mul:500y r_ev en:RAS-ALT_5D_500y
WS Max WS - ALT 5D_Mul:200y r_ev en:RAS-ALT_5D_200y
WS Max WS - ALT 5D_Mul:100y r_ev en:RAS-ALT_5D_100y
WS Max WS - ALT 5D_Mul:50y r_ev ent:RAS-ALT_5D_50y
WS Max WS - ALT 5D_Mul:25y r_ev ent:RAS-ALT_5D_25y
WS Max WS - ALT 5D_Mul:10y r_ev ent:RAS-ALT_5D_10y
WS Max WS - ALT 5D_Mul:05y r_ev ent:RAS-ALT_5D_5y r
WS Max WS - ALT 5D_Mul:02y r_ev ent:RAS-ALT_5D_2y r
Ground
surv
eye.
..
surv
eyed
Sco
ur h
oles
...su
rvey
ed
surv
eyed
surv
eyed
surv
ey
Sco
ur h
oles
wer
e ...
surv
eyed
surv
eyed
Sco
ur h
ole
appr
oxim
a...
Sco
ur h
oles
wer
e no
t obs
e...
Sco
ur h
oles
wer
e no
t obs
er...
surv
eyed
surv
eyed
SW
20 -
HIR
AM L
ITHI
A SP
RIN
GS
RD
surv
eyed
Sco
ur h
oles
wer
e no
t obs
erve
d du
ring
...su
rvey
ed
surv
eyed
Bro
wn R
oad
surv
eyed
Sco
ur h
oles
wer
e no
t obs
erve
d du
ring
5/9/
2017
fiel
d r..
.
FIS
XS B
FIS
XS D
FIS
XS E
FIS
XS F
Sweetwater Creek SWC5
Sweetwater Creek SWC4
Sweetwater Creek SWC3 Sweetwater Creek SWC2 Sweetwater Creek SWC1

Sweetwater Creek Feasibility Report
114
0 2000 4000 6000 8000 10000860
870
880
890
900
910
Sweetwater_Unsteady Pl an: 1) ALT 5F_Mul :02yr_event:RAS-ALT_5F_50pct 9/12/2017 2) ALT 5F_Mul:05yr_event:RAS-ALT_5F_20pct 9/12/2017 3) ALT 5F_Mul:10yr_event:RAS-ALT_5F_10pct 9/12/2017 4) ALT 5F_Mul :25yr_event :RAS-ALT_5F_4pct 9/12/2017 5) ALT 5F_Mul:50yr_event :RAS-ALT_5F_2pct 9/12/2017 6) ALT 5F_Mul:100yr_even:RAS-ALT_5F_1pct 9/12/2017 7) ALT 5F_Mul:200yr_even:RAS-ALT_5F_0_5pct 9/12/2017 8) ALT 5F_Mul:500yr_even:RAS-ALT_5F_0_2pct 9/12/2017
Main Channel Distance (f t)
Ele
vatio
n (ft
)
Legend
WS Max WS - ALT 5F_Mul:500y r_ev en:RAS-ALT_5F_0_2pc
WS Max WS - ALT 5F_Mul:200y r_ev en:RAS-ALT_5F_0_5pc
WS Max WS - ALT 5F_Mul:100y r_ev en:RAS-ALT_5F_1pct
WS Max WS - ALT 5F_Mul:50y r_event:RAS-ALT_5F_2pc t
WS Max WS - ALT 5F_Mul:25y r_event:RAS-ALT_5F_4pc t
WS Max WS - ALT 5F_Mul:10y r_event:RAS-ALT_5F_10pc
WS Max WS - ALT 5F_Mul:05y r_event:RAS-ALT_5F_20pc
WS Max WS - ALT 5F_Mul:02y r_event:RAS-ALT_5F_50pc
Ground
Max
ham
Roa
d - D
imen
sions
...
VET
ER
ANS
MEM
ORI
AL H
WY
- Dim
ensio
ns v
erfie
d wi
th a
ppro
xim
ate
fie...
Col
lins B
lvd -
App
roxi
mat
e fie
ld su
rvey
colle
cted
5/9/
17
Butterm ilk Creek BMC1
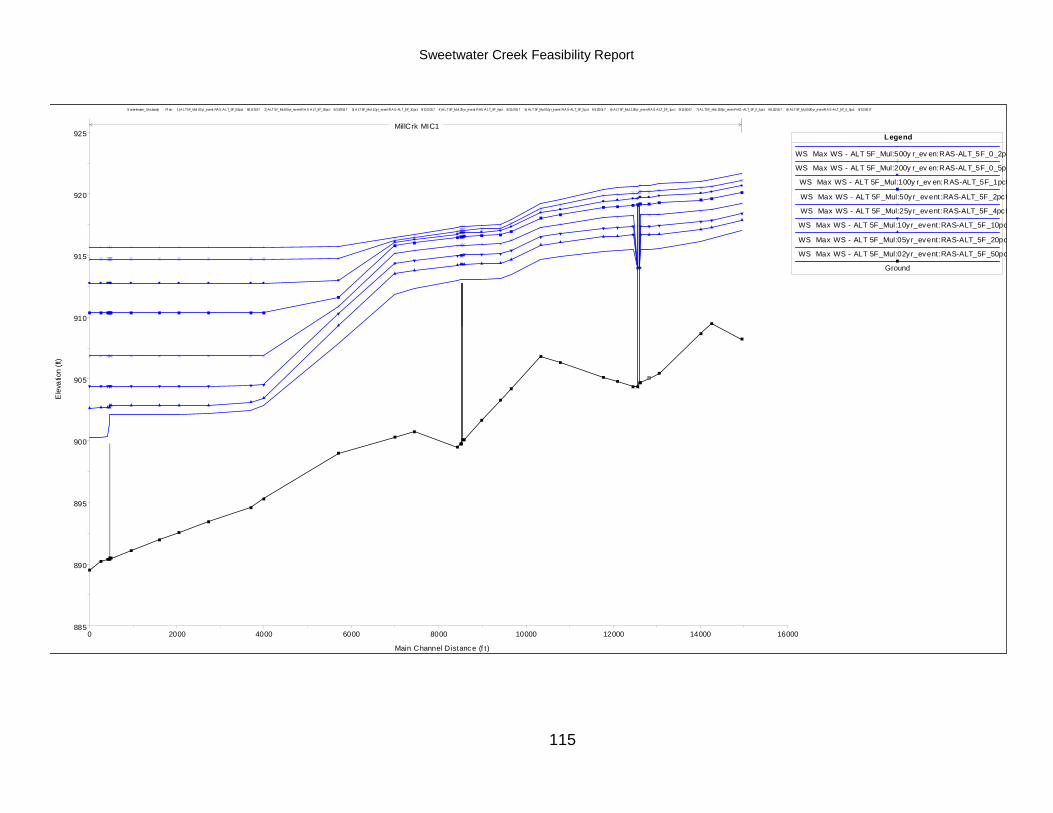
Sweetwater Creek Feasibility Report
115
0 2000 4000 6000 8000 10000 12000 14000 16000885
890
895
900
905
910
915
920
925
Sweetwater_Unsteady Pl an: 1) ALT 5F_Mul :02yr_event:RAS-ALT_5F_50pct 9/12/2017 2) ALT 5F_Mul:05yr_event:RAS-ALT_5F_20pct 9/12/2017 3) ALT 5F_Mul:10yr_event:RAS-ALT_5F_10pct 9/12/2017 4) ALT 5F_Mul :25yr_event :RAS-ALT_5F_4pct 9/12/2017 5) ALT 5F_Mul:50yr_event :RAS-ALT_5F_2pct 9/12/2017 6) ALT 5F_Mul:100yr_even:RAS-ALT_5F_1pct 9/12/2017 7) ALT 5F_Mul:200yr_even:RAS-ALT_5F_0_5pct 9/12/2017 8) ALT 5F_Mul:500yr_even:RAS-ALT_5F_0_2pct 9/12/2017
Main Channel Distance (f t)
Ele
vatio
n (ft
)
Legend
WS Max WS - ALT 5F_Mul:500y r_ev en:RAS-ALT_5F_0_2pc
WS Max WS - ALT 5F_Mul:200y r_ev en:RAS-ALT_5F_0_5pc
WS Max WS - ALT 5F_Mul:100y r_ev en:RAS-ALT_5F_1pct
WS Max WS - ALT 5F_Mul:50y r_event:RAS-ALT_5F_2pc t
WS Max WS - ALT 5F_Mul:25y r_event:RAS-ALT_5F_4pc t
WS Max WS - ALT 5F_Mul:10y r_event:RAS-ALT_5F_10pc
WS Max WS - ALT 5F_Mul:05y r_event:RAS-ALT_5F_20pc
WS Max WS - ALT 5F_Mul:02y r_event:RAS-ALT_5F_50pc
Ground
MillCrk MIC1

Sweetwater Creek Feasibility Report
116
0 1000 2000 3000 4000 5000 6000
890
895
900
905
910
915
920
Sweetwater_Unsteady Pl an: 1) ALT 5F_Mul :02yr_event:RAS-ALT_5F_50pct 9/12/2017 2) ALT 5F_Mul:05yr_event:RAS-ALT_5F_20pct 9/12/2017 3) ALT 5F_Mul:10yr_event:RAS-ALT_5F_10pct 9/12/2017 4) ALT 5F_Mul :25yr_event :RAS-ALT_5F_4pct 9/12/2017 5) ALT 5F_Mul:50yr_event :RAS-ALT_5F_2pct 9/12/2017 6) ALT 5F_Mul:100yr_even:RAS-ALT_5F_1pct 9/12/2017 7) ALT 5F_Mul:200yr_even:RAS-ALT_5F_0_5pct 9/12/2017 8) ALT 5F_Mul:500yr_even:RAS-ALT_5F_0_2pct 9/12/2017
Main Channel Distance (f t)
Ele
vatio
n (ft
)
Legend
WS Max WS - ALT 5F_Mul:500y r_ev en:RAS-ALT_5F_0_2pc
WS Max WS - ALT 5F_Mul:200y r_ev en:RAS-ALT_5F_0_5pc
WS Max WS - ALT 5F_Mul:100y r_ev en:RAS-ALT_5F_1pct
WS Max WS - ALT 5F_Mul:50y r_event:RAS-ALT_5F_2pc t
WS Max WS - ALT 5F_Mul:25y r_event:RAS-ALT_5F_4pc t
WS Max WS - ALT 5F_Mul:10y r_event:RAS-ALT_5F_10pc
WS Max WS - ALT 5F_Mul:05y r_event:RAS-ALT_5F_20pc
WS Max WS - ALT 5F_Mul:02y r_event:RAS-ALT_5F_50pc
Ground
0 M
outh
at N
oses
...
1690
Thi
s is
a RE
PEA
TED
se...
Mac
land
Roa
d18
11
1870
4920
ASS
UME
this
is co
nflu
ence
of L
uthe
r War
d
Mud Creek MDC1

Sweetwater Creek Feasibility Report
117
0 5000 10000 15000 20000 25000 30000 35000
860
870
880
890
900
910
920
930
Sweetwater_Unsteady Pl an: 1) ALT 5F_Mul :02yr_event:RAS-ALT_5F_50pct 9/12/2017 2) ALT 5F_Mul:05yr_event:RAS-ALT_5F_20pct 9/12/2017 3) ALT 5F_Mul:10yr_event:RAS-ALT_5F_10pct 9/12/2017 4) ALT 5F_Mul :25yr_event :RAS-ALT_5F_4pct 9/12/2017 5) ALT 5F_Mul:50yr_event :RAS-ALT_5F_2pct 9/12/2017 6) ALT 5F_Mul:100yr_even:RAS-ALT_5F_1pct 9/12/2017 7) ALT 5F_Mul:200yr_even:RAS-ALT_5F_0_5pct 9/12/2017 8) ALT 5F_Mul:500yr_even:RAS-ALT_5F_0_2pct 9/12/2017
Main Channel Distance (f t)
Ele
vatio
n (ft
)
Legend
WS Max WS - ALT 5F_Mul:500y r_ev en:RAS-ALT_5F_0_2pc
WS Max WS - ALT 5F_Mul:200y r_ev en:RAS-ALT_5F_0_5pc
WS Max WS - ALT 5F_Mul:100y r_ev en:RAS-ALT_5F_1pct
WS Max WS - ALT 5F_Mul:50y r_event:RAS-ALT_5F_2pc t
WS Max WS - ALT 5F_Mul:25y r_event:RAS-ALT_5F_4pc t
WS Max WS - ALT 5F_Mul:10y r_event:RAS-ALT_5F_10pc
WS Max WS - ALT 5F_Mul:05y r_event:RAS-ALT_5F_20pc
WS Max WS - ALT 5F_Mul:02y r_event:RAS-ALT_5F_50pc
Ground
CLA
Y R
D, B
RID
GE
SKEW
NES.
..
Silv
er C
omet
Tra
il
PO
WD
ER
SPRI
NG R
D
Sur
veye
d X
S
Sur
veye
d X
S
ERN
EST
BARR
ETT
PKW
Y,SK
EW
NESS
IS A
PPLI
ED
Noses Creek NCC2 Noses Creek NCC1

Sweetwater Creek Feasibility Report
118
0 2000 4000 6000 8000 10000 12000 14000
860
880
900
920
940
960
Sweetwater_Unsteady Pl an: 1) ALT 5F_Mul :02yr_event:RAS-ALT_5F_50pct 9/12/2017 2) ALT 5F_Mul:05yr_event:RAS-ALT_5F_20pct 9/12/2017 3) ALT 5F_Mul:10yr_event:RAS-ALT_5F_10pct 9/12/2017 4) ALT 5F_Mul :25yr_event :RAS-ALT_5F_4pct 9/12/2017 5) ALT 5F_Mul:50yr_event :RAS-ALT_5F_2pct 9/12/2017 6) ALT 5F_Mul:100yr_even:RAS-ALT_5F_1pct 9/12/2017 7) ALT 5F_Mul:200yr_even:RAS-ALT_5F_0_5pct 9/12/2017 8) ALT 5F_Mul:500yr_even:RAS-ALT_5F_0_2pct 9/12/2017
Main Channel Distance (f t)
Ele
vatio
n (ft
)
Legend
WS Max WS - ALT 5F_Mul:500y r_ev en:RAS-ALT_5F_0_2pc
WS Max WS - ALT 5F_Mul:200y r_ev en:RAS-ALT_5F_0_5pc
WS Max WS - ALT 5F_Mul:100y r_ev en:RAS-ALT_5F_1pct
WS Max WS - ALT 5F_Mul:50y r_event:RAS-ALT_5F_2pc t
WS Max WS - ALT 5F_Mul:25y r_event:RAS-ALT_5F_4pc t
WS Max WS - ALT 5F_Mul:10y r_event:RAS-ALT_5F_10pc
WS Max WS - ALT 5F_Mul:05y r_event:RAS-ALT_5F_20pc
WS Max WS - ALT 5F_Mul:02y r_event:RAS-ALT_5F_50pc
Ground
OC-
1
B19
1136
069,
Cla
y Roa
d...
OC-
3
B19
1011
070,
Flin
t Hill
Road
...
B17
0136
079,
Silv
er C
omet
RR
Brid
g...
Olley Creek OLC1

Sweetwater Creek Feasibility Report
119
0 5000 10000 15000 20000 25000 30000 35000870
880
890
900
910
920
930
940
Sweetwater_Unsteady Pl an: 1) ALT 5F_Mul :02yr_event:RAS-ALT_5F_50pct 9/12/2017 2) ALT 5F_Mul:05yr_event:RAS-ALT_5F_20pct 9/12/2017 3) ALT 5F_Mul:10yr_event:RAS-ALT_5F_10pct 9/12/2017 4) ALT 5F_Mul :25yr_event :RAS-ALT_5F_4pct 9/12/2017 5) ALT 5F_Mul:50yr_event :RAS-ALT_5F_2pct 9/12/2017 6) ALT 5F_Mul:100yr_even:RAS-ALT_5F_1pct 9/12/2017 7) ALT 5F_Mul:200yr_even:RAS-ALT_5F_0_5pct 9/12/2017 8) ALT 5F_Mul:500yr_even:RAS-ALT_5F_0_2pct 9/12/2017
Main Channel Distance (f t)
Ele
vatio
n (ft
)
Legend
WS Max WS - ALT 5F_Mul:500y r_ev en:RAS-ALT_5F_0_2pc
WS Max WS - ALT 5F_Mul:200y r_ev en:RAS-ALT_5F_0_5pc
WS Max WS - ALT 5F_Mul:100y r_ev en:RAS-ALT_5F_1pct
WS Max WS - ALT 5F_Mul:50y r_event:RAS-ALT_5F_2pc t
WS Max WS - ALT 5F_Mul:25y r_event:RAS-ALT_5F_4pc t
WS Max WS - ALT 5F_Mul:10y r_event:RAS-ALT_5F_10pc
WS Max WS - ALT 5F_Mul:05y r_event:RAS-ALT_5F_20pc
WS Max WS - ALT 5F_Mul:02y r_event:RAS-ALT_5F_50pc
Ground
0.37
B -
...
0.74
C -
...
0.83
Thi
s is .
..
0.93
***
VAL
LEY.
..
1.16
D -
***
FI...
1.63
E -
FIS
-E ..
.
1.73
D
.S. O
GLE
SBY
R...
2.17
G -
FI
S-G
VAL
L...
Stru
ctur
e re
vised
bas
ed o
n...
2.81
I -
FIS
-I U.
S. L
ON
G ...
adj in
vert
3.15
B
ROW
NSV
ILLE
RO
AD
D.S
.;...
3.39
K -
FIS
-K V
ALL
EY
SEC
TIO
N .
..S
weet
wat
er A
ve -
New
ly a
dded
stru
ctur
...
3.78
L -
***
XS
EC 3
.83
FIS
-L D
.S. T
HO
...
4.31
M -
***
FIS-
M V
ALL
EY
SEC
TIO
N
***...
4.51
..
.4.
61 T
his i
s a R
EPEA
TED
sect
ion.
4.72
N
&S R
AILW
AY
D.S
.
...
4.76
O -
FIS
-O V
ALL
EY
SEC
TIO
N U
.S. U
S 27
8
...
4.86
...
5.06
P -
Thi
s is
a R
EPE
ATED
secti
on.
5.21
..
.
5.32
C
SX R
AILW
AY
D.S
.
...
5.42
***
US
278
CU
LV D
.S.
**
*NE
W***
*****
...5.
49 *
** V
ALLE
Y SE
CTIO
N
*
**NEW
*****
***
.
..
5.75
R -
***
FIS-
R V
ALLE
Y S
ECT
ION
***
MO
DIF
IED*
**
...
6.02
S -
FIS
-S V
ALL
EY
SEC
TIO
N
...
PowderSpringsCrk PSC1

Sweetwater Creek Feasibility Report
120
0 10000 20000 30000 40000 50000 60000 70000
700
750
800
850
900
Sweetwater_Unsteady Pl an: 1) ALT 5F_Mul :02yr_event:RAS-ALT_5F_50pct 9/12/2017 2) ALT 5F_Mul:05yr_event:RAS-ALT_5F_20pct 9/12/2017 3) ALT 5F_Mul:10yr_event:RAS-ALT_5F_10pct 9/12/2017 4) ALT 5F_Mul :25yr_event :RAS-ALT_5F_4pct 9/12/2017 5) ALT 5F_Mul:50yr_event :RAS-ALT_5F_2pct 9/12/2017 6) ALT 5F_Mul:100yr_even:RAS-ALT_5F_1pct 9/12/2017 7) ALT 5F_Mul:200yr_even:RAS-ALT_5F_0_5pct 9/12/2017 8) ALT 5F_Mul:500yr_even:RAS-ALT_5F_0_2pct 9/12/2017
Main Channel Distance (f t)
Ele
vatio
n (ft
)
Legend
WS Max WS - ALT 5F_Mul:500y r_ev en:RAS-ALT_5F_0_2pc
WS Max WS - ALT 5F_Mul:200y r_ev en:RAS-ALT_5F_0_5pc
WS Max WS - ALT 5F_Mul:100y r_ev en:RAS-ALT_5F_1pct
WS Max WS - ALT 5F_Mul:50y r_event:RAS-ALT_5F_2pc t
WS Max WS - ALT 5F_Mul:25y r_event:RAS-ALT_5F_4pc t
WS Max WS - ALT 5F_Mul:10y r_event:RAS-ALT_5F_10pc
WS Max WS - ALT 5F_Mul:05y r_event:RAS-ALT_5F_20pc
WS Max WS - ALT 5F_Mul:02y r_event:RAS-ALT_5F_50pc
Ground
SW
02 -
Rive
rs...
SW
03 -
Sta
te P
ark
**IF
WA
TER
IS A
BOV
E LE
FTT
BAN
K, D
ELET
E AL
L LE
FT L
EVEE
S TH
ROU
GH
2580
8
SW
04 -
Bla
irs B
ridge
Roa
dS
W05
- In
ters
tate
20
SW
07 -
Sky
view
Driv
e
SW
08 -
Thor
nton
Rd
SW
12 (D
ougl
as C
o) -
OLD
ALA
BAM
A R
OAD
Sweetwater Creek SWC6
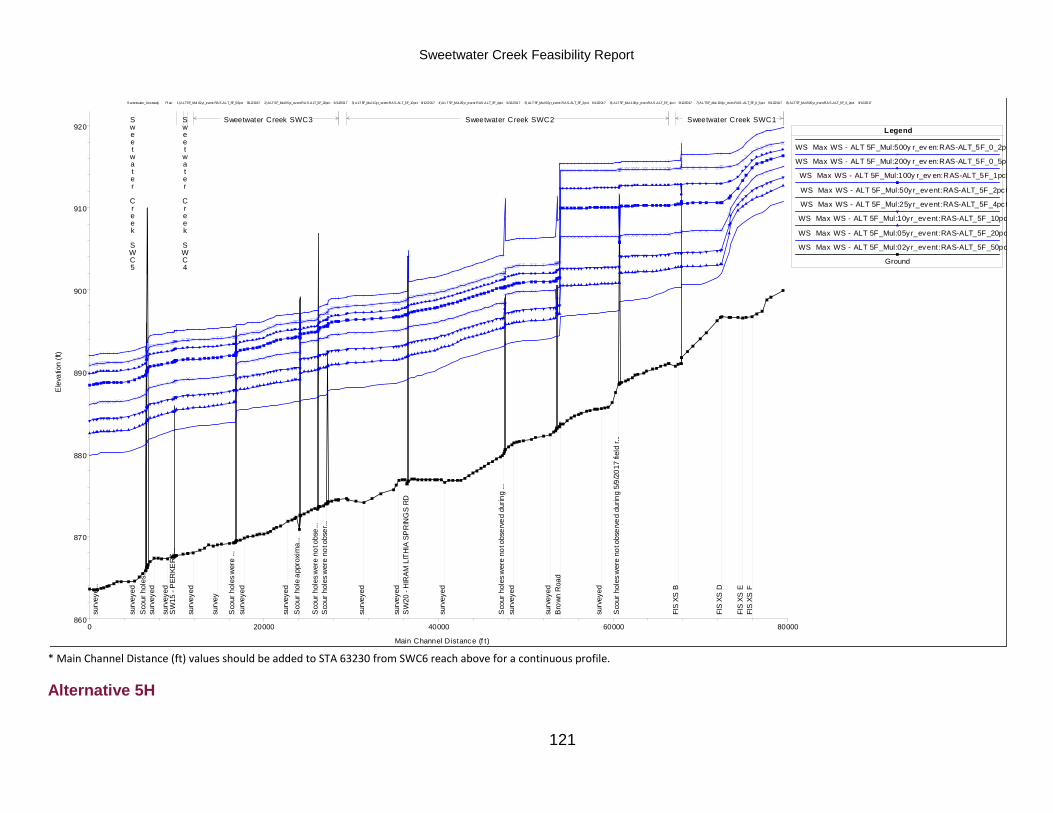
Sweetwater Creek Feasibility Report
121
* Main Channel Distance (ft) values should be added to STA 63230 from SWC6 reach above for a continuous profile.
Alternative 5H
0 20000 40000 60000 80000860
870
880
890
900
910
920
Sweetwater_Unsteady Pl an: 1) ALT 5F_Mul :02yr_event:RAS-ALT_5F_50pct 9/12/2017 2) ALT 5F_Mul:05yr_event:RAS-ALT_5F_20pct 9/12/2017 3) ALT 5F_Mul:10yr_event:RAS-ALT_5F_10pct 9/12/2017 4) ALT 5F_Mul :25yr_event :RAS-ALT_5F_4pct 9/12/2017 5) ALT 5F_Mul:50yr_event :RAS-ALT_5F_2pct 9/12/2017 6) ALT 5F_Mul:100yr_even:RAS-ALT_5F_1pct 9/12/2017 7) ALT 5F_Mul:200yr_even:RAS-ALT_5F_0_5pct 9/12/2017 8) ALT 5F_Mul:500yr_even:RAS-ALT_5F_0_2pct 9/12/2017
Main Channel Distance (f t)
Ele
vatio
n (ft
)
Legend
WS Max WS - ALT 5F_Mul:500y r_ev en:RAS-ALT_5F_0_2pc
WS Max WS - ALT 5F_Mul:200y r_ev en:RAS-ALT_5F_0_5pc
WS Max WS - ALT 5F_Mul:100y r_ev en:RAS-ALT_5F_1pct
WS Max WS - ALT 5F_Mul:50y r_event:RAS-ALT_5F_2pc t
WS Max WS - ALT 5F_Mul:25y r_event:RAS-ALT_5F_4pc t
WS Max WS - ALT 5F_Mul:10y r_event:RAS-ALT_5F_10pc
WS Max WS - ALT 5F_Mul:05y r_event:RAS-ALT_5F_20pc
WS Max WS - ALT 5F_Mul:02y r_event:RAS-ALT_5F_50pc
Ground
surv
eye.
..
surv
eyed
Sco
ur h
oles
...su
rvey
ed
surv
eyed
SW
15 -
PER
KERS
...
surv
eyed
surv
ey
Sco
ur h
oles
wer
e ...
surv
eyed
surv
eyed
Sco
ur h
ole
appr
oxim
a...
Sco
ur h
oles
wer
e no
t obs
e...
Sco
ur h
oles
wer
e no
t obs
er...
surv
eyed
surv
eyed
SW
20 -
HIR
AM L
ITHI
A SP
RIN
GS
RD
surv
eyed
Sco
ur h
oles
wer
e no
t obs
erve
d du
ring
...su
rvey
ed
surv
eyed
Bro
wn R
oad
surv
eyed
Sco
ur h
oles
wer
e no
t obs
erve
d du
ring
5/9/
2017
fiel
d r..
.
FIS
XS B
FIS
XS D
FIS
XS E
FIS
XS F
Sweetwater Creek SWC5
Sweetwater Creek SWC4
Sweetwater Creek SWC3 Sweetwater Creek SWC2 Sweetwater Creek SWC1

Sweetwater Creek Feasibility Report
122
0 2000 4000 6000 8000 10000860
870
880
890
900
910
Sweetwater_Unsteady Pl an: 1) ALT 5H: Mu:02yr_event:RAS-ALT_5F_50pct 9/10/2017 2) ALT 5H: Mu:05yr_event:RAS-ALT_5F_20pct 9/10/2017 3) ALT 5H: Mu:10yr_event:RAS-ALT_5F_10pct 9/10/2017 4) ALT 5H: Mu:25yr_event :RAS-ALT_5F_4pct 9/10/2017 5) ALT 5H: Mu:50yr_event :RAS-ALT_5F_2pct 9/10/2017 6) ALT 5H: Mu:100yr_even:RAS-ALT_5F_1pct 9/10/2017 7) ALT 5H: Mu:200yr_even:RAS-ALT_5F_0_5pct 9/10/2017 8) ALT 5H: Mu:500yr_even:RAS-ALT_5F_0_2pct 9/10/2017
Main Channel Distance (f t)
Ele
vatio
n (ft
)
Legend
WS Max WS - ALT 5H: Mu:500y r_ev en:RAS-ALT_5F_0_2pc
WS Max WS - ALT 5H: Mu:200y r_ev en:RAS-ALT_5F_0_5pc
WS Max WS - ALT 5H: Mu:100y r_ev en:RAS-ALT_5F_1pct
WS Max WS - ALT 5H: Mu:50y r_event:RAS-ALT_5F_2pc t
WS Max WS - ALT 5H: Mu:25y r_event:RAS-ALT_5F_4pc t
WS Max WS - ALT 5H: Mu:10y r_event:RAS-ALT_5F_10pc
WS Max WS - ALT 5H: Mu:05y r_event:RAS-ALT_5F_20pc
WS Max WS - ALT 5H: Mu:02y r_event:RAS-ALT_5F_50pc
Ground
Max
ham
Roa
d - D
imen
sions
...
VET
ER
ANS
MEM
ORI
AL H
WY
- Dim
ensio
ns v
erfie
d wi
th a
ppro
xim
ate
fie...
Col
lins B
lvd -
App
roxi
mat
e fie
ld su
rvey
colle
cted
5/9/
17
Butterm ilk Creek BMC1

Sweetwater Creek Feasibility Report
123
0 2000 4000 6000 8000 10000 12000 14000 16000
885
890
895
900
905
910
915
920
925
Sweetwater_Unsteady Pl an: 1) ALT 5H: Mu:02yr_event:RAS-ALT_5F_50pct 9/10/2017 2) ALT 5H: Mu:05yr_event:RAS-ALT_5F_20pct 9/10/2017 3) ALT 5H: Mu:10yr_event:RAS-ALT_5F_10pct 9/10/2017 4) ALT 5H: Mu:25yr_event :RAS-ALT_5F_4pct 9/10/2017 5) ALT 5H: Mu:50yr_event :RAS-ALT_5F_2pct 9/10/2017 6) ALT 5H: Mu:100yr_even:RAS-ALT_5F_1pct 9/10/2017 7) ALT 5H: Mu:200yr_even:RAS-ALT_5F_0_5pct 9/10/2017 8) ALT 5H: Mu:500yr_even:RAS-ALT_5F_0_2pct 9/10/2017
Main Channel Distance (f t)
Ele
vatio
n (ft
)
Legend
WS Max WS - ALT 5H: Mu:500y r_ev en:RAS-ALT_5F_0_2pc
WS Max WS - ALT 5H: Mu:200y r_ev en:RAS-ALT_5F_0_5pc
WS Max WS - ALT 5H: Mu:100y r_ev en:RAS-ALT_5F_1pct
WS Max WS - ALT 5H: Mu:50y r_event:RAS-ALT_5F_2pc t
WS Max WS - ALT 5H: Mu:25y r_event:RAS-ALT_5F_4pc t
WS Max WS - ALT 5H: Mu:10y r_event:RAS-ALT_5F_10pc
WS Max WS - ALT 5H: Mu:05y r_event:RAS-ALT_5F_20pc
WS Max WS - ALT 5H: Mu:02y r_event:RAS-ALT_5F_50pc
Ground
MillCrk MIC1

Sweetwater Creek Feasibility Report
124
0 1000 2000 3000 4000 5000 6000
890
895
900
905
910
915
920
Sweetwater_Unsteady Pl an: 1) ALT 5H: Mu:02yr_event:RAS-ALT_5F_50pct 9/10/2017 2) ALT 5H: Mu:05yr_event:RAS-ALT_5F_20pct 9/10/2017 3) ALT 5H: Mu:10yr_event:RAS-ALT_5F_10pct 9/10/2017 4) ALT 5H: Mu:25yr_event :RAS-ALT_5F_4pct 9/10/2017 5) ALT 5H: Mu:50yr_event :RAS-ALT_5F_2pct 9/10/2017 6) ALT 5H: Mu:100yr_even:RAS-ALT_5F_1pct 9/10/2017 7) ALT 5H: Mu:200yr_even:RAS-ALT_5F_0_5pct 9/10/2017 8) ALT 5H: Mu:500yr_even:RAS-ALT_5F_0_2pct 9/10/2017
Main Channel Distance (f t)
Ele
vatio
n (ft
)
Legend
WS Max WS - ALT 5H: Mu:500y r_ev en:RAS-ALT_5F_0_2pc
WS Max WS - ALT 5H: Mu:200y r_ev en:RAS-ALT_5F_0_5pc
WS Max WS - ALT 5H: Mu:100y r_ev en:RAS-ALT_5F_1pct
WS Max WS - ALT 5H: Mu:50y r_event:RAS-ALT_5F_2pc t
WS Max WS - ALT 5H: Mu:25y r_event:RAS-ALT_5F_4pc t
WS Max WS - ALT 5H: Mu:10y r_event:RAS-ALT_5F_10pc
WS Max WS - ALT 5H: Mu:05y r_event:RAS-ALT_5F_20pc
WS Max WS - ALT 5H: Mu:02y r_event:RAS-ALT_5F_50pc
Ground
0 M
outh
at N
oses
...
1690
Thi
s is
a RE
PEA
TED
se...
Mac
land
Roa
d18
11
1870
4920
ASS
UME
this
is co
nflu
ence
of L
uthe
r War
d
Mud Creek MDC1

Sweetwater Creek Feasibility Report
125
0 5000 10000 15000 20000 25000 30000 35000
860
870
880
890
900
910
920
930
Sweetwater_Unsteady Pl an: 1) ALT 5H: Mu:02yr_event:RAS-ALT_5F_50pct 9/10/2017 2) ALT 5H: Mu:05yr_event:RAS-ALT_5F_20pct 9/10/2017 3) ALT 5H: Mu:10yr_event:RAS-ALT_5F_10pct 9/10/2017 4) ALT 5H: Mu:25yr_event :RAS-ALT_5F_4pct 9/10/2017 5) ALT 5H: Mu:50yr_event :RAS-ALT_5F_2pct 9/10/2017 6) ALT 5H: Mu:100yr_even:RAS-ALT_5F_1pct 9/10/2017 7) ALT 5H: Mu:200yr_even:RAS-ALT_5F_0_5pct 9/10/2017 8) ALT 5H: Mu:500yr_even:RAS-ALT_5F_0_2pct 9/10/2017
Main Channel Distance (f t)
Ele
vatio
n (ft
)
Legend
WS Max WS - ALT 5H: Mu:500y r_ev en:RAS-ALT_5F_0_2pc
WS Max WS - ALT 5H: Mu:200y r_ev en:RAS-ALT_5F_0_5pc
WS Max WS - ALT 5H: Mu:100y r_ev en:RAS-ALT_5F_1pct
WS Max WS - ALT 5H: Mu:50y r_event:RAS-ALT_5F_2pc t
WS Max WS - ALT 5H: Mu:25y r_event:RAS-ALT_5F_4pc t
WS Max WS - ALT 5H: Mu:10y r_event:RAS-ALT_5F_10pc
WS Max WS - ALT 5H: Mu:05y r_event:RAS-ALT_5F_20pc
WS Max WS - ALT 5H: Mu:02y r_event:RAS-ALT_5F_50pc
Ground
CLA
Y R
D, B
RID
GE
SKEW
NES.
..
Silv
er C
omet
Tra
il
PO
WD
ER
SPRI
NG R
D
Sur
veye
d X
S
Sur
veye
d X
S
ERN
EST
BARR
ETT
PKW
Y,SK
EW
NESS
IS A
PPLI
ED
Noses Creek NCC2 Noses Creek NCC1

Sweetwater Creek Feasibility Report
126
0 2000 4000 6000 8000 10000 12000 14000
860
880
900
920
940
960
Sweetwater_Unsteady Pl an: 1) ALT 5H: Mu:02yr_event:RAS-ALT_5F_50pct 9/10/2017 2) ALT 5H: Mu:05yr_event:RAS-ALT_5F_20pct 9/10/2017 3) ALT 5H: Mu:10yr_event:RAS-ALT_5F_10pct 9/10/2017 4) ALT 5H: Mu:25yr_event :RAS-ALT_5F_4pct 9/10/2017 5) ALT 5H: Mu:50yr_event :RAS-ALT_5F_2pct 9/10/2017 6) ALT 5H: Mu:100yr_even:RAS-ALT_5F_1pct 9/10/2017 7) ALT 5H: Mu:200yr_even:RAS-ALT_5F_0_5pct 9/10/2017 8) ALT 5H: Mu:500yr_even:RAS-ALT_5F_0_2pct 9/10/2017
Main Channel Distance (f t)
Ele
vatio
n (ft
)
Legend
WS Max WS - ALT 5H: Mu:500y r_ev en:RAS-ALT_5F_0_2pc
WS Max WS - ALT 5H: Mu:200y r_ev en:RAS-ALT_5F_0_5pc
WS Max WS - ALT 5H: Mu:100y r_ev en:RAS-ALT_5F_1pct
WS Max WS - ALT 5H: Mu:50y r_event:RAS-ALT_5F_2pc t
WS Max WS - ALT 5H: Mu:25y r_event:RAS-ALT_5F_4pc t
WS Max WS - ALT 5H: Mu:10y r_event:RAS-ALT_5F_10pc
WS Max WS - ALT 5H: Mu:05y r_event:RAS-ALT_5F_20pc
WS Max WS - ALT 5H: Mu:02y r_event:RAS-ALT_5F_50pc
Ground
OC-
1
B19
1136
069,
Cla
y Roa
d...
OC-
3
B19
1011
070,
Flin
t Hill
Road
...
B17
0136
079,
Silv
er C
omet
RR
Brid
g...
Olley Creek OLC1

Sweetwater Creek Feasibility Report
127
0 5000 10000 15000 20000 25000 30000 35000870
880
890
900
910
920
930
940
Sweetwater_Unsteady Pl an: 1) ALT 5H: Mu:02yr_event:RAS-ALT_5F_50pct 9/10/2017 2) ALT 5H: Mu:05yr_event:RAS-ALT_5F_20pct 9/10/2017 3) ALT 5H: Mu:10yr_event:RAS-ALT_5F_10pct 9/10/2017 4) ALT 5H: Mu:25yr_event :RAS-ALT_5F_4pct 9/10/2017 5) ALT 5H: Mu:50yr_event :RAS-ALT_5F_2pct 9/10/2017 6) ALT 5H: Mu:100yr_even:RAS-ALT_5F_1pct 9/10/2017 7) ALT 5H: Mu:200yr_even:RAS-ALT_5F_0_5pct 9/10/2017 8) ALT 5H: Mu:500yr_even:RAS-ALT_5F_0_2pct 9/10/2017
Main Channel Distance (f t)
Ele
vatio
n (ft
)
Legend
WS Max WS - ALT 5H: Mu:500y r_ev en:RAS-ALT_5F_0_2pc
WS Max WS - ALT 5H: Mu:200y r_ev en:RAS-ALT_5F_0_5pc
WS Max WS - ALT 5H: Mu:100y r_ev en:RAS-ALT_5F_1pct
WS Max WS - ALT 5H: Mu:50y r_event:RAS-ALT_5F_2pc t
WS Max WS - ALT 5H: Mu:25y r_event:RAS-ALT_5F_4pc t
WS Max WS - ALT 5H: Mu:10y r_event:RAS-ALT_5F_10pc
WS Max WS - ALT 5H: Mu:05y r_event:RAS-ALT_5F_20pc
WS Max WS - ALT 5H: Mu:02y r_event:RAS-ALT_5F_50pc
Ground
0.37
B -
...
0.74
C -
...
0.83
Thi
s is .
..
0.93
***
VAL
LEY.
..
1.16
D -
***
FI...
1.63
E -
FIS
-E ..
.
1.73
D
.S. O
GLE
SBY
R...
2.17
G -
FI
S-G
VAL
L...
Stru
ctur
e re
vised
bas
ed o
n...
2.81
I -
FIS
-I U.
S. L
ON
G ...
adj in
vert
3.15
B
ROW
NSV
ILLE
RO
AD
D.S
.;...
adj in
vert
3.39
K -
FIS
-K V
ALL
EY
SEC
TIO
N .
..S
weet
wat
er A
ve -
New
ly a
dded
stru
ctur
...
3.78
L -
***
XS
EC 3
.83
FIS
-L D
.S. T
HO
...
4.31
M -
***
FIS-
M V
ALL
EY
SEC
TIO
N
***...
4.51
..
.4.
61 T
his i
s a R
EPEA
TED
sect
ion.
4.72
N
&S R
AILW
AY
D.S
.
...
4.76
O -
FIS
-O V
ALL
EY
SEC
TIO
N U
.S. U
S 27
8
...
4.86
...
5.06
P -
Thi
s is
a R
EPE
ATED
secti
on.
5.21
..
.
5.32
C
SX R
AILW
AY
D.S
.
...
5.42
***
US
278
CU
LV D
.S.
**
*NE
W***
*****
...5.
49 *
** V
ALLE
Y SE
CTIO
N
*
**NEW
*****
***
.
..
5.75
R -
***
FIS-
R V
ALLE
Y S
ECT
ION
***
MO
DIF
IED*
**
...
6.02
S -
FIS
-S V
ALL
EY
SEC
TIO
N
...
PowderSpringsCrk PSC1

Sweetwater Creek Feasibility Report
128
0 10000 20000 30000 40000 50000 60000 70000700
750
800
850
900
Sweetwater_Unsteady Pl an: 1) ALT 5H: Mu:02yr_event:RAS-ALT_5F_50pct 9/10/2017 2) ALT 5H: Mu:05yr_event:RAS-ALT_5F_20pct 9/10/2017 3) ALT 5H: Mu:10yr_event:RAS-ALT_5F_10pct 9/10/2017 4) ALT 5H: Mu:25yr_event :RAS-ALT_5F_4pct 9/10/2017 5) ALT 5H: Mu:50yr_event :RAS-ALT_5F_2pct 9/10/2017 6) ALT 5H: Mu:100yr_even:RAS-ALT_5F_1pct 9/10/2017 7) ALT 5H: Mu:200yr_even:RAS-ALT_5F_0_5pct 9/10/2017 8) ALT 5H: Mu:500yr_even:RAS-ALT_5F_0_2pct 9/10/2017
Main Channel Distance (f t)
Ele
vatio
n (ft
)
Legend
WS Max WS - ALT 5H: Mu:500y r_ev en:RAS-ALT_5F_0_2pc
WS Max WS - ALT 5H: Mu:200y r_ev en:RAS-ALT_5F_0_5pc
WS Max WS - ALT 5H: Mu:100y r_ev en:RAS-ALT_5F_1pct
WS Max WS - ALT 5H: Mu:50y r_event:RAS-ALT_5F_2pc t
WS Max WS - ALT 5H: Mu:25y r_event:RAS-ALT_5F_4pc t
WS Max WS - ALT 5H: Mu:10y r_event:RAS-ALT_5F_10pc
WS Max WS - ALT 5H: Mu:05y r_event:RAS-ALT_5F_20pc
WS Max WS - ALT 5H: Mu:02y r_event:RAS-ALT_5F_50pc
Ground
SW
02 -
Rive
rs...
SW
03 -
Sta
te P
ark
**IF
WA
TER
IS A
BOV
E LE
FTT
BAN
K, D
ELET
E AL
L LE
FT L
EVEE
S TH
ROU
GH
2580
8
SW
04 -
Bla
irs B
ridge
Roa
dS
W05
- In
ters
tate
20
SW
07 -
Sky
view
Driv
e
SW
08 -
Thor
nton
Rd
SW
12 (D
ougl
as C
o) -
OLD
ALA
BAM
A R
OAD
Sweetwater Creek SWC6

Sweetwater Creek Feasibility Report
129
* Main Channel Distance (ft) values should be added to STA 63230 from SWC6 reach above for a continuous profile.
Alternative 5I
0 20000 40000 60000 80000860
870
880
890
900
910
920
930
Sweetwater_Unsteady Pl an: 1) ALT 5H: Mu:02yr_event:RAS-ALT_5F_50pct 9/10/2017 2) ALT 5H: Mu:05yr_event:RAS-ALT_5F_20pct 9/10/2017 3) ALT 5H: Mu:10yr_event:RAS-ALT_5F_10pct 9/10/2017 4) ALT 5H: Mu:25yr_event :RAS-ALT_5F_4pct 9/10/2017 5) ALT 5H: Mu:50yr_event :RAS-ALT_5F_2pct 9/10/2017 6) ALT 5H: Mu:100yr_even:RAS-ALT_5F_1pct 9/10/2017 7) ALT 5H: Mu:200yr_even:RAS-ALT_5F_0_5pct 9/10/2017 8) ALT 5H: Mu:500yr_even:RAS-ALT_5F_0_2pct 9/10/2017
Main Channel Distance (f t)
Ele
vatio
n (ft
)
Legend
WS Max WS - ALT 5H: Mu:500y r_ev en:RAS-ALT_5F_0_2pc
WS Max WS - ALT 5H: Mu:200y r_ev en:RAS-ALT_5F_0_5pc
WS Max WS - ALT 5H: Mu:100y r_ev en:RAS-ALT_5F_1pct
WS Max WS - ALT 5H: Mu:50y r_event:RAS-ALT_5F_2pc t
WS Max WS - ALT 5H: Mu:25y r_event:RAS-ALT_5F_4pc t
WS Max WS - ALT 5H: Mu:10y r_event:RAS-ALT_5F_10pc
WS Max WS - ALT 5H: Mu:05y r_event:RAS-ALT_5F_20pc
WS Max WS - ALT 5H: Mu:02y r_event:RAS-ALT_5F_50pc
Ground
surv
ey...
surv
eye.
..S
cour
hol
...su
rvey
ed
surv
eyed
surv
eyed
surv
ey
Sco
ur h
oles
wer
...su
rvey
ed
surv
eyed
Sco
ur h
ole
appr
ox...
Sco
ur h
oles
wer
e no
t ...
Sco
ur h
oles
wer
e no
t o...
surv
eyed
surv
eyed
SW
20 -
HIR
AM L
ITHI
A SP
RIN
GS.
..
surv
eyed
Sco
ur h
oles
wer
e no
t obs
erve
d du
...su
rvey
ed
surv
eyed
Bro
wn R
oad
surv
eyed
Sco
ur h
oles
wer
e no
t obs
erve
d du
ring
5/9/
2017
...
FIS
XS B
FIS
XS D
FIS
XS E
FIS
XS F
Sweetwater Creek SWC5
Sweetwater Creek SWC4
Sweetwater Creek SWC3 Sweetwater Creek SWC2 Sweetwater Creek SWC1

Sweetwater Creek Feasibility Report
130
0 2000 4000 6000 8000 10000860
870
880
890
900
910
Sweetwater_Unsteady Pl an: 1) ALT 5I_SC1:02yr_event :RAS-02yr_FUTURE 9/27/2017 2) ALT 5I_SC1:05yr_event:RAS-05yr_FUTURE 9/18/2017 3) ALT 5I_SC1:10yr_event:RAS-10yr_FUTURE 9/18/2017 4) ALT 5I_SC1:25yr_event:RAS-25yr_FUTURE 9/18/2017 5) ALT 5I_SC1:50yr_event :RAS-50yr_FUTURE 9/18/2017 6) ALT 5I_SC1:100yr_even:RAS-100yr_FUTURE 9/18/2017 7) ALT 5I_SC1:200yr_even:RAS-200yr_FUTURE 9/18/2017 8) ALT 5I_SC1:500yr_even:RAS-500yr_FUTURE 9/18/2017
Main Channel Distance (f t)
Ele
vatio
n (ft
)
Legend
WS Max WS - ALT 5I_SC1:500y r_ev en:RAS-500y r_FUTUR
WS Max WS - ALT 5I_SC1:200y r_ev en:RAS-200y r_FUTUR
WS Max WS - ALT 5I_SC1:100y r_ev en:RAS-100y r_FUTUR
WS Max WS - ALT 5I_SC1:50y r_ev ent:RAS-50y r_FUTUR
WS Max WS - ALT 5I_SC1:25y r_ev ent:RAS-25y r_FUTUR
WS Max WS - ALT 5I_SC1:10y r_ev ent:RAS-10y r_FUTUR
WS Max WS - ALT 5I_SC1:05y r_ev ent:RAS-05y r_FUTUR
WS Max WS - ALT 5I_SC1:02y r_ev ent:RAS-02y r_FUTUR
Ground
Max
ham
Roa
d - D
imen
sions
...
VET
ER
ANS
MEM
ORI
AL H
WY
- Dim
ensio
ns v
erfie
d wi
th a
ppro
xim
ate
fie...
Col
lins B
lvd -
App
roxi
mat
e fie
ld su
rvey
colle
cted
5/9/
17
Butterm ilk Creek BMC1

Sweetwater Creek Feasibility Report
131
0 2000 4000 6000 8000 10000 12000 14000 16000
885
890
895
900
905
910
915
920
925
Sweetwater_Unsteady Pl an: 1) ALT 5I_SC1:02yr_event :RAS-02yr_FUTURE 9/27/2017 2) ALT 5I_SC1:05yr_event:RAS-05yr_FUTURE 9/18/2017 3) ALT 5I_SC1:10yr_event:RAS-10yr_FUTURE 9/18/2017 4) ALT 5I_SC1:25yr_event:RAS-25yr_FUTURE 9/18/2017 5) ALT 5I_SC1:50yr_event :RAS-50yr_FUTURE 9/18/2017 6) ALT 5I_SC1:100yr_even:RAS-100yr_FUTURE 9/18/2017 7) ALT 5I_SC1:200yr_even:RAS-200yr_FUTURE 9/18/2017 8) ALT 5I_SC1:500yr_even:RAS-500yr_FUTURE 9/18/2017
Main Channel Distance (f t)
Ele
vatio
n (ft
)
Legend
WS Max WS - ALT 5I_SC1:500y r_ev en:RAS-500y r_FUTUR
WS Max WS - ALT 5I_SC1:200y r_ev en:RAS-200y r_FUTUR
WS Max WS - ALT 5I_SC1:100y r_ev en:RAS-100y r_FUTUR
WS Max WS - ALT 5I_SC1:50y r_ev ent:RAS-50y r_FUTUR
WS Max WS - ALT 5I_SC1:25y r_ev ent:RAS-25y r_FUTUR
WS Max WS - ALT 5I_SC1:10y r_ev ent:RAS-10y r_FUTUR
WS Max WS - ALT 5I_SC1:05y r_ev ent:RAS-05y r_FUTUR
WS Max WS - ALT 5I_SC1:02y r_ev ent:RAS-02y r_FUTUR
Ground
MillCrk MIC1

Sweetwater Creek Feasibility Report
132
0 1000 2000 3000 4000 5000 6000
890
895
900
905
910
915
920
Sweetwater_Unsteady Pl an: 1) ALT 5I_SC1:02yr_event :RAS-02yr_FUTURE 9/27/2017 2) ALT 5I_SC1:05yr_event:RAS-05yr_FUTURE 9/18/2017 3) ALT 5I_SC1:10yr_event:RAS-10yr_FUTURE 9/18/2017 4) ALT 5I_SC1:25yr_event:RAS-25yr_FUTURE 9/18/2017 5) ALT 5I_SC1:50yr_event :RAS-50yr_FUTURE 9/18/2017 6) ALT 5I_SC1:100yr_even:RAS-100yr_FUTURE 9/18/2017 7) ALT 5I_SC1:200yr_even:RAS-200yr_FUTURE 9/18/2017 8) ALT 5I_SC1:500yr_even:RAS-500yr_FUTURE 9/18/2017
Main Channel Distance (f t)
Ele
vatio
n (ft
)
Legend
WS Max WS - ALT 5I_SC1:500y r_ev en:RAS-500y r_FUTUR
WS Max WS - ALT 5I_SC1:200y r_ev en:RAS-200y r_FUTUR
WS Max WS - ALT 5I_SC1:100y r_ev en:RAS-100y r_FUTUR
WS Max WS - ALT 5I_SC1:50y r_ev ent:RAS-50y r_FUTUR
WS Max WS - ALT 5I_SC1:25y r_ev ent:RAS-25y r_FUTUR
WS Max WS - ALT 5I_SC1:10y r_ev ent:RAS-10y r_FUTUR
WS Max WS - ALT 5I_SC1:05y r_ev ent:RAS-05y r_FUTUR
WS Max WS - ALT 5I_SC1:02y r_ev ent:RAS-02y r_FUTUR
Ground
0 M
outh
at N
oses
...
1690
Thi
s is
a RE
PEA
TED
se...
Mac
land
Roa
d18
11
1870
4920
ASS
UME
this
is co
nflu
ence
of L
uthe
r War
d
Mud Creek MDC1
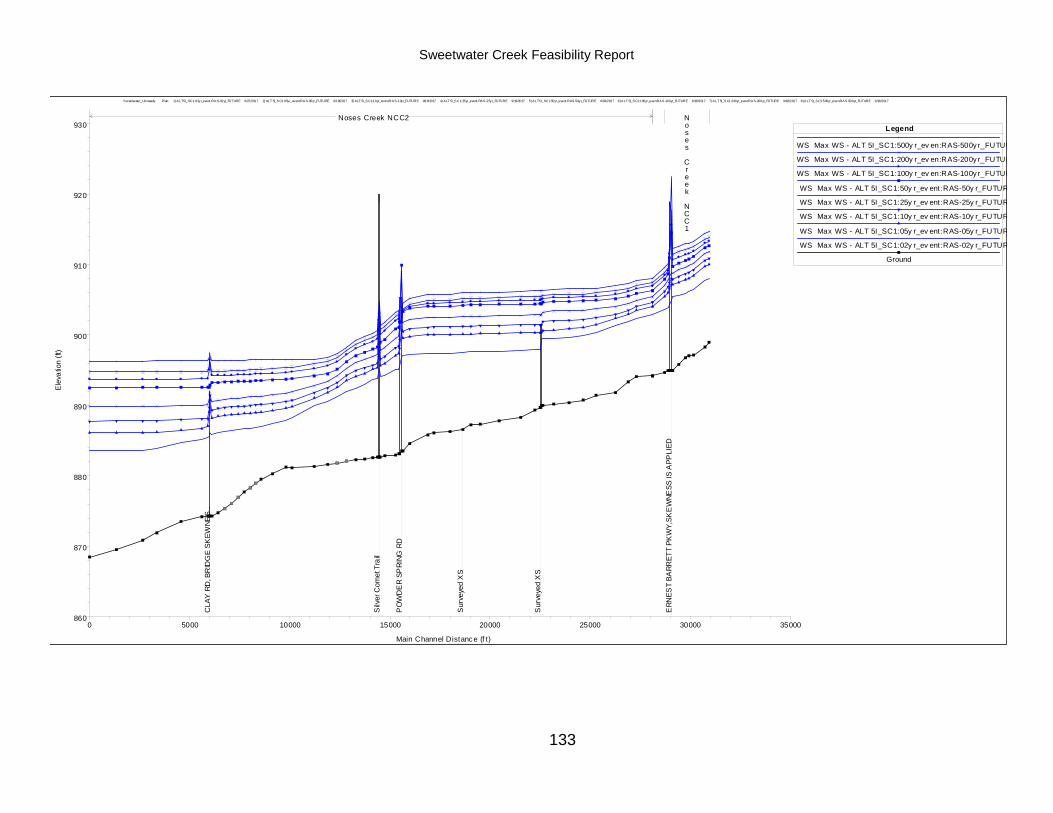
Sweetwater Creek Feasibility Report
133
0 5000 10000 15000 20000 25000 30000 35000
860
870
880
890
900
910
920
930
Sweetwater_Unsteady Pl an: 1) ALT 5I_SC1:02yr_event :RAS-02yr_FUTURE 9/27/2017 2) ALT 5I_SC1:05yr_event:RAS-05yr_FUTURE 9/18/2017 3) ALT 5I_SC1:10yr_event:RAS-10yr_FUTURE 9/18/2017 4) ALT 5I_SC1:25yr_event:RAS-25yr_FUTURE 9/18/2017 5) ALT 5I_SC1:50yr_event :RAS-50yr_FUTURE 9/18/2017 6) ALT 5I_SC1:100yr_even:RAS-100yr_FUTURE 9/18/2017 7) ALT 5I_SC1:200yr_even:RAS-200yr_FUTURE 9/18/2017 8) ALT 5I_SC1:500yr_even:RAS-500yr_FUTURE 9/18/2017
Main Channel Distance (f t)
Ele
vatio
n (ft
)
Legend
WS Max WS - ALT 5I_SC1:500y r_ev en:RAS-500y r_FUTUR
WS Max WS - ALT 5I_SC1:200y r_ev en:RAS-200y r_FUTUR
WS Max WS - ALT 5I_SC1:100y r_ev en:RAS-100y r_FUTUR
WS Max WS - ALT 5I_SC1:50y r_ev ent:RAS-50y r_FUTUR
WS Max WS - ALT 5I_SC1:25y r_ev ent:RAS-25y r_FUTUR
WS Max WS - ALT 5I_SC1:10y r_ev ent:RAS-10y r_FUTUR
WS Max WS - ALT 5I_SC1:05y r_ev ent:RAS-05y r_FUTUR
WS Max WS - ALT 5I_SC1:02y r_ev ent:RAS-02y r_FUTUR
Ground
CLA
Y R
D, B
RID
GE
SKEW
NES.
..
Silv
er C
omet
Tra
il
PO
WD
ER
SPRI
NG R
D
Sur
veye
d X
S
Sur
veye
d X
S
ERN
EST
BARR
ETT
PKW
Y,SK
EW
NESS
IS A
PPLI
ED
Noses Creek NCC2 Noses Creek NCC1

Sweetwater Creek Feasibility Report
134
0 2000 4000 6000 8000 10000 12000 14000
860
880
900
920
940
960
Sweetwater_Unsteady Pl an: 1) ALT 5I_SC1:02yr_event :RAS-02yr_FUTURE 9/27/2017 2) ALT 5I_SC1:05yr_event:RAS-05yr_FUTURE 9/18/2017 3) ALT 5I_SC1:10yr_event:RAS-10yr_FUTURE 9/18/2017 4) ALT 5I_SC1:25yr_event:RAS-25yr_FUTURE 9/18/2017 5) ALT 5I_SC1:50yr_event :RAS-50yr_FUTURE 9/18/2017 6) ALT 5I_SC1:100yr_even:RAS-100yr_FUTURE 9/18/2017 7) ALT 5I_SC1:200yr_even:RAS-200yr_FUTURE 9/18/2017 8) ALT 5I_SC1:500yr_even:RAS-500yr_FUTURE 9/18/2017
Main Channel Distance (f t)
Ele
vatio
n (ft
)
Legend
WS Max WS - ALT 5I_SC1:500y r_ev en:RAS-500y r_FUTUR
WS Max WS - ALT 5I_SC1:200y r_ev en:RAS-200y r_FUTUR
WS Max WS - ALT 5I_SC1:100y r_ev en:RAS-100y r_FUTUR
WS Max WS - ALT 5I_SC1:50y r_ev ent:RAS-50y r_FUTUR
WS Max WS - ALT 5I_SC1:25y r_ev ent:RAS-25y r_FUTUR
WS Max WS - ALT 5I_SC1:10y r_ev ent:RAS-10y r_FUTUR
WS Max WS - ALT 5I_SC1:05y r_ev ent:RAS-05y r_FUTUR
WS Max WS - ALT 5I_SC1:02y r_ev ent:RAS-02y r_FUTUR
Ground
OC-
1
B19
1136
069,
Cla
y Roa
d...
OC-
3
B19
1011
070,
Flin
t Hill
Road
...
B17
0136
079,
Silv
er C
omet
RR
Brid
g...
Olley Creek OLC1

Sweetwater Creek Feasibility Report
135
0 5000 10000 15000 20000 25000 30000 35000
870
880
890
900
910
920
930
940
Sweetwater_Unsteady Pl an: 1) ALT 5I_SC1:02yr_event :RAS-02yr_FUTURE 9/27/2017 2) ALT 5I_SC1:05yr_event:RAS-05yr_FUTURE 9/18/2017 3) ALT 5I_SC1:10yr_event:RAS-10yr_FUTURE 9/18/2017 4) ALT 5I_SC1:25yr_event:RAS-25yr_FUTURE 9/18/2017 5) ALT 5I_SC1:50yr_event :RAS-50yr_FUTURE 9/18/2017 6) ALT 5I_SC1:100yr_even:RAS-100yr_FUTURE 9/18/2017 7) ALT 5I_SC1:200yr_even:RAS-200yr_FUTURE 9/18/2017 8) ALT 5I_SC1:500yr_even:RAS-500yr_FUTURE 9/18/2017
Main Channel Distance (f t)
Ele
vatio
n (ft
)
Legend
WS Max WS - ALT 5I_SC1:500y r_ev en:RAS-500y r_FUTUR
WS Max WS - ALT 5I_SC1:200y r_ev en:RAS-200y r_FUTUR
WS Max WS - ALT 5I_SC1:100y r_ev en:RAS-100y r_FUTUR
WS Max WS - ALT 5I_SC1:50y r_ev ent:RAS-50y r_FUTUR
WS Max WS - ALT 5I_SC1:25y r_ev ent:RAS-25y r_FUTUR
WS Max WS - ALT 5I_SC1:10y r_ev ent:RAS-10y r_FUTUR
WS Max WS - ALT 5I_SC1:05y r_ev ent:RAS-05y r_FUTUR
WS Max WS - ALT 5I_SC1:02y r_ev ent:RAS-02y r_FUTUR
Ground
0.37
B -
...
0.74
C -
...
0.83
Thi
s is .
..
0.93
***
VAL
LEY.
..
1.16
D -
***
FI...
1.63
E -
FIS
-E ..
.
1.73
D
.S. O
GLE
SBY
R...
2.17
G -
FI
S-G
VAL
L...
Stru
ctur
e re
vised
bas
ed o
n...
2.81
I -
FIS
-I U.
S. L
ON
G ...
adj in
vert
3.15
B
ROW
NSV
ILLE
RO
AD
D.S
.;...
3.39
K -
FIS
-K V
ALL
EY
SEC
TIO
N .
..S
weet
wat
er A
ve -
New
ly a
dded
stru
ctur
...
3.78
L -
***
XS
EC 3
.83
FIS
-L D
.S. T
HO
...
4.31
M -
***
FIS-
M V
ALL
EY
SEC
TIO
N
***...
4.51
..
.4.
61 T
his i
s a R
EPEA
TED
sect
ion.
4.72
N
&S R
AILW
AY
D.S
.
...
4.76
O -
FIS
-O V
ALL
EY
SEC
TIO
N U
.S. U
S 27
8
...
4.86
...
5.06
P -
Thi
s is
a R
EPE
ATED
secti
on.
5.21
..
.
5.32
C
SX R
AILW
AY
D.S
.
...
5.42
***
US
278
CU
LV D
.S.
**
*NE
W***
*****
...5.
49 *
** V
ALLE
Y SE
CTIO
N
*
**NEW
*****
***
.
..
5.75
R -
***
FIS-
R V
ALLE
Y S
ECT
ION
***
MO
DIF
IED*
**
...
6.02
S -
FIS
-S V
ALL
EY
SEC
TIO
N
...
PowderSpringsCrk PSC1

Sweetwater Creek Feasibility Report
136
0 10000 20000 30000 40000 50000 60000 70000
700
750
800
850
900
Sweetwater_Unsteady Pl an: 1) ALT 5I_SC1:02yr_event :RAS-02yr_FUTURE 9/27/2017 2) ALT 5I_SC1:05yr_event:RAS-05yr_FUTURE 9/18/2017 3) ALT 5I_SC1:10yr_event:RAS-10yr_FUTURE 9/18/2017 4) ALT 5I_SC1:25yr_event:RAS-25yr_FUTURE 9/18/2017 5) ALT 5I_SC1:50yr_event :RAS-50yr_FUTURE 9/18/2017 6) ALT 5I_SC1:100yr_even:RAS-100yr_FUTURE 9/18/2017 7) ALT 5I_SC1:200yr_even:RAS-200yr_FUTURE 9/18/2017 8) ALT 5I_SC1:500yr_even:RAS-500yr_FUTURE 9/18/2017
Main Channel Distance (f t)
Ele
vatio
n (ft
)
Legend
WS Max WS - ALT 5I_SC1:500y r_ev en:RAS-500y r_FUTUR
WS Max WS - ALT 5I_SC1:200y r_ev en:RAS-200y r_FUTUR
WS Max WS - ALT 5I_SC1:100y r_ev en:RAS-100y r_FUTUR
WS Max WS - ALT 5I_SC1:50y r_ev ent:RAS-50y r_FUTUR
WS Max WS - ALT 5I_SC1:25y r_ev ent:RAS-25y r_FUTUR
WS Max WS - ALT 5I_SC1:10y r_ev ent:RAS-10y r_FUTUR
WS Max WS - ALT 5I_SC1:05y r_ev ent:RAS-05y r_FUTUR
WS Max WS - ALT 5I_SC1:02y r_ev ent:RAS-02y r_FUTUR
Ground
SW
02 -
Rive
rs...
SW
03 -
Sta
te P
ark
**IF
WA
TER
IS A
BOV
E LE
FTT
BAN
K, D
ELET
E AL
L LE
FT L
EVEE
S TH
ROU
GH
2580
8
SW
04 -
Bla
irs B
ridge
Roa
dS
W05
- In
ters
tate
20
SW
07 -
Sky
view
Driv
e
SW
08 -
Thor
nton
Rd
SW
12 (D
ougl
as C
o) -
OLD
ALA
BAM
A R
OAD
Sweetwater Creek SWC6

Sweetwater Creek Feasibility Report
137
* Main Channel Distance (ft) values should be added to STA 63230 from SWC6 reach above for a continuous profi 0 20000 40000 60000 80000
860
870
880
890
900
910
920
Sweetwater_Unsteady Pl an: 1) ALT 5I_SC1:02yr_event :RAS-02yr_FUTURE 9/27/2017 2) ALT 5I_SC1:05yr_event:RAS-05yr_FUTURE 9/18/2017 3) ALT 5I_SC1:10yr_event:RAS-10yr_FUTURE 9/18/2017 4) ALT 5I_SC1:25yr_event:RAS-25yr_FUTURE 9/18/2017 5) ALT 5I_SC1:50yr_event :RAS-50yr_FUTURE 9/18/2017 6) ALT 5I_SC1:100yr_even:RAS-100yr_FUTURE 9/18/2017 7) ALT 5I_SC1:200yr_even:RAS-200yr_FUTURE 9/18/2017 8) ALT 5I_SC1:500yr_even:RAS-500yr_FUTURE 9/18/2017
Main Channel Distance (f t)
Ele
vatio
n (ft
)
Legend
WS Max WS - ALT 5I_SC1:500y r_ev en:RAS-500y r_FUTUR
WS Max WS - ALT 5I_SC1:200y r_ev en:RAS-200y r_FUTUR
WS Max WS - ALT 5I_SC1:100y r_ev en:RAS-100y r_FUTUR
WS Max WS - ALT 5I_SC1:50y r_ev ent:RAS-50y r_FUTUR
WS Max WS - ALT 5I_SC1:25y r_ev ent:RAS-25y r_FUTUR
WS Max WS - ALT 5I_SC1:10y r_ev ent:RAS-10y r_FUTUR
WS Max WS - ALT 5I_SC1:05y r_ev ent:RAS-05y r_FUTUR
WS Max WS - ALT 5I_SC1:02y r_ev ent:RAS-02y r_FUTUR
Ground
surv
eye.
..
surv
eyed
Sco
ur h
oles
...su
rvey
ed
surv
eyed
surv
eyed
surv
ey
Sco
ur h
oles
wer
e ...
surv
eyed
surv
eyed
Sco
ur h
ole
appr
oxim
a...
Sco
ur h
oles
wer
e no
t obs
e...
Sco
ur h
oles
wer
e no
t obs
er...
surv
eyed
surv
eyed
SW
20 -
HIR
AM L
ITHI
A SP
RIN
GS
RD
surv
eyed
Sco
ur h
oles
wer
e no
t obs
erve
d du
ring
...su
rvey
ed
surv
eyed
surv
eyed
Sco
ur h
oles
wer
e no
t obs
erve
d du
ring
5/9/
2017
fiel
d r..
.
FIS
XS B
FIS
XS D
FIS
XS E
FIS
XS F
Sweetwater Creek SWC5
Sweetwater Creek SWC4
Sweetwater Creek SWC3 Sweetwater Creek SWC2 Sweetwater Creek SWC1

Sweetwater Creek Feasibility Report
138

Sweetwater Creek Feasibility Report
139
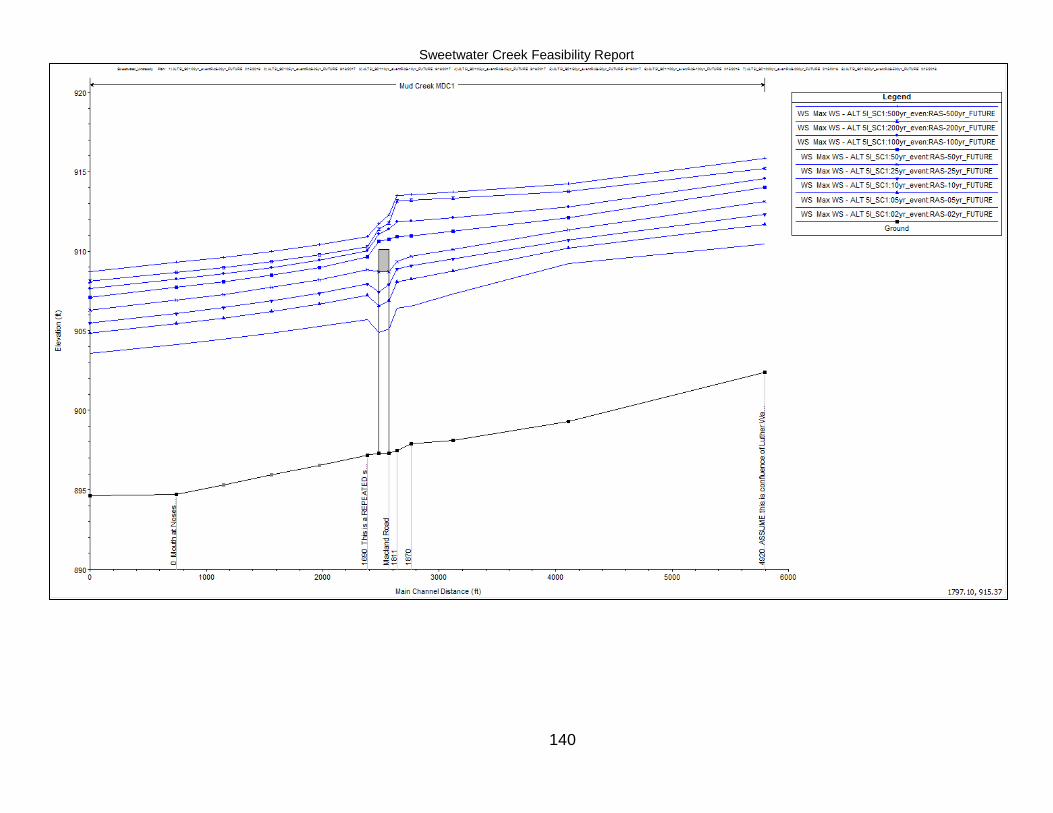
Sweetwater Creek Feasibility Report
140

Sweetwater Creek Feasibility Report
141

Sweetwater Creek Feasibility Report
142

Sweetwater Creek Feasibility Report
143

Sweetwater Creek Feasibility Report
144
* Main Channel Distance (ft) values should be added to STA 63230 from SWC6 reach above for a continuous profile
Sweetwater Creek Feasibility Report
145
APPENDIX B2: ALTERNATIVE SCHEMATICS

Sweetwater Creek Feasibility Report
146

Sweetwater Creek Feasibility Report
147

Sweetwater Creek Feasibility Report
148

APPENDIX B3: SUMMARY OF PROPOSED STRUCTURAL MEASURES Summary of Proposed Measures
Measure ID
Type Creek Location Drainage
Area (sq mi)
Maximum Pool
Elevation (ft)
Top of Dam Elevation (ft)
Available Storage (ac-ft)
Approximate Dam Length
(ft)
Dam Height (ft)
Dam Width (ft)
Low Level Slot Width
(ft)
Low Level Slot
Height (ft)
High Level Slot Width (ft)
High Level Slot Height (ft)
MC2 Retention Mill Creek Upstream of Morningside Drive
37 922 925 1,370 1300 19.5 20 25 13.5 75 6
MC5 Retention Mill Creek Former Pine Lake Dam 42 914 917 2,100 2300 25 20 18 23 200 2
OC1 Retention Olley Creek Upstream of Flint Hill Road SW
12 914 917 2,050 600 29 20 8 29 0 0
PSC2 Retention Powder Springs Creek Upstream of CH James Parkway
18 922 925 2,700 1400 25 20 8 20 30 5
SC1 Retention Sweetwater Creek Upstream of Bakers Bridge Road
42 956 959 7,660 1500 24 20 8 19 50 5
SC1s Retention Sweetwater Creek Upstream of Bakers Bridge Road
42 951 954 5,720 1500 19 20 8 19 N/A N/A
SC2 Retention Sweetwater Creek Upstream of Hiram Douglasville Hwy
51 926 929 2,260 1600 15 20 10 9 100 6
SC5 Diversion Sweetwater Creek Along CH James Parkway
- - - - - - - - - - -
SC6 Retention Sweetwater Creek Upstream of Brown Road
101 914 917 9,000 1400 33 20 10, 11, 20* 30.5 1098 2.5
SC9 Channel
Modification Sweetwater Creek
Along Sweetwater Creek around and downstream of Austell
- - - - - - - - - - -

7. References
Allen, R.J. and A.T. Degaetno, 2005: Areal Reduction Factors for Two Eastern United States Regions with High Rain-Gauge Density, JOURNAL OF HYDROLOGIC ENGINEERING, 10, 327-335.
Douglas County, 2-ft Contours, 2010.
Federal Emergency Management Agency, Flood Insurance Study, Cobb County, Georgia and Incorporated Areas, March 4, 2013.
Federal Emergency Management Agency, Riverine High Water Marks, Disaster-1858-DR-Georgia. August 11, 2010.
Merkel, W. and H.F. Moody, 2015: NOAA Atlas 14 rainfall for Midwest and Southeast States. Accessed from NRCS on April 15, 2017.
Menne, M.J., and co-authors, 2012: An overview of the global historical climatology network-daily database. Journal of Atmospheric and Oceanic Technology, 29, 897-910.
Multi-Resolution Land Characteristics Consortium (MRLC) – National Land Cover Database 2011 (NLCD2011) Percent Developed Imperviousness. Retrieved on January 15, 2015 from http://www.mrlc.gov/nlcd11_data.php.
Photo Science, Cobb County LiDAR, 2015.
U.S. Army Corps of Engineers, Climate Hydrology Tool, PROD 1.2, http://corpsmapu.usace.army.mil/cm_apex/f?p=313:2:0::NO:::.
U.S. Army Corps of Engineers, Engineering and Construction Bulletin 2016-25. Guidance for Incorporatng Climate Change Impacts to Inland Hydrology in Civil Works Studies, Designs, and Projects. September 16, 2016.
U.S. Army Corps of Engineers, Hydrologic Engineering Center Hydrologic Modeling System, HEC-HMS 4.2.1, March 2017.
U.S. Army Corps of Engineers, Hydrologic Engineering Center River Analysis System, HEC-RAS 5.0.3, March 2017.
U.S. Army Corps of Engineers, Hydrologic Engineering Center River Analysis System, Hydraulic Reference Manual, February 2016.
U.S. Army Corps of Engineers, Hydrologic Engineering Center Statistical Software Package, HEC-SSP 2.1, July 2016. U.S. Army Corps of Engineers, Hydrologic Engineering Center Watershed Analysis Tool, HEC-WAT 1.0, April 2017.
U.S. EPA Office of Research & Development (ORD) - National Center for Environmental Assessment (NCEA) - Global Change Research Program(GCRP). ICLUS v1.3 Estimated Percent Impervious Surface for the Conterminous US. Retrieved on July 7, 2017 from https://www.epa.gov/iclus/iclus-downloads.
U.S. Geological Survey, 02336968 Noses Creek at Powder Springs Road, GA
U.S. Geological Survey, 02336986 Olley Creek at Clay Road, near Austell, GA
U.S. Geological Survey, 02336870 Powder Springs Creek Near Powder Springs, GA
U.S. Geological Survey, 02336910 Sweetwater CR 0.05 MI US RR BRIDGE AT AUSTELL, GA
U.S. Geological Survey, 02337040 Sweewater Creek Below Austell, GA
U.S. Geological Survey, 02337000 Sweetwater Creek Near Austell, GA
U.S. Geological Survey, 02336840 Sweetwater Creek, Brownsville Road, Powder Springs, GA

U.S. Geological Survey, Lagtime Relations for Urban Streams in Georgia, Water Resources Investigations Report 00-4049, Atlanta, Georgia, 2000.
U.S. Geological Survey, Magnitude and Frequency of Rural Floods in the Southeastern United States, 2006: Volume I, Georgia, Scientific Investigations Report 2009-5043, 2009.
U.S. Geological Survey, National Elevation Data, Paulding County, GA. Retrieved on May 1, 2017.
U.S. Geological Survey, National Elevation Data, Carroll County, GA. Retrieved on May 1, 2017.