ENGINEERING REPORT FOR THE - Santa Clarita,...
52
Engineering Report for the Vista Canyon Factory (Municipal Wastewater Treatment Facility) (2009)
Transcript of ENGINEERING REPORT FOR THE - Santa Clarita,...

Engineering Report for the Vista Canyon Factory
(Municipal Wastewater Treatment Facility) (2009)


ii
TABLE OF CONTENTS
PAGE NO.
CHAPTER 1 OVERVIEW ............................................................................................ 1-1 Project Description ..................................................................... 1-1 Purpose of Study ......................................................................... 1-2 Ownership/Maintenance of Water Factory ............................... 1-2 Regulatory Consideration .......................................................... 1-3 CHAPTER 2 PLANNING AND DESIGN CRITERIA ................................................ 2-1 WASTEWATER FLOW GENERATION FACTORS ............................ 2-1 DESIGN WASTEWATER STRENGTH LOADINGS .......................... 2-1 WATER FACTORY DESIGN FLOW .................................................... 2-2 TREATMENT CAPACITY DISCUSSION ............................................ 2-3 CHAPTER 3 WATER FACTORY FACILITY ............................................................. 3-1 TREATMENT PROCESS ...................................................................... 3-1 Headworks .................................................................................. 3-1 Flow Equalization....................................................................... 3-1 Secondary and Tertiary Process ................................................ 3-4 Conventional Extended Aeration Activated Sludge with Sand Filters ............................................... 3-4 Sequence Batch Reactor System ................................... 3-4 Membrane Bioreactor System ....................................... 3-5 Disinfection ................................................................................. 3-5 EFFLUENT USE AND DISPOSAL ...................................................... 3-5 Storage ......................................................................................... 3-5 Effluent Pumps ........................................................................... 3-6 Percolation Ponds ....................................................................... 3-6 EMERGENCY GENERATOR ............................................................... 3-7 PLANT DRAINAGE SYSTEM .............................................................. 3-7 SPILL CONTAINMENT SYSTEM ....................................................... 3-7 SYSTEM SIZING TABLES.................................................................... 3-7

iii
TABLE OF CONTENTS (Continued)
PAGE NO.
CHAPTER 4 RECYCLED WATER AVAILABILITY, USE AND STORAGE ...................................................................................... 4-1 RECYCLED WATER DEMAND AND USE ......................................... 4-1 Landscape Irrigation Demands ................................................. 4-2 Dual-plumbed Demands ............................................................ 4-2 EXCESS RECYCLED WATER.............................................................. 4-5 Castaic Lake Water Agency ....................................................... 4-6 Percolation Ponds ....................................................................... 4-6 Water Factory Flow .................................................................... 4-6
CHAPTER 5 JURISDICTIONAL CONSIDERATIONS ............................................ 5-1 SEWER .................................................................................................... 5-1 City of Santa Clarita .................................................................. 5-1 Santa Clarita Valley Sanitation District .................................. 5-1 RECYCLED WATER .............................................................................. 5-2
CHAPTER 6 REGULATORY REQUIREMENTS ...................................................... 6-1 LOS ANGELES REGIONAL WATER QUALITY CONTROL BOARD ................................................................................ 6-1 STATE DEPARTMENT OF PUBLIC HEALTH .................................. 6-1 COUNTY DEPARTMENT OF PUBLIC HEALTH .............................. 6-1 OTHER AGENCIES ............................................................................... 6-2 WATER QUALITY ................................................................................. 6-2 Potable Water Quality................................................................ 6-2 Water Factory Effluent Quality ................................................ 6-4 Emerging Contaminants ............................................................ 6-6
CHAPTER 7 PRELIMINARY USERS FEE AND FISCAL ANALYSIS ................... 7-1 COSTS ..................................................................................................... 7-1 REVENUE .............................................................................................. 7-1
iv
LIST OF TABLES
PAGE NO.
TABLE 2-1 VISTA CANYON ESTIMATED WASTEWATER GENERATION AVERAGE DAILY FLOW........................................... 2-1 TABLE 2-2 VISTA CANYON ESTIMATED WASTEWATER GENERATION AVERAGE DAILY COD ............................................. 2-2 TABLE 2-3 VISTA CANYON ESTIMATED WASTEWATER GENERATION AVERAGE DAILY SS ................................................. 2-2 TABLE 2-4 WATER FACTORY DESIGN LOADING ............................................. 2-3 TABLE 2-5 PEAK FLOWS TO THE WATER FACTORY ....................................... 2-3 TABLE 3-1 VISTA CANYON WATER FACTORY FACILITY SIZING CRITERIA.............................................................. 3-8 TABLE 3-2 VISTA CANYON MOTOR HORSEPOWER NEEDS .......................... 3-9 TABLE 3-3 VISTA CANYON OTHER POWER NEEDS ........................................ 3-9 TABLE 4-1 VISTA CANYON WATER DEMANDS ................................................. 4-1 TABLE 4-2 VISTA CANYON RECYCLED WATER DEMANDS ........................... 4-2 TABLE 4-3 VISTA CANYON WATER DEMANDS ................................................. 4-4 TABLE 4-4 VISTA CANYON WATER DELIVERIES ............................................. 4-4 TABLE 4-5 MONTHLY RECYCLED WATER DEMANDS AND DELIVERIES ................................................................................ 4-5

v
LIST OF TABLES
PAGE NO.
TABLE 6-1 PRIMARY DRINKING WATER STANDARD MAXIMUM CONTAMINANT LEVELS (MCLs) ................................. 6-2 TABLE 6-2 SECONDARY DRINKING WATER STANDARDS ............................. 6-3 TABLE 6-3 AVERAGE GROUNDWATER QUALITY OF FIVE CLWA WELLS .............................................................................. 6-3 TABLE 6-4 CONSTITUENT ADDITION FROM A USE CYCLE .......................... 6-5 TABLE 6-5 VISTA CANYON WATER FACTORY EFFLUENT ............................ 6-5 TABLE 6-6 VALENCIA WATER RECLAMATION PLANT RECYCLED WATER LIMITS .................................................................................. 6-6 TABLE 6-7 GROUNDWATER OBJECTIVES FOR REACH 7 OF THE SANTA CLARA RIVER (SANTA CLARA MINT CANYON) ....................................................... 6-6 TABLE 7-1 VISTA CANYON WATER FACTORY CONNECTION FEE ANALYSIS .......................................................... 7-2

vi
LIST OF FIGURES
PAGE NO.
FIGURE 2-1 VISTA CANYON WATER FACTORY SEWER DRAINAGE BASIN ................................................................. 2-4 FIGURE 3-1 VISTA CANYON WATER FACTORY PROCESS FLOW SCHEMATIC ........................................................... 3-2 FIGURE 3-2 VISTA CANYON WATER FACTORY SITE LAYOUT ........................ 3-3 FIGURE 4-1 IRRIGATED AREAS WITH RECLAIMED WATER ........................... 4-3
vii
LIST OF APPENDICES APPENDIX A SCVSD SERVICE CHARGE RATE AND MEAN LOADINGS
ORDINANCE APPENDIX B DETAILED PROJECT WATER DEMAND CALCULATIONS APPENDIX C LANDSCAPE IRRIGATION INFORMATION APPENDIX D INTERIOR RECYCLED WATER DEMAND CALCULATION
LIST OF REFERENCES Asano, Takashi, Franklin L. Burton, Harold L. Leverenz, Ryujiro Tzuchihashi, and George Tchobanoglous. Water Reuse Issues, Technologies, and Applications. New York: Metcalf & Eddy, Inc. 2007. Print.

DEXTER WILSON ENGINEERING, INC. PAGE 1-1
CHAPTER 1 OVERVIEW This report provides information and analysis for the development of a municipal wastewater treatment plant, or water factory, in conjunction with the Vista Canyon mixed-use project. The project site is mostly disturbed, vacant land, with the exception of open storage and a residential use on the western portion of the site. Although most of the project site is not currently developed, it is surrounded by existing development. The project site also has been subject to repeated disturbance from utility construction and maintenance, illegal unauthorized dumping, unauthorized off-road vehicle activity, and various flood control activities. The approximately 185-acre project site is located immediately south of State Route 14 (SR-14), west of La Veda Avenue, north of the Metrolink rail line, and east of the Colony Townhome community in unincorporated Los Angeles County. The project applicant is Vista Canyon Ranch, LLC. The project applicant is proposing annexation of the project site and various surrounding areas to the City of Santa Clarita. The project site is bisected by the Santa Clara River. The majority of the proposed development on the project site would be located south of the Santa Clara River, with a smaller commercial development proposed north of the River.
Project Description
The project applicant is proposing a Specific Plan (SP) designation for the project site, and has designed the Specific Plan so as to deliver a mixed-use, transit-oriented neighborhood to the eastern Santa Clarita Valley. The proposed land uses shown on the tentative tract map include 1,117 dwelling units (96 single family residential lots and 1,021 multi-family residential units) and up to 950,000 square feet of commercial and medical office, retail, theater, restaurant, and hotel uses within four Planning Areas (“PA”). A residential overlay over the corporate office campus site within PA-2 would allow for a conversion of up to 250,000 square feet of office floor area to 233 attached residential units. If implemented, this conversion would permit a maximum of 1,350 residential units and 700,000 square feet of commercial floor area. The proposed project would include various parks/recreation amenities, including the Oak Park, Town Green, Community Garden, and the River Education/Community Center, a Metrolink station, bus transfer station, private recreational facilities, and various trail, road, and buried bank stabilization protection improvements.

DEXTER WILSON ENGINEERING, INC. PAGE 1-2
Purpose of Study
The purpose of the study is to describe the facilities required to treat and reuse wastewater (sewage) generated by the proposed Vista Canyon project, to assess the water factory’s potential impacts on water and sewer service, and to identify mitigation measures, if any, for these impacts.
Ownership/Maintenance of the Water Factory
The Vista Canyon project site is proposed for annexation to the City of Santa Clarita. As proposed, the water factory would be owned and operated by the City of Santa Clarita ("City"). As such, it would be considered a "municipal wastewater treatment plant” or publically-owned treatment work (POTW). The project site is not currently within the boundary of the Santa Clarita Valley Sanitation District, but is within the Santa Clarita Water Division of Castaic Lake Water Agency (CLWA) service boundaries. The project applicant proposes to construct the water factory in conjunction with the project, and provide a turn-key facility to City. The City would likely contract for operation of the water factory. All costs associated with the ongoing maintenance of the proposed plant would be paid for by future residents and property owners within the Vista Canyon project through an assessment district. The Vista Canyon water factory would treat the wastewater generated by both the project and a portion of the existing flows from a City of Santa Clarita sewer line crossing the project site. All solids from the Vista Canyon water factory would be sent to the Santa Clarita Valley Sanitation District’s existing Valencia water reclamation plant for processing and disposal. Recycled water from the Vista Canyon water factory would then be delivered to CLWA as the wholesale water agency for the Santa Clarita Valley to offset existing water demands. CLWA would distribute the recycled water through its future reclaimed water distribution system both within and outside of the project boundary. Initially, some of the water may be directed to the percolation pond, or infiltration basin, adjacent to the Vista Canyon water factory until the CLWA recycled system is operational. Additional discussion on ownership/maintenance responsibilities is included in Chapter 5.

DEXTER WILSON ENGINEERING, INC. PAGE 1-3
Regulatory Considerations
Permits for the Vista Canyon water factory would need to be issued by the Los Angeles Regional Water Quality Control Board (RWQCB) prior to construction of the facility for recycled water production and use. All of the sewage generated in the sewer service area would be treated and reused on and off-site or discharged to adjacent percolation ponds. The Vista Canyon water factory would not discharge treated water to the Santa Clara River. The Vista Canyon water factory also must comply with State and County Department of Public Health requirements for the use of recycled water, including the California Code of Regulations, Title 22, requirements for unrestricted reuse. The diesel emergency generators for the water factory and pump station also would need to be permitted by the South Coast Air Quality Management District (SCAQMD). A more detailed discussion of permitting is included in Chapter 6.

DEXTER WILSON ENGINEERING, INC. PAGE 2-1
CHAPTER 2
PLANNING AND DESIGN CRITERIA This chapter provides the planning and design criteria and estimates the flow and strength of the wastewater to be treated at the Vista Canyon water factory.
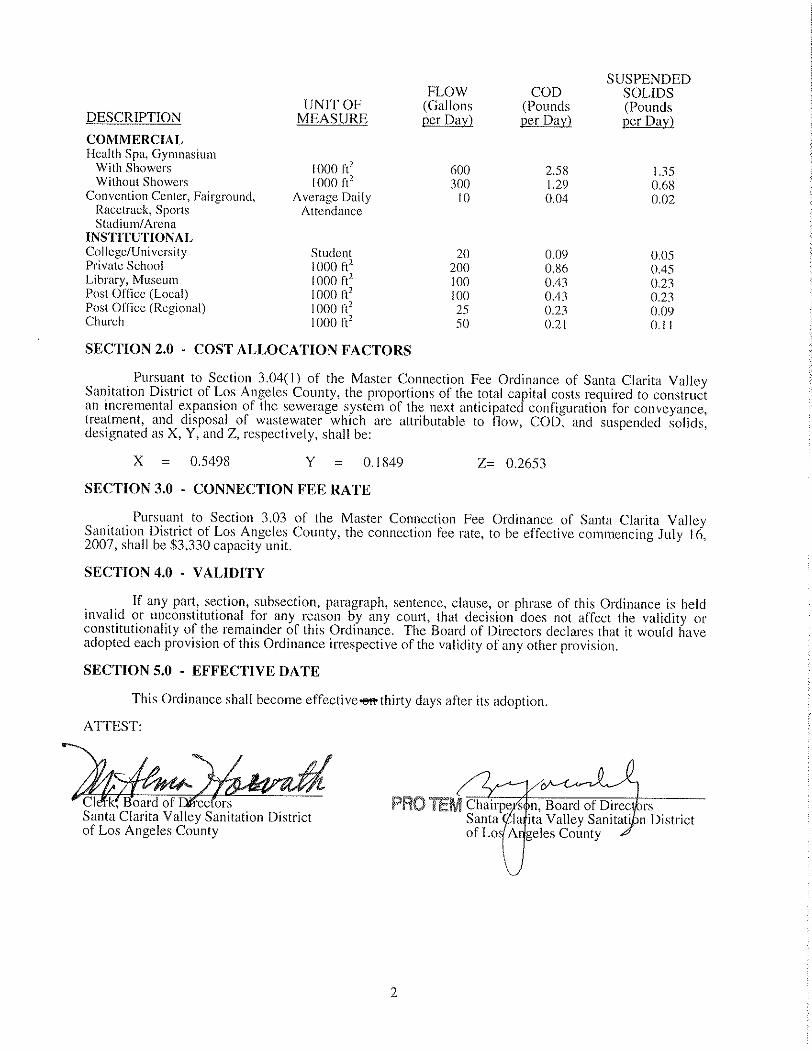
WASTEWATER FLOW GENERATION FACTORS Wastewater flow generation factors were taken from the Santa Clarita Valley Sanitation District’s Rate and Mean Loadings Ordinance. A copy of this Ordinance is included in Appendix A for reference. Table 2-1 summarizes the projected flows to the facility. The total projected average flow is 0.395 mgd.
TABLE 2-1 VISTA CANYON ESTIMATED WASTEWATER GENERATION
AVERAGE DAILY FLOW
Land Use Count Generation Factor
Flow, gpd
Res - SF 96 DU 260 gpd/DU 24,960 Res - MF 1,021 DU 156 gpd/DU 159,276 Hotel 200 rooms 125 gpd/room 25,000 Commercial 50,000 sf 200 gpd/1,000sf 10,000 Theater 31,000 sf 125 gpd/1,000sf 3,875 Retail 94,000 sf 150 gpd/1,000sf 14,100 Restaurant 39,000 sf 1,000 gpd/1,000sf 39,000 Office 596,000 sf 200 gpd/1,000sf 119,200 Total 395,411
DESIGN WASTEWATER STRENGTH LOADINGS
Average daily strength loadings of chemical oxygen demand (COD) and suspended solids (SS) are shown in Tables 2-2 and 2-3. These strengths are based on the Santa Clarita Valley Sanitation District's Rate and Mean Loadings Ordinance (Appendix A) prescribing the connection fee rate and mean loadings per unit of usage.

DEXTER WILSON ENGINEERING, INC. PAGE 2-2
TABLE 2-2 VISTA CANYON ESTIMATED WASTEWATER GENERATION
AVERAGE DAILY COD
Land Use Count Generation Factor COD lbs/day
Res - SF 96 DU 1.22 lbs/day/unit 117.12 Res - MF 1,021 DU 0.73 lbs/day/unit 745.33 Hotel 200 rooms 0.54 lbs/day/room 108.00 Commercial 50,000 sf 0.86 lbs/day/1,000sf 43.00 Theater 31,000 sf 0.54 lbs/day/1,000sf 16.74 Retail 94,000 sf 2.10 lbs/day/1,000sf 197.40 Restaurant 39,000 sf 16.68 lbs/day/1,000sf 650.52 Office 596,000 sf 0.86 lbs/day/1,000sf 512.56 Total 2,390.67
TABLE 2-3 VISTA CANYON ESTIMATED WASTEWATER GENERATION
AVERAGE DAILY SS
Land Use Count Generation Factor SS lbs/day
Res - SF 96 DU 0.59 lbs/day/unit 56.64 Res - MF 1,021 DU 0.35 lbs/day/unit 357.35 Hotel 200 rooms 0.28 lbs/day/room 56.00 Commercial 50,000 sf 0.45 lbs/day/1,000sf 22.50 Theater 31,000 sf 0.28 lbs/day/1,000sf 8.68 Retail 94,000 sf 1.00 lbs/day/1,000sf 94.00 Restaurant 39,000 sf 5.00 lbs/day/1,000sf 195.00 Office 596,000 sf 0.45 lbs/day/1,000sf 268.20 Total 1,058.37
WATER FACTORY DESIGN FLOW As determined in the previous section, the treatment capacity required to accommodate Vista Canyon’s wastewater flows is 395,411 gpd, based on Santa Clarita Valley Sanitation District's flow generation factors. Table 2-4 summarizes previous tables and presents the design loading for the facility. This table includes the average flow, COD, suspended solids, and biological oxygen demand (BOD).

DEXTER WILSON ENGINEERING, INC. PAGE 2-3
Table 2-5 provides the peak flows expected at the Vista Canyon water factory. To convert to peak dry weather flow, the average daily flow was multiplied by a factor of 2.0. To convert average daily flow rate to peak wet weather flows, the Sanitation Districts of Los Angeles County (LACSD) peaking equation was used. This peaking equation, in million gallons per day, is shown below.
TABLE 2-4 WATER FACTORY DESIGN LOADING
Flow COD SS BOD1 MGD lbs/day mg/l lbs/day mg/l lbs/day mg/l 0.395 2,391 726 1,058 321 1,434 436
1. Assumes BOD to COD ratio is 0.6
TABLE 2-5 PEAK FLOWS TO THE WATER FACTORY
Average Flow Peak Dry Peak Wet
MGD Weather Factor
Flow, MGD Weather Factor Flow,
MGD 0.395 2 0.791 2.65*Q(avg)^0.906 1.143
TREATMENT CAPACITY DISCUSSION The 395,411 gpd treatment capacity of the water factory is based on Santa Clarita Valley Sanitation District's generation rates. The water balance in Chapter 4, however, shows that the estimated treatment capacity required specifically for the Vista Canyon project is only 214,265 gpd, based on the project’s interior potable water demands. At the proposed Vista Canyon water factory location, a drainage area also could be situated to serve more than the Vista Canyon project. Figure 2-1 provides a map of the project and the sewer drainage basin for the water factory. The estimated wastewater flow generated by those off-site areas is 96,432 gpd. Additionally, the Vista Canyon water factory would be located in the vicinity of an existing sewer mainline, and partial flows from this mainline would be directed to the water factory for treatment and use. These off-site flows also would allow the water factory to start up with flows greater than those generated by the initial development in the Vista Canyon project.
2.65 Q average = Q peak 0.90


DEXTER WILSON ENGINEERING, INC. PAGE 2-5
At the treatment capacity of 395,411 gpd, the Vista Canyon project would construct a larger water recycling plant than is needed solely for the project based upon its projected water demand. Discussed further in Chapter 4, the Vista Canyon project’s total potable and non-potable water demand is anticipated to be 297,922 gpd (333.7 acre-feet per year, afy), as follows:
• recycled water (non-potable) demand is 117,922 gpd (132.1 afy), and • potable water demand is 180,001 gpd (201.6 afy).
Constructing the Vista Canyon water factory at a treatment capacity of 395,411 gpd (442.9 afy), and supplying the Vista Canyon recycled water demand of 117,922 gpd (132.1 afy), results in an excess recycled water supply of 277,489 gpd (310.8 afy). This excess supply would be utilized by CLWA over time to offset existing water demands within the Santa Clarita Valley. Initially, this excess water may be directed to percolation ponds adjacent to the Vista Canyon water factory until the CLWA system is operational. Since this excess (277,489 gpd) is far greater than the Vista Canyon project's potable water demand of 180,001 gpd, the project would result in no net increase in water demand for CLWA and the Santa Clarita Water Division.

DEXTER WILSON ENGINEERING, INC. PAGE 3-1
CHAPTER 3
WATER FACTORY FACILITY The process flow schematic for the Vista Canyon water factory is shown on Figure 3-1 and a preliminary site layout is shown on Figure 3-2. The water factory would be designed to produce disinfected tertiary recycled water in accordance with the requirements of California Code of Regulations, Title 22, Section 60304(a), including the reliability requirements of Title 22. No solids would be treated on site. The water factory will be a scalping plant with waste activated sludge processed at Santa Clarita Valley Sanitation District's existing facilities downstream.
TREATMENT PROCESS The final selection of the treatment process would be completed during final design of the water factory. The process would be a variation of the extended aeration activated sludge process. At this time, the water factory could consist of a conventional system, sequencing batch reactors, or membrane bioreactors. All of these technologies would produce disinfected tertiary recycled water in accordance with the requirements listed above. These processes also require approximately the same footprint space, but the discussed layout would assume worst case special needs. All treatment processes would be located in concrete tanks.
Headworks
The headworks would be designed to pump flow to the start of the treatment process and provide screening to protect downstream equipment. If a conventional system or sequencing batch reactor system is used, course screening or a comminutor would be installed upstream of the influent pump station, and provide protection for downstream processes. If the membrane bioreactor process is used, a fine screen and screening compacter would be needed.
Flow Equalization
After the headworks and prior to the treatment process, a flow equalization basin may be installed. The purpose of this basin would be to balance incoming flow variations such that a constant flow rate is conveyed through the treatment process portion of the plant. This equalization only would be needed if the peak flow cannot be accommodated in the secondary or tertiary process. A bypass line would be provided to allow the flow equalization tank to be taken off-line without shutting down the plant.


DEXTER WILSON ENGINEERING, INC. PAGE 3-4
Secondary and Tertiary Process
One of three processes would be used for secondary and tertiary treatment. These are the conventional extended aeration activated sludge with sand filters, sequencing batch reactors with sand filters or membrane bioreactors. Each process is discussed below. Each process would have tank and equipment redundancy. Conventional Extended Aeration Activated Sludge with Sand Filters.
If this process is selected, aeration tanks, sedimentation tanks, and tertiary filters would be required. These facilities are described below. An Aeromod-type system is described.
Aeration Tanks.
An Aeromod system would utilize four aeration tanks. Each of the tanks would be sized for 90,000 gallons. The four tank system would allow for one tank to be taken out of service for inspection and repair while the other three remain in service to treat the flows.
Sedimentation Tank.
An Aeromod system would use four sedimentation tanks, which would allow one tank to be taken out of service while treating the flow with the remaining three tanks.
Filters.
Following secondary treatment, the water would be coagulated, flocculated, and filtered to remove small particulate matter. Coagulation would be done by polymer injection. The flocculation tank would provide adequate detention time for particles to flocculate before reaching the filter. Two upflow, continuously backwashing filters with a moving sand bed would be provided. Each filter would be sized for the entire plant flow. The backwash would be diverted downstream to the plant drainage system and then to the sewers.
Sequence Batch Reactor System.
The sequencing batch reactor system provides for aeration and sedimentation in one tank.
Process Tanks.
Three process tanks would be provided for this system. Each tank would operate on a timed sequence for filling, aeration, and decanting. Two of the tanks would be able to treat the flow if one was out of service. Each tank would be approximately 180,000 gallons.
Filters.
The filters would operate as described for the conventional system.

DEXTER WILSON ENGINEERING, INC. PAGE 3-5
Membrane Bioreactor System.
If the membrane bioreactor system is used the filter would not be needed. Aeration tanks and membrane tanks would provide both secondary and tertiary treatment.
Process Tanks.
Three process tanks would be provided for this system. Each tank would be approximately 136,000 gallons.
Membrane Tank.
In the membrane bioreactor system, a membrane is used in place of the sedimentation tanks and filters. The membrane is able to provide a better single-step solids liquid separation then the two-step system. Four membrane tanks would be provided for this system.
Disinfection
Disinfection would be accomplished through a combination of ultraviolet (UV) and chlorination. UV would be the primary disinfectant. The UV is utilized to reduce the amount of chlorine added to the system to reduce effluent chlorine levels. In order to provide continuous disinfection in the piping system, a small amount of chlorine would be added after the UV disinfection. This small amount of chlorine would be added after the diversion system to the percolation ponds.
EFFLUENT USE AND DISPOSAL The effluent use and disposal system would have storage, a pump station, and percolation ponds for disposal of excess recycled water. An alternate diversion system would be built into the design to divert water, which does not meet recycled water effluent turbidity limits to the percolation ponds before the storage tank. Although this water would not meet water recycling requirements, it would meet the effluent requirements for the percolation ponds.
Storage
A 100,000 gallon storage tank would be provided to serve as a forebay for the effluent pumps and provide for in-plant water needs.

DEXTER WILSON ENGINEERING, INC. PAGE 3-6
Effluent Pumps
Effluent pumps would be provided to pump to the recycled water system. These pumps would be sized as required by the recycled system.
Percolation Ponds
In order to dispose of effluent when there is no demand for recycled water, percolation ponds would be provided. These ponds would have separate discharge requirements and could be used to discharge effluent that does not meet reclamation standards. Additionally, the percolation ponds could receive treated stormwater from the Vista Canyon project. To allow for the most conservative space requirement, the percolation ponds have been sized assuming that CLWA does not take the excess recycled water from the water factory and that the ponds will receive some treated stormwater from developed portions of the Vista Canyon project. These assumptions are in addition to rain which would fall directly into the percolation pond, which has been accounted for in the sizing as well. The required volume of storage would be divided between two ponds. The ponds would be approximately five feet deep, with two feet of free board and comprise approximately 0.75 acres total. Combined, the ponds would have a working volume of approximately 84,000 ft3 (628,000 gal) and an overflow volume of approximately 146,800 ft3
(1,098,000 gal).
As an alternative to open ponds, which would contain water in some months and no water in others, the project may construct a buried piping system. Under this arrangement, a decorative basin would remain full of water all year long and overflow into the buried piping. The size of the percolation ponds could be reduced if an arrangement is made with CLWA to utilize the excess recycled water. Water factory operation and maintenance plans would include the required maintenance of these ponds.

DEXTER WILSON ENGINEERING, INC. PAGE 3-7
EMERGENCY GENERATOR
A diesel emergency generator would be provided to operate the plant during a power outage. Fuel storage would be provided with sufficient capacity to operate the generator at maximum load for 24 hours.
PLANT DRAINAGE SYSTEM A plant drainage system would be provided to allow all of the process tankage to be drained. This system would discharge to the downstream sewers. A submersible pump station may be needed to pump the drainage to the downstream sewer. The drains from the restrooms in the operations building would be conveyed to this system.
SPILL CONTAINMENT SYSTEM The process area of the treatment plant would contain piping, equipment, and tankage. Overflows, pipe breaks, or equipment failures could cause spills of sewage or partially treated sewage. To contain these spills and prevent them from exiting the site, the process area would drain to a single location connected to the plant drainage system. These liquids would then be pumped to the headworks of the plant. Flows from incidental rain events would be returned to the plant headworks. Adjacent to this, the location would also have a normally-closed valve connection to the storm drain system, so that during substantial rain events, the valve could be opened to direct site runoff to the storm drain.
SYSTEM SIZING TABLES Tables 3-1 through 3-3 provide preliminary equipment, tank, and power requirements for the water factory.

DEXTER WILSON ENGINEERING, INC. PAGE 3-8
TABLE 3-1 VISTA CANYON WATER FACTORY
FACILITY SIZING CRITERIA
Item Size Redundancy Criteria
Influent Pump Station 2 each 785 gpm Each pump capable of @ 40’ pumping peak flow 20 HP Screening
Coarse Screen 1 mechanically cleaned Either screen capable For Conventional or SBR
1 HP of screening peak flow. 1 manual cleaned
Fine Screen 2 each at 785 gpm Either screen capable For MBR
0.5 HP each of screening peak flow. Screening Compactor Aeration Tanks 3 tanks each at 18 hours detention with 145,000 gallon one tank out of service Solids Separation For Conventional each 25’ x 25’ rate of 400 gpd/sf
Minimum of 3 tanks Maximum overflow
with one tank out of service. For SBR Deeper
Make Aeration tank
For MBR Each 20’ x 30’ 10 gpd/sf with one
Minimum of 4 tanks Maximum flux of
tank out of service. RAS Pumps 2 each 1,570 gpm 400% return with (worst case MBR) @ 10’ with one pump out 15 HP each of service. Aeration Blowers 3 each at 385 scfm 770 scfm with one 50 HP each out of service. Filters 3 at 30 sf each Maximum rate of (worst case conv. or SBR) 5 gpm/sf with one out of service. Ultraviolet Disinfection 2 units each at 785 gpm Each unit will handle 4 KW power peak flow Effluent Storage 100,000 gallons Effluent Pumps 2 each at 785 gpm Each unit will handle @ 100 psi peak flow 75 HP each Percolation Pond 32,810 sf with 2’ of Maximum average rate freeboard of 1’ per day Emergency Generator 500 KW

DEXTER WILSON ENGINEERING, INC. PAGE 3-9
TABLE 3-2 VISTA CANYON WATER FACTORY
MOTOR HORSEPOWER NEEDS
Item Quantity HP Connected Load, HP
Duty Load, HP
Influent Pump 2 20 40 20
Screening 2 ½ 1 1
RAS Pumps 2 15 30 15
Aeration Blowers 3 50 150 100
Effluent Pumps 2 75 150 75
Total 361 206
TABLE 3-3 VISTA CANYON WATER FACTORY
OTHER POWER NEEDS
Item Description Connected Load, kw
Emergency Load, kw
Ultraviolet Disinfection 2 @ 4 kw each 8 4
Site Lighting 20,000 sf @ 0.5 w/sf, 10 5
Building 1,200 sf @ 25 w/sf 30 10
Miscellaneous Equipment 10,000 w 10 0
Total 58 19

DEXTER WILSON ENGINEERING, INC. PAGE 4-1
CHAPTER 4
RECYCLED WATER AVAILABILITY, USE, AND STORAGE This chapter discusses the availability and use of the tertiary effluent from the proposed Vista Canyon water factory. As determined in Chapter 2, the water factory would be designed conservatively to treat 395,411 gpd (442.9 afy); and thus, there would be 395,411 gpd of recycled water available (on average). The Vista Canyon project water balance, shown in the following sections, illustrates the generation of only 214,265 gpd (240.0 afy) of wastewater and an average recycled water demand of 117,922 gpd (132.1 afy). The last section discusses the excess recycled water generated by the water factory.
RECYCLED WATER DEMAND AND USE To determine the use of recycled water useage by the Vista Canyon project, a water balance of the project’s total water demands was completed. Table 4-1 provides the Vista Canyon project’s water demands. The detailed determination of Table 4-1 is found in Appendix B. This total demand shown at 297,922 gpd (333.7 afy) is less than the estimated wastewater flow based on the plant sizing generation factors in Chapter 2; thus, the wastewater generation factors are considered very conservative.
TABLE 4-1 VISTA CANYON WATER DEMANDS
Land Use Acreage Units or Square Footage
Total Demand, ac-ft/yr
Total Demand,
gpd Res-SF 7.7 96 29.0 25,903 Res-MF 28.1 1,021 106.3 94,942 Commercial 15.1 950,000 116.2 103,780 Landscape/OS/Park 30.4 - 48.6 43,430 Bank Protection 22.3 - 33.5 29,867 Santa Clara River 55.0 - - - Hardscape 26.7 - - -
TOTAL 185.3 1,117 units
333.7 297,922 950,000 sf

DEXTER WILSON ENGINEERING, INC. PAGE 4-2
Recycled water would be utilized at the Vista Canyon project for irrigation of landscaped areas, and of the re-vegetated areas above the soil cement bank protection. Additionally, the retail, office, and commercial spaces would be dual-plumbed to receive recycled water for public toilet facilities.
Landscape Irrigation Demands
Figure 4-1 shows the areas to be irrigated with recycled water on the Vista Canyon project. The majority of the project would be landscaped with low water use plants. Appendix C provides additional background on the water use factor for the landscape and park land uses. The soil cement bank protection irrigation water use factor is estimated based on our previous evaluations. Use of recycled water for this purpose would be temporary, likely lasting approximately five years.
Dual-Plumbed Demands
The Vista Canyon retail, office, and commercial spaces would be dual-plumbed for recycled water to supply the public toilet facilities. In the water balance for the project, these areas are combined with the theater and hotel and are collectively designated as the “Commercial” land use. The dual-plumbed recycled water demand percentage of the total Commercial water demand was determined to be 43 percent. Appendix D provides the calculations for determining this percentage. Table 4-2 summarizes the use of recycled water within the Vista Canyon project.
TABLE 4-2 VISTA CANYON RECYCLED WATER DEMANDS
Use Area Acres Water Use
Factor, ac-ft/ac/yr
Annual Demand,
ac-ft
Landscape/OS/Park 30.4 1.6 48.6 Bank Protection 22.3 1.5 33.5 Dual-plumbed 15.1 3.33 50.3
TOTAL 132.4

natalie
Typewritten Text
FIGURE 4-1

DEXTER WILSON ENGINEERING, INC. PAGE 4-4
Table 4-3 provides the project’s water percentages of interior and exterior use for each land use type and whether the demand is anticipated to be met with potable or recycled (non-potable) water. Table 4-4 then summarizes project’s potable water delivery of 180,001 gpd and recycled water delivery of 117,922 gpd. The demands and deliveries provided in Tables 4-3 and 4-4 are based on average water demands.
TABLE 4-3 VISTA CANYON WATER DEMANDS
Land Use Total
Demand, ac-ft/yr
Total Demand
, gpd
Interior Potable Demand
Exterior Potable Demand
Interior Recycled Demand
Exterior Recycled Demand
% ac-ft/yr gpd % ac-
ft/yr gpd % ac-ft/yr gpd % ac-
ft/yr gpd
Res-SF 29.0 25,903 60 17.4 15,542 40 11.6 10,361 0 0.0 0 0 0.0 0 Res-MF 106.3 94,942 100 106.3 94,942 0 0.0 0 0 0.0 0 0 0.0 0 Commercial 23.6 21,035 57 66.3 59,155 0 0.0 0 43 50.0 44,626 0 0.0 0 Landscape/OS/Park
48.6 43,430 0 0.0 0 0 0.0 0 0 0.0 0 100 48.6 43,430 Bank Protection 33.5 29,867 0 0.0 0 0 0.0 0 0 0.0 0 100 33.5 29,867 TOTAL 333.7 297,922 190.0 169,639 11.6 10,361 50.0 44,626 82.1 73,296
TABLE 4-4 VISTA CANYON WATER DELIVERIES
Land Use
Potable Deliveries
Recycled Water Deliveries
ac-ft/yr gpd ac-
ft/yr gpd
Res-SF 29.0 25,903 0.0 0 Res-MF 106.3 94,942 0.0 0 Commercial 66.3 59,155 50.0 44,626 Landscape/OS/Park 0.0 0 48.6 43,430 Bank Protection 0.0 0 33.5 29,867 TOTAL 201.6 180,001
132.1 117,922

DEXTER WILSON ENGINEERING, INC. PAGE 4-5
EXCESS RECYCLED WATER In comparing the proposed treatment plant capacity of 395,411 gpd (442.9 afy) and the project’s recycled water demand of 117,922 gpd (132.1 afy), there is anticipated to be an average recycled water excess of 277,489 gpd (310.8 afy). This excess is far greater than the project’s total potable water demand of 180,001 gpd (201.6 afy), resulting in no net increase in water demand for the Vista Canyon project to CLWA and its Santa Clarita Water Division. To compare how season influences impact the excess of recycled water, Table 4-5 provides a month-by-month analysis illustrating that excess recycled water is available from the proposed water factory ranging from 6.6 million gallons (MG) in summer months to 10.4 MG in winter months for an annual total of 310.6 ac-ft (101.2 MG) of excess recycled water. Three options have been identified to address this excess recycled water.
TABLE 4-5 MONTHLY RECYCLED WATER DEMANDS AND DELIVERIES
Key Average Demands Landscape RW Demand 73,296 gpd Dual-plumbed RW Demand 44,626 gpd RW Available 395,411 gpd
Month Days per
Month
% of Avg
Demand
Landscape RW
Demand, MG
Dual-plumbed
RW Demand,
MG
RW Available,
MG
Excess RW, MG
January 31 22 0.5 1.4 12.3 10.4 February 28 70 1.4 1.2 11.1 8.4 March 31 78 1.8 1.4 12.3 9.1 April 30 61 1.3 1.3 11.9 9.2 May 31 90 2.0 1.4 12.3 8.8 June 30 122 2.7 1.3 11.9 7.8 July 31 169 3.8 1.4 12.3 7.0 August 31 187 4.3 1.4 12.3 6.6 September 30 139 3.1 1.3 11.9 7.5 October 31 143 3.2 1.4 12.3 7.6 November 30 66 1.5 1.3 11.9 9.1 December 31 53 1.2 1.4 12.3 9.7 Annual Total, MG 26.8 16.3 144.3 101.2 Annual Total, ac-ft 82.3 50.0 442.9 310.6

DEXTER WILSON ENGINEERING, INC. PAGE 4-6
Castaic Lake Water Agency
The excess recycled water from the Vista Canyon water factory could be sold to CLWA as a supply to its recycled water system to offset existing CLWA potable water demands. CLWA is currently expanding its recycled water facilities in the Santa Clarita Valley. CLWA would utilize the excess water generated by the Vista Canyon water factory. The Vista Canyon project, and water factory, is included in CLWA’s Preliminary Design Report for these facilities, known as Phase 2B.
Percolation Ponds
If no direct recycled water use can be identified for the excess recycled water, the excess recycled water from the Vista Canyon water factory could be discharged to percolation ponds.
Water Factory Flow
Also to be considered is the off-site wastewater flow diverted to the Vista Canyon water factory from the sewer mainline adjacent to the project (discussed in Chapter 2). The off-site sewage flow diverted to the water factory could be reduced so that no excess recycled water is generated.

DEXTER WILSON ENGINEERING, INC. PAGE 5-1
CHAPTER 5
JURISDICTIONAL CONSIDERATIONS The Vista Canyon project is currently within the service area of CLWA’s Santa Clarita Water Division. It is outside of the Santa Clarita Valley Sanitation District. The project would be annexed into both the City of Santa Clarita and the Santa Clarita Valley Sanitation District.
SEWER The Vista Canyon project would annex into the City of Santa Clarita, which would be the sewer service provider for the project. The project also would annex into the Santa Clarita Valley Sanitation District and pay fees for the discharge of solids into its system. Based on a treatment capacity of 395,411 gpd, the estimated flow, COD, and SS discharged to the sewer system from the water factory is estimated to be 36,218 gpd, 524 lbs/day, and 686 lbs/day, respectively.
City of Santa Clarita
The City of Santa Clarita currently owns portions of the conveyance system within its boundaries. The larger lines are owned by the Santa Clarita Valley Sanitation District. The City also contracts for maintenance of its lines with the County of Los Angeles. It is anticipated that the entire sewer system in the Vista Canyon project would be owned by the City. The City would contract with the County of Los Angeles for the operation and maintenance of the sewer system. The City would consider private contract operators for the water factory.
Santa Clarita Valley Sanitation District
The Vista Canyon water factory would discharge solids to the conveyance system for treatment at a downstream facility. The downstream facilities are operated by the Santa Clarita Valley Sanitation District. In order to provide for collection of fees and treatment of solids, the project area would annex into the Santa Clarita Valley Sanitation District and an agreement would be reached between the applicant and the Santa Clarita Valley Sanitation District for charges for treatment of solids from the water factory.

DEXTER WILSON ENGINEERING, INC. PAGE 5-2
RECYCLED WATER Recycled water produced at the water factory would be utilized by CLWA and incorporated into its recycled water program for the Santa Clarita Valley. This water would be used on-site and off-site for irrigation and other uses as approved by the State Department of Public Health. The City would enter into a contract with CLWA for the sale of recycled water.

DEXTER WILSON ENGINEERING, INC. PAGE 6-1
CHAPTER 6
REGULATORY REQUIREMENTS A number of permitting agencies will need to review and permit elements of the recycled water system for the Vista Canyon water factory. The reviewing agencies would be the Los Angeles Regional Water Quality Control Board (RWQCB), the State Department of Public Health, and the County Department.
LOS ANGELES REGIONAL WATER QUALITY CONTROL BOARD The water factory would need a waste discharge permit for the discharge to the percolation ponds. The plant would be located within Reach 8 of the Santa Clara River for groundwater (Santa Clara-Mint Canyon) and Reach 7 for surface water (Lang gaging station to Bouquet Canyon Road Bridge). The RWQCB also would issue the permit for the production of the recycled water. The recycled water purveyor’s permit would be issued under section 13260 of the Water Code related to water recycling requirements or under Section 13523.1 of the Water Code as a master reclamation permit.
STATE DEPARTMENT OF PUBLIC HEALTH
The effluent from the water factory would need to meet the requirements of California Code of Regulations, Title 22, for unrestricted reuse. Some onsite testing of the disinfection system would likely be needed prior to distribution and use of the recycled water.
COUNTY DEPARTMENT OF PUBLIC HEALTH The recycled water piping and distribution system would need approval from the County Department of Public Health.

DEXTER WILSON ENGINEERING, INC. PAGE 6-2
OTHER AGENCIES The South Coast Air Pollution Control District would need to issue a permit for the emergency diesel generator. A permit also would be needed for various chemicals used in conjunction with the treatment process.
WATER QUALITY
The following paragraphs provide a brief description of water quality related to the water factory. Analysis related to the potential water quality impacts from the water factory is included in the Vista Canyon Water Quality Technical Report (Geosyntec, 2010).
Potable Water Quality
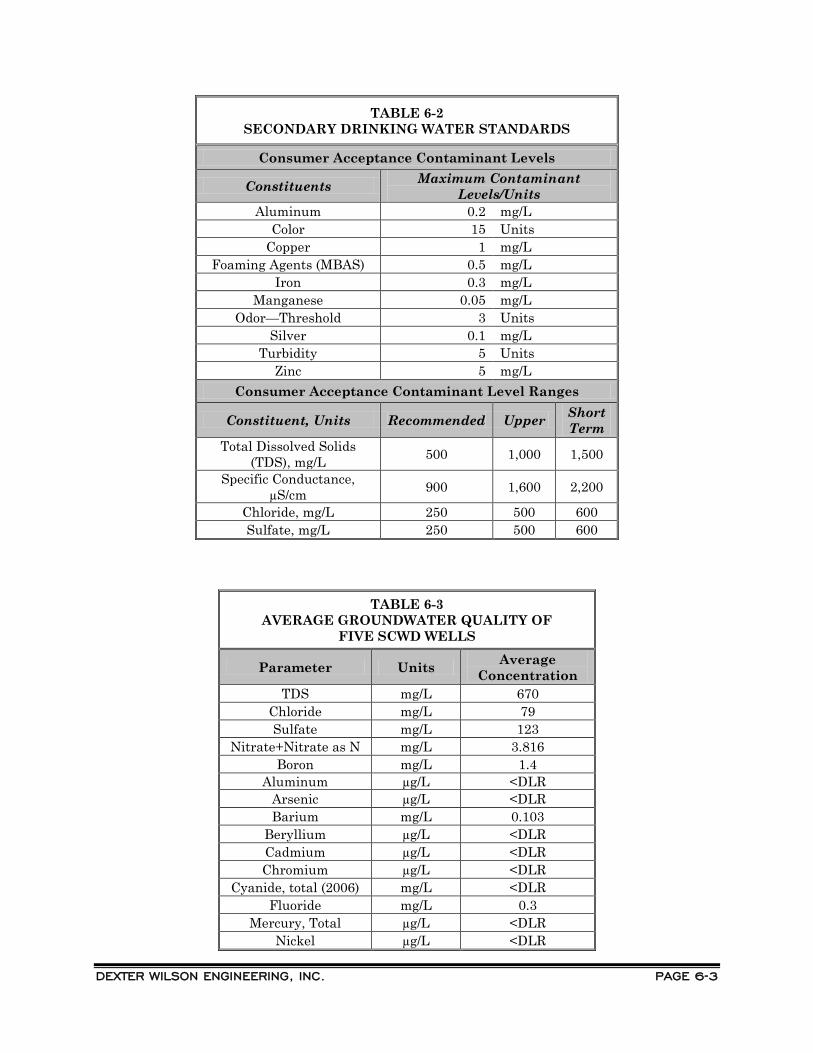
Potable water to the Vista Canyon project would be provided by the Santa Clarita Water Division of CLWA (SCWD). Tables 6-1 and 6-2 provide some of the State Department of Public Health primary and secondary maximum contaminant levels (MCLs) for drinking water. Table 6-3 provides average water quality data for five CLWA groundwater wells in the area. Figure 6-1 shows the location of these wells.
TABLE 6-1 PRIMARY DRINKING WATER STANDARD
MAXIMUM CONTAMINANT LEVELS (MCLs)
Parameter MCL, mg/L
Aluminum 1 Arsenic 0.01 Barium 1
Beryllium 0.004 Cadmium 0.005 Chromium 0.05
Cyanide 0.15 Fluoride 2 Mercury 0.002 Nickel 0.1
Nitrate (as NO3 45 ) Nitrate+Nitrite
(NO3-N + NO210 -N)
Nitrite (as nitrogen) 1 Selenium 0.05 Thallium 0.002
DEXTER WILSON ENGINEERING, INC. PAGE 6-3
TABLE 6-2 SECONDARY DRINKING WATER STANDARDS
Consumer Acceptance Contaminant Levels
Constituents Maximum Contaminant Levels/Units
Aluminum 0.2 mg/L Color 15 Units
Copper 1 mg/L Foaming Agents (MBAS) 0.5 mg/L
Iron 0.3 mg/L Manganese 0.05 mg/L
Odor—Threshold 3 Units Silver 0.1 mg/L
Turbidity 5 Units Zinc 5 mg/L
Consumer Acceptance Contaminant Level Ranges
Constituent, Units Recommended Upper Short Term
Total Dissolved Solids (TDS), mg/L 500 1,000 1,500
Specific Conductance, µS/cm 900 1,600 2,200
Chloride, mg/L 250 500 600 Sulfate, mg/L 250 500 600
TABLE 6-3 AVERAGE GROUNDWATER QUALITY OF
FIVE SCWD WELLS
Parameter Units Average Concentration
TDS mg/L 670 Chloride mg/L 79 Sulfate mg/L 123
Nitrate+Nitrate as N mg/L 3.816 Boron mg/L 1.4
Aluminum µg/L <DLR Arsenic µg/L <DLR Barium mg/L 0.103
Beryllium µg/L <DLR Cadmium µg/L <DLR Chromium µg/L <DLR
Cyanide, total (2006) mg/L <DLR Fluoride mg/L 0.3
Mercury, Total µg/L <DLR Nickel µg/L <DLR

DEXTER WILSON ENGINEERING, INC. PAGE 6-4
TABLE 6-3 AVERAGE GROUNDWATER QUALITY OF
FIVE SCWD WELLS
Parameter Units Average Concentration
Nitrate as NO3 mg/L 17 Nitrite as N mg/L <DLR
Selenium µg/L <DLR Thallium µg/L <DLR
Color Color unit <5 Copper µg/L <DLR MBAS mg/L <0.050 Iron mg/L <DLR
Manganese µg/L <DLR Odor TON 1 Silver µg/L <DLR
Turbidity NTU 0.07 Zinc µg/L <DLR
Specific Conductance µmhos/cm 1059 Alkalinity as CacO3 mg/L 289 Hardness as CaCO3 mg/L 391
Volatile Organic Chemicals (VOCs) µg/L ND
Synthetic Organic Chemicals (SVOCs) µg/L Waived
n/a = not analyzed ND = none detected <DLR = Less than detection limit for purposes of reporting
Water Factory Effluent Quality
The recycled water quality effluent from the Vista Canyon water factory has been estimated based on the potable water quality, the addition of constituents based on a typical use cycle, and typical constituent removals from the proposed treatment processes. Table 6-4 provides an estimate of constituent quantities added as the result of using the potable water. Table 6-5 then provides the anticipated recycled water effluent quality. As indicated above, analysis related to potential impacts on water quality from the Vista Canyon water factory is found in the Vista Canyon Water Quality Technical Report (Geosyntec, 2010).

DEXTER WILSON ENGINEERING, INC. PAGE 6-5
TABLE 6-4 CONSTITUENT ADDITION
FROM A USE CYCLE
Parameter Estimated Addition,
mg/L TDS 265
Chloride * 37 Sulfate 23 Boron 0.15
Aluminum 0.15 Fluoride 0.3
Manganese 0.3 Source – Asano, 2007 * Source – SCVJSS Chloride Report, October 2002
TABLE 6-5 VISTA CANYON WATER FACTORY
EFFLUENT QUALITY
Parameter Estimated
Concentration, mg/L
TDS 935 Chloride 116 Sulfate 146
NO3-N + NO2 <10 -N Boron 1.415
Aluminum <1 Fluoride 1.3
Manganese 0.3 Recycled water effluent quality limits generated under water reclamation requirements in place for LACSD’s Valencia Water Reclamation Plant are provided in Table 6-6. For comparison, the Water Quality Control Plan for the Los Angeles Region (Basin Plan) water quality objectives for groundwater in Reach 8 are provided in Table 6-7.

DEXTER WILSON ENGINEERING, INC. PAGE 6-6
TABLE 6-6 VALENCIA WATER RECLAMATION PLANT
RECYCLED WATER LIMITS
Parameter Limit, mg/L
TDS 1000 Chloride, Cl 300 Sulfate, SO 450 4
NO3-N + NO2 10 -N B 1.0
Source: RWQCB Order No. 87-48, Water Reclamation Requirements
TABLE 6-7 GROUNDWATER WATER QUALITY OBJECTIVES FOR
THE EASTERN SANTA CLARA BASIN (SANTA CLARA-MINT CANYON)
Parameter Objective, mg/L
TDS 800 Chloride, Cl 150 Sulfate, SO 150 4
NO3-N + NO2 10 -N B 1.0
DWR Basin No. 4-4.07
Emerging Contaminants
Emerging contaminants is the term used to collectively address chemicals and microorganisms that have only recently been identified in water and are under consideration to be regulated. Chemicals identified as emerging contaminants include the broad classes of endocrine disrupting compounds, EDCs, (originating in pharmaceuticals, personal care products, fertilizers, etc.) and pharmaceutically active compounds (PhACs) such as antibiotics, anti-inflammatory, X-ray contrast media, and antidepressants. (Asano et.al., 2007) Of the broad category of emerging contaminants, the California Department of Public Health presently regulates methyl tertiary-butyl ether (MTBE) and perchlorate. Perchlorate is regulated as a primary drinking water standard with an MCL of 0.006 mg/L, while MTBE has a secondary MCL of 0.005 mg/L. As required by the SWRCB Recycled Water Policy, the SWRCB is convening an advisory panel to provide recommendations on emerging contaminant monitoring.

DEXTER WILSON ENGINEERING, INC. PAGE 7-1
CHAPTER 7
PRELIMINARY USER FEE AND FISCAL ANALYSIS This chapter presents a fiscal analysis of the Vista Canyon water factory to assist with the establishment of user fees. Operation and maintenance costs, replacement costs, and occupancy schedules are provided to give an overall fiscal analysis of the water factory. Final rate analysis and developer fees, including cost sharing agreements, would be based on detailed financing studies to be conducted as part of the facilities planning and feasibility studies.
COSTS Table 7-1 provides an estimate of the yearly cost to operate the Vista Canyon water factory. The yearly operational costs are estimated to be $651,000. This includes operating expenses of $349,000 and capital reserve contribution of $175,000 per year. The remaining $127,000 is the solids treatment cost for the discharge to Santa Clarita Valley Sanitation District sewer.
REVENUE Yearly fees were estimated to be $351 per year per equivalent dwelling unit (EDU) and the recycled water produced was valued at $263 per acre foot (consistent with CLWA wholesale water rate). An increase in operational costs would constitute an increase in user fees.

DEXTER WILSON ENGINEERING, INC. PAGE 7-2
TABLE 7-1 VISTA CANYON WATER FACTORY
CONNECTION FEE ANALYSIS Year of Operation Total 2012 2013 2014 2015 2016 2017 2018 2019
Vista Canyon EDUs Connected Residential EDUs 709 90 90 90 90 90 90 90 79 Other EDUs 812 10 10 111 111 111 111 111 237
Total EDUs 1,521 100 100 201 201 201 201 201 316 Cumulative VC EDUs 100 200 401 602 803 1,004 1,205 1,521
Water Factory Flow Rate, mgd 0.395 0.395 0.395 0.395 0.395 0.395 0.395 0.395 Flow from VC, mgd 0.026 0.052 0.104 0.157 0.209 0.261 0.313 0.395
% of flow from VC 7 13 26 40 53 66 79 100 Flow from Off-site, mgd 0.369 0.343 0.291 0.239 0.187 0.134 0.082 0.000
% of flow from off-site 93 87 74 60 47 34 21 - Expenses (thousand of dollars) Operation and Maintenance $ 349 $ 349 $ 349 $ 349 $ 349 $ 349 $ 349 $ 349 Capital Reserve $ 175 $ 175 $ 175 $ 175 $ 175 $ 175 $ 175 $ 175 Solids to LACSD 1 $ 127 $ 127 $ 127 $ 127 $ 127 $ 127 $ 127 $ 127 Total Expenses $ 651 $ 651 $ 651 $ 651 $ 651 $ 651 $ 651 $ 651 Revenue (in thousands of dollars) Vista Canyon Cost per EDU = 351 $ 35 $ 70 $ 141 $ 212 $ 282 $ 353 $ 424 $ 535 Others $ 499 $ 464 $ 394 $ 323 $ 252 $ 182 $ 111 $ - RW Sales 2 $ 116 $ 116 $ 116 $ 116 $ 116 $ 116 $ 116 $ 116 Total Revenue $ 651 $ 651 $ 651 $ 651 $ 651 $ 651 $ 651 $ 651 1 $199.08 per year, X=0.2798 (Flow portion), Y=0.3239 (COD portion), Z=0.3963 (SS portion) 2 Water Factory flow @ $263 per ac-ft (CLWA wholesale water rate)

APPENDIX A
SCVSD SERVICE CHARGE RATE AND MEAN LOADINGS ORDINANCE


APPENDIX B
DETAILED PROJECT WATER DEMAND CALCULATIONS

The water duty factors for the residential and commercial development presented in this appendix are based on actual water use provided by Valencia Water Company (VWC) and the Santa Clarita Water Division (SCWD) for uses and product type similar to the Vista Canyon uses and product type. The landscape water duty factor is based on the Conceptual Landscape Plan for the project (Appendix C). The bank protection water duty factor is based on a conceptual vegetation plan.
TABLE B-1 VISTA CANYON WATER DUTY FACTORS AND DEMANDS
Land Use Acreage Units
or Square Footage
Water Duty Factor Total
Demand, ac-ft/yr
Total Demand,
gpd
Res-SF 7.7 96 270 gpd/unit 29.0 25,903 Res-MF 28.1 1,021 See Tbl.B-2 af/ac/yr 106.3 94,942 Hotel/Theater 1.7 171,000 0.107 gpd/sf 20.5 18,296 Office/Commercial 7.9 412,000 0.051 gpd/sf 23.6 21,035 Retail and Office 5.5 367,000 13.1 af/ac/yr 72.2 64,450 Landscape/OS/Park 30.4 - 1.6 af/ac/yr 48.6 43,430 Bank Protection 22.3 - 1.5 af/ac/yr 33.5 29,867 Santa Clara River 55.0 - 0 - - Hardscape 26.7 - 0 - -
TOTAL 185.3 1,117 units 333.7 297,922 950,000 sf
TABLE B-2 MULTI-FAMILY RESIDENTIAL WATER DUTY FACTORS
FOR VARYING PRODUCTS
Land Use Acreage Water Duty
Factor
Demand, ac-ft/yr
Demand, gpd
Multi Family, PA1 and PA2 12.4 4.9 af/ac/yr 60.6 54,120 Multi Family, PA3 55-63 11.7 3.4 af/ac/yr 39.3 35,060 Multi Family, PA3 71-72 4.0 1.6 af/ac/yr 6.5 5,762 Total 28.1 106.3 94,942

APPENDIX C
LANDSCAPE IRRIGATION INFORMATION

Jan Feb Mar Apr May Jun Jul Aug Sep Oct Nov Dec TOTAL2.81 2.83 4.14 5.62 6.02 6.81 7.64 7.75 5.83 5.19 3.67 3.19 61.53.52 4.80 3.13 0.88 0.28 0.06 0.03 0.05 0.15 0.88 1.29 2.49 17.64
0.88 1.20 0.78 0.22 0.07 0.02 0.01 0.01 0.04 0.22 0.32 0.62 4.411.93 1.63 3.36 5.40 5.95 6.80 7.63 7.74 5.79 4.97 3.35 2.57 57.09
Water Irrigation Plant Square Use Efficiency Coefficient Footage
High 0.65 0.7 135,800 174,998.1 147,796.4 304,433.3 489,632.1 539,502.1 616,120.4 692,058.7 701,579.4 525,221.1 450,642.9 303,526.6 232,801.9 5,178,313.1Medium 0.85 0.4 423,000 238,193.8 201,168.8 414,370.8 666,448.9 734,328.0 838,614.9 941,976.2 954,934.9 714,889.9 613,379.9 413,136.6 316,871.8 7,048,314.6Low 0.85 0.1 760,000 106,990.1 90,359.5 186,124.0 299,350.6 329,840.0 376,682.8 423,109.9 428,930.6 321,108.9 275,513.4 185,569.6 142,330.1 3,165,909.6
TOTAL 1,318,800 520,182.1 439,324.7 904,928.1 1,455,431.7 1,603,670.1 1,831,418.2 2,057,144.8 2,085,444.9 1,561,220.0 1,339,536.2 902,232.9 692,003.8 15,392,537.3
Equation: EWU=(Net ETo)x(Plant Factor)x(Hydrozone Sq. Ft.)x(.62)Irrigation Efficiency
Calculation Note:
All figures were taken from the local CIMIS Santa Clarita station.
The required gallons per month was derived by subtracting the effective monthly rainfall from the monthly ET which results in the plant water demand per month or the net ET. Note, the inconsistancy of rainfall was taken into account by taking 25% of the average monthly rainfall to get a 'consistant' or usable rainfall figure. This is the effective rainfall. The efficiency of the irrigation system, plant water needs and square footage of the site were taken into account with an end result of the monthly water demand per water use (high, medium and low).
Monthly ETo (inches)Average Rainfall (inches)
ESTIMATED WATER USE (gallons/month)
Effective Rainfall (25%)Net ET
natalie
Stamp

APPENDIX D
INTERIOR RECYCLED WATER DEMAND CALCULATION