ENGINEERING OPTIONS AS TOOLS FOR SALINITY …€¦ · ENGINEERING OPTIONS AS TOOLS FOR SALINITY...
50
ENGINEERING OPTIONS AS TOOLS FOR SALINITY MANAGEMENT IN THE SPENCER GULLY CATCHMENT
Transcript of ENGINEERING OPTIONS AS TOOLS FOR SALINITY …€¦ · ENGINEERING OPTIONS AS TOOLS FOR SALINITY...

ENGINEERING OPTIONS ASTOOLS FOR SALINITY MANAGEMENTIN THE SPENCER GULLY CATCHMENT


Salinity and Land Use Impacts Series Engineering options in the Spencer Gully catchment SLUI 5
i
ENGINEERING OPTIONS AS TOOLS FOR SALINITYMANAGEMENT IN THE SPENCER GULLY CATCHMENT
ByS. Dogramaci1, G. W. Mauger1 and R. George2
Resource Science Division1 & Agriculture Resource Management Program2
Water and Rivers Commission1 & Department of Agriculture2
WATER AND RIVERS COMMISSION
SALINITY AND LAND USE IMPACTS SERIES
REPORT NO. SLUI 5
OCTOBER 2002

Engineering options in the Spencer Gully catchment SLUI 5 Salinity and Land Use Impacts Series
ii
Acknowledgments
The authors wish to thank Alex Waterhouse for her assistance in editing this report.
For more information contact:
Dr Shawan Dogramaci
Resource Science Division
Hyatt Centre 3 Plain Street East Perth Western Australia 6004Address line 3
Telephone 08 9278 0474
Facsimile 08 9278 0586
Recommended Reference
The recommended reference for this publication is: DOGRAMACI, S., MAUGER, G. W., and GEORGE, R., 2002,Engineering options as tools for salinity management in the Spencer Gully catchment, Western Australia Water andRivers Commission, Salinity and Land Use Impact Series Report No. SLUI 5.
We welcome your feedbackA publication feedback form can be found at the back of this publication,or online at www.wrc.wa.gov.au/public/feedback/
ISBN 1-920687-79-3ISSN 1447-7394
October, 2002
Cover photograph:
Modified drainage line in Spencer Gully by
Tim Sparks
Salinity and Land Use Impacts Series Engineering options in the Spencer Gully catchment SLUI 5
iii
Contents
Acknowledgments.......................................................................................................ii
Executive Summary................................................................................................... 1
1 Introduction ............................................................................................................ 31.1 Background and objectives .................................................................................................... 31.2 Salinity risk assessment......................................................................................................... 41.3 Location and climate.............................................................................................................. 61.4 Topography and drainage...................................................................................................... 61.5 Geological setting .................................................................................................................. 71.6 Aeromagnetic surveys ........................................................................................................... 8
2 Desktop study and prediction of potential salinisation......................................... 102.1 Criteria for mapping salinity risk area .................................................................................. 102.2 Salinity risk map.................................................................................................................. 11
3 Hydrogeology and groundwater flow ................................................................... 12
4 Salinity of surface water and salt equilibrium ...................................................... 15
5 Numerical modelling (MODFLOW)...................................................................... 175.1 Steady State Model (MODFLOW)........................................................................................ 175.2 Calibration and results of steady state model (MODFLOW)................................................. 185.3 Numerical Modelling (MAGIC) ............................................................................................. 215.4 Effect of dykes and faults on groundwater flow .................................................................... 215.5 Transient Model (MODFLOW) ............................................................................................. 23
5.5.1 Groundwater discharge (drains).......................................................................................................245.5.2 Drains and relief bores .....................................................................................................................265.5.3 Groundwater discharge via abstraction bores..................................................................................285.5.4 Combination of drains and abstraction bores...................................................................................30
6 The influence of recharge rates on the shallow watertable ................................. 32
7 Conclusions ......................................................................................................... 35
References and Recommended Reading ............................................................... 37
FiguresFigure 1. The Spencer Gully catchment and drainage system ..................................................... 6Figure 2. Catchment topography and main drainage ................................................................... 7Figure 3. Geological map (after Wilde and Walker, 1982.) ........................................................... 9
Engineering options in the Spencer Gully catchment SLUI 5 Salinity and Land Use Impacts Series
iv
Figure 4. The potential extent of saline area at steady state —approximately 24% of thecatchment .................................................................................................................. 11
Figure 5. East–west cross section of the catchment showing the main hydrogeological units:saprock (grey), overlying weathered profile (blue) and surficial deposits (white). Thesaprock is the main water-bearing formation. ............................................................. 13
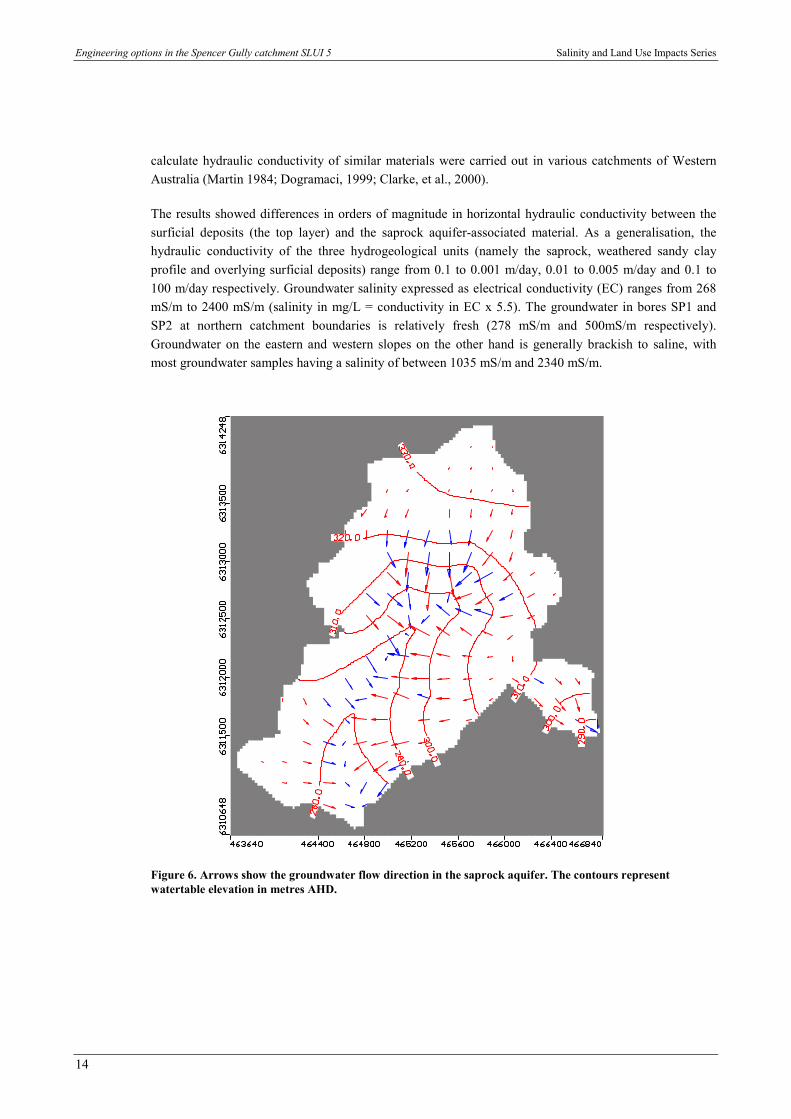
Figure 6. Arrows show the groundwater flow direction in the saprock aquifer. The contoursrepresent watertable elevation in metres AHD............................................................ 14
Figure 7. Flow rate and electrical conductivity of the surface water discharging from thecatchment. The dashed line represents base flow calculated from the hydrograph. ... 15
Figure 8. Correlation of simulated heads vs observed heads in metres above AHD. The 95%confidence interval is represented by the two parallel dashed lines............................ 19
Figure 9. Groundwater modelling results. .................................................................................. 20Figure 10. Comparing areas of discharge simulated by MODFLOW and MAGIC....................... 22Figure 11. Shallow watertable before (dotted area) and after incorporating (heavy black outline)
dykes and faults. ........................................................................................................ 23Figure 12. Watertable rises in four bores. .................................................................................. 24Figure 13. (A) Groundwater discharge to the main drainage (B) Relatively lower watertable in the
drains and the low-lying areas adjacent to drains. ...................................................... 25Figure 14. Shallow watertable before drains (white) and one year after drains installed (dotted).
Drains in red............................................................................................................... 26Figure 15. (A) Before installation of relief bores and (B) after —no change in groundwater head.27Figure 16. Dotted area shows the shallow watertable 1 year after 15 relief bores (open circles)
are installed................................................................................................................ 28Figure 17. Abstraction bores (filled circles) in the drains. ........................................................... 29Figure 18 A, B & C. The impact of an abstraction bore on lowering watertable at 70, 365, 7500
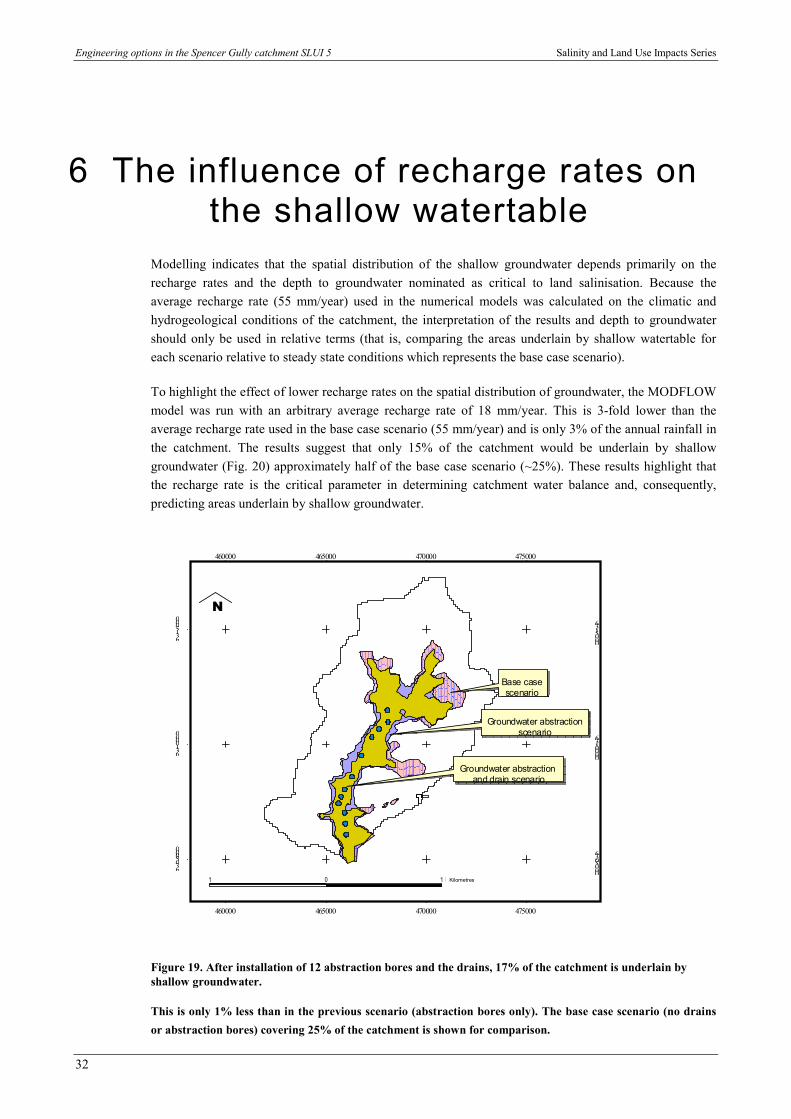
days ........................................................................................................................... 30Figure 19. After installation of 12 abstraction bores and the drains, 17% of the catchment is
underlain by shallow groundwater. ............................................................................. 32Figure 20. Approximately 15% of the catchment is underlain by shallow groundwater when using
an average recharge rate of 18 mm/year.................................................................... 33Figure 21. The area underlain by 2 m deep watertable drops from 25% to 17% of the catchment
after installation of the drains...................................................................................... 34
TablesTable 1. Borehole construction, watertable levels and salinity.................................................... 13Table 2. comparison of modelled engineering options .............................................................. 31
Salinity and Land Use Impacts Series Engineering options in the Spencer Gully catchment SLUI 5
1
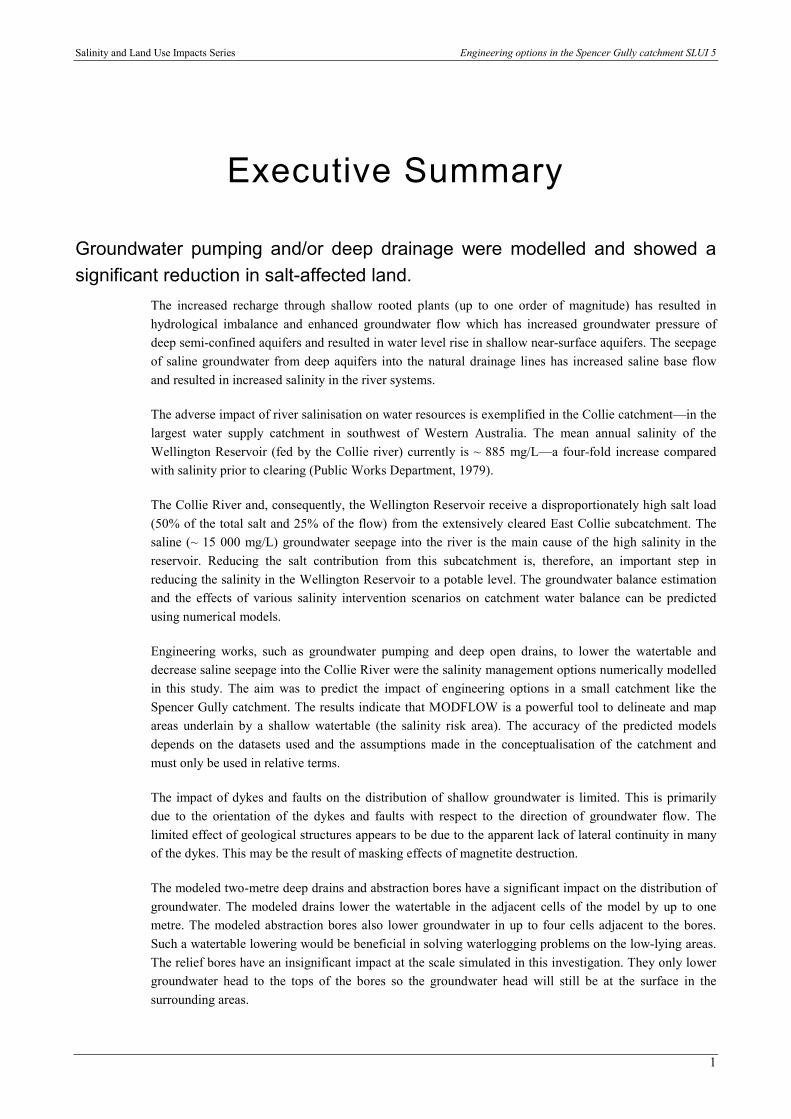
Executive Summary
Groundwater pumping and/or deep drainage were modelled and showed asignificant reduction in salt-affected land.
The increased recharge through shallow rooted plants (up to one order of magnitude) has resulted inhydrological imbalance and enhanced groundwater flow which has increased groundwater pressure ofdeep semi-confined aquifers and resulted in water level rise in shallow near-surface aquifers. The seepageof saline groundwater from deep aquifers into the natural drainage lines has increased saline base flowand resulted in increased salinity in the river systems.
The adverse impact of river salinisation on water resources is exemplified in the Collie catchment—in thelargest water supply catchment in southwest of Western Australia. The mean annual salinity of theWellington Reservoir (fed by the Collie river) currently is ~ 885 mg/L—a four-fold increase comparedwith salinity prior to clearing (Public Works Department, 1979).
The Collie River and, consequently, the Wellington Reservoir receive a disproportionately high salt load(50% of the total salt and 25% of the flow) from the extensively cleared East Collie subcatchment. Thesaline (~ 15 000 mg/L) groundwater seepage into the river is the main cause of the high salinity in thereservoir. Reducing the salt contribution from this subcatchment is, therefore, an important step inreducing the salinity in the Wellington Reservoir to a potable level. The groundwater balance estimationand the effects of various salinity intervention scenarios on catchment water balance can be predictedusing numerical models.
Engineering works, such as groundwater pumping and deep open drains, to lower the watertable anddecrease saline seepage into the Collie River were the salinity management options numerically modelledin this study. The aim was to predict the impact of engineering options in a small catchment like theSpencer Gully catchment. The results indicate that MODFLOW is a powerful tool to delineate and mapareas underlain by a shallow watertable (the salinity risk area). The accuracy of the predicted modelsdepends on the datasets used and the assumptions made in the conceptualisation of the catchment andmust only be used in relative terms.
The impact of dykes and faults on the distribution of shallow groundwater is limited. This is primarilydue to the orientation of the dykes and faults with respect to the direction of groundwater flow. Thelimited effect of geological structures appears to be due to the apparent lack of lateral continuity in manyof the dykes. This may be the result of masking effects of magnetite destruction.
The modeled two-metre deep drains and abstraction bores have a significant impact on the distribution ofgroundwater. The modeled drains lower the watertable in the adjacent cells of the model by up to onemetre. The modeled abstraction bores also lower groundwater in up to four cells adjacent to the bores.Such a watertable lowering would be beneficial in solving waterlogging problems on the low-lying areas.The relief bores have an insignificant impact at the scale simulated in this investigation. They only lowergroundwater head to the tops of the bores so the groundwater head will still be at the surface in thesurrounding areas.

Engineering options in the Spencer Gully catchment SLUI 5 Salinity and Land Use Impacts Series
2
Groundwater-discharge intervention schemes (engineering options) increase the discharge rate and sodrive the catchment to equilibrium faster. Therefore, it is essential, particularly for larger-scalecatchments, to calculate the time required for the catchment to reach equilibrium. If the priority is to gaintime by implementing recharge intervention scenarios, discharge intervention scenarios should beomitted.
Keywords: Collie River, Wellington Reservoir, reforestation, groundwater, surface water, salinity,engineering options, drain, groundwater pumping.
Salinity and Land Use Impacts Series Engineering options in the Spencer Gully catchment SLUI 5
3
1 Introduction
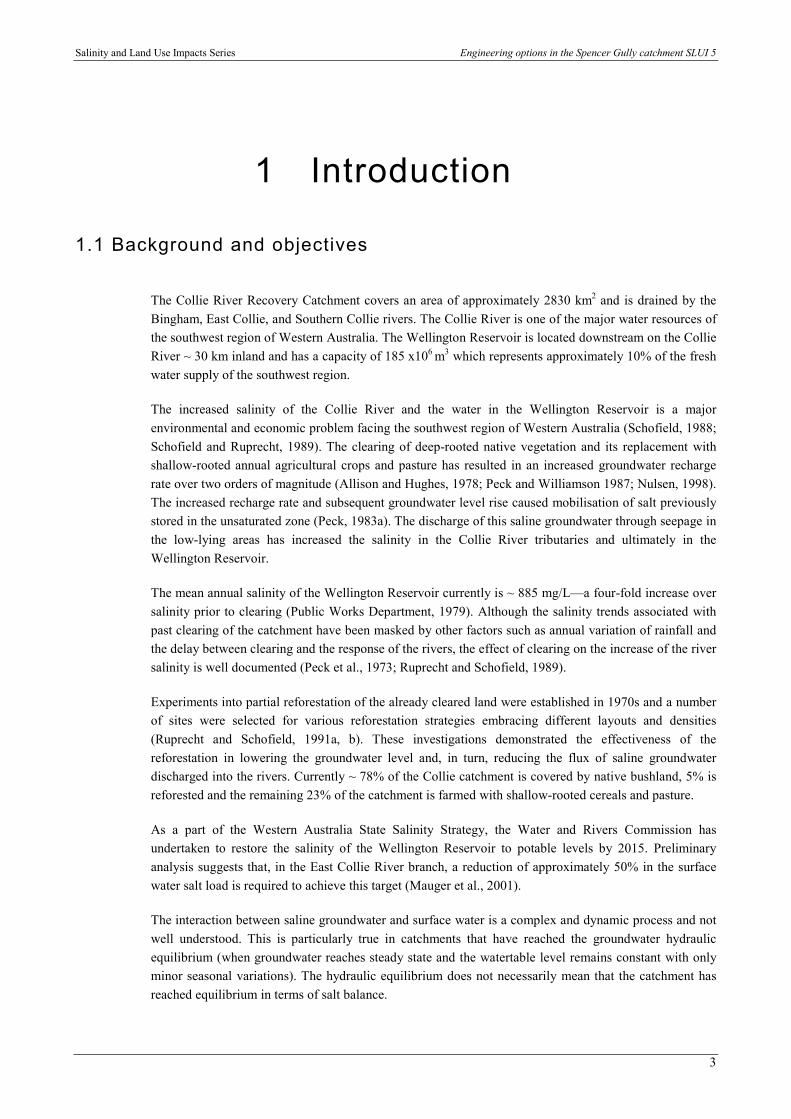
1.1 Background and objectives
The Collie River Recovery Catchment covers an area of approximately 2830 km2 and is drained by theBingham, East Collie, and Southern Collie rivers. The Collie River is one of the major water resources ofthe southwest region of Western Australia. The Wellington Reservoir is located downstream on the CollieRiver ~ 30 km inland and has a capacity of 185 x106 m3 which represents approximately 10% of the freshwater supply of the southwest region.
The increased salinity of the Collie River and the water in the Wellington Reservoir is a majorenvironmental and economic problem facing the southwest region of Western Australia (Schofield, 1988;Schofield and Ruprecht, 1989). The clearing of deep-rooted native vegetation and its replacement withshallow-rooted annual agricultural crops and pasture has resulted in an increased groundwater rechargerate over two orders of magnitude (Allison and Hughes, 1978; Peck and Williamson 1987; Nulsen, 1998).The increased recharge rate and subsequent groundwater level rise caused mobilisation of salt previouslystored in the unsaturated zone (Peck, 1983a). The discharge of this saline groundwater through seepage inthe low-lying areas has increased the salinity in the Collie River tributaries and ultimately in theWellington Reservoir.
The mean annual salinity of the Wellington Reservoir currently is ~ 885 mg/L—a four-fold increase oversalinity prior to clearing (Public Works Department, 1979). Although the salinity trends associated withpast clearing of the catchment have been masked by other factors such as annual variation of rainfall andthe delay between clearing and the response of the rivers, the effect of clearing on the increase of the riversalinity is well documented (Peck et al., 1973; Ruprecht and Schofield, 1989).
Experiments into partial reforestation of the already cleared land were established in 1970s and a numberof sites were selected for various reforestation strategies embracing different layouts and densities(Ruprecht and Schofield, 1991a, b). These investigations demonstrated the effectiveness of thereforestation in lowering the groundwater level and, in turn, reducing the flux of saline groundwaterdischarged into the rivers. Currently ~ 78% of the Collie catchment is covered by native bushland, 5% isreforested and the remaining 23% of the catchment is farmed with shallow-rooted cereals and pasture.
As a part of the Western Australia State Salinity Strategy, the Water and Rivers Commission hasundertaken to restore the salinity of the Wellington Reservoir to potable levels by 2015. Preliminaryanalysis suggests that, in the East Collie River branch, a reduction of approximately 50% in the surfacewater salt load is required to achieve this target (Mauger et al., 2001).
The interaction between saline groundwater and surface water is a complex and dynamic process and notwell understood. This is particularly true in catchments that have reached the groundwater hydraulicequilibrium (when groundwater reaches steady state and the watertable level remains constant with onlyminor seasonal variations). The hydraulic equilibrium does not necessarily mean that the catchment hasreached equilibrium in terms of salt balance.

Engineering options in the Spencer Gully catchment SLUI 5 Salinity and Land Use Impacts Series
4
Managing groundwater discharge areas may or may not contribute to the salt balance of a catchment. Byincreasing the groundwater discharge rates as a salinity management strategy, the watertable may belowered (increasing the productivity of the previously saline land) but the surface water salinity willincrease as a higher salt load is exported from the catchment.
Because increasing groundwater discharge will affect the output component of the water balance of acatchment, numerical models may prove useful tools to examine, quantitatively, the impacts of variousgroundwater discharge schemes (engineering options) on the reduction of surface water salinity.
The Water and Rivers Commission selected the Spencer Gully subcatchment in the Collie Rivercatchment as a demonstration site to identify and understand the extent of saline land and its impact onsurface water salinity. This study attempts to ascertain the appropriate level of site investigation requiredfor implementing salinity management strategies to reduce stream salinity. This process included definingsalinity risk, carrying out a hydrogeological investigation to understand groundwater flow characteristicsand refining the operational use of the groundwater models such as MODFLOW (Michael et al., 1988),and MAGIC (Mauger and Aust., 1996).
The numerical models MODFLOW and MAGIC used in this investigation are groundwater flow modelsthat deal only with the volumetric balance of groundwater. However, understanding the development andevolution of dryland salinity and its effect on surface water salinity requires estimation of catchment saltbalance. Therefore, the average concentrations of groundwater salinity for various components of thewater budget (groundwater, surface water, and rainfall) from the limited datasets were estimated and thenused, in conjunction with the water budget components, to estimate the salt balance of the catchment.
Previous investigations on the ‘Harringtons’ property, to the south–east and adjoining the Spencer Gullycatchment, were carried out to determine whether contour belts of trees could reduce salinity andgroundwater levels. Data from this study were also used to further develop the MODFLOW and MAGICmodels and will be included in the analysis of the current study.
The main objectives of this study were to (i) map the potential distribution of saline areas at steady state(where the watertable is less than 2 metres below the natural surface); (ii) present a conceptual model forthe groundwater flow and hydrogeology of the catchment; (iii) test the usefulness of various datasets (i.e.desk top analysis; hydrogeological investigations which included drilling; airborne geophysical survey;field work and groundwater modelling) in identifying the spatial and temporal distribution of the salineareas; (iv) compare the results of the MODFLOW and MAGIC models in terms of salinity distribution;and (v) test recommended management options such as drains, groundwater pumping and relief bores (i.e.flowing bores) and finally (vi) develop a groundwater model to use for salinity management strategies.
1.2 Salinity risk assessment
The use of various biophysical datasets to measure current saline-affected land in Western Australia hasbeen well documented (George and Dogramaci, 2000; Short and McConnell 2001). These datasets arecharacterised by various degrees of accuracy, depending on the method and scale at which they wereacquired. Regional-scale geological and hydrogeological maps are accurate when used in regional-scalestudies, but their accuracy diminishes proportionally when they are used as the main datasets at smallerscales, such as small subcatchment or farm scale.
Salinity and Land Use Impacts Series Engineering options in the Spencer Gully catchment SLUI 5
5
The objective of early salinity investigations was to determine the extent of dryland salinity at regionalscales using information from geological, soil, topographic and airborne geophysical survey maps (Shortand McConnell, 2001; George and Dogramaci, 2000; Ferdowsian et al., 1996). The accepted error marginin mapping the extent of dryland salinity at regional scales is commonly greater than that acceptable atfarm scale where salinity risk areas must be more accurately delineated. In addition, smaller scaleinvestigations concentrated on the impact of salinity management strategies related to economically orecologically high value assets such as infrastructure in rural towns (Matta, 2000) and wetlands (Georgeand Dogramaci, 2000). Therefore, a combination of regional and local scale datasets is required toincrease the predictive accuracy of the current and potential extent of dryland salinity and assess asaccurately as possible the effects of management options on controlling its spread.
Previous investigations into dryland salinity in the Water Resources Recovery Catchments used variousdefinitions for ‘salinity risk assessment’ (Land Assessment 1999; Hundi and Mauger, 2001; De Silva etal., 2001). Some assumed that the groundwater discharge area at equilibrium was the area at risk fromsalinisation. The groundwater discharge may occur in areas characterised by steep surface gradientsunderlain by relatively fresh groundwater where watertable rises and the eventual discharge ofgroundwater is likely to contribute little salt but relatively large volumes of fresh groundwater to thesurface runoff. On the other hand, fresh groundwater discharge in areas where surface gradients arerelatively low may result in groundwater remaining on the surface for a prolonged period allowingevaporation and the development of saline soils.
The Land Assessment (1999) investigation of the Spencer Gully catchment used soil salinity as adefinition for ‘salinity risk assessment’. The current extent of the saline land referred to as ‘surface soilsalinity’ was mapped using soil-type data, aerial photographs and a field survey where the area wasgridded and 61 surface soil salinity measurements obtained. The study concluded that saline areascurrently make up ~ 5% of the catchment and are located mostly along the main drainage line. The studypredicted that over 17% of the catchment is at risk of salinisation from rising groundwater levels as thecatchment reaches hydraulic equilibrium. Importantly, this method may underestimate the extent ofsalinity when defining a ‘salinity risk area’ as it does not take into account likely saline areas developeddue to groundwater evaporation through capillary action. Capillary action occurs at depths < 2 m belowthe land surface where groundwater moves upward in the unsaturated zone (Freeze and Cherry, 1979).This results in further evaporation of groundwater and the concentration of salts in soils, at or near theland surface. The time for enough salt to accumulate that it has an adverse effect on the vegetation may belengthy, which means that increases in salts stored in this zone are not readily detected and accounted forwhen mapping potential saline risk areas.
This study builds on previous work that used biophysical datasets to investigate the spatial distribution ofexisting and potential saline areas at hydraulic equilibrium. In this report, the salinity risk area is definedas areas where, at steady state condition, the minimum depth to watertable is less than 2 metres below thenatural surface. At this depth, the combined effects of direct evaporation of groundwater, together withevaporation of groundwater due to capillary action, exacerbate the effects of salinisation at the landsurface.
Engineering options in the Spencer Gully catchment SLUI 5 Salinity and Land Use Impacts Series
6
1.3 Location and climate
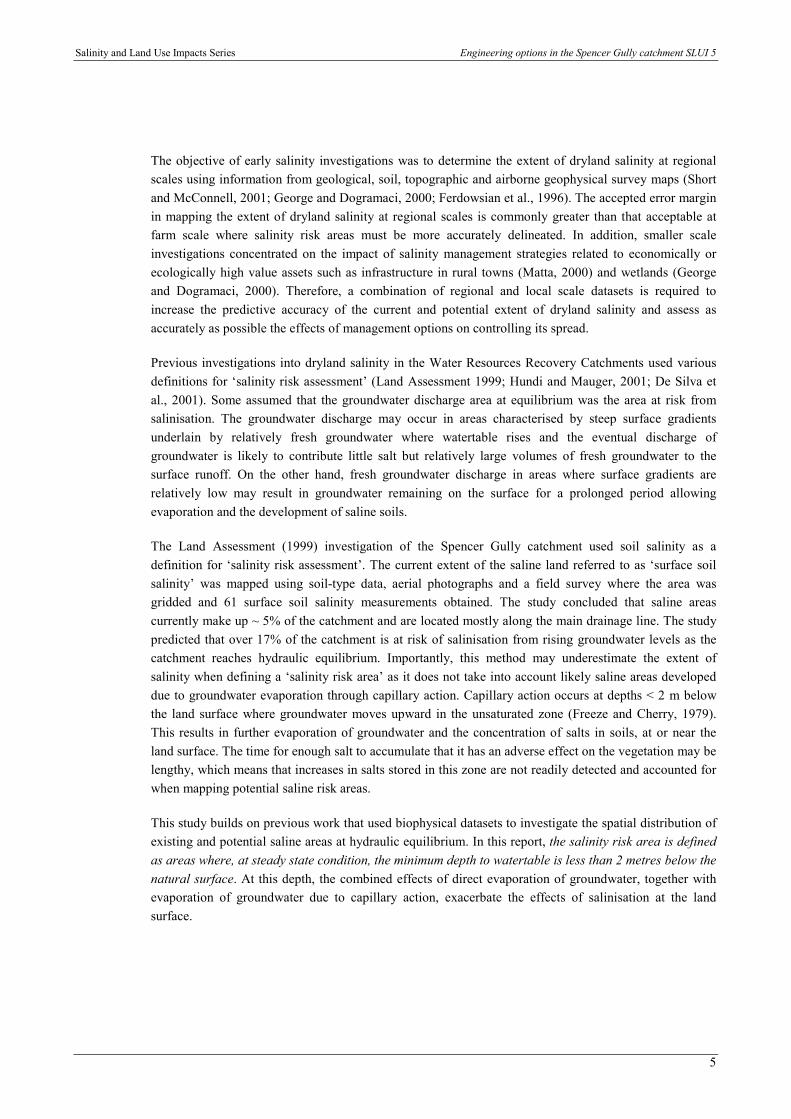
The Spencer Gully catchment is located in the upper reaches of the Collie River catchment, within theEast Collie River subcatchment (James Crossing), ~ 8 km west of Darkan (Fig. 1). The area is about5.4 km2. The land is predominantly cleared and used for sheep grazing with minor areas used forcropping.
Figure 1. The Spencer Gully catchment and drainage system
The climate is Mediterranean with warm, dry summers and cold, wet winters. Mean annual rainfall nearDarkan is 610 mm and the mean maximum and minimum temperatures in January and August for Darkanare 31 ºC, 16 ºC and 14 ºC, 4 ºC respectively.
1.4 Topography and drainage
The land surface of the Spencer Gully catchment displays a variation in relief that may closely resemblethe underlying bedrock topography. Undulating areas of granitic and gneissic outcrops with northerly-trending ridges characterise the catchment. The topography gradually increases in elevation from ~ 270 mabove Australian Height Datum (AHD) in the southern part of the catchment to ~ 370 m AHD in thenorthern and north-western catchment boundary (Fig. 2).

Salinity and Land Use Impacts Series Engineering options in the Spencer Gully catchment SLUI 5
7
330
31034
0300
320
290
350
280
360370
360
350
310
330
330 32
0
340
300
350
1 0 1 Kilometers
N
63150006315
000
63100006310
000
63050006305
000
475000
475000
470000
470000
465000
465000
460000
460000
Figure 2. Catchment topography and main drainage
The drainage system of the catchment comprises the main Spencer Gully creek and a series of tributariesdraining the eastern and western flanks of the catchment. The drainage system has a relatively steepgradient of ~ 5%.
1.5 Geological setting
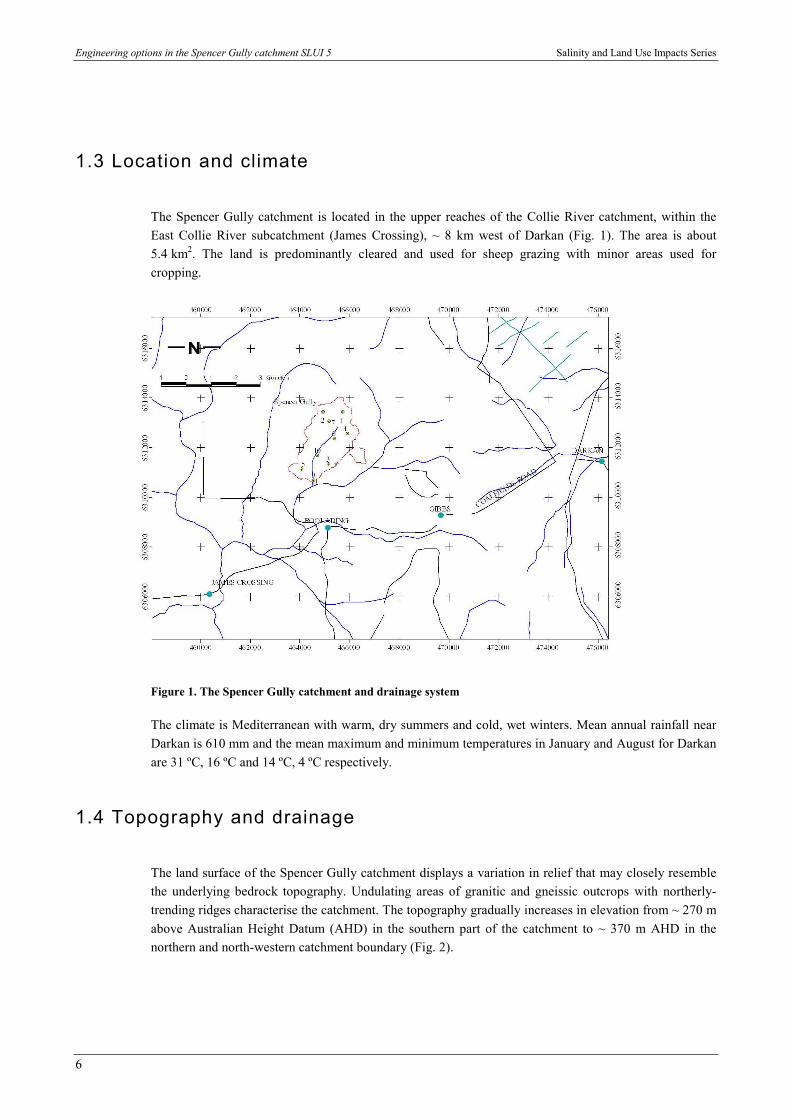
The principal lithology mapped in the Spencer Gully catchment is migmatite of Archaean age which isdescribed by Wilde and Walker (1982) as a strongly contorted, nebulitic and banded metamorphic rock(Fig. 3). This ‘mixed rock’ formed during the comagmatic intrusion of Archaean granitoids; granite,adamellite and quartz monzonite (Wilde and Walker 1982). In terms of fabric, outcrop and drillingobservations reveal both characteristic metamorphic mineralogical ‘banding’ and granitic textures withinthe migmatite (Wilde and Walker, 1982).
Similarities in the migmatite’s mineralogical and fabric character, with respect to the adjacent igneousrocks (its precursors), are supported by a general lack of magnetic variability observed in theaeromagnetic dataset. Conversely, demagnetized fault zones, along with the strong magnetic character ofProterozoic gabbroic and doleritic dykes are clearly delineated in the magnetic data. However, in the case
Kilometres

Engineering options in the Spencer Gully catchment SLUI 5 Salinity and Land Use Impacts Series
8
of mafic dykes, although there is sporadic outcrop within the catchment, the outcrop is too small to begeologically mapped at the scale of 1:250 000 shown in Figure 3. The magnetic characteristics areinterpreted from aeromagnetic survey and described below.
1.6 Aeromagnetic surveys
Aeromagnetic surveys map the variations in the intensity of the Earth’s magnetic field due to magneticsusceptibility variations and/or remnant magnetic variations in the near surface. Rocks regarded as non-magnetic (0.2 to 0.5% magnetite) in hand specimen may produce a substantial aeromagnetic responsewhen they occur in large volume. Conversely, a muted response from lithologies known to containmagnetic material provides information on magnetite destruction and the possible pathways of alterationfluids through weaknesses in the bedrock.
The aeromagnetic data are particularly useful in areas of limited bedrock exposure, such as in the CollieRiver catchment, where deductions can be made on the lateral continuity of variably magnetic lithologiesand structures. In Spencer Gully catchment, the magnetic variability of the Archaean granitoid andmigmatitic basement rocks is minimal apart from a decrease in the magnetic response in the central andsouth-western sections of the catchment. This transition is attributed to a slight compositional changeand/or magnetite destruction due to the passage of alteration fluids through nearby faults. There are anumber of suites of Proterozoic dolerite dykes interpreted from the data and characterised by moderate tostrong magnetic responses, with the variation likely to correspond to a change in mineralogy (Fig. 3). Thedominant trends of these dykes are regional east-west, with a strong east-southeast and a dominantnorthwest phase corresponding to the regional mineral foliation (Wilde and Walker, 1982). This foliationis responsible for curvilinear trends frequently observed in the dykes and is associated withmetamorphism prior to their emplacement (Wilde et al., 1996). The northwest-trending dolerite dykes arecommonly thinner and more laterally extensive than their counterparts, and are particularly pervasive inthe northern section of Spencer Gully where they cut and displace dykes with east-west orientations.
The faults show similar trends to the dolerite dykes, with three major, regional northwest-trendingdemagnetised zones representing major faults with intense magnetite destruction. Faults, along withdolerite dykes, locally control the position of modern drainage lines. However, frequently, thedevelopment of a superimposed drainage system simply reflects the contemporary land surface.
The local trends in the Spencer Gully catchment generally mimic the regional observations. East-west-trending dolerite dykes occur to the north and south of the drilling area are cut and displaced by laterallycontinuous northwest-trending dykes. The disruption of the lateral continuity of many of the doleritedykes is possibly due to factors including: ‘pinching and swelling’ during intrusion; magnetite destructionassociated with geological events including emplacement; cooling; and the passage of alteration fluidsduring episodes of metamorphism and faulting. To the south of the area, northwest-trending dykes aredisplaced by north-east-trending faults. These faults are dominant and are observed, at this scale, toconstrain sections of the main drainage lines. North-west faults are less obvious, with one north-west faultto the south influencing a drainage confluence, and others, not annotated due to the scale of theinterpretation, likely to coincide with the positions of the laterally continuous north-west dykes.
Salinity and Land Use Impacts Series Engineering options in the Spencer Gully catchment SLUI 5
9
Migmatite
Laterite
Granite
Colluvium
Laterite
Laterite
Adamellite
Alluvium
Sand overlying laterite
Dyke
Fault
1 0 1 Ki lometres
N
63150006315
000
63100006310
000
63050006305
000
475000
475000
470000
470000
465000
465000
460000
460000
Figure 3. Geological map (after Wilde and Walker, 1982)
The interpreted faults and dykes are based on the aeromagnetic survey.
Kilometres

Engineering options in the Spencer Gully catchment SLUI 5 Salinity and Land Use Impacts Series
10
2 Desktop study and prediction ofpotential salinisation
Investigation of the potential land salinisation at hydraulic equilibrium (steady state) for the SpencerGully catchment started after a field visit to discuss the results of the preliminary soil-landscape-basedmapping of saline areas by Land Assessment (1999). The definition of ‘salinity risk’ used for this analysiswas ‘the likely incidence of a shallow watertable under steady state conditions where sufficientgroundwater discharge is likely to result in the reduction of yield of traditional crops and pastures or thereduction in health of native vegetation’ (Fig. 4). The desktop study relied on the following data sets andinformation.
� Stereophotographs (slope, terrain attributes)
� Land type (soils, geology and landforms as a surrogate for regolith)
� Land use (cover, area)
� Date of clearing (mapping)
� Existing salinity (field inspection)
� Local hydrogeology / drilling (Harrington’s; proximal SE)
� Experience from related studies nearby and within the region.
� Discussion of the history of development with land holders.
2.1 Criteria for mapping salinity risk area
The interpretation of the above datasets and the field investigation allowed areas at risk of dryland salinityto be mapped according to the following criteria:
� Topography: On steep (convex) slopes, saline areas will be closer to the drainage line, while for concaveslopes, the salinity expands to the shape of the contour lines, with the saline area restricted below the‘break of slope’.
� Regolith thickness, geology and soil maps: Salinity will be more extensive on topographically flat areas,below deep soils towards the lower slopes, near outcrop in drainage lines, and proximal to geologicalstructures such as faults and recognised geological ‘barriers’ (for example, dykes). Greatest risk will bebelow areas of gravels and sands that were cleared recently.
� Land use: There is limited risk of salinisation at the large areas of intact remnant vegetation.
� Date of clearing: While salinity develops within 20–30 years of clearing on deep soils, it develops at aslower rate in deep, in situ regolith, and is stationary in shallow areas soon after clearing (assumingshallow regolith equates to a ‘low’ and therefore ‘quickly’ flushed, or non-existent salt store).
� Existing salinity: Salinity will expand from existing saline areas, or will develop at the confluence ofslopes (convergence zones). The risk is based on nearest incidence of salinity or outcrop in zone ofconvergence.
Salinity and Land Use Impacts Series Engineering options in the Spencer Gully catchment SLUI 5
11
� Local hydrogeology—local flow systems: The rise of salinity in up-slope monitored bores may indicatethe development of salinity, and, in currently saline areas, increased discharge rates and the expansion ofexisting salinity.
� Experience was used to define similar incidences of salinity development in similar terrains, throughintegrating hydrogeological results from drilling with landform attributes.
� An account of the history of the farm was required to set the temporal aspects (especially clearing) in thecontext of the physical attributes.
2.2 Salinity risk map
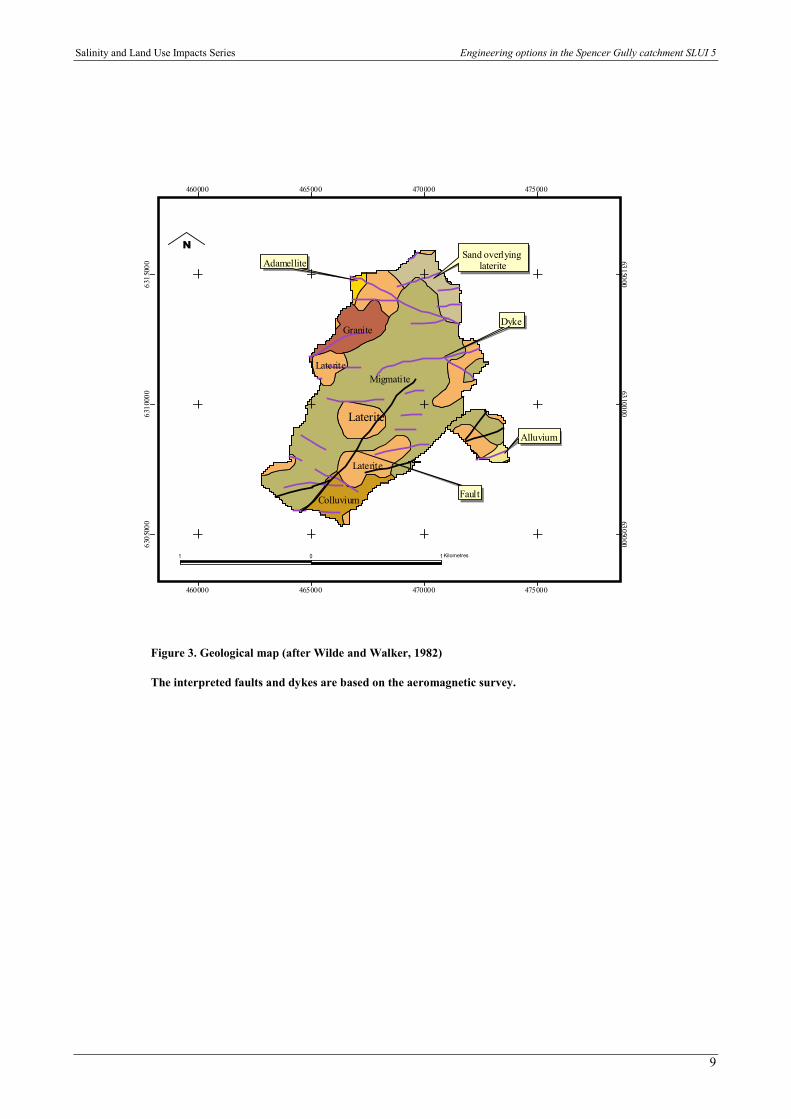
The salinity risk map at steady state is based on the average rainfall of 610 mm/year. The saline risk area(Fig. 4) is likely to have a minimum watertable depth of 2 m in early summer when the groundwatersystems have attained a new equilibrium (within 10–20 years). About 24% of the catchment is potentiallysaline.
#Y
#Y
#Y
#Y
#Y
#Y #Y
#Y
#Y
SP9
SP3
SP6SP4
SP2 SP1SP7
SP5
SP10
1 0 1 Ki lomete rs
N
63150006315
000
63100006310
000
63050006305
000
475000
475000
470000
470000
465000
465000
460000
460000
Figure 4. The potential extent of saline area at steady state —approximately 24% of the catchment
Based on desktop analysis (see section 2). The existing saline area (7% of the catchment) mapped by LandAssessment (1999) is shown by the dotted area. SP 1-10 are bore locations.
Kilometres

Engineering options in the Spencer Gully catchment SLUI 5 Salinity and Land Use Impacts Series
12
3 Hydrogeology and groundwater flowIn order to understand groundwater dynamics and salinity distribution across the Spencer Gullycatchment, a drilling program was initiated and nine sites were selected based on the interpretation of theairborne magnetic dataset and aerial photographs (Fig. 4). Drill sites were then selected based on thefollowing criteria:
� Recharge potential (causing the rise of the watertable)
� Evaluation of the conceptual model (hydrogeology)
� Impact of time of clearing (the response of stream salinisation to clearing)
� Salinity Risk (areas underlain by shallow groundwater).
All nine sites were drilled to the ‘basement’ (defined at Spencer Gully as drill refusal) with the Rotary AirBlast Rig. It was apparent that, in the majority of sites, groundwater infiltration into joints and fractureshad slightly weathered some of the mineral grains promoting dissolution along grain boundaries. Themajority of bores drilled in the catchment penetrated migmatite-derived regolith that was typicallycomposed of biotite-rich melanosomes and leucosomes of coarse-grained quartz and feldspar-richmaterial. Metamorphic fabric was absent from granitoid regolith in bores, SP1 and SP2, in which thedominant constituents were clays and fine-to coarse-grained quartz sand.
The stratigraphy of the regolith shows vertical continuity between the drill holes and can be describedaccording to three main horizons.
� A lower horizon develops above the basement at the weathering front, which has a mean verticalthickness of 4 m, and is characterised by the formation of saprock. Saprock develops in response tothe fragmental disintegration of basement rocks rich in quartz and feldspar and is typically ‘gritty’due to this process promoting the separation of individual mineral grains within the rock.
� Above the lower horizon, primary mineralogy becomes less important as most primary mineralsweather to clay, promoting the development of a saprolitic sandy-clay horizon. At Spencer Gully, themean vertical thickness of the saprolite is 13 m.
� Surficial deposits comprising medium-to coarse-grained quartz sands and clays, with a maximumthickness of 1.9 m, overlie the saprolite.
Groundwater occurs within faults, fractures and joints, along with pore spaces in the weathered profile.Where saprock develops, the horizon is characterised by a relatively higher hydraulic conductivity, and islikely to represent the horizon where the majority of the lateral flow takes place (Fig. 5). The estimatedyields from airlifting the boreholes during drilling were typically 0.2–0.5 L/s (SP 1,4,9,10). Two boreswere only damp and did not produce sufficient water by the completion of drilling (bore SP 6 developed athin groundwater system subsequently) and two (bores SP 2 and SP 5) made no continuous supply ofwater when airlifted (Table 1).

Salinity and Land Use Impacts Series Engineering options in the Spencer Gully catchment SLUI 5
13
Table 1. Borehole construction, watertable levels and salinity
Bore Depth to
basement
(m)
Depth
cased
(m)
Casing
above
ground
(m)
Saprock
thickness
(m)
Conductivity
(after
bailing)
(mS/m)
Estimated
yield
(airlift)
(kL/day)
SP1 21.9 22.4 0.6 1.3 580 > 0.5
SP2 26.25 26.7 0.6 8.25 268 Minor
SP3 9.4 9.38 0.4 0.9 Dry Nil
SP4 17.8 17.8 0.5 2.3 1540 < 0.5
SP5 20.4 20.32 0.5 5 1035 Nil
SP6 6.9 6.92 0.4 2.1 2340 Nil
SP7 11.4 11.41 0.5 10 1300 0.2
SP9 23 19.4 0.9 2.8 2060 < 0.5
SP10 10 10 0.5 2 2400 >0.5
The greatest yield was obtained from bore SP 1 (0.5 L/s) within the migmatite. The watertable is typicallydeep on the slopes (> 10 m), moderate in the mid-slopes (> 5 m) and shallow (< 2 m) within the valleys.Piezometric heads are between 1 and 2 m above ground surface within saline seeps. Based on thesemeasurements, the watertable has a sufficient head difference to allow lateral groundwater flow in thecatchment. The groundwater in the saprock aquifer is semi-confined by an overlying saprolite clay layer.
Figure 5. East–west cross section of the catchment showing the main hydrogeological units: saprock (grey),overlying weathered profile (blue) and surficial deposits (white). The saprock is the main water-bearingformation. The other cells are outside the model domain.
The hydraulic conductivity of the material comprising the three hydrogeological units varies as aconsequence of the rock mineralogy and location in the landscape. The pump test and slug test analyses to
Engineering options in the Spencer Gully catchment SLUI 5 Salinity and Land Use Impacts Series
14
calculate hydraulic conductivity of similar materials were carried out in various catchments of WesternAustralia (Martin 1984; Dogramaci, 1999; Clarke, et al., 2000).
The results showed differences in orders of magnitude in horizontal hydraulic conductivity between thesurficial deposits (the top layer) and the saprock aquifer-associated material. As a generalisation, thehydraulic conductivity of the three hydrogeological units (namely the saprock, weathered sandy clayprofile and overlying surficial deposits) range from 0.1 to 0.001 m/day, 0.01 to 0.005 m/day and 0.1 to100 m/day respectively. Groundwater salinity expressed as electrical conductivity (EC) ranges from 268mS/m to 2400 mS/m (salinity in mg/L = conductivity in EC x 5.5). The groundwater in bores SP1 andSP2 at northern catchment boundaries is relatively fresh (278 mS/m and 500mS/m respectively).Groundwater on the eastern and western slopes on the other hand is generally brackish to saline, withmost groundwater samples having a salinity of between 1035 mS/m and 2340 mS/m.
Figure 6. Arrows show the groundwater flow direction in the saprock aquifer. The contours representwatertable elevation in metres AHD.

Salinity and Land Use Impacts Series Engineering options in the Spencer Gully catchment SLUI 5
15
4 Salinity of surface water andsalt equilibrium
The electrical conductivity (EC a widely used surrogate for salinity) of the stream draining the SpencerGully catchment was measured at 14 sites ranging from 1580 mS/m to 2560 mS/m (salinity ~8,500 to14,000 mg/L). The EC upstream of the western branch (Fig. 2) is 1580 mS/m and steadily increasesdownstream to 1800 mS/m where it mixes with eastern branch. The EC upstream of the eastern branch is1600 mS/m, and increases steadily down flow lines to 1800 mS/m. The EC of the main branch continuesto increase and reaches a maximum value of 2560 mS/m where it mixes with the main Spencer Gullycreek. The increase in the salinity levels along the natural drains is due to the mixing with shallow salinegroundwater.
The flow rate of surface water discharging from the catchment is highly variable (Fig 7). The averagedaily flow starting from 20 April 2000 to 20 April 2001 is 1200 m3. These measurements only represent afirst order estimate for stream flow at Spencer Gully and are consistent with measured discharge values ofthe similar sized cleared subcatchments within the Collie catchment (Williamson et al, 1987)
Figure 7. Flow rate and electrical conductivity of the surface water discharging from the catchment.
The average base flow was calculated by hydrograph separation using three different methods—Chapman(9.3 L/s), Boughton (6.9 L/s) and Lyne and Hollick (4.6 L/s). Assuming average base flow of 6.9 L/s andan average groundwater salinity in the valley floor of ~ 2200 mS/m (~12 000 mg/L) the salt fluxdischarged from the catchment is ~ 2600 tonnes. The catchment area is ~ 5,3 Km2 and average rainfall is610 mm, so assuming a concentration of Cl of 5 mg/L (Hingston and Gailitis, 1976), the average annualsalt flux input via rainfall to the catchment is ~ 16 tonnes. The salt output/input ratio of ~ 160 suggeststhat the system is not in equilibrium in terms of the salt balance, and the flushing of salt continues fromthe catchment, most likely due to the mobilisation of salt (mainly) in the saprolite profile. Theapproximate turnover time of salt can be calculated by dividing the inventory of salt in groundwater by
0
50
100
150
200
250
01/05/96 01/07/96 01/09/96 01/11/96
Time (day)
Flow
(L/s
)
0
400
800
1200
1600
2000
EC (m
S/m
)
01/05/00 01/07/00 01/09/00 01/11/00

Engineering options in the Spencer Gully catchment SLUI 5 Salinity and Land Use Impacts Series
16
the annual input (assuming there are no significant internal sources of chloride ion in the aquifer). Thetotal amount of salt is ~ 400 000 tonnes for the Spencer Gully catchment, calculated assuming an averagecombined aquifer thickness of 18 m, a total porosity of 40% and salinity of 12 000 mg/L (Bari and Boyd,1992). This yields a turnover time on the order of ~ 140 years, which is commensurate with the waterresidence time in this type of environment.

Salinity and Land Use Impacts Series Engineering options in the Spencer Gully catchment SLUI 5
17
5 Numerical modelling (MODFLOW)The drilling results and airborne magnetic data delineated the aquifers, geological structures andgroundwater flow but, of course, only indicated the current distribution of groundwater levels in thecatchment. Numerical modelling, on the other hand, can provide information on the temporal changes inwatertable and flow dynamics in response to changes in the type of vegetation cover across thecatchment. Salinity-susceptible areas then can be inferred from watertable maps obtained from numericalmodels.
The currently saline area extends over 7% of the Spencer Gully catchment (Land Assessment 1999) butthe watertable measurements in the catchment and the adjacent ‘Harrington’ farm show that thewatertable in some piezometers, particularly at the catchment boundary, is still rising. This may indicatethat the catchment has not yet reached hydraulic equilibrium and more areas, particularly in the low- lyingareas along the main Spencer Gully creek and along the smaller tributaries, may be affected by watertablerises in future. These areas represent saline and the potential salinity risk areas in the catchment.Numerical modelling such as MAGIC and MODFLOW will help to interpret and map the potential salineareas at hydraulic equilibrium.
The impacts of various intervention scenarios to control groundwater levels and prevent salinegroundwater seepage were modelled. These groundwater modelling tools are useful in helping to planprojects in which objectives are set and met in a stepwise fashion. The numerical modelling, combinedwith the fieldwork, will assist decision making where various scenarios can be tested as a part of integralmanagement options.
Comparing results from the two simulation models, MODFLOW and MAGIC, may be useful to illustratethe groundwater budget and the spatial distribution of saline-prone areas when the catchment reacheshydraulic equilibrium. The discrepancy of the results from the models may also highlight their usefulnessand deficiencies for future catchment salinity investigations.
Conceptually, the hydrogeology of the Spencer Gully catchment is divided into three layers. The surficialdeposits, a semi-confined sandy clay horizon and saprock. The surficial sediments are largely unconfinedwhile the saprock can vary from confined to semi-confined by overlying weathered sandy clay material.This reflects the multi-layered nature of the aquifers within the catchment, with each hydrogeologicalunits characterised by distinct hydraulic properties.
The inputs to the system are recharge, due to precipitation, and surface water inflow. The recharge ratewas calculated using the estimated field saturation index of the top layer for the first 12-months. Theaverage recharge into the catchment was calculated as ~ 55 mm/year. The top layer was treated asdrainage where groundwater recharged the bottom layers and, when the watertable reached the landsurface, overflowed downstream.
5.1 Steady State Model (MODFLOW)
The steady state model covers the Spencer Gully catchment and the ‘Harrington Farm’ on the east-side ofthe catchment. Ten additional bores on this farm are used in the model for calibration. The area of the

Engineering options in the Spencer Gully catchment SLUI 5 Salinity and Land Use Impacts Series
18
model, ~ 2.5 km by ~ 3 km, incorporates all the boreholes in the catchment and the adjacent farm. Eachcell within the model represents 25 m2 resulting in 144 rows and 128 columns, with 18 432 cells for thecatchment area. The model consists of three hydrogeological layers and incorporates soil properties,topographical and climatic data.
The topographical data were taken from digital elevation maps of the catchment and then kriged to obtaina value for each node within the model area. The thickness of each hydrogeological layer was interpretedfrom the geological logs of the 19 bores in the study area. The effective porosity of the three layers (fromthe top) is 20%, 10% and 25%. Recharge for each individual cell was calculated based on vegetationcover and field saturated capacity which ranged from 1 x10⁻⁶ to 3 x 10⁻⁴ m/day.
An assessment of land use, groundwater salinity, topographic position and soil type was used to gain afirst order approximate of recharge. An initial assessment suggests that cleared areas, with permeablesurface soils and with lower groundwater salinity levels, are likely to have higher recharge rates. Bores inthe upper-slopes (SP1 and SP2) fit this category. However, relatively high recharge rates may also occuron sites with deeper water levels (thick regolith) and saline groundwater (SP4, SP5 and SP6) such as deepduplex soils.
Recharge rates estimated using the chloride-evaporation index method (Allison and Hughes, 1978; Mazorand George, 1992) assumes that groundwater chloride concentration is in equilibrium with the incomingflux from rainfall (taken as 5 mg/L). The results suggest a range from greater than 20 mm/year near SP1to less than 0.1 mm/year at SP6, with a mean value of 0.15 mm/year for the catchment. These rates aremore likely to represent pre-clearing conditions and not the existing conditions. The hydrograph analysisin the eastern and northern Wheatbelt suggests that the rate of recharge is one to two orders of magnitudehigher than this value. The hydrograph analysis suggests that the rate of recharge post-clearing variesfrom 5% to 12% depending on the climate and location of the catchments (Nulsen, 1998). In this study,the recharge rates were calculated for each individual cell based on the hydrogeological properties and thetype of vegetation cover. The results of recharge rates were then compared with those obtained fromhydrograph analysis in other parts of the Collie catchment and the Wheatbelt.
The recharge rates for each cell were simulated using MAGIC (Mauger, 1996) over one year of averagerainfall in monthly time steps. The year started at the beginning of August when soil-water content wasexpected to be at its maximum. Assuming steady state conditions, the soil water stored at the end of the‘average’ year equals the water stored at its commencement. To estimate the soil-water store for August,a run of the model commenced with saturated soil. Two years were then run in sequence with averagerainfall to produce soil stores that were used as the initial condition for the third year that represented thetrue ‘average’ year. The output of the monthly time step simulation was the potential recharge from eachcell to the saprolite horizon. Potential recharge became actual recharge if there was sufficient capacity fordeep groundwater flow away from the site, the capacity being determined by the transmissivity andhydraulic gradient at the site. The average recharge calculated from groundwater balance represented 9%of the average rainfall in the catchment. This value is consistent with recharge values of other parts of theCollie catchment (Johnston, 1987), and catchments in the Wheatbelt of Western Australia (Nulsen, 1998).
5.2 Calibration and results of steady state model (MODFLOW)
The steady state model was calibrated using the observed groundwater heads from the Spencer Gully andHarrington Farm. The observed versus estimated depths to the watertable from simulation (Fig. 8) suggest

Salinity and Land Use Impacts Series Engineering options in the Spencer Gully catchment SLUI 5
19
that the standard error of estimates is 0.6 m with 95% confidence level and RMS (Root Mean Squared) of4.1%.
269
289
309
329
269 329309289
Cal
cula
ted
Hea
d(m
)
Observed head (m)
Figure 8. Correlation of simulated heads vs observed heads in metres above AHD. The 95% confidenceinterval is represented by the two dashed lines.
The optimisation of the model was carried out using the WinPEST package to test the impact of thehydraulic parameters on the correlation between observed and calculated groundwater heads. The valuesof hydraulic parameters from WinPEST were similar to values used in the model. Only small variationsof 0.02 m/day in vertical hydraulic conductivity values were required to optimise the output of the model.

Engineering options in the Spencer Gully catchment SLUI 5 Salinity and Land Use Impacts Series
20
1 0 1 Ki lomete rs
N
63150006315
000
63100006310
000
63050006305
000
475000
475000
470000
470000
465000
465000
460000
460000
Figure 9. Groundwater modelling results
The shaded area (about 25% of the catchment) indicates where the watertable is predicted to be less than 2 mdeep, the critical depth for land salinisation.
The results of the modelling in terms of the depth to watertable are shown in Figure 9. Approximately25% of the catchment has a watertable < 2 m deep at hydraulic equilibrium. Field investigations andwatertable measurements in the few bores located in this area suggest that the current extent of salinity inthe catchment may closely resemble these results. Whether the catchment has reached equilibrium or notis discussed further in the following sections. The results of the model run suggest that the averagegroundwater velocity is 15 m/year, resulting in a travel time over the length of the catchment of~ 170 years. This value is much higher than the groundwater velocity in the eastern Wheatbeltcatchments, which is due to the steeper hydraulic gradients in the Spencer Gully.
The recharge rate is the most critical and determinate factor in the model for mapping the steady stateshallow watertable (< 2m deep). The recharge rate in the current study was calculated on an individualcell basis and the yearly average recharge values across the catchment are consistent with average yearlyrecharge values calculated by hydrograph analysis (Nulsen, 1998). The calculated recharge rate of55 mm/year is assumed to be the upper limit and is a conservative value for the Spencer Gully catchment.The predicted area underlain by shallow watertable represents the maximum extent of land salinisation.
Kilometres
Salinity and Land Use Impacts Series Engineering options in the Spencer Gully catchment SLUI 5
21
5.3 Numerical Modelling (MAGIC)
Since identical conceptual hydrogeological models were used to run the MODFLOW and MAGICmodels and if the calculation methods were equivalent, the locations and rates of deep groundwaterdischarge should be the same from both MAGIC and MODFLOW models. In MAGIC model,groundwater flows are calculated by a simplified method. Water moved down-slope (as determined fromsurface topography) at rates that are limited by the transmissivity and surface gradient. If inflow from up-slope areas exceeds the capacity for flow downstream at any site, the difference is assumed to flowvertically upwards as deep groundwater discharge. If inflows from up-slope are less than the downstreamcapacity, any potential recharge at the site will be added to the flow downstream up to the limit of thedownstream flow capacity.
The above calculation of discharge did not account for the pressure required to achieve the vertical flowrate. Comparison with the MODFLOW results indicated the need to expand the discharge area inresponse to development of pressure required for discharge. Thus, the MAGIC model has been modifiedso that discharge is spread over all areas up-slope of a site where discharge is needed, such that thegroundwater level is uniformly graded over the discharge area. At all points in the discharge area, thehead difference of the groundwater level minus top-of-clay level, applied to the transmissivity and depthof the clay layer, equates to the rate of discharge at that point. While agreement is generally good, theMODFLOW results should be considered more accurate and preferred when designing any works thatdepend on accurate location of discharge areas. The advantage of the MAGIC analysis is that it can beapplied quickly to gain a general estimate of the extent of land subject to discharge of deep groundwater.
5.4 Effect of dykes and faults on groundwater flow
Magnetic data provide information on lithological and mineralogical variation (granite basement, faultsand dykes) within the unweathered crystalline basement rock. Combined, these interpretations may allowdeductions on porosity and permeability variation and, therefore, enable the development of ahydrogeological model of how groundwater may occur and move through the regolith profile acrossdifferent lithologies. Numerical simulation incorporating the dykes and faults with their respectivehydraulic parameters may provide information on their impact on the distribution of shallow groundwaterand, subsequently, the development of saline areas within the catchment.
The hydraulic conductivity contrasts between regolith materials derived from migmatite, granitoids anddolerite dykes are greatest at the weathering front (saprock) and less significant in the overlying sandyclay profile. The saprock (developed over dolerite dykes) may form an effective barrier to groundwaterbase flow depending on the topography and the geometry of the dyke with respect to hydraulic gradients(McCrea et al., 1990). These controls are also important in determining the ability of faults to constrainthe movement of groundwater. Therefore, in this model, the hydraulic conductivity of saprock (developedover dolerite dykes) was ascribed a value of 0.008 m/day, which is two orders of magnitude lower thanthat nominated for the saprolite horizon (Clarke et al., 2000). The hydraulic conductivity values used forthe saprolite (developed above saprock) was the same for migmatite, granitoids and dolerite dykes.Conversely, the hydraulic conductivity of faults, regardless of lithology, was one order of magnitudehigher (Clarke et al., 2000).

Engineering options in the Spencer Gully catchment SLUI 5 Salinity and Land Use Impacts Series
22
Figure 10. Comparing areas of discharge simulated by MODFLOW and MAGIC.
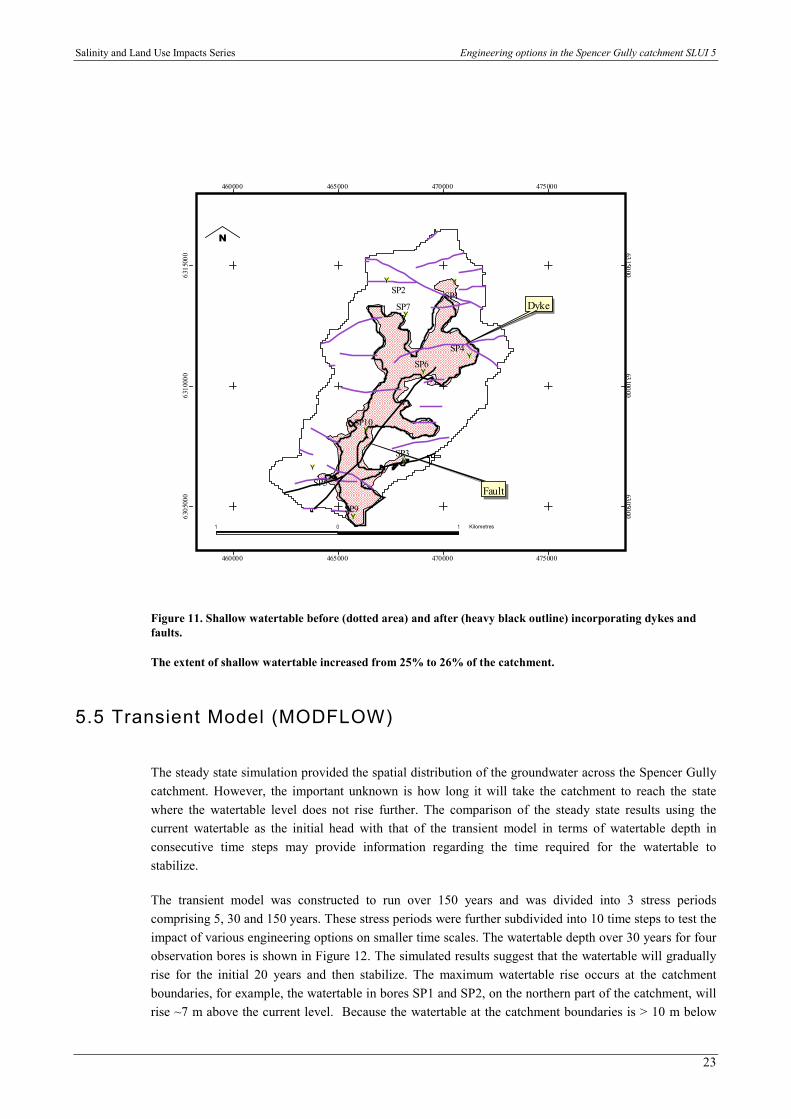
The results of the model run incorporating dykes and faults suggest that the spatial distribution of shallowgroundwater in the Spencer Gully catchment is not significantly affected or controlled by these geologicalfeatures (Fig. 11). The only area where shallow groundwater extended after incorporating dykes andfaults into the steady state model is in the north-eastern part of the catchment (which coincides with themajor continuous northwest-southeast-trending dyke), and is less than 1% of the total area modelled asbeing underlain by a watertable at < 2 m depth.
The results suggest that few of the dolerite dykes are likely to form effective barriers to groundwatermovement. This is primarily due to their orientation with respect to the direction of groundwater flowwith some of the north-west dykes to the south of the area likely to act as conduits rather than barriers.The lateral continuity of many of the dykes also appears to influence their inability to form barriers. Thediscontinuous nature of the dykes may, to a certain extent, be the result of masking effects due tomagnetite destruction as alteration fluids passed through structural and lithological weaknesses within thebasement rock.
1 0 1 Ki lomete rs
N
63150006315
000
63100006310
000
63050006305
000
475000
475000
470000
470000
465000
465000
460000
460000
MODFLOWMAGIC
Kilometres
Salinity and Land Use Impacts Series Engineering options in the Spencer Gully catchment SLUI 5
23
#Y
#Y
#Y
#Y
#Y
#Y #Y
#Y
#Y
SP9
SP3
SP6
SP4
SP2 SP1SP7
SP5
SP10
Dyke
Fault
1 0 1 Ki lomete rs
N
63150006315
000
63100006310
000
63050006305
000
475000
475000
470000
470000
465000
465000
460000
460000
Figure 11. Shallow watertable before (dotted area) and after (heavy black outline) incorporating dykes andfaults.
The extent of shallow watertable increased from 25% to 26% of the catchment.
5.5 Transient Model (MODFLOW)
The steady state simulation provided the spatial distribution of the groundwater across the Spencer Gullycatchment. However, the important unknown is how long it will take the catchment to reach the statewhere the watertable level does not rise further. The comparison of the steady state results using thecurrent watertable as the initial head with that of the transient model in terms of watertable depth inconsecutive time steps may provide information regarding the time required for the watertable tostabilize.
The transient model was constructed to run over 150 years and was divided into 3 stress periodscomprising 5, 30 and 150 years. These stress periods were further subdivided into 10 time steps to test theimpact of various engineering options on smaller time scales. The watertable depth over 30 years for fourobservation bores is shown in Figure 12. The simulated results suggest that the watertable will graduallyrise for the initial 20 years and then stabilize. The maximum watertable rise occurs at the catchmentboundaries, for example, the watertable in bores SP1 and SP2, on the northern part of the catchment, willrise ~7 m above the current level. Because the watertable at the catchment boundaries is > 10 m below
Kilometres

Engineering options in the Spencer Gully catchment SLUI 5 Salinity and Land Use Impacts Series
24
the natural surface, this increase will have a minimal impact on the current depth to watertable in thevalley floor which is the main area affected by salinity (Fig. 12).
On the other hand, the incremental increase in the head of ~ 1 cm/year for the bores SP9 and SP10 in thevalley floors is less than the error margin calculated for the calculated heads in the MODFLOW model.Therefore, the likely impact of a relatively small rise in watertable would be insignificant in terms of thespread of shallow watertable (< 2m) beyond the current level. The 8000-day mark when the watertablestabilizes may represent the time taken for the catchment to reach steady state (when there is no furtherrise of the watertable across the catchment).
The transient model of the Spencer Gully catchment can also be used to test the impact of various salinitymanagement scenarios to increase groundwater discharge from the catchment. The effects of engineeringintervention schemes —drains, relief bores and abstraction bores—were tested in various time steps andtheir impact on water balance and lowering watertable are delineated in the following sections.
Time = 5315Head = 330.3
Time = 70SP2 Head = 322.9
Time = 70SP3 Head = 293.5
Time = 5315.Head = 300.2
Time = 70SP5 Head = 282.1
Time = 5315Head = 284.2
Time = 70SP9 Head = 271
Time = 5315Head = 271.21
He a
d(m
)
271
291
331
311
0 10010 1000 10000 10000Days
Figure 12. Watertable rises in four bores.
Note that the watertable rises by ~ 7 m in SP2 and only 0.2 cm in SP9.
5.5.1 Groundwater discharge (drains)
The Department of Agriculture designed the groundwater relief drains as part of the surface watermanagement plan for the Spencer Gully catchment. The depth of the drains along the main Spencer GullyCreek was less than 1 m. The objective of the proposed surface water management plan is to controlrunoff from the upper reaches of the main drainage and divert the runoff to pre-determined safe disposalpoints that discharge directly to the main catchment watercourse/drain. The discharge of surface runoff

Salinity and Land Use Impacts Series Engineering options in the Spencer Gully catchment SLUI 5
25
may protect the low-lying areas of the catchment from intensive surface runoff and saline groundwaterseepage.
In this investigation the effectiveness of the drains in lowering the watertable were simulated byconstructing a 2 m deep drain within the main drainage line and within the lower reaches of minor-orderwatercourses along the main drainage line. The drains were 1.2 km long with a maximum depth of 2 mbelow the surface and with a gradient of 0.1% along their floor allowing the free flow of shallowgroundwater into the main watercourse. It is anticipated that the groundwater entering the drains wouldconsist of both deep groundwater with a potential for upward leakage and shallow groundwater from theupper aquifer.
After 365 days, the watertable is lowered by ~ 1 m in the vicinity of the drains (Fig. 13). The lateralimpact is limited to 75 m east and 100 m west of the drain. The maximum lowering of the watertable inthe cells adjacent to the drain is < 0.5m.
A
B
Figure 13. (A) Groundwater discharge to the main drainage. (B) Relatively lower watertable in the drains andthe low-lying areas adjacent to drains.
(The vertical exaggeration is 1:25).
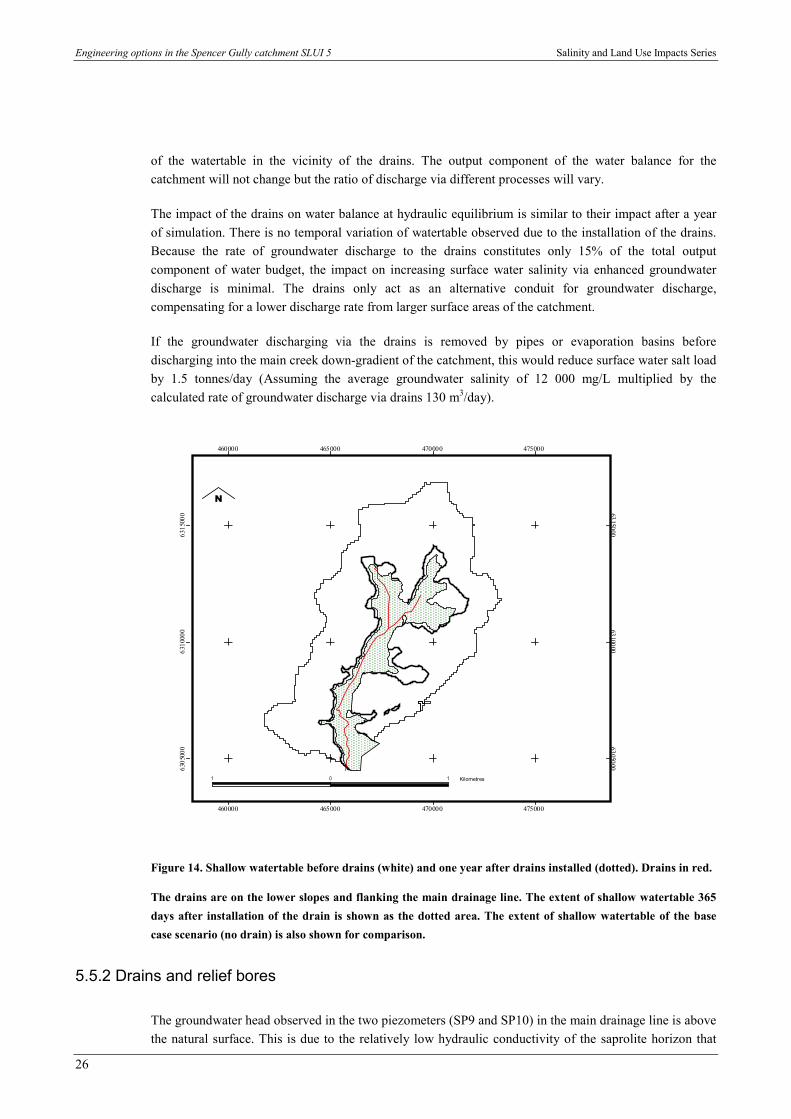
The area underlain by shallow watertable has reduced from 25% of the catchment for the base casescenario (steady state condition) to 18% after installation of the drains (Fig. 14). The 7% differencebetween these two scenarios accounts for ~ 40 hectares of low-lying areas along the main drainage line.
The rate of groundwater discharge via drains is ~130 m3/day compared to the total output from thecatchment of 830 m3/day so accounting for 15% of the total output of the water budget. The results of themodel suggest that the rate of groundwater discharge via these drains will not increase the total volume ofoutput significantly (~ 9 m3/day). The rate of groundwater discharged from the cells adjacent to the drainswill decline to compensate for the enhanced discharge rate from the drains. This is the reason for the fall
Engineering options in the Spencer Gully catchment SLUI 5 Salinity and Land Use Impacts Series
26
of the watertable in the vicinity of the drains. The output component of the water balance for thecatchment will not change but the ratio of discharge via different processes will vary.
The impact of the drains on water balance at hydraulic equilibrium is similar to their impact after a yearof simulation. There is no temporal variation of watertable observed due to the installation of the drains.Because the rate of groundwater discharge to the drains constitutes only 15% of the total outputcomponent of water budget, the impact on increasing surface water salinity via enhanced groundwaterdischarge is minimal. The drains only act as an alternative conduit for groundwater discharge,compensating for a lower discharge rate from larger surface areas of the catchment.
If the groundwater discharging via the drains is removed by pipes or evaporation basins beforedischarging into the main creek down-gradient of the catchment, this would reduce surface water salt loadby 1.5 tonnes/day (Assuming the average groundwater salinity of 12 000 mg/L multiplied by thecalculated rate of groundwater discharge via drains 130 m3/day).
1 0 1 Ki lomete rs
N
63150006315
000
63100006310
000
63050006305
000
475000
475000
470000
470000
465000
465000
460000
460000
Figure 14. Shallow watertable before drains (white) and one year after drains installed (dotted). Drains in red.
The drains are on the lower slopes and flanking the main drainage line. The extent of shallow watertable 365days after installation of the drain is shown as the dotted area. The extent of shallow watertable of the basecase scenario (no drain) is also shown for comparison.
5.5.2 Drains and relief bores
The groundwater head observed in the two piezometers (SP9 and SP10) in the main drainage line is abovethe natural surface. This is due to the relatively low hydraulic conductivity of the saprolite horizon that
Kilometres
Salinity and Land Use Impacts Series Engineering options in the Spencer Gully catchment SLUI 5
27
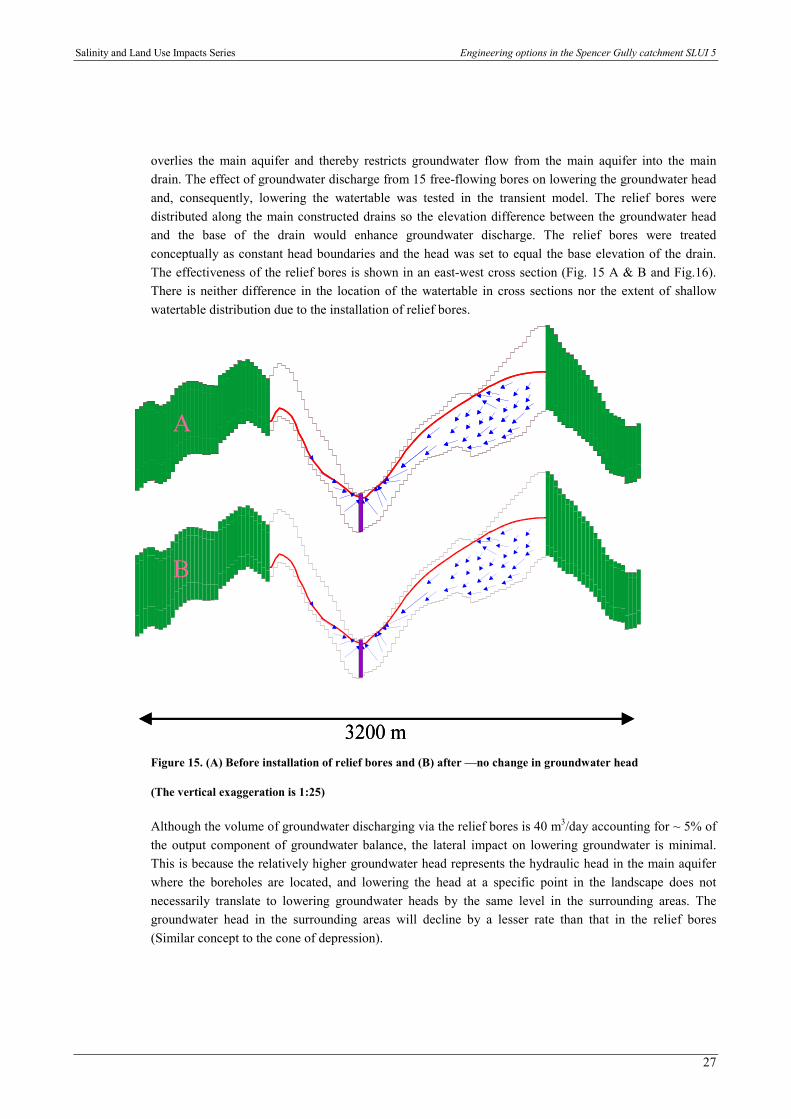
overlies the main aquifer and thereby restricts groundwater flow from the main aquifer into the maindrain. The effect of groundwater discharge from 15 free-flowing bores on lowering the groundwater headand, consequently, lowering the watertable was tested in the transient model. The relief bores weredistributed along the main constructed drains so the elevation difference between the groundwater headand the base of the drain would enhance groundwater discharge. The relief bores were treatedconceptually as constant head boundaries and the head was set to equal the base elevation of the drain.The effectiveness of the relief bores is shown in an east-west cross section (Fig. 15 A & B and Fig.16).There is neither difference in the location of the watertable in cross sections nor the extent of shallowwatertable distribution due to the installation of relief bores.
AA
B
Figure 15. (A) Before installation of relief bores and (B) after —no change in groundwater head
(The vertical exaggeration is 1:25)
Although the volume of groundwater discharging via the relief bores is 40 m3/day accounting for ~ 5% ofthe output component of groundwater balance, the lateral impact on lowering groundwater is minimal.This is because the relatively higher groundwater head represents the hydraulic head in the main aquiferwhere the boreholes are located, and lowering the head at a specific point in the landscape does notnecessarily translate to lowering groundwater heads by the same level in the surrounding areas. Thegroundwater head in the surrounding areas will decline by a lesser rate than that in the relief bores(Similar concept to the cone of depression).

Engineering options in the Spencer Gully catchment SLUI 5 Salinity and Land Use Impacts Series
28
1 0 1 Kilomete rs
N
63150006315
000
63100006310
000
63050006305
000
475000
475000
470000
470000
465000
465000
460000
460000
Figure 16. Dotted area shows the shallow watertable 1 year after 15 relief bores (open circles) are installed.
Note that the results are identical to Figure 14. The extent of shallow watertable of the base case scenario“steady state condition” (the clear area) is shown for comparison).
5.5.3 Groundwater discharge via abstraction bores
Groundwater discharge via a series of abstraction bores was tested as a possible groundwater controlstrategy. The bores were placed along the relief drain used in the previous two sections to test theeffectiveness of drains and relief bores in lowering watertable in the catchment (Fig. 17). As risingwatertable primarily affects the low-lying areas where the watertable is shallow, it was necessary to focussuch a strategy where the results of pumping would probably be most effective.
Twelve bores with the maximum capacity of 25 m3/day per bore were incorporated into the model. Thebores could nominally produce 300 m3/day which might be the upper limit for the groundwaterabstraction considering the relatively low transmissivity values of the main aquifer, but the modelsimulation calculated the optimum rate and, consequently, the rate of groundwater discharged based onbore location, hydrological input parameters and boundary conditions of the model.
The optimum placing of the bores to be effective in lowering the watertable was found to be at spacingranging from 100 m to 180 m along the drains. However, an unlimited combination of the number ofbores, spacing and discharge rates could be tested to provide the most effective watertable control.
Kilometres

Salinity and Land Use Impacts Series Engineering options in the Spencer Gully catchment SLUI 5
29
The maximum rate of groundwater discharge for the twelve bores was 180 m3/day. Although thegroundwater was lowered over a substantial distance from the abstraction bores (~ 150 m), the depth tothe groundwater in these areas was still ≤ 2 m which is the critical depth in terms of land salinisation.
1 0 1 Kilometers
N631500063
15000
63100006310000
63050006305000
475000
475000
470000
470000
465000
465000
460000
460000
Figure 17. Abstraction bores (filled circles) in the drains
The extent of the shallow watertable is shown as the dotted area superimposed on the base case scenario.
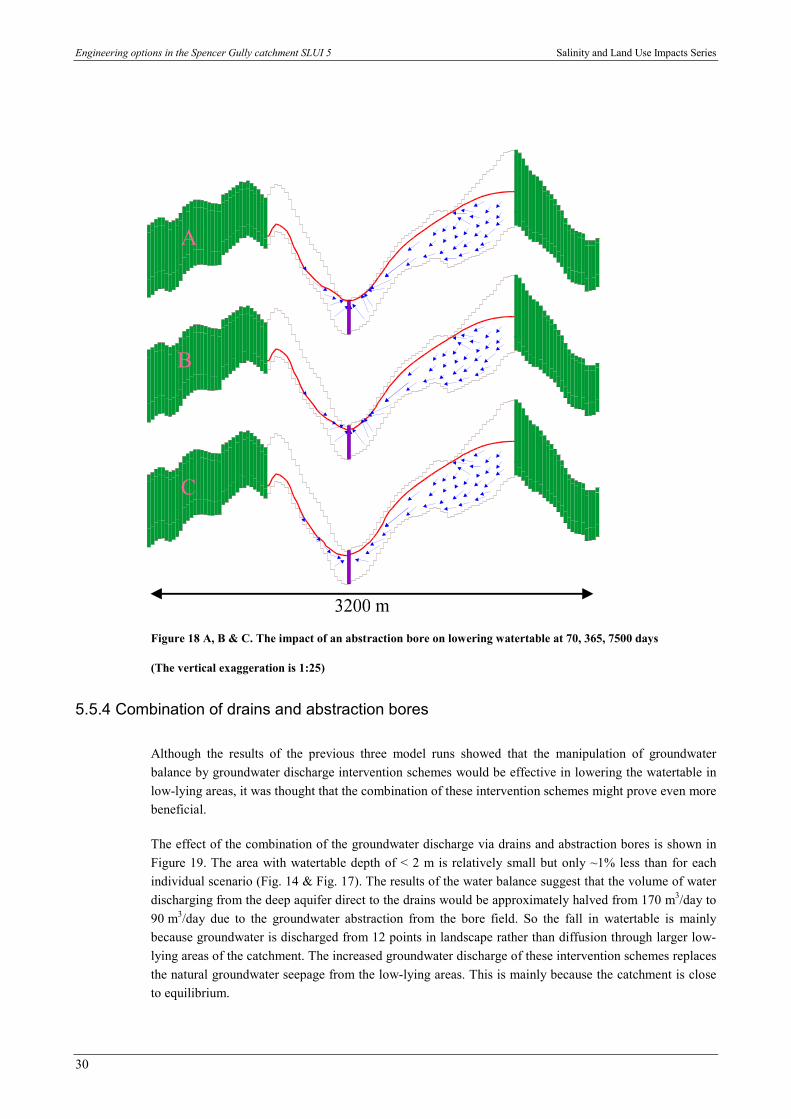
Groundwater flow paths and time steps following the implementation of the scheme are depicted in theeast-west cross section (Fig. 18). Modelling suggests that groundwater pumping significantly lowered thewatertable. The area characterised by groundwater <2 m deep has decreased from 25% of the catchmentat steady state before the groundwater pumping to ~ 18% after two years of continuous pumping.
The cross sections in the Figure 18 represent the watertable depth at 70 days, 1 year, 20 years respectivelyfrom the commencement of groundwater pumping. The maximum lowering of groundwater is reachedafter two years of pumping and after this the depth to the watertable remains constant.
Kilometres
Engineering options in the Spencer Gully catchment SLUI 5 Salinity and Land Use Impacts Series
30
A
B
C
Figure 18 A, B & C. The impact of an abstraction bore on lowering watertable at 70, 365, 7500 days
(The vertical exaggeration is 1:25)
5.5.4 Combination of drains and abstraction bores
Although the results of the previous three model runs showed that the manipulation of groundwaterbalance by groundwater discharge intervention schemes would be effective in lowering the watertable inlow-lying areas, it was thought that the combination of these intervention schemes might prove even morebeneficial.
The effect of the combination of the groundwater discharge via drains and abstraction bores is shown inFigure 19. The area with watertable depth of < 2 m is relatively small but only ~1% less than for eachindividual scenario (Fig. 14 & Fig. 17). The results of the water balance suggest that the volume of waterdischarging from the deep aquifer direct to the drains would be approximately halved from 170 m3/day to90 m3/day due to the groundwater abstraction from the bore field. So the fall in watertable is mainlybecause groundwater is discharged from 12 points in landscape rather than diffusion through larger low-lying areas of the catchment. The increased groundwater discharge of these intervention schemes replacesthe natural groundwater seepage from the low-lying areas. This is mainly because the catchment is closeto equilibrium.
Salinity and Land Use Impacts Series Engineering options in the Spencer Gully catchment SLUI 5
31
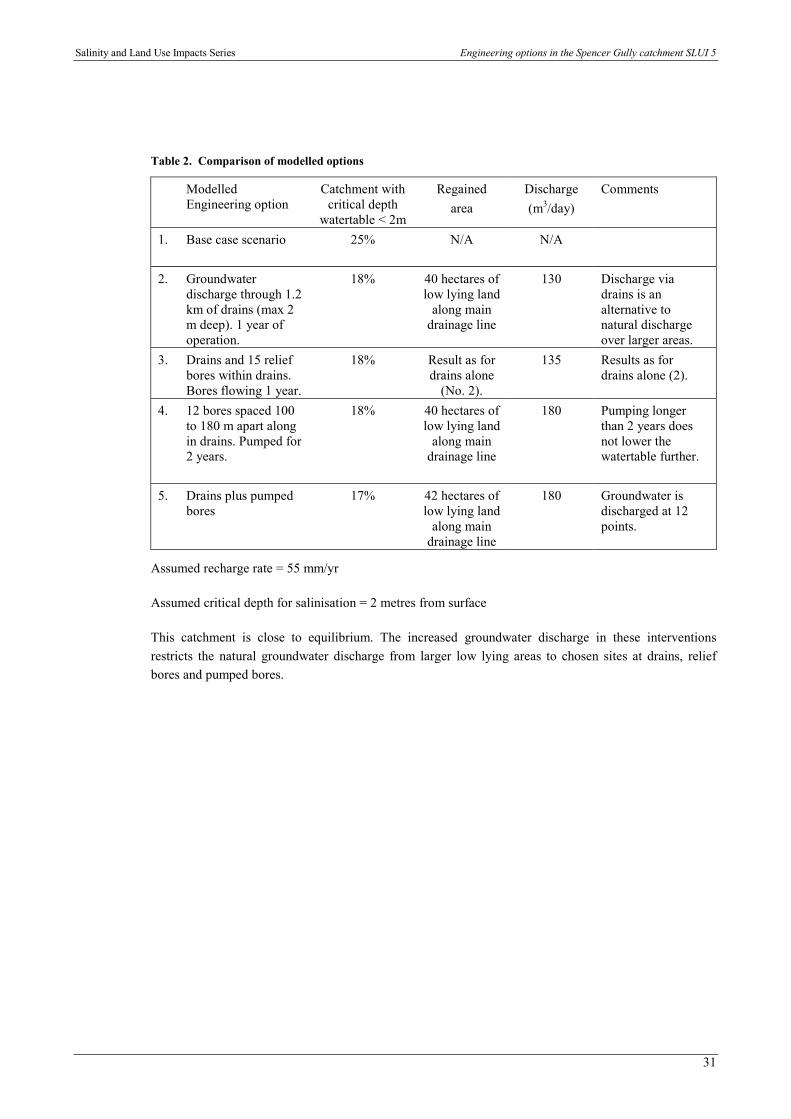
Table 2. Comparison of modelled options
ModelledEngineering option
Catchment withcritical depth
watertable < 2m
Regainedarea
Discharge(m3/day)
Comments
1. Base case scenario 25% N/A N/A
2. Groundwaterdischarge through 1.2km of drains (max 2m deep). 1 year ofoperation.
18% 40 hectares oflow lying land
along maindrainage line
130 Discharge viadrains is analternative tonatural dischargeover larger areas.
3. Drains and 15 reliefbores within drains.Bores flowing 1 year.
18% Result as fordrains alone
(No. 2).
135 Results as fordrains alone (2).
4. 12 bores spaced 100to 180 m apart alongin drains. Pumped for2 years.
18% 40 hectares oflow lying land
along maindrainage line
180 Pumping longerthan 2 years doesnot lower thewatertable further.
5. Drains plus pumpedbores
17% 42 hectares oflow lying land
along maindrainage line
180 Groundwater isdischarged at 12points.
Assumed recharge rate = 55 mm/yr
Assumed critical depth for salinisation = 2 metres from surface
This catchment is close to equilibrium. The increased groundwater discharge in these interventionsrestricts the natural groundwater discharge from larger low lying areas to chosen sites at drains, reliefbores and pumped bores.
Engineering options in the Spencer Gully catchment SLUI 5 Salinity and Land Use Impacts Series
32
6 The influence of recharge rates onthe shallow watertable
Modelling indicates that the spatial distribution of the shallow groundwater depends primarily on therecharge rates and the depth to groundwater nominated as critical to land salinisation. Because theaverage recharge rate (55 mm/year) used in the numerical models was calculated on the climatic andhydrogeological conditions of the catchment, the interpretation of the results and depth to groundwatershould only be used in relative terms (that is, comparing the areas underlain by shallow watertable foreach scenario relative to steady state conditions which represents the base case scenario).
To highlight the effect of lower recharge rates on the spatial distribution of groundwater, the MODFLOWmodel was run with an arbitrary average recharge rate of 18 mm/year. This is 3-fold lower than theaverage recharge rate used in the base case scenario (55 mm/year) and is only 3% of the annual rainfall inthe catchment. The results suggest that only 15% of the catchment would be underlain by shallowgroundwater (Fig. 20) approximately half of the base case scenario (~25%). These results highlight thatthe recharge rate is the critical parameter in determining catchment water balance and, consequently,predicting areas underlain by shallow groundwater.
Groundwater abstractionscenario
Groundwater abstractionand drain scenario
Base casescenario
1 0 1 Kilometers
N631500063
15000
63100006310000
63050006305000
475000
475000
470000
470000
465000
465000
460000
460000
Figure 19. After installation of 12 abstraction bores and the drains, 17% of the catchment is underlain byshallow groundwater.
This is only 1% less than in the previous scenario (abstraction bores only). The base case scenario (no drainsor abstraction bores) covering 25% of the catchment is shown for comparison.
Kilometres
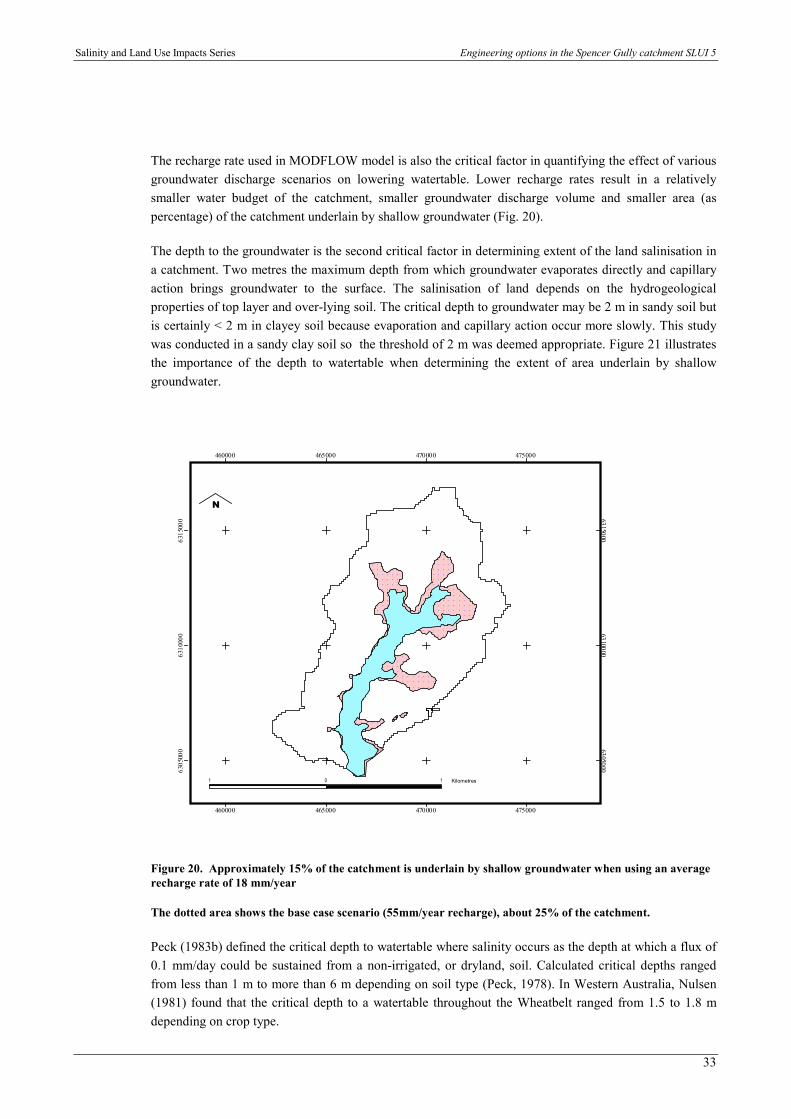
Salinity and Land Use Impacts Series Engineering options in the Spencer Gully catchment SLUI 5
33
The recharge rate used in MODFLOW model is also the critical factor in quantifying the effect of variousgroundwater discharge scenarios on lowering watertable. Lower recharge rates result in a relativelysmaller water budget of the catchment, smaller groundwater discharge volume and smaller area (aspercentage) of the catchment underlain by shallow groundwater (Fig. 20).
The depth to the groundwater is the second critical factor in determining extent of the land salinisation ina catchment. Two metres the maximum depth from which groundwater evaporates directly and capillaryaction brings groundwater to the surface. The salinisation of land depends on the hydrogeologicalproperties of top layer and over-lying soil. The critical depth to groundwater may be 2 m in sandy soil butis certainly < 2 m in clayey soil because evaporation and capillary action occur more slowly. This studywas conducted in a sandy clay soil so the threshold of 2 m was deemed appropriate. Figure 21 illustratesthe importance of the depth to watertable when determining the extent of area underlain by shallowgroundwater.
1 0 1 Ki lomete rs
N
63150006315
000
63100006310
000
63050006305
000
475000
475000
470000
470000
465000
465000
460000
460000
Figure 20. Approximately 15% of the catchment is underlain by shallow groundwater when using an averagerecharge rate of 18 mm/year
The dotted area shows the base case scenario (55mm/year recharge), about 25% of the catchment.
Peck (1983b) defined the critical depth to watertable where salinity occurs as the depth at which a flux of0.1 mm/day could be sustained from a non-irrigated, or dryland, soil. Calculated critical depths rangedfrom less than 1 m to more than 6 m depending on soil type (Peck, 1978). In Western Australia, Nulsen(1981) found that the critical depth to a watertable throughout the Wheatbelt ranged from 1.5 to 1.8 mdepending on crop type.
Kilometres

Engineering options in the Spencer Gully catchment SLUI 5 Salinity and Land Use Impacts Series
34
MODFLOW results indicate that the area underlain by a shallow watertable is probably about 25% of thecatchment under the base case scenario when the critical depth is taken as 2 metres but changessubstantially when different critical depths are nominated.
Figure 21 indicates the variability of the depth to a shallow watertable, and area, for base case rechargerate of 55 mm and the deep drain scenario. At a critical depth of 2 m, the affected area is 25% of thecatchment but goes down to 17% after drains are constructed. If the critical depth is chosen as 1.5 m, the‘at risk’area reduces to approximately 21% of the catchment, while at 1 m and 0.5 m, the area is 17 and12% respectively.
Figure 21. The area underlain by 2 m deep watertable drops from 25% to 17% of the catchment afterinstallation of the drains.
0%
10%
20%
30%
40%
50%
60%
70%
0 2 4 6 8 10Depth to watertable (m)
% A
rea
unde
rlain
by
wat
erta
ble)
Drain
Base case recharge = 55mm/yr
Salinity and Land Use Impacts Series Engineering options in the Spencer Gully catchment SLUI 5
35
7 Conclusions� The steady state modelling results suggest that the area underlain by the shallow watertable (< 2 m
deep) will extend over 25 % of the catchment at equilibrium. This does not necessarily translate tothe saline area but the critical depth of 2 metres represents the threshold where groundwaterevaporates directly or indirectly by capillary action resulting in further salinisation of groundwater.
� The hydrogeology of the Spencer Gully catchment is typified by a complex vertical zonation but canbe described by three main horizons. At the bedrock weathering front above bedrock the saprockranges in thickness from 0.9 m to 6 m and forms an important ‘layer’ in the profile with respect togroundwater flow as it has a relatively high hydraulic conductivity. Where this layer develops, it isoverlain by saprock, which is generally compact, has lower hydraulic conductivities and its thicknessranges from 7 m to 16 m. The overlying saprolite horizon semi-confines the basement aquifer andhas an average thickness of 13 m. The top layer consists of sand and clay and its thickness rangesfrom 0.5m to 2 m.
� The spatial distribution of shallow watertable at steady state mapped by desktop analysis isremarkably similar to that obtained from numerical modelling. Desktop analysis and first-handprediction of the distribution of shallow watertable are essential for salinity management becausethey provide information on the conceptual hydrogeological model that can be used in numericalsimulations.
� MODFLOW proved to be an effective tool to map areas underlain by shallow watertable (SalinityRisk Areas). While its accuracy obviously depends on the datasets and assumptions made in theconceptualisation of the catchments, it is a useful quantitative tool to compare the results of differentscenarios relative to the steady state model. The groundwater balance estimation and the impact ofvarious salinity intervention scenarios on catchment water balance can only be achieved usingnumerical models.
� The comparison of MODFLOW and MAGIC simulations enabled modification of the algorithmswithin MAGIC and so better identify discharge areas. While the MAGIC analysis gave reasonableestimates of water balance quantities at the small-catchment scale, the indicated locations ofdischarge should be considered less accurate than those produced by MODFLOW.
� The model results suggest that dykes and faults have limited impact on the distribution of shallowgroundwater. This is considered to be primarily due to the orientation of the dykes and faults withrespect to the direction of groundwater flow. The limited effect of geological structures appears to bedue to the apparent lack of lateral continuity in many of the dykes. This may be the result of maskingaffects of magnetite destruction. Only one dolerite dyke is likely to form an effective barrier togroundwater movement.
� The two-metre deep drains and abstraction bores have a significant impact on the distribution ofgroundwater. The drains lower the watertable in adjacent cells by up to one metre. The abstractionbores lower groundwater in up to four cells adjacent to the bores. Such lowering of the watertablewould be beneficial in solving waterlogging problems on the low-lying areas. Relief bores had an

Engineering options in the Spencer Gully catchment SLUI 5 Salinity and Land Use Impacts Series
36
insignificant impact at the scale simulated in this investigation. They lowered groundwater head onlyto the tops of the bores so that the groundwater head was still be at the surface in the surroundingareas.
� As they increase the discharge rate from the catchment, groundwater-discharge intervention schemesdrive the catchment to equilibrium faster. It is essential to calculate the time required for thecatchment to reach equilibrium, particularly for larger scale catchments. If the salinity managementpriority is to gain time by implementing recharge intervention scenarios, discharge interventionscenarios might be omitted.
� The impact of engineering scenarios on output component of water balance in catchments that havereached or close to equilibrium is minimal. The groundwater discharged by engineering options willonly substitute for natural groundwater discharge from larger low-lying areas of catchments.

Salinity and Land Use Impacts Series Engineering options in the Spencer Gully catchment SLUI 5
37
References and RecommendedReading
ALLISON, G. B., and HUGHES, M. W., 1978, The use of environmental chloride and tritium to estimate total rechargeto an unconfined aquifer: Australian Journal of Soil Research, 16, 181-195.
BARI, M. A., and BOYD, D. W, 1992, Water and salt balance of a Partially Reforested Catchment in the south-west ofWestern Australia: Water Authority of WA., Rep. No. WS 98.
CLARKE, C. J., GEORGE, R. J., BENNETT, D. L., and BELL, R. W., 2000, Geologically related variations insaturated hydraulic conductivity in the regolith of the western Wheatbelt of Western Australia and its implications forthe development of dryland salinity: Australian Journal of Soil Research, 38, 555-568.
DE SILVA, J., SMITH, R. A., RUTHERFORD, J. L., and YE, L., 2001, Hydrogeology of the Blackwood RiverCatchment: Water and Rivers Commission, Science and Evaluation Division, Report HG 6.
DOGRAMACI, S. S., 1999, Lake Toolibin drilling program—bore completion report and pumping test data: Water andRivers Commission, Hydrogeology Report No. 139.
FERDOWSIAN, R. GEORGE, R. J., LEWIS, M. F., McFARLANE, D. J., SHORT, R., and SPEED, R., 1996, Theextent of dryland salinity in Western Australia, Productive Use of Saline Lands Conference: Albany, Western Australia,89-97.
FREEZE, B., and CHERRY, J., 1979, Groundwater: Prentice-Hall Inc, pp. 604.
GEORGE, G., 2000, Preliminary Evaluation of the SALTMAP™ geophysical system in a deeply-weathered andpartially salt-affected landscape at Toolibin: Western Australia, AgWest Report.
GEORGE, R. J., and DOGRAMACI, S., 2000, Toolibin—A life and death struggle for the last freshwater Wheatbeltlake: Hydro 2000, 3rd International Hydrology and Water Resources Symposium of The Institution of Engineers,Australia, Vol. 2, 733-738.
HINGSTON, F. J. and GAILITIS, V., 1976, The geographic variation of salt precipitated over Western Australia:Australian Journal of Soil Research, 14, 319-335.
HUNDI, N., and MAUGER, G., 2001, Salinity risk assessment of Mobrup subcatchment: Water and RiversCommission, Science and Evaluation Division, Land Use Impacts Series LUI 1.
JOHNSTON, C. D., 1987, Distribution of environmental chloride in relation to subsurface hydrology: Journal ofHydrology, 94, 67-88.
LAND ASSESSMENT, 1999, Land evaluation study Spencer Gully area Collie River Recovery Catchment: Report No.9910.
MARTIN, M., 1984, Analysis of a pumping test from the Darling Range, eastern Collie area, Western Australia:Geological Survey of Western Australia, Record 1985/5.

Engineering options in the Spencer Gully catchment SLUI 5 Salinity and Land Use Impacts Series
38
MATTA, J., 2000, The Rural Towns Program Groundwater Modelling: The Merredin Catchment: ResourcesManagement Technical Report, Department of Agriculture, Western Australia.
MAUGER, G., AUST, A., 1996, Modelling dryland salinity with the M.A.G.I.C. system: Western Australia Water andRivers Commission, Water Resources Technical Series WRT 7.
MAUGER, G., BARI, M., DIXON, R., DOGRAMACI, S., and PLATT, J., 2001, Salinity Situation Statement—CollieRiver, Western Australia Water and Rivers Commission, Water Resources Technical Series WRT 29.
MAZOR, E., and GEORGE, R., 1992, Marine airborne salts applied to trace evaporation, local recharge and lateralgroundwater flow in Western Australia: Journal of Hydrology, 139, 63-77.
McCREA, A. F., ANAND, R. R., and GILKES, R. J., 1990, Mineralogical and physical properties of lateritic pallidzone materials developed from granite and dolerite: Geoderma, v. 47, p. 33–57.
MICHAEL, G., McDONALD, G., HARBAUGH, A., 1988, A Modular Three-Dimensional Finite-Difference Ground-water Flow Model: Techniques of Water-Resources Investigations of the United States Geological Survey, Book 6,Modeling Techniques.
NULSEN, R. A., 1981, Critical depth to saline groundwater in non-irrigated situations: Australian Journal of SoilResearch, 19, 83-96.
NULSEN, B., 1998, Groundwater Trends in the Agricultural area of Western Australia: Resources ManagementTechnical Report No 173, Natural Resources Management Services, Agriculture Western Australia, South Perth,Western Australia.
PECK, A.J., 1978, Note on the role of a shallow aquifer in dryland salinity: Australian Journal of Soil Research, 16,237-240.
PECK, A. J., 1983a, Response of groundwaters to clearing in Western Australia: International Conference onGroundwater Management, Australia Vol. 2, 327-335
PECK, A. J., 1983b, Spatial variation of hydraulic conductivity of deeply weathered soils in Western Australia:Agriculture Water Management, 76:891-896.
PECK, A.J., and WILLIAMSON, D. R., 1987, Effects of forest clearing on groundwater: Journal of Hydrology, 94, 47-66.
PECK, A. J., WILLIAMSON, D. R., BETTENAY, E., and DIMMOCK, G. M., 1973, Salt and water balances of somecatchments in the South-West Coast drainage Division: Hydrology Symposium, Australian National ConferencePublications, No. 73/3: 1-4.
PUBLIC WORKS DEPARTMENT, WESTERN AUSTRALIA, 1979, Collie River Salinity Control.
RUPRECHT, J. K., and SCHOFIELD, N. J., 1989, Analysis of stream flow generation following deforestation insouthwest Western Australia: Journal of Hydrology, 105, 1-17.
RUPRECHT, J. K., and SCHOFIELD, N. J., 1991a, Effects of partial deforestation on hydrology and salinity in highsalt storage landscapes. II Strip, soils and parkland clearing: Journal of Hydrology, 129, 39-55.

Salinity and Land Use Impacts Series Engineering options in the Spencer Gully catchment SLUI 5
39
RUPRECHT, J. K., and SCHOFIELD, N. J., 1991b, Effects of partial deforestation on hydrology and salinity in highsalt storage landscapes, I Extensive block clearing: Journal of Hydrology, 129, 19-38.
SCHOFIELD, N. J., 1988, Predicting the effects of land disturbances on stream salinity in south-west WesternAustralia: Australian Journal of Soil Research, v. 26, 425-438.
SCHOFIELD, N. J., and RUPRECHT, J. K., 1989, Regional analysis of stream salinisation in southwest WesternAustralia: Journal of Hydrology, 112, 18-38.
SHORT, R., and McCONNELL, C., 2001, Extent and Impact of Dryland Salinity: Department of Agriculture,Resources Management Technical Report 202.
WILDE, S. A., and WALKER, I. W., 1982, 1:250 000 Geological series–explanatory notes, Collie: Western AustraliaGeological Survey.
WILLIAMSON, D., STOKES, R., and RUPRECHT, J., 1987, Response of input and output of waters and chloride toclearing for agriculture: Journal of Hydrology, 94, 1-28.

Engineering options in the Spencer Gully catchment SLUI 5 Salinity and Land Use Impacts Series
40

Engineering options in the Spencer Gully catchment SLUI 5 Salinity and Land Use Impacts Series
40
Publication Feedback Form
The Water and Rivers Commission welcomes feedback to help us to improvethe quality and effectiveness of our publications. Your assistance incompleting this form would be greatly appreciated.
Please consider each question carefully and rate them on a 1 to 5 scale,where 1 is poor and 5 is excellent (please circle the appropriate number).
How did you rate the quality of information?1 2 3 4 5
How did you rate the design and presentation of this publication?
1 2 3 4 5How can it be improved?
1 2 3 4 5.....................................................................................................................How effective did you find the tables and figures in communicating the data?
1 2 3 4 5How can they be improved?
.....................................................................................................................
.....................................................................................................................
.....................................................................................................................How did you rate this publication overall?
1 2 3 4 5If you would like to see this publication in other formats, please specify. (Eg. CD)
.....................................................................................................................Please cut along the dotted line on the left and return your completed response to:
Publications CoordinatorWater and Rivers CommissionLevel 2, Hyatt Centre3 Plain StreetEast Perth WA 6004Fax: (08) 9278 0639


WATER AND RIVERS COMMISSION
Hyatt Centre3 Plain Street
East PerthWestern Australia 6004
Telephone (08) 9278 0300Facsimile (08) 9278 0301
Website: www.wrc.wa.gov.au