![metabolic fuel preference in skeletal muscle€¦ · ifen-inducible Cre recombinase (MerCreMer [MCM]) under the control of the skeletal muscle α-actin pro-moter (Ska-MCM; Figure](https://static.fdocuments.in/doc/165x107/5ead916bf86d8c108c1218e5/metabolic-fuel-preference-in-skeletal-muscle-ifen-inducible-cre-recombinase-mercremer.jpg)
Engineering of a background-less inducible Cre-recombinase by ...
25
Journal of Cell Science • Advance article © 2016. Published by The Company of Biologists Ltd. This is an Open Access article distributed under the terms of the Creative Commons Attribution License (http://creativecommons.org/licenses/by/3.0), which permits unrestricted use, distribution and reproduction in any medium provided that the original work is properly attributed. RESEARCH ARTICLE Nanog induces suppression of senescence via down-regulation of p27 KIP1 expression Bernhard Mnst 1,5,* , Marc Christian Thier 1,6,* , Dirk Winnemöller 1,7,* , Martina Helfen 1,7 , Rajkumar P. Thummer 1,4 ‡ , and Frank Edenhofer 1,2,3‡ 1 Stem Cell Engineering Group, Institute of Reconstructive Neurobiology, University of Bonn - Life & Brain Center and Hertie Foundation, Sigmund-Freud Str. 25, 53127 Bonn, Germany 2 Stem Cell and Regenerative Medicine Group, Institute of Anatomy and Cell Biology, Julius-Maximilians-University Würzburg, Koellikerstrasse 6, 97070 Würzburg, Germany 3 Department of Genomics, Stem Cell Biology & Regenerative Medicine, Institute of Molecular Biology, Leopold-Franzens-University Innsbruck, Technikerstraße 25, 6020 Innsbruck, Austria. 4 Department of Biosciences and Bioengineering, Indian Institute of Technology Guwahati, Guwahati 781039, Assam, India. 5 Present address: Merck Life Science GmbH, Lilienthalstr. 16, 69214 Eppelheim, Germany. 6 Present address: Division of Stem Cells and Cancer, Deutsches Krebsforschungszentrum (DKFZ), Im Neuenheimer Feld 280, 69120 Heidelberg, Germany. 7 Present address: Miltenyi Biotec, Friedrich-Ebert-Str. 68, 51429 Bergisch Gladbach, Germany * These authors contributed equally to this work. ‡ Authors for correspondence ([email protected]; [email protected]; www.reprogramming.eu) KEY WORDS: Embryonic stem cell, Protein transduction, Pluripotency, Senescence, Cell reprogramming, p27 KIP1 JCS Advance Online Article. Posted on 21 January 2016
Transcript of Engineering of a background-less inducible Cre-recombinase by ...

Jour
nal o
f Cel
l Sci
ence
• A
dvan
ce a
rtic
le
© 2016. Published by The Company of Biologists Ltd.
This is an Open Access article distributed under the terms of the Creative Commons Attribution License (http://creativecommons.org/licenses/by/3.0), which permits unrestricted use, distribution and reproduction in any medium provided that the
original work is properly attributed.
RESEARCH ARTICLE
Nanog induces suppression of senescence
via down-regulation of p27KIP1 expression Bernhard Munst1,5,*, Marc Christian Thier1,6,*, Dirk Winnemöller1,7,*, Martina
Helfen1,7, Rajkumar P. Thummer1,4 ‡, and Frank Edenhofer1,2,3‡
1Stem Cell Engineering Group, Institute of Reconstructive Neurobiology, University of Bonn - Life & Brain Center and Hertie Foundation, Sigmund-Freud Str. 25, 53127 Bonn, Germany
2Stem Cell and Regenerative Medicine Group, Institute of Anatomy and Cell Biology, Julius-Maximilians-University Würzburg, Koellikerstrasse 6, 97070 Würzburg, Germany
3Department of Genomics, Stem Cell Biology & Regenerative Medicine, Institute of Molecular Biology, Leopold-Franzens-University Innsbruck, Technikerstraße 25, 6020 Innsbruck, Austria. 4Department of Biosciences and Bioengineering, Indian Institute of Technology Guwahati, Guwahati 781039, Assam, India. 5Present address: Merck Life Science GmbH, Lilienthalstr. 16, 69214 Eppelheim, Germany. 6Present address: Division of Stem Cells and Cancer, Deutsches Krebsforschungszentrum (DKFZ), Im Neuenheimer Feld 280, 69120 Heidelberg, Germany. 7Present address: Miltenyi Biotec, Friedrich-Ebert-Str. 68, 51429 Bergisch Gladbach, Germany
*These authors contributed equally to this work. ‡Authors for correspondence ([email protected]; [email protected]; www.reprogramming.eu)
KEY WORDS: Embryonic stem cell, Protein transduction, Pluripotency,
Senescence, Cell reprogramming, p27KIP1
JCS Advance Online Article. Posted on 21 January 2016
Jour
nal o
f Cel
l Sci
ence
• A
dvan
ce a
rtic
le
ABSTRACT
A comprehensive analysis of the molecular network of cellular factors establishing and
maintaining pluripotency as well as self renewal of pluripotent stem cells is key for further
progress in understanding basic stem cell biology. Nanog is necessary for the natural
induction of pluripotency in early mammalian development but dispensable for both, its
maintenance as well as its artificial induction. To gain further insight into the molecular
activity of Nanog we analyzed the gain-of-function of Nanog in various cell models
employing a recently developed biologically active recombinant cell-permeant protein,
Nanog-TAT. We found that Nanog enhances proliferation of both, NIH 3T3 as well as
primary fibroblast cells. Nanog transduction into primary fibroblasts results in suppression of
senescence-associated -galactosidase activity. Investigation of cell cycle factors revealed
that transient activation of Nanog correlates with consistent down-regulation of cell cycle
inhibitor p27KIP1. By chromatin immunoprecipitation analysis we confirmed bona fide Nanog
binding sites upstream to the p27KIP1 gene, establishing a direct link between physical
occupancy and functional regulation. Our data demonstrates that Nanog enhances
proliferation of fibroblasts via transcriptional regulation of cell cycle inhibitor p27 gene.

Jour
nal o
f Cel
l Sci
ence
• A
dvan
ce a
rtic
le
INTRODUCTION
Pluripotent stem cells, such as embryonic stem (ES) and induced pluripotent stem (iPS) cells,
have tremendous potential in developmental biology as well as regenerative medicine due to
their unlimited self renewal and unrestricted differentiation capacity. A thorough
understanding of the molecular network of cellular factors, extracellular and intracellular
signaling pathways, cell cycle regulation and microenvironment establishing and maintaining
self-renewal, pluripotency is key for the development of biomedical applications of stem cells
(Boyer et al., 2005; Cox et al., 2011; Loh et al., 2006; Lowry and Quan, 2010). Establishment
and maintenance of stem cell identity particularly pluripotency is regulated by a core network
of transcription factors. Oct4, Sox2 and Nanog belong to this transcriptional circuit that plays
a pivotal role in self-renewal and maintenance of pluripotency (Chen et al., 2008; Chambers
and Tomlinson, 2009; He et al., 2009; Pauklin et al., 2011). In concert with Oct4 and Sox2,
Nanog governs pluripotent features in mouse and human cells (Boyer et al., 2005; Loh et al.,
2006) by occupying the promoters of active genes encoding transcription factors, signal
transduction components, and chromatin-modifying enzymes. Expression of Oct4 and Sox2 is
relatively homogeneous in pluripotent cells whereas Nanog exhibits a heterogeneous
expression (Singh et al., 2007), with cells having elevated levels of Nanog exhibiting efficient
self-renewal.
The homeodomain transcription factor Nanog is expressed at early embryonic
development, in the inner cell mass, in ES cells as well as the in developing germline in
mammals (Chambers et al., 2003; Chambers et al., 2007; Mitsui et al., 2003). It has been
shown that ES cells are sensitive to the dosage of Nanog. Overexpression of Nanog is
sufficient to prevent the differentiation in ES cells in absence of feeders and vital extracellular
growth factors (Chambers et al., 2003; Darr et al., 2006; Mitsui et al., 2003). Downregulation
of Nanog in ES cells results in loss of pluripotency, reduction in cell proliferation and
differentiation towards extraembryonic lineages (Chambers et al., 2003; Hyslop et al., 2005;
Ivanova et al., 2006; Mitsui et al 2003; Zaehres et al., 2005). Additionally, cell fusion
experiments demonstrate that Nanog promotes the formation of pluripotent hybrids as Nanog
stimulates pluripotent gene activation in neural stem cells, thymocytes and fibroblasts in a
dose-dependent manner (Silva et al., 2006). Knockout studies revealed that Nanog is
dispensable for the housekeeping machinery of pluripotency since the conditional deletion of
Nanog in ES cells does unexpectedly not result in loss of pluripotency (Chambers et al.,
2007). During development in vivo, pluripotency is not established without Nanog and inner
cell mass cells are trapped in an intermediate stage (Silva et al., 2009) assigning Nanog an

Jour
nal o
f Cel
l Sci
ence
• A
dvan
ce a
rtic
le
essential role for the natural acquisition but not the maintenance of pluripotency (Pan and
Thomson, 2007; Saunders et al., 2013). Thus, a well-defined role of Nanog in self-renewal
and natural induction of pluripotency at molecular level remains to be investigated.
Inducible gain-of-function systems permitting a precise control over time and dosage
of gene products allow straightforward studies of stemness and cell reprogramming pathways
at the molecular level. Using protein transduction, we generated cell-permeant versions of
core pluripotency factors Oct4 and Sox2 proteins (Bosnali & Edenhofer, 2008) to generate
iPS cells (Thier et al., 2010; Thier et al., 2012a) and induced neural stem (iNS) cells (Thier et
al., 2012b). Recently, we reported a cell-permeant version of Nanog and demonstrated that it
promotes ES cell proliferation and self-renewal in absence of leukemia inhibitory factor by
inhibiting endodermal specification in a Stat3-independent manner (Peitz et al., 2014). Here
we set out to study the function of Nanog in somatic cells as a means to analyze its
contribution for self-renewal in cells in general and ES cells in particular. We show that
biologically active cell-permeant Nanog induces enhanced proliferation in fibroblasts.
Moreover, transient activation of Nanog consistently correlates with downregulation of cell
cycle kinase inhibitor p27KIP1. In addition, chromatin immunoprecipitation (ChIP) analysis
reveals two distinct putative Nanog binding sites upstream to the p27KIP1 gene. In conclusion,
our data suggests that Nanog as a potential regulator of p27 gene to enhance proliferation of
fibroblasts.
RESULTS
Nanog enhances proliferation of fibroblasts and induces anchorage-independent growth
We recently reported that cell-permeant recombinant Nanog protein enhances proliferation
and maintains pluripotency of mouse ES cells by inhibiting endodermal specification in the
absence of leukemia inhibitory factor (Peitz et al., 2014). Here we set out to use cell-permeant
recombinant Nanog as a gain-of-function paradigm in various cellular models in order to
assess a putative function of Nanog in somatic cells. NIH 3T3 cells are derived from the
mouse embryo and exhibit a strictly contact-inhibited growth of spindle-shaped cells in
culture. Nanog protein transduction into NIH 3T3 cells results in three-dimensional growth
and formation of cell foci (Fig. 1A) indicating anchorage-independent growth. Foci formation
is strictly dependent on the concentration and duration of exposure of Nanog-TAT (Fig.
1B,C). Maximal numbers of foci were observed upon application of 50nM Nanog-TAT for 5
days (Fig. 1C). In order to assess whether Nanog gain-of-function alone has an impact on the
stem cell transcriptional network in NIH 3T3 cells we analyzed a set of pluripotency-

Jour
nal o
f Cel
l Sci
ence
• A
dvan
ce a
rtic
le
associated genes by RT-PCR. This analysis revealed that Nanog protein transduction had no
impact on transcript levels of Oct4, Sox2 and Rex-1 (data not shown). To analyze the growth
kinetics of Nanog-transduced NIH 3T3 cells we determined cumulative cell numbers for 10
days. Nanog-TAT caused a strongly increased proliferation yielding about 4-fold more cells
within 10 days as compared to the control (Fig. 1D). To rule out putative pleiotropic effects
associated with the direct delivery of recombinant protein, we employed a cell-permeant
Nanog control protein lacking the homeodomain, designated Nanog-TAT. Nanog-TAT
failed to enhance proliferation of NIH 3T3 cells as determined by cumulative cell numbers
after 10 days of treatment as well as by quantification of foci formation (Fig. S1). To confirm
the anchorage-independent growth phenotype induced by full-length Nanog we assayed the
capability of Nanog-TAT-treated cells to grow in soft agar. The number and sizes of the
resulting colonies were quantified after 19 days. Nanog protein transduction resulted in
growth of more than 250 colonies in a 6 cm dish, 20% of them exceeding a diameter of 200
µm, whereas only few colonies were observed in case of the control (Fig. 1E,F). Both, foci
formation and growth in soft agar, indicate contact independent growth due to Nanog activity.
Oncogenes like ras are able to stably and irreversibly transform NIH 3T3 cells and we
asked whether the transient intracellular delivery of Nanog results in stable transformation as
well or represents a transiently occurring phenotype. To address this question, we applied
Nanog-TAT for a period of 8 days to NIH 3T3 cells, which led to foci formation. Cells were
then passaged and cultured in the presence or absence of Nanog-TAT. The foci formed in the
presence of Nanog-TAT were no longer detected after withdrawal of Nanog-TAT, indicating
that the transforming effect is a reversible process (Fig. 1G). It has been reported that the
overexpression of Eras induces a similar oncogenic transformation in somatic cells
(Takahashi et al., 2003) involving the Phosphatidylinositol 3-kinase (PI3K) cascade, which is
known to be important for both, transformation (Rodriguez-Viciana et al., 1997) and ES cell
propagation (Di Cristofano et al., 1998; Sun et al., 1999). Thus, we examined whether PI3K
inhibition does interfere with Nanog protein transduction. It turned out that Nanog-TAT is not
able to rescue the growth-inhibiting effect of PI3K suggesting that Nanog depends on PI3K
activity (Fig. 1H). In contrast, the transforming property of Nanog-TAT was only slightly
affected by PI3K inhibition. The ability to form foci was largely maintained although foci
formation was retarded due to the reduced proliferation of the cells (Fig. 1I). In conclusion,
our results demonstrate that Nanog induces loss of contact inhibition by a PI3K-independent
mechanism in NIH3T3 cells.

Jour
nal o
f Cel
l Sci
ence
• A
dvan
ce a
rtic
le
Next we studied the activity of Nanog protein in murine embryonic fibroblasts (Oct4-
GiP MEF) representing primary, non-transformed cell population. Nanog transduction
induced enhanced proliferation and morphological changes of low passage Oct4-GiP MEFs to
a more bipolar shape with an increased nuclear-cytoplasmic ratio (Fig. 1J). During long-term
culture control Oct4-GiP MEFs transitionally ceased to proliferate after 4-6 passages, but then
resumed expansion indicative of spontaneous transformation of the cells. Nanog-TAT-treated
Oct4-GiP MEFs in contrast kept dividing for at least 13 passages (more than 3.5 months)
(Fig. 1K. To check the chromosomal integrity we examined the karyotypes of untreated Oct4-
GiP MEF cultures (passage 3) and long-term-cultured cells (passage 14) incubated with or
without Nanog-TAT (Fig. 1L). We observed that all metaphases of untreated high-passage
cells adopted an aberrant mainly hypo-tetraploid karyotype. Nanog-transduced cells, in
contrast, predominantly maintained a normal karyotype, indicating that prolonged expansion
of Nanog-TAT treated cells is not a cause of aneuploidy.
Nanog suppresses replicative senescence in human primary fibroblasts
Next we investigated to which extent Nanog has the same effect on primary human cells.
With human primary adult dermal fibroblasts (MP-hADF) we observed an increased
proliferation rate after Nanog transduction, which mirrors the effect observed in MEFs.
Nanog‐TAT‐treated cells grew densely packed and adopted more spindle‐like shape and the
ratio of cytoplasm to nucleus declined. From a starting cell number of 250,000 cells, Nanog‐
TAT treated fibroblasts exhibit a final cumulative cell number of 8x10¹¹ after 10 passages. In
contrast, 250,000 MP‐hADF fibroblast cells cultured with control medium only give rise to
1.5x10⁹ after 10 passages (Fig. 2A). We reasoned that the capability to enhance proliferation
over extended passages might be due to Nanog-induced suppression of replicative
senescence. In order to analyze senescence in Nanog-transduced cells we determined
senescence-associated -galactosidase (SA--gal) activity as a means to quantify senescent
cells in culture (Dimri et al., 1995). About 6% of MP-hADF cultured under normal conditions
for 3 passages stained positive for SA--gal (Fig. 2B,C). In contrast, no SA--gal activity was
detectable in MP-hADF cultured in the presence of Nanog-TAT (Fig. 2B,C). These data
demonstrate that Nanog activity is able to suppress senescence in primary fibroblast cells.

Jour
nal o
f Cel
l Sci
ence
• A
dvan
ce a
rtic
le
Culture of MEFs with Nanog-TAT decreases p27KIP1 expression
In order to investigate the senescence-blocking effect induced by Nanog at molecular level we
analyzed the expression of cell cycle factors. For this, Oct4-GiP MEFs were cultured in low
serum conditions for G0 phase synchronization and treated thereafter with aphidicolin in
order to synchronize the cell population in S phase of the cell cycle. Oct4-GiP MEFs were
cultured with control medium and Nanog-TAT, respectively. After 5, 8, and 21 hours cells
were harvested and subjected to RT-PCR analysis. We analyzed a set of cell cycle factors
including p53, p16INK4a, p21CIP/WAF and p27KIP1. p53 is involved in DNA repair as well as
initiation of apoptosis in case DNA damage is irreparable. p16INK4a is one marker that can be
used for the identification of a senescent phenotype in cells. p21CIP/WAF and p27KIP1 are
proteins of the Cip/Kip family that are key cell cycle regulators by inhibiting Cdk2. Besides
this, p21CIP/WAF acts downstream of p53 in regulating transition through the cell cycle in G1
phase (El-Deiry et al., 1994). FGF receptor expression can indicate for a proliferative status in
fibroblast cells. RT-PCR analysis demonstrated that Nanog protein transduction did not yield
a significant modulation of the analyzed cell cycle factors except a modest down-regulation of
p27KIP1 (Fig. S2A). After 5 hours of Nanog-TAT treatment the RNA expression level of
p27KIP1 is slightly reduced to about 90% compared to fibroblasts cultured in control medium.
8 hours of Nanog-TAT application diminishes the expression of p27KIP1 to around 70%. After
21 hours of Nanog transduction we detected only about 25% p27KIP1 transcript as compared to
cells incubated with control media (Fig. S2A). To further determine the p27KIP1 modulation
quantitatively RT-qPCR analysis was performed. MEFs were synchronized in S phase of the
cell cycle and cultured with control medium and 100 nM Nanog-TAT for 2.5, 5 and 10 hours.
Cells were then harvested and subjected to RT-qPCR analysis. We observed gradual down-
regulation of p27KIP1 mRNA upon Nanog-TAT treatment (Fig. S2B). In order to further assess
cell cycle factor modulation also at protein level, cell lysates were prepared after 5 and 24
hours of Nanog transduction and subjected to immunoblot analysis. Immunoblotting analysis
confirmed that out of the factors analyzed p27KIP1 is consistently expressed at lower levels
after both, 5 and 24 hours of Nanog transduction (Fig. 2D,E). Quantification demonstrates
that 5 hours of Nanog transduction is sufficient to reduce the p27KIP1 protein level to about the
half. 24 hours of incubation with Nanog-TAT yielded a further decline of p27KIP1 to about
40% (Fig. 2E). In contrast Nanog transduction has no apparent effect on p21CIP/WAF, p53 and
Cyclin D1 levels. To further assess the specificity of this effect we employed the ΔNanog-
TAT protein as a control. It turned out that Nanog-TAT did not result in downregulation of

Jour
nal o
f Cel
l Sci
ence
• A
dvan
ce a
rtic
le
p27KIP1 expression at any time point investigated (Fig. 2F).
ChIP analysis reveals Nanog binding sites within the p27KIP1 locus
Thus far, our data indicate that Nanog is able to enhance proliferation and to suppress
senescence in somatic cells, along with consistently reduced p27KIP1 levels. We further asked
whether p27KIP1 is a direct transcriptional target of Nanog explaining the observed
downregulation of p27KIP1. Two studies using high-resolution massive parallel DNA
sequencing of chromatin immunoprecipitation (ChIP-seq) reported two Nanog binding sites
in the upstream region of the p27KIP1 gene (Fig. 3A; Chen et al., 2008; Marson et al., 2008).
To confirm Nanog binding to these sites, designated ‘D (primer pairs designated as D1 and
D2)’ and ‘P (primer pairs designated as P1 and P2)’ in the following, we performed ChIP
analysis using mouse ES cells. Oct4-GiP MEF cells served as a negative control since they do
not express Nanog. ChIP analysis with a Nanog specific antibody revealed amplification of
Nanog bound regions D and P upstream to the p27KIP1 as judged by both, semi-quantitative
PCR (Fig. 3B) and q-PCR analysis (Fig. 3C). Amplification was not observed using the Oct4-
GiP MEF control cells, beads only as well as unspecific IgG. Moreover, specificity is
confirmed by the observation that a desert control lying within the p27KIP1 gene was not
amplified (Fig. 3B). This observation confirms Nanog binding sites in the upstream region of
the p27KIP1 gene.
To demonstrate the binding of Nanog to these p27KIP1 upstream regions in fibroblasts
after protein transduction as well we applied 100nM of Nanog-TAT to Oct4-GiP MEFs.
Oct4-GiP MEF cells treated with vehicle only served as a negative control. ChIP analysis
employing a Nanog-specific antibody showed amplification of Nanog-bound regions
upstream to the p27KIP1 gene only in Oct4-GiP MEF cells transduced with Nanog (Fig. 3D).
This data demonstrates that Nanog binds to the upstream region of the p27KIP1 gene in Nanog-
TAT transduced fibroblasts indicating direct regulation of its expression.
DISCUSSION
In this study we set out to analyze a putative function of the pluripotency factor Nanog in
somatic cells. We employed a cell-permeant version of Nanog as a non-DNA based,
non-genetic paradigm to modulate cellular function. We found that Nanog protein
transduction enhances proliferation of both, NIH 3T3 as well as primary mouse and human
fibroblasts. Moreover, Nanog induces anchorage-independent growth of NIH 3T3 cells in a
dose- and time-dependent manner, otherwise typically exhibiting strict contact inhibition.

Jour
nal o
f Cel
l Sci
ence
• A
dvan
ce a
rtic
le
Previously it has been reported that genetic ectopic expression of Nanog in NIH 3T3 cells
shows an enhanced proliferation (Zhang et al., 2005) and foci formation as well as growth in
soft agar (Piestun et al., 2006). Nanog has also been reported to enhance proliferation and/or
self-renewal in other somatic and stem cell lines by regulating molecules involved in
stemness, cell cycle and senescence machinery (Cao et al., 2010 (adult human fibroblasts);
Choi et al., 2012 (embryonic carcinoma cells); Go et al., 2008 (mesenchymal stem cells);
Shan et al., 2012 (cancer stem cells); Tanaka et al., 2007 (hematopoietic stem cells)). Thus,
we conclude that our Nanog gain-of-function paradigm by direct protein delivery is functional
and induces loss of contact inhibition and gain in proliferation. Moreover, we demonstrate
that PI3K inhibition does not substantially affect induction of anchorage-independent growth,
whereas Nanog is not able to overcome the growth-inhibiting effect induced by PI3K
inhibition. In primary fibroblasts, Nanog protein transduction induces enhanced proliferation
enabling prolonged culture for more than 13 passages seemingly bypassing cellular
senescence. Indeed, we show that Nanog transduction into primary human fibroblasts results
in effective suppression of SA--gal activity, a widely used marker for senescence. The
expansion of primary human cells by transient transduction of Nanog protein might be of
general interest, in particular for in vitro expansion of cells.
Our study shows that Nanog protein transduction in mouse fibroblasts specifically
results in low expression of p27KIP1 both, at RNA and protein level, indicating a functional
link between the pluripotency transcriptional network and the cell cycle machinery. We
confirmed two putative Nanog binding sites in the 5’-UAS of the p27KIP1 gene (Chen et al.,
2008; Marson et al., 2008) by ChIP analyses both, in ES cells and Nanog-transduced MEF
cells. Recently, it has been reported that Oct4 represses p21 expression to contribute to ES
cell proliferation and self-renewal (Lee et al., 2010). p27KIP1 together with p21CIP/WAF
represent the major cyclin-dependent kinase inhibitors (CKIs) regulating G1 to S transition.
Ablation of p27KIP1 in mice results in multiorgan hyperplasia (Fero et al. 1996) and numerous
studies in vitro confirm a regulatory control of p27KIP1 over proliferation. Notably, ES cells do
lack the ability to undergo senescence and their growth is not subject to contact inhibition or
anchorage dependence. Given our observation that Nanog gain-of-function is able to suppress
contact inhibition and senescence while down-regulating p27KIP1 we provide a functional link
between Nanog and cell cycle regulator p27 gene at molecular level.

Jour
nal o
f Cel
l Sci
ence
• A
dvan
ce a
rtic
le
MATERIALS AND METHODS
Cell culture
NIH 3T3 MEF, Oct4-GiP MEF and primary human adult dermal MP fibroblasts (MP-hADF)
were cultured in Dulbecco's modified Eagle medium (DMEM, GIBCO, Life Technologies,
Paisley, UK) containing 10% fetal calf serum (FCS; GIBCO, Life Technologies, Paisley, UK)
and 100 U/ml penicillin and 0.1 mg/ml streptomycin (GIBCO, Life Technologies, Paisley,
UK). In all experiments medium was changed daily. Culture of Oct4-GiP ES cells (Oct4-GiP;
Ying et al., 2002) for ChIP analysis was performed on 0.1% gelatin-coated (Sigma-Aldrich,
St Louis, MO) dishes in high glucose DMEM (GIBCO, Life Technologies, Paisley, UK) with
15% FCS, 1% non-essential amino acids (GIBCO, Life Technologies, Paisley, UK), 1 mM
sodium pyruvate (GIBCO, Life Technologies, Paisley, UK), 2 mM L-glutamine (GIBCO,
Life Technologies, Paisley, UK) and 100 µM -mercaptoethanol (GIBCO, Life Technologies,
Paisley, UK) and 1000 U/ml Leukemia Inhibitory Factor (LIF; Millipore, Temecula, CA,
USA). Differentiated cells were counter-selected from Oct4-GiP ES cells by adding 1 µg/ml
puromycin (GIBCO, Life Technologies, Karlsruhe, Germany) for at least one week before an
experiment.
For growth curve analysis of Oct4-GiP MEF cells, 20,000 cells exhibiting passage
number 1 were plated in a 3.5 cm2 dish and cultured in the absence and presence of 50-100
nM Nanog-TAT over several passages. As soon as cells reached 80-90% confluency, the cells
were sub-cultures and again 20,000 cells were replated. After each passage, cells were
counted and the cumulative cell numbers were determined in order to assess the proliferation
rate.
For growth curve analysis of MP-hADF cells, 250,000 cells were seeded in a 6 cm
dish and cultured in the absence and presence of 100 nM Nanog-TAT over several passages.
As soon as cells reached 80-90% confluency, the cells were splitted and again 250,000 cells
were re-seeded. After each passage, cells were counted and the cumulative cell numbers were
determined in order to assess the proliferation rate.
For cell proliferation analysis of Oct4-GiP MEFs cultured with Nanog-TAT,
Nanog-TAT or control medium via RT-PCR or immunoblot, 750,000 cells exhibiting
passage number 5 were seeded on a 10 cm cell culture dish. In order to synchronize the
fibroblasts, cells underwent serum starvation, i.e. a concentration of 0.2% FCS, for 48 hours.
This led to an accumulation of cells in G0 phase of the cell cycle. Subsequently Oct4-GiP
MEFs were cultured in MEF medium containing 10% FCS, but the medium was

Jour
nal o
f Cel
l Sci
ence
• A
dvan
ce a
rtic
le
supplemented with 4 µg/mL aphidicolin (Sigma-Aldrich, St. Louis, MO, USA) for another 16
hours to finally synchronize cells in S phase of the cell cycle. Afterwards Oct4-GiP MEFs
were washed twice with PBS and cultured with 100 nM of Nanog-TAT, 50 nM of
Nanog-TAT or control medium for the indicated time points.
Plasmid construction and preparation of recombinant fusion proteins
Plasmid generation of the pTriEx1.1 vector harboring the genetic information of Nanog-TAT
(NLS-Nanog-TAT-H6) for expression and native purification of recombinant protein is
described elsewhere (Peitz et al., 2014). For NLS-Nanog-TAT-H6 (without the 60 aa long
homeodomain), PCR fragments encompassing the open reading frames for NLS-Nanog-
TAT-H6 (hereafter Nanog-TAT) flanked by NcoI-XhoI sites were synthesized and inserted
into the NcoI-XhoI sites of pTriEx1.1 (Novagen, UK). Native purification of Nanog-TAT
was performed as described elsewhere for Nanog-TAT (Peitz et al., 2014) with some
modifications. For bacterial over-expression of Nanog-TAT, overnight cultures (LB
containing 0.5% glucose and 50 µg/mL Carbenicillin) were inoculated with freshly
transformed BL21 (DE3) GOLD cells (Stratagene, La Jolla, CA, USA) and cultured at 30°C.
Expression cultures (TB containing 0.5% glucose and 100 µg/ml Ampicillin) were grown at
37°C and induced at an OD600 of 1.5 with 0.5 mM Isopropyl-β-D-thiogalactopyranoside
(IPTG) for 1h. Pellets were resuspended in lysis buffer (2 mM imidazole, 500 mM NaCl, 50
mM Na2HPO4, 5 mM Tris, pH 7.8) and lysozyme (Sigma-Aldrich, St. Louis, MO, USA) and
benzonase (Novagen, UK) was sequentially added, each for 20 minutes at 4°C. After a
centrifugation step the supernatant was incubated for 1h with 1 ml Ni-NTA slurry (Qiagen,
Hilden, Germany) per liter initial culture. The resin was packed in a gravity column, washed
(100 mM imidazole, 500 mM NaCl, 50 mM Na2HPO4, 5 mM Tris, pH 7.8) with 6 bed
volumes and eluted (250 mM imidazole, 500 mM NaCl, 50 mM Na2HPO4, 5 mM Tris, pH
7.8) with 8 bed volumes. Eluted fractions were successively dialyzed against PBS followed
by non-supplemented KnockOut-DMEM (GIBCO, Life Technologies, Paisley, UK).
Nanog protein transduction
Medium for transduction experiments was prepared by mixing Nanog dialysate fractions in a
ratio of 1:1 with double supplemented medium (AdvDMEM (GIBCO, Life Technologies,
Paisley, UK)) additionally supplemented with 2% FCS, 1% ITS (GIBCO, Life Technologies,
Paisley, UK), 1% non-essential amino acids, 4 mM glutamine and 200 µM -
mercaptoethanol). The mixture was incubated in a water bath for 2h at 37°C and cleared from

Jour
nal o
f Cel
l Sci
ence
• A
dvan
ce a
rtic
le
precipitations by centrifugation and sterile filtration. FCS was then added to a final
concentration of 5%. Final Nanog-TAT concentration in FCS containing medium was
determined via dot blot analysis with Nanog-TAT dialysis fraction serving as standard.
Foci formation and soft agar assay
NIH 3T3 cells were grown in the presence of Nanog-TAT in 12 well plates and seeded at low
density (103 cells/well). Untreated cells served as a control. Medium was changed every day.
After 8 to 10 days 3-dimensional foci were counted. For soft agar assays 6 cm petri-dishes
were covered with 5 ml of the appropriate medium containing 0.5% agarose. NIH 3T3 cells
were pre-incubated with or without Nanog-TAT for 6 days. 1x10⁴ cells were suspended in 2
ml of the appropriate medium containing 0.3% agarose with or without Nanog-TAT (25-100
nM) and added to each plate. We added 1 ml of control medium or medium containing
Nanog-TAT weekly, respectively. After 19 days of growth in soft agar the diameters of
colonies were measured and numbers of colonies were counted.
SA -Galactosidase (SA--gal) staining
For the analysis of SA--gal expression, MP-hADF at passage 16, already cultured with 100
nM of Nanog-TAT for 2 weeks were seeded at a density of 250,000 cells per 6 cm dish. The
next day, cells were fixed and stained for SA--gal expression (Dimri et al., 1995).
Karyotype analysis
80% confluent Oct4-GiP MEFs were incubated with 0.1 µg/ml colcemid (Gibco®
KaryoMAX® Colcemid™ Solution in HBSS; Grand Island, NY, USA) for 16 hours. Cells
were then trypsinized and resuspended in hypotonic KCl solution (0.075M), incubated for 10
min at room temperature and fixed with methanol/glacial acetic acid (3:1). Chromosomes
were visualized using Giemsa dye.
Western Blotting
For SDS-PAGE analysis, gels exhibiting a percentage of 10% or 15% (bis)acrylamide were
used. SDS-PAGE separated protein samples were blotted onto a nitrocellulose membrane
employing wet blot technique. Blotting was performed for 1h at 100V. For cell cycle analysis,
we employed the following antibodies: p21CIP/WAF (556431; mouse IgG, 1:200, BD
Pharmingen, Heidelberg, Germany), p27KIP1 (554069; mouse IgG, 1:200, BD Pharmingen,
Heidelberg, Germany), p53 (1C12; mouse IgG, 1:2000, Cell Signaling, Frankfurt, Germany),

Jour
nal o
f Cel
l Sci
ence
• A
dvan
ce a
rtic
le
and Cyclin D1 (DCS-6; mouse IgG, 1:200, BD Pharmingen, Heidelberg, Germany). Cyclin
D1 exhibits an additional band in immunoblot analysis. This phenomenon observed is due to
the rodent origin of cells, as stated in the datasheet provided by the manufacturer of the
antibody. As secondary antibody, we utilized HRP-linked anti-mouse IgG (7076; 1:200–
1:1000; Cell Signaling Technology, Frankfurt, Germany) antibody. Detection was carried out
with SuperSignal West Pico Chemiluminescent Substrate (PIERCE; IL, USA) or Supersignal
West Femto Chemiluminescent Substrate (PIERCE; IL, USA) respectively.
RT-PCR
RNA from aggregates or somatic cells was isolated with the SV Total RNA Isolation System
(Promega, Madison, USA), RNeasy Mini Kit (Qiagen Inc., Hilden, Germany) or Trizol
(Invitrogen), respectively, and reverse-transcribed with M-MLV Reverse Transcriptase,
RNase H Minus, Point Mutant (Promega, Madison, USA) or iScript reverse transcriptase
(Bio-Rad, Hercules, CA, USA). PCR reactions were performed using GoTaq (Promega,
Madison, USA). Primers used for RT-PCR are listed in Supplementary Table S1.
Chromatin immunoprecipitation (ChIP)
For ChIP analysis, Oct4-GiP MEF, Oct4-GiP ES cells were used. Proteins bound to DNA
were cross-linked using 1% formaldehyde for 7 min at room temperature followed by
quenching the fixation reaction by addition of glycine (0.125 M final concentration) for 5 min
at room temperature. After washing with ice-cold PBS, cells were collected by centrifugation
and were lysed in lysis buffer (50 mM Tris-HCl (pH 8.1), 10 mM EDTA, 0.1% SDS and
Complete protease inhibitors (Roche; IN, USA)) for 10 min on ice and further sonicated using
Bioruptor (Diagenode; CA, USA), centrifuged and the supernatant was frozen at -80°C. The
supernatant was thawed and 50 µg of chromatin was diluted 10 times in dilution buffer (16.7
mM Tris-HCl pH 8.0, 167 mM NaCl, 0.01% SDS, 1.1% Triton X-100, 1.2 mM EDTA and
complete protease inhibitors). 5 µg (10%) of input was taken as a control. Followed by
dilution, the protein-DNA complexes were immunoprecipitated overnight at 4°C with rotation
using primary antibodies Nanog (AB5731, Millipore, USA) and rabbit control IgG ChIP
grade (ab46540, Abcam, USA). Beads only were also taken as a negative control.
Immunoprecipitated chromatin was incubated with Protein A/G Plus agarose beads (sc-2003;
Santa Cruz Biotechnology, Santa Cruz, CA, USA) for another 1h at 4ºC and then washed 3
times with low salt washing buffer (20 mM Tris-HCl pH 8.0, 1% Triton X-100, 0.1% SDS,
150 mM NaCl, 2 mM EDTA, 0.01% Tween 20) and twice with high salt washing buffer (20

Jour
nal o
f Cel
l Sci
ence
• A
dvan
ce a
rtic
le
mM Tris-HCl pH 8.0, 1% Triton X-100, 0.1% SDS, 500 mM NaCl, 2 mM EDTA, 0.01%
Tween 20). The protein-DNA complexes bound to the beads were eluted by incubation with
elution buffer (1% SDS, 0.1M NaHCO3) and subsequently treated with RNAse (2 hours;
ConcertTM, Carlsbad, CA, USA) and Proteinase K (2 hours; Roche Mannheim, Germany).
Cross-linking was then reversed by incubation overnight at 65°C. Bound DNA was purified
by Wizard SV Gel and PCR clean-up kit (Promega, Madison, USA) and the eluted DNA was
then used for both semi-quantitative and q-PCR for analysis. Quantitative real-time PCR (q-
PCR) was performed using the SYBR-green Supermix (Bio-Rad, Hercules, CA, USA) on an
Eppendorf realplex Mastercycler and the data was analyzed using fold enrichment method.
Primers used for both semi-quantitative PCR and q-PCR to identify the putative Nanog
protein binding sites to the p27KIP1 genomic region regulating the p27KIP1 expression and the
desert control are listed in supplementary Table S2. Two biological replicates were performed
for this experiment. ChIP analysis following the above protocol was also performed on
Nanog-TAT transduced and non-transduced Oct4-GiP MEF (passage 3). Cells were washed
with heparin (0.5 mg/ml in PBS; Sigma-Aldrich, St. Louis, MO, USA) to remove non-
internalized protein before harvesting cells.
Statistical analysis
Statistical analysis to calculate p-value was carried out using a two-tailed test. The level of
significance was set to p < 0.05.

Jour
nal o
f Cel
l Sci
ence
• A
dvan
ce a
rtic
le
Acknowledgements
We thank Shinya Yamanaka, Austin Smith and Ian Chambers for providing materials and
scientific comments. We are grateful to Gunnar Schotta, University of Munich for helping
with ChIP analysis. We thank Nicole Russ and Martina Gebhardt for excellent technical
support.
Competing interests
The authors declare no potential conflicts of interest.
Author contributions
B.M., M.T., R.P.T. conception and design, collection and/or assembly of data, data analysis
and interpretation, manuscript writing, and final approval of manuscript; D.W., M.H.
conception and design, collection and/or assembly of data, data analysis and interpretation;
F.E. conception and design, financial support, collection and/or assembly of data, data
analysis and interpretation, manuscript writing, and final approval of manuscript.
Funding
This work was supported by grants from the Deutsche Forschungsgemeinschaft, DFG, (F.E.);
the German Ministry of Education and Research, BMBF (F.E.); the European Union (F.E.)
and by the IIT Guwahati Start-Up Grant (R.P.T.).

Jour
nal o
f Cel
l Sci
ence
• A
dvan
ce a
rtic
le
References Bosnali, M. and Edenhofer, F. (2008). Generation of transducible versions of transcription factors Oct4 and Sox2. Biol. Chem. 389, 851-61. Boyer, L. A., Lee, T. I., Cole, M. F., Johnstone, S. E., Levine, S. S., Zucker, J. P., Guenther, M. G.,
Kumar, R. M., Murray, H. L., Jenner, R. G. et al. (2005). Core transcriptional regulatory circuitry in human embryonic stem cells. Cell 122, 947-56.
Cao, J., Xiao, Z., Chen, B., Gao, Y., Shi, C., Wang, J. and Dai, J. (2010). Differential effects of recombinant fusion proteins TAT-OCT4 and TAT-NANOG on adult human fibroblasts. Frontiers in Biology 5, 424-430.
Chambers, I. and Tomlinson, S. R. (2009). The transcriptional foundation of pluripotency. Development 136, 2311-22. Chambers, I., Colby, D., Robertson, M., Nichols, J., Lee, S., Tweedie, S. and Smith, A. (2003). Functional expression cloning of Nanog, a pluripotency sustaining factor in embryonic stem cells. Cell 113, 643-55. Chambers, I., Silva, J., Colby, D., Nichols, J., Nijmeijer, B., Robertson, M., Vrana, J., Jones, K., Grotewold, L. and Smith, A. (2007). Nanog safeguards pluripotency and mediates germline development. Nature 450, 1230-4. Chen, X., Xu, H., Yuan, P., Fang, F., Huss, M., Vega, V. B., Wong, E., Orlov, Y. L., Zhang, W., Jiang, J. et al. (2008). Integration of external signaling pathways with the core transcriptional network in embryonic stem cells. Cell 133, 1106-17. Choi, S. C., Choi, J. H., Park, C. Y., Ahn, C. M., Hong, S. J. and Lim, D. S. (2012). Nanog regulates molecules involved in stemness and cell cycle-signaling pathway for maintenance of pluripotency of P19 embryonal carcinoma stem cells. J. Cell Physiol. 227, 3678-92. Cox, J.L., Mallana, S.K., Ormsbee, B.D., Desler, M., Wiebe, M.S. and Rizzino, A. (2011). Banf1 is required to maintain the self-renewal of both mouse and human embryonic stem cells. J. Cell Sci. 124, 2654-65. Darr, H., Mayshar, Y. and Benvenisty, N. (2006). Overexpression of NANOG in human ES cells enables feeder-free growth while inducing primitive ectoderm features. Development 133, 1193-201. Di Cristofano, A., Pesce, B., Cordon-Cardo, C. and Pandolfi, P. P. (1998). Pten is essential for embryonic development and tumour suppression. Nat. Genet.19, 348-55. Dimri, G. P., Lee, X., Basile, G., Acosta, M., Scott, G., Roskelley, C., Medrano, E. E., Linskens, M., Rubelj, I., Pereira-Smith, O. et al. (1995). A biomarker that identifies senescent human cells in culture and in aging skin in vivo. Proc. Natl. Acad. Sci. USA 92, 9363-7. el-Deiry, W. S., Harper, J. W., O'Connor, P. M., Velculescu, V. E., Canman, C. E., Jackman, J., Pietenpol, J. A., Burrell, M., Hill, D. E., Wang, Y. et al. (1994). WAF1/CIP1 is induced in p53-mediated G1 arrest and apoptosis. Cancer Res. 54, 1169-74. Fero, M. L., Rivkin, M., Tasch, M., Porter, P., Carow, C. E., Firpo, E., Polyak, K., Tsai, L. H., Broudy, V., Perlmutter, R. M. et al. (1996). A syndrome of multiorgan hyperplasia with features of gigantism, tumorigenesis, and female sterility in p27(Kip1)-deficient mice. Cell 85, 733-44. Go, M. J., Takenaka, C. and Ohgushi, H. (2008). Forced expression of Sox2 or Nanog in human bone marrow derived mesenchymal stem cells maintains their expansion and differentiation capabilities. Exp. Cell Res. 314, 1147-54. He, S., Nakada, D. and Morrison, S. J. (2009). Mechanisms of stem cell self-renewal. Annu Rev Cell Dev. Biol. 25, 377-406. Hyslop, L., Stojkovic, M., Armstrong, L., Walter, T., Stojkovic, P., Przyborski, S., Herbert, M., Murdoch, A., Strachan, T. and Lako, M. (2005). Downregulation of NANOG induces differentiation of human embryonic stem cells to extraembryonic lineages. Stem Cells 23, 1035-43. Ivanova, N., Dobrin, R., Lu, R., Kotenko, I., Levorse, J., DeCoste, C., Schafer, X., Lun, Y. and Lemischka, I. R. (2006). Dissecting self-renewal in stem cells with RNA interference. Nature 442, 533-8. Lee, J., Go, Y., Kang, I., Han, Y. M. and Kim, J. (2010). Oct-4 controls cell-cycle progression of embryonic stem cells. Biochem. J. 426, 171-81. Loh, Y. H., Wu, Q., Chew, J. L., Vega, V. B., Zhang, W., Chen, X., Bourque, G., George, J., Leong, B., Liu, J. et al. (2006). The Oct4 and Nanog transcription network regulates pluripotency in mouse embryonic stem cells. Nat. Genet. 38, 431-40.

Jour
nal o
f Cel
l Sci
ence
• A
dvan
ce a
rtic
le
Lowry, W.E. and Quan, W.L. (2010). Roadblocks en route to the clinical application of induced pluripotent stem cells. J. Cell Sci. 123, 643-51 Marson, A., Levine, S. S., Cole, M. F., Frampton, G. M., Brambrink, T., Johnstone, S., Guenther, M. G., Johnston, W. K., Wernig, M., Newman, J. et al. (2008). Connecting microRNA genes to the core transcriptional regulatory circuitry of embryonic stem cells. Cell 134, 521-33. Mitsui, K., Tokuzawa, Y., Itoh, H., Segawa, K., Murakami, M., Takahashi, K., Maruyama, M., Maeda, M. and Yamanaka, S. (2003). The homeoprotein Nanog is required for maintenance of pluripotency in mouse epiblast and ES cells. Cell 113, 631-42. Pan, G. and Thomson, J. A. (2007). Nanog and transcriptional networks in embryonic stem cell pluripotency. Cell Res. 17, 42-9. Pauklin, S., Pederson, R.A. and Vallier, L. (2011). Mouse pluripotent stem cells at a glance. J. Cell Sci. 124, 3727-32. Peitz, M., Munst, B., Thummer, R. P., Helfen, M. and Edenhofer, F. (2014). Cell-permeant recombinant Nanog protein promotes pluripotency by inhibiting endodermal specification. Stem Cell Res. 12, 680-9. Piestun, D., Kochupurakkal, B. S., Jacob-Hirsch, J., Zeligson, S., Koudritsky, M., Domany, E., Amariglio, N., Rechavi, G. and Givol, D. (2006). Nanog transforms NIH3T3 cells and targets cell-type restricted genes. Biochem. Biophys. Res. Commun. 343, 279-85. Rodriguez-Viciana, P., Warne, P. H., Khwaja, A., Marte, B. M., Pappin, D., Das, P., Waterfield, M. D., Ridley, A. and Downward, J. (1997). Role of phosphoinositide 3-OH kinase in cell transformation and control of the actin cytoskeleton by Ras. Cell 89, 457-67. Sato, T., Okumura, F., Ariga, T. and Hatakeyama, S. (2012). TRIM6 interacts with Myc and maintains the pluripotency of mouse embryonic stem cells. J. Cell Sci. 125, 1544-55. Saunders, A., Faiola, F. and Wang, J. (2013). Concise review: pursuing self-renewal and pluripotency with the stem cell factor Nanog. Stem Cells 31, 1227-36. Shan, J., Shen, J., Liu, L., Xia, F., Xu, C., Duan, G., Xu, Y., Ma, Q., Yang, Z., Zhang, Q. et al. (2012). Nanog regulates self-renewal of cancer stem cells through the insulin-like growth factor pathway in human hepatocellular carcinoma. Hepatology 56, 1004-14. Silva, J., Chambers, I., Pollard, S. and Smith, A. (2006). Nanog promotes transfer of pluripotency after cell fusion. Nature 441, 997-1001. Silva, J., Nichols, J., Theunissen, T. W., Guo, G., van Oosten, A. L., Barrandon, O., Wray, J., Yamanaka, S., Chambers, I. and Smith, A. (2009). Nanog is the gateway to the pluripotent ground state. Cell 138, 722-37. Singh, A. M., Hamazaki, T., Hankowski, K. E. and Terada, N. (2007). A heterogeneous expression pattern for Nanog in embryonic stem cells. Stem Cells 25, 2534-42. Sun, H., Lesche, R., Li, D. M., Liliental, J., Zhang, H., Gao, J., Gavrilova, N., Mueller, B., Liu, X. and Wu, H. (1999). PTEN modulates cell cycle progression and cell survival by regulating phosphatidylinositol 3,4,5,-trisphosphate and Akt/protein kinase B signaling pathway. Proc. Natl. Acad. Sci. USA 96, 6199-204. Takahashi, K., Mitsui, K. and Yamanaka, S. (2003). Role of ERas in promoting tumour-like properties in mouse embryonic stem cells. Nature 423, 541-5. Tanaka, Y., Era, T., Nishikawa, S. and Kawamata, S. (2007). Forced expression of Nanog in hematopoietic stem cells results in a gammadeltaT-cell disorder. Blood 110, 107-15. Thier, M., Munst, B. and Edenhofer, F. (2010). Exploring refined conditions for reprogramming cells by recombinant Oct4 protein. Int. J. Dev. Biol. 54, 1713-21. Thier, M., Munst, B., Mielke, S. and Edenhofer, F. (2012a). Cellular reprogramming employing recombinant sox2 protein. Stem Cells Int. 2012, 549846. Thier, M., Worsdorfer, P., Lakes, Y. B., Gorris, R., Herms, S., Opitz, T., Seiferling, D., Quandel, T., Hoffmann, P., Nothen, M. M. et al. (2012b). Direct conversion of fibroblasts into stably expandable neural stem cells. Cell Stem Cell 10, 473-9. Ying, Q. L., Nichols, J., Evans, E. P. and Smith, A. G. (2002). Changing potency by spontaneous fusion. Nature 416, 545-8. Zaehres, H., Lensch, M. W., Daheron, L., Stewart, S. A., Itskovitz-Eldor, J. and Daley, G. Q. (2005). High-efficiency RNA interference in human embryonic stem cells. Stem Cells 23, 299- 305. Zhang, J., Wang, X., Chen, B., Suo, G., Zhao, Y., Duan, Z. and Dai, J. (2005). Expression of Nanog gene promotes NIH3T3 cell proliferation. Biochem. Biophys. Res. Commun. 338, 1098-102.
Jour
nal o
f Cel
l Sci
ence
• A
dvan
ce a
rtic
le
Figures
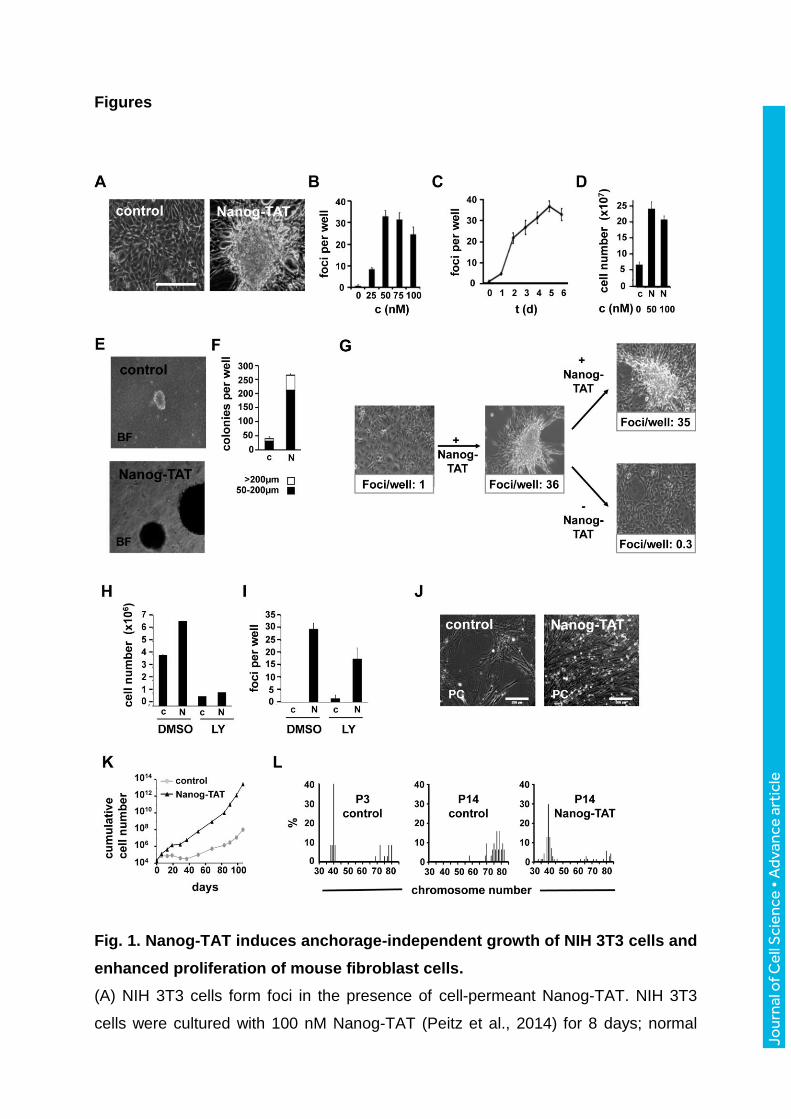
Fig. 1. Nanog-TAT induces anchorage-independent growth of NIH 3T3 cells and
enhanced proliferation of mouse fibroblast cells.
(A) NIH 3T3 cells form foci in the presence of cell-permeant Nanog-TAT. NIH 3T3
cells were cultured with 100 nM Nanog-TAT (Peitz et al., 2014) for 8 days; normal

Jour
nal o
f Cel
l Sci
ence
• A
dvan
ce a
rtic
le
medium served as control. (B) Foci formation is Nanog-TAT concentration
dependent. NIH 3T3 cells were cultured with different concentrations of Nanog-TAT
and numbers of foci per well were determined after 8 days. Data are means +/-
s.e.m. n = 3. (C) Time dependency of Nanog-TAT induced foci formation. NIH 3T3
cells were treated with 50 nM Nanog-TAT for 1–6 days as indicated and in the
following Nanog-TAT was withdrawn. Foci formation was quantified after a total
culture time of 6 days. Data are means +/- s.e.m. n = 3. (D) Effect of Nanog-TAT on
the proliferation of NIH 3T3 cells. To investigate the effects of Nanog-TAT on the
proliferation of NIH 3T3 cells, 7.5x10⁴ NIH3T3 cells were plated in 3.5 cm2 cell culture
dishes and cultured with Nanog-TAT for 10 days; normal medium served as control.
Equal cell numbers were replated on day 3 and 7. Cumulative cell numbers are
shown. Data are means +/- s.e.m., n = 3. c: control; N: Nanog-TAT. (E,F) Nanog-TAT
induces anchorage-independent growth in soft agar. NIH 3T3 cells grown for 6 days
with 100 nM Nanog-TAT or control media were cultured in soft agar. After 19 days
colonies with a diameter >50 µm and >200 µm were counted. Data are means +/-
s.e.m. n = 3. (G) Nanog-TAT induced foci formation is reversible. NIH 3T3 cells
growing as a monolayer in control media were suspended to a single cell suspension
and replated in the presence of Nanog-TAT. The resulting NIH 3T3 foci culture was
again replated as a single cell suspension and cultured in the presence or absence of
Nanog-TAT. Data of counted foci are means, n = 3. (H) Inhibition of growth
promoting effect of Nanog-TAT by PI3K inhibitor LY294002. NIH 3T3 cells were
cultured in media with or without 50 nM Nanog-TAT containing DMSO or 10 µM
LY294002 for 6 days. Equal cell numbers were replated on day 3. Cumulative cell
numbers are shown. Data are means +/- s.e.m., n = 3. (I) Foci formation of Nanog-
TAT treated NIH 3T3 cells in the presence and absence of LY294002. Foci were
counted after 6 days (mock) and after 9 days (LY294002). Data are means +/-
s.e.m., n = 3. c: control; N: Nanog-TAT; LY: PI(3)K-inhibitor LY294002; DMSO: di-
methylsulfoxide. (J,K) Primary Oct4-GiP MEF cells show enhanced proliferation in
the presence of Nanog-TAT. Oct4-GiP MEFs were cultured either in medium
containing Nanog-TAT (50–100 nM) or control medium for 106 days. Equal cell
numbers were replated after each passage and cumulative cell numbers were
determined. (J) 50 days old fibroblasts are shown in the phase contrast (scale bar
200 µm). A representative proliferation analysis via growth curve is depicted in (K).
(L) Nanog-TAT-induced bypass of cellular senescence is associated with
Jour
nal o
f Cel
l Sci
ence
• A
dvan
ce a
rtic
le
chromosomal stability in Oct4-GiP MEF cells. Metaphases of high passages (P14) of
Nanog-TAT treated (right) and untreated cells (middle) were prepared and
chromosomes counted. A low passage (P3) of untreated cells (left) served as a
control. Percentages of chromosome numbers per nuclei are given. Quantitative
evaluation of the counted metaphases (P3: n = 37; control P14: n = 32; Nanog-TAT
P14: n = 71).

Jour
nal o
f Cel
l Sci
ence
• A
dvan
ce a
rtic
le

Jour
nal o
f Cel
l Sci
ence
• A
dvan
ce a
rtic
le
Fig. 2. Nanog suppresses senescence in primary fibroblasts coinciding with
low levels of cell cycle kinase inhibitor p27KIP1.
(A) Human primary fibroblast cells (MP-hADF) show enhanced proliferation in the
presence of Nanog-TAT. Human fibroblasts were cultured in the medium containing
100 nM Nanog-TAT or in control MEF medium. Equal cell numbers were replated
after each passage and cumulative cell numbers were determined. A representative
proliferation analysis via growth curve is depicted. Cumulative cell numbers are
shown. (B) A significant portion of primary human dermal fibroblasts cultured with
control medium exhibit senescence-associated SA--gal activity whereas cells
cultured with 100 nM Nanog-TAT do not stain for SA--gal. Magnification for F: 20x;
BF: bright field. (C) The quantification of SA--gal positive cells in the absence or
presence of Nanog-TAT is depicted. 5.7% of cells cultivated with control medium are
positive for SA--gal, whereas no SA--gal positive cells could be observed in the
presence Nanog-TAT. (D,E) The expression levels of different key molecules
involved in the cell cycle control were assessed in response to Nanog protein
transduction. Oct4-GiP MEFs were synchronized and treated with Nanog-TAT-
supplemented medium (100 nM). After 5h and 24h, respectively, fibroblasts were
harvested and subjected to immunoblot analysis employing antibodies as depicted.
Fibroblasts treated with Nanog-TAT show no striking differences in expression of
p21CIP/WAF, p53, or Cyclin D1 compared to Oct4-GiP MEFs treated with control
medium. Actin served as a loading control. (E) Oct4-GiP MEFs were synchronized
and incubated with control medium or 100 nM Nanog-TAT. After distinct time points,
Oct4-GiP MEFs were harvested and subjected to immunoblot analysis with p27KIP1
antibody. A representative immunoblot is shown (top panel) showing that p27KIP1 is
consistently down-regulated upon Nanog-TAT treatment. Actin served as a loading
control. Densitometric analysis of p27KIP1 expression levels is presented (bottom
panel). n = 3. (F) Oct4-GiP MEFs were synchronized and incubated with medium
only (control), medium containing 50 nM control protein ∆Nanog-TAT as well as
Nanog-TAT for indicated periods of time. Upon culture of Oct4-GiP MEFs with
Nanog-TAT, p27KIP1 expression is down-regulated after 5h, 8h and 21h. Culture of
Oct4-GiP MEFs with ∆Nanog-TAT does not change protein expression levels of
p27KIP1 compared to cells treated with control medium (top). The immunoblot was
quantified densitometrically and quantification of p27KIP1expression is depicted

Jour
nal o
f Cel
l Sci
ence
• A
dvan
ce a
rtic
le
(bottom). After 5h of Nanog-TAT treatment the expression of p27KIP1 is decreased to
around 45%, after 8h p27KIP1 expression is reduced to approximately 70% and after
21h of Nanog-TAT culture p27KIP1 expression is diminished to around 65%.

Jour
nal o
f Cel
l Sci
ence
• A
dvan
ce a
rtic
le
Jour
nal o
f Cel
l Sci
ence
• A
dvan
ce a
rtic
le
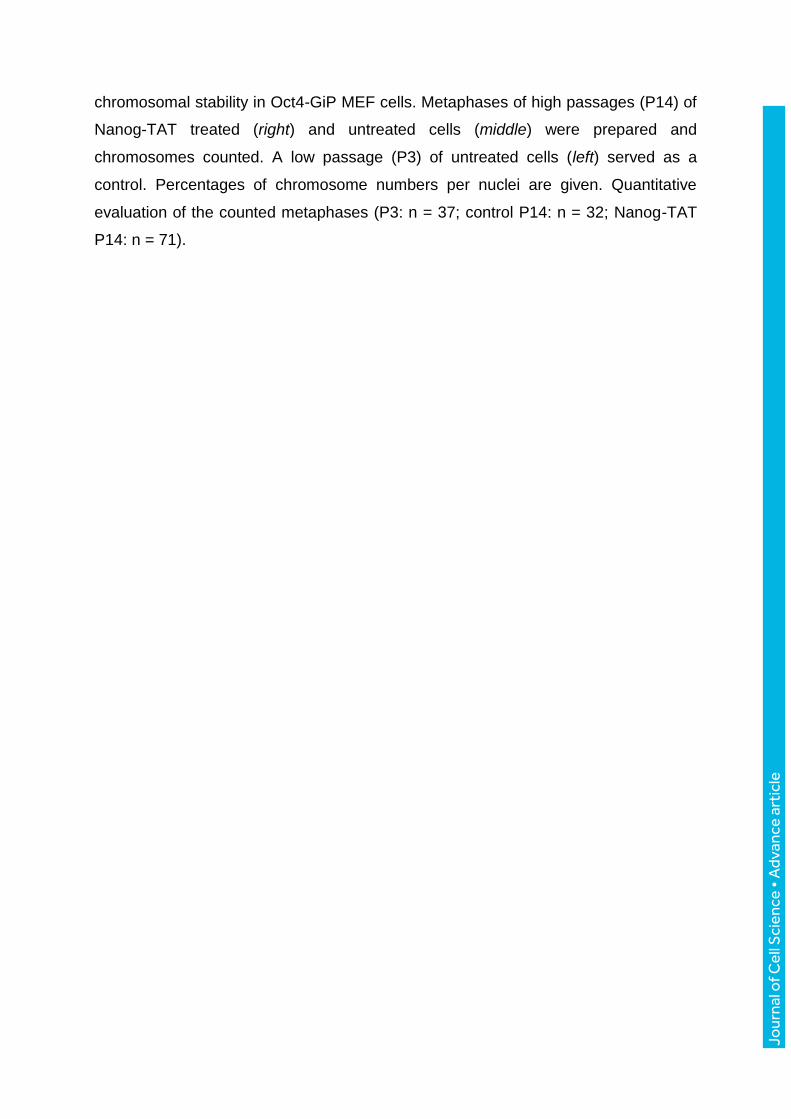
Fig. 3. ChIP analysis reveals Nanog binding sites regulating p27KIP1 expression.
(A) Schematic representation (not drawn to scale) of the p27 genomic locus (RefSeq:
NM_009875) highlighting the location of putative Nanog binding sites designated ‘D
(primer pairs designated as D1 and D2)’ and ‘P (primer pairs designated as P1 and
P2)’ in the upstream region of the p27 gene (Chen et al., 2008; Marson et al., 2008).
PCR primer pairs were designed for these sites for ChIP analyses (dumbbell shaped;
Table S2). (B) ChIP analysis reveals that Nanog protein in ES cells binds within the
upstream region of the p27 gene. Oct4-GiP MEF and Oct4-GiP ES cells were
cultured, harvested and processed for ChIP analysis with beads only, IgG and Nanog
antibody. Oct4-GiP MEF cell line was used as a negative control. Input DNA (10%)
was used as a control for ChIP. Beads only and IgG served as negative controls.
Putative Nanog binding regions were amplified by designed primer pairs (D1, D2, P1
and P2). Primer pairs were also designed randomly in the 3´UTR region of the p27
gene to serve as a negative (desert) control (Dc). (C) Quantitative PCR (q-PCR)
analysis on the ChIP samples explained in (B) using primers pairs of P1 and D1 to
amplify the Nanog binding p27KIP1 sites. q-PCR was also performed on the Dc primer
set but no amplification was observed other than the input samples (data not shown).
2 independent biological replicates were performed for ChIP analysis. Statistical
analysis to calculate p-value was carried out using a two-tailed test; p-value: ** p <
0.01. (D) Quantitative PCR (q-PCR) analysis on the ChIP samples explained in (B)
derived from MEF cells transduced with 100 nM Nanog-TAT. Non-transduced
fibroblasts kept in standard media served as controls. Oct4-GiP MEF (passage 3)
were treated with dialysis buffer only and with 100 nM Nanog-TAT for 10h, harvested
and processed for ChIP analysis with IgG and Nanog antibody. Cells were washed
with heparin to remove extracellularly bound Nanog-TAT protein before harvesting
fibroblasts. Input DNA (10%) was used as a control for the ChIP. IgG served as
negative control. Putative Nanog binding regions upstream to p27 transcriptional start
site were amplified by primer pairs (designated as D1, D2, P1 and P2; Table S2).
Primer pairs were also designed randomly in the 3´UTR region of the p27 gene to
serve as a negative (desert) control (Dc) but no amplification was observed other
than the input samples (data not shown). 2 independent biological replicates were
performed for ChIP analysis. Statistical analysis to calculate p-value was carried out
using a two-tailed test; p-value: * p < 0.05; ** p < 0.01; *** p < 0.001.


![RESEARCH ARTICLE OpenAccess Site-specificrecombinatorics ... · some facts about Cre Lox biology [44, 45]. Cre is a bacteriophage Pl recombinase that catalyzes site-specific recombination](https://static.fdocuments.in/doc/165x107/601a414c98c30837ed5c9986/research-article-openaccess-site-specificrecombinatorics-some-facts-about-cre.jpg)