Engineering Fracture Mechanics - Personal webpages at...
15
Numerical study on the effect of prestrain history on ductile fracture resistance by using the complete Gurson model P.A. Eikrem a,1 , Z.L. Zhang a, * , E. Østby b , B. Nyhus b a Department of Structural Engineering, Norwegian University of Science and Technology (NTNU), Trondheim, Norway b SINTEF Materials and Chemistry, Trondheim, Norway article info Article history: Received 28 November 2007 Received in revised form 16 May 2008 Accepted 23 May 2008 Available online 9 July 2008 Keywords: Ductile fracture Ductile crack growth Complete Gurson model Prestrain effect Pipeline steels abstract During installation and operation, pipeline steels may suffer from plastic pre-deformation (prestrain) due to accidental loading, cold bending or ground movement. The plastic pre- strain history not only modifies steels’ yield and flow properties but also influences their fracture performance. This paper focuses on the effect of plastic prestrain history on ductile fracture resistance. Single edge notched tension (SENT) specimens have been selected for the numerical study and the crack is assumed to exist before a prestrain history was applied. The complete Gurson model has been applied to simulate the ductile fracture behaviour. The results show that prestrain history can reduce the fracture resistance signif- icantly and neither the history-independent resistance model nor material-memory resis- tance model existing in the literature can be used to describe the prestrain history effect. Based on the numerical results an approximate history-dependent resistance model is pro- posed. The results also suggest that it is important to take the prestrain effect into consid- eration in future structural integrity assessment procedure for pipelines. Ó 2008 Elsevier Ltd. All rights reserved. 1. Introduction There are many engineering scenarios where steel components are subject to plastic deformation (prestrain) due to acci- dental loading, cold bending and ground movement and subsequent loading and deformation capacity of the components should be assessed. One of the scenarios is the pipe reeling process in the offshore industry. The reeling process is an efficient and economical way to install pipelines on the seabed, see Fig. 1. During the installation, welded pipes are reeled onto a drum, reeled off, aligned and straightened before it is deployed in the sea. During the process axial plastic deformation as large as 2–3% can occur in the pipe section. In order to properly tackle the problem, the distribution of the prestrain history over the pipe cross section should be precisely predicted first. The next step is to study the effect of the prestrain history on subsequent deformation and fracture behaviour. It is known that plastic deformation will not only modify the yield and strain hardening behaviour, but will also influence in a detrimental manner the local failure mechanisms, the initiation toughness and fatigue properties [1–9]. These findings indicate that the effect of plastic prestrain needs to be quantified. Today’s recommended practise ignores the prestrain effect [10]. Most of the studies carried out in the literature focus on the effect of a homogenous prestrain history on material’s frac- ture behaviour. The crack is then introduced after a homogenous prestrain history. In real pipe laying operation, cracks due to welding defects may exist before a reeling process is started and it is important to study how a reeling induced prestrain history affects the fracture resistance of an existing crack. 0013-7944/$ - see front matter Ó 2008 Elsevier Ltd. All rights reserved. doi:10.1016/j.engfracmech.2008.05.006 * Corresponding author. Tel.: +47 73592530. E-mail address: [email protected] (Z.L. Zhang). 1 Present address: StatoilHydro Research Centre, Trondheim, Norway. Engineering Fracture Mechanics 75 (2008) 4568–4582 Contents lists available at ScienceDirect Engineering Fracture Mechanics journal homepage: www.elsevier.com/locate/engfracmech
Transcript of Engineering Fracture Mechanics - Personal webpages at...

Engineering Fracture Mechanics 75 (2008) 4568–4582
Contents lists available at ScienceDirect
Engineering Fracture Mechanics
journal homepage: www.elsevier .com/locate /engfracmech
Numerical study on the effect of prestrain history on ductile fractureresistance by using the complete Gurson model
P.A. Eikrem a,1, Z.L. Zhang a,*, E. Østby b, B. Nyhus b
a Department of Structural Engineering, Norwegian University of Science and Technology (NTNU), Trondheim, Norwayb SINTEF Materials and Chemistry, Trondheim, Norway
a r t i c l e i n f o
Article history:Received 28 November 2007Received in revised form 16 May 2008Accepted 23 May 2008Available online 9 July 2008
Keywords:Ductile fractureDuctile crack growthComplete Gurson modelPrestrain effectPipeline steels
0013-7944/$ - see front matter � 2008 Elsevier Ltddoi:10.1016/j.engfracmech.2008.05.006
* Corresponding author. Tel.: +47 73592530.E-mail address: [email protected] (Z.L. Zha
1 Present address: StatoilHydro Research Centre, T
a b s t r a c t
During installation and operation, pipeline steels may suffer from plastic pre-deformation(prestrain) due to accidental loading, cold bending or ground movement. The plastic pre-strain history not only modifies steels’ yield and flow properties but also influences theirfracture performance. This paper focuses on the effect of plastic prestrain history on ductilefracture resistance. Single edge notched tension (SENT) specimens have been selected forthe numerical study and the crack is assumed to exist before a prestrain history wasapplied. The complete Gurson model has been applied to simulate the ductile fracturebehaviour. The results show that prestrain history can reduce the fracture resistance signif-icantly and neither the history-independent resistance model nor material-memory resis-tance model existing in the literature can be used to describe the prestrain history effect.Based on the numerical results an approximate history-dependent resistance model is pro-posed. The results also suggest that it is important to take the prestrain effect into consid-eration in future structural integrity assessment procedure for pipelines.
� 2008 Elsevier Ltd. All rights reserved.
1. Introduction
There are many engineering scenarios where steel components are subject to plastic deformation (prestrain) due to acci-dental loading, cold bending and ground movement and subsequent loading and deformation capacity of the componentsshould be assessed. One of the scenarios is the pipe reeling process in the offshore industry. The reeling process is an efficientand economical way to install pipelines on the seabed, see Fig. 1. During the installation, welded pipes are reeled onto adrum, reeled off, aligned and straightened before it is deployed in the sea. During the process axial plastic deformation aslarge as 2–3% can occur in the pipe section. In order to properly tackle the problem, the distribution of the prestrain historyover the pipe cross section should be precisely predicted first. The next step is to study the effect of the prestrain history onsubsequent deformation and fracture behaviour. It is known that plastic deformation will not only modify the yield andstrain hardening behaviour, but will also influence in a detrimental manner the local failure mechanisms, the initiationtoughness and fatigue properties [1–9]. These findings indicate that the effect of plastic prestrain needs to be quantified.Today’s recommended practise ignores the prestrain effect [10].
Most of the studies carried out in the literature focus on the effect of a homogenous prestrain history on material’s frac-ture behaviour. The crack is then introduced after a homogenous prestrain history. In real pipe laying operation, cracks dueto welding defects may exist before a reeling process is started and it is important to study how a reeling induced prestrainhistory affects the fracture resistance of an existing crack.
. All rights reserved.
ng).rondheim, Norway.

Fig. 1. Schematic plot of the pipe reeling process [9].
P.A. Eikrem et al. / Engineering Fracture Mechanics 75 (2008) 4568–4582 4569
Recently, a theoretical and experimental program has been carried out by Ernst et al. [6] to investigate the effect of pipereeling induced prestrain cycles on the ductile fracture resistance curve (R curve). Ernst et al. introduced two models to de-scribe the resistance curves with prestrain histories, a history-independent R curve and a material-memory R curve, seeFig. 2. The history-independent resistance model is used in today’s recommended practise [10]. In the history-independentresistance model the shape of the resistance curve is the same for all loading cycles, independent of the prestrain history. Ifcrack extension takes place in the current cycle the resistance curve is shifted towards the current crack length before thenext cycle starts. In the material-memory resistance model the resistance curve does not shift to a new origin from one cycleto another one. The crack driving force achieved in the previous cycle needs to be reached in the next cycle in order for fur-ther crack extension to take place. Although it was concluded that material-memory R curve seems to better fit their exper-imental results, the effect of prestrain history on the ductile fracture resistance is not well understood.
In this work, a numerical study has been carried out to investigate the effect of prestrain history on the crack resistancecurve. Modelling ductile crack growth needs an appropriate constitutive model which can describe the ductile fracturemechanism. In this regard, the complete Gurson model developed by the authors [11] has been utilized. 2D single edgenotched tension (SENT) specimens are specially selected for this study. Recently it has been demonstrated by Nyhus et al.[12] that the SENT specimen is a good representation of the pipe sections in terms of fracture toughness measurement. Bothsymmetrical and non-symmetrical prestrain cycles are investigated. Symmetrical prestrain cycles with amplitudes up to0.55% nominal strain have been considered. The non-symmetrical prestrain cycles considered consist of an elongation upto 0.6% nominal strain followed by a compression down to about the initial specimen length. Because of 2D plane strainmodels are used, the prestrain cycles considered are somewhat smaller and simpler then an actual reeling prestrain cycle.After the prestrain cycle the specimen was re-loaded by tension.
In the following, the specimen dimensions, constitutive equations used for modelling ductile crack growth and the finiteelement model will be briefly described first. In Section 3 the effect of basic parameters such as initial void volume fraction aswell as material hardening exponent on the resistance curve of materials without a plastic prestrain history is revisited. The
Fig. 2. (a) History-independent R curve and (b) material-memory R curve [6].

4570 P.A. Eikrem et al. / Engineering Fracture Mechanics 75 (2008) 4568–4582
results of plastic prestrain history on ductile fracture resistance as well as a new resistance model to consider the prestrainhistory effect are presented in Section 4. The paper is closed with summary and conclusions.
2. The complete Gurson model and numerical procedure
In this section, the complete Gurson model used for simulating ductile crack growth and its associated material param-eters, the numerical algorithms for implementing the complete Gurson model in ABAQUS, the details of the finite elementmodel as well as the procedures for calculating the crack driving forces and measuring the crack growth are presented.
2.1. The complete Gurson model
Engineering steel alloys inevitably contain secondary phases, inclusions and particles which will nucleate microvoids dur-ing plastic deformation. Ductile fracture is often the result of microvoid nucleation, growth and coalescence. Significant pro-gress has been made in developing constitutive models for elastic–plastic materials incorporating void mechanisms and thebest known constitutive model appears to be the one originally developed by Gurson [13] and later modified by Tvergaardand Needleman [14–16]. The Gurson model is in fact a void growth model. With the introduction of the so-called critical voidvolume fraction, the Gurson–Tverggard–Needleman model can consider the effect of void coalescence. However, the modelis lamed by the lack of a physical mechanism-based coalescence criterion. Application of the Gurson model as a predictivetool using realistic microvoid parameters demands a void coalescence criterion. Several analytical and theoretical void coa-lescence models are available in the literature [17–20]. Zhang and Niemi [21–22] have demonstrated that the plastic-limitload based coalescence model by Thomason [17] is easy to implement and very accurate compared with the finite elementresults by Koplik and Needleman [23]. By combing the Gurson–Tvergaard–Needleman model for void growth and Thoma-son’s plastic limit load model for coalescence a so-called complete Gurson model has been proposed by Zhang et al.[11,24]. One of the important advantages of the complete Gurson model is that we do not need to select or determinethe critical void volume fraction before hand. The critical void volume fraction is not a material parameter any more. It isa result of plastic deformation and is determined automatically by the plastic-limit load model. With the complete Gursonmodel ductile fracture is exclusively linked to the void nucleation parameter(s) and the mesh size. Here mesh size is explic-itly related to materials characteristic length parameter. Latest study has shown that artificially selected critical void volumefraction can give contradictory results [25].
The yield function of the Gurson–Tvergaard–Needleman model [13–16] has the following form:
/ðq;rf ; f ;rmÞ ¼q2
r2f
þ 2q1f cosh3q2rm
2rf
� �� 1� ðq1f Þ2 ¼ 0 ð1Þ
where f is the void volume fraction, rm is the mean stress, q is the von Mises stress, rf the flow stress. q1 and q2 are param-eters introduced by Tvergaard [14–15] to modify the original Gurson model [13]. Fixed value of q1 = 1.5 and q2 = 1.0 are usedin this study. Due to the incompressible nature of the matrix material the growth of existing voids can be expressed as
dfgrowth ¼ ð1� f Þd�ep : I ð2Þ
where �ep is the plastic strain tensor and I is the second-order unit tensor.There are several void nucleation models we can use [11]. In this study a cluster void nucleation model [11,24] has been
selected. It assumes that all the microvoids will be nucleated in the beginning of plastic deformation and the increase in voidvolume fraction is solely due to the growth of existing voids. The critical void volume fraction (fc) is automatically deter-mined by Thomason’s plastic limit load criterion [17]. For 2D plane strain problem, Thomason’s plastic limit load criterionstates that coalescence occurs when the following condition is satisfied:
r1
rf¼ 0:3
r=ðR� rÞ þ 0:6 ð3Þ
In Eq. (3) r1 is the maximum principal stress, r and R are current average void radius and intervoid distance which can becalculated from the current principle strains. Readers are referred to [11,24] for a full account of the complete Gurson model.Thomason’s plastic limit model was based on slip-line theory with rigid-plastic materials. Recently Pardoen and Hutchinson[18] and Zhang et al. [11] have shown that Thomason’s criterion can be further improved to consider the plastic strain hard-ening. In the present study the original Thomason criterion is used and the effect of strain hardening on the prediction ofcrack resistance has been studied in detail and is reported in a separate study [25].
The post-coalescence deformation behaviour of the Gurson model is numerically simulated by an artificial acceleration ofvoid growth, as suggested by Tvergaard and Needleman [14]:
f � ¼f for f 6 fc
fc þ f �u�fcfF�fcðf � fcÞ for f > fc
(ð4Þ
where f �u = 1/q1 and fF is the void volume fraction at the end of void coalescence, fF = 0.15 + 2f0, where f0 is the initial voidvolume fraction [11]. When the coalescence started and f > fc, f � replaces f in Eq. (1). It should be noted that the critical void

w
2L
a
Fig. 3. (a) Schematic plot of the SENT specimen and (b) the finite element model used in the analyses.
P.A. Eikrem et al. / Engineering Fracture Mechanics 75 (2008) 4568–4582 4571
volume fraction determined by the complete Gurson model in the present study is around 2–3%, which is much smaller thanthe one used by Xia and Shih [26] that is 20%.
The stress–strain behaviour of the matrix material which is part of the specification of the complete Gurson model ischaracterized by the following power law hardening model:
2 A fr
rf ¼ r0 1þ ep
e0
� �n
ð5Þ
where r0 is the yield stress, ep the equivalent plastic strain, e0 the yield strain and n the hardening exponent. Eq. (5) statesthat n ? 0 corresponds to an elastic-perfectly plastic solid. In this study, r0 = 400 MPa, Young’s modulus E = 200 GPa andPoisson ratio m = 0.3 are fixed and independent of the hardening and plastic strain history.
2.2. Implementation of the complete Gurson model
The complete Gurson model is implemented into the ABAQUS using a set of generalized-midpoint algorithms developedby Zhang via the material user subroutine UMAT2 [27–29]. Aravas [30] first presented an Euler backward algorithm for theGurson model and derived an equation for calculating the consistent-tangent-moduli. However, this equation involves matrixinversion which is not efficient and not possible for non-hardening materials. Zhang [27] proposed a family of the generalized-midpoint algorithms for the Gurson model and an explicit equation with seven constants for calculating the consistent tangentmoduli is presented [28–29]. This equation does not involve any matrix inversion and has thus avoided the singularity problem.It was concluded that the Euler backward algorithm which is used in this study, may not be the most accurate but may be thebest choice for many practical applications in terms of the balance between accuracy and efficiency [28–29].
2.3. Specimen geometry and FE mesh
The single edge notched tension (SENT) specimens have been chosen for the present study. Same specimens were used inthe previous study on the effect of prestrain on the crack tip constraint [9]. The geometry and the finite element mesh of theSENT specimen are schematically shown in Fig. 3. The specimen width (w) is fixed 28 mm and half length (L) is 115 mm.Because of the symmetry, only half of the SENT specimen is modelled. Close to the crack tip a rectangular region (7.1 mmahead of the initial crack tip and 0.8 mm above the symmetrical line) with uniform mesh size 0.1 � 0.1 mm is created. Simple4-noded 2D plane strain elements have been used. Nonlinear geometry effects (NLGEOM in ABAQUS) are accounted for in theanalyses. An initial crack opening 0.02 mm is applied for all the models. Three initial crack sizes (a) have been considered;a/w = 0.14, 0.26 and 0.60. The specimen dimensions and applied loading have been chosen such a way that buckling duringcompression is avoided. A remote homogenous displacement controlled (clamped) boundary condition was used. During theprestrain cycle the crack faces can be partly closed. A rigid analytical plane is defined in the model to simulate the contact ofcrack faces. The rigid plane is shown in Fig. 3b as a horizontal line.
ee copy of the ABAQUS UMAT Fortran code can be obtained from the corresponding author.

4572 P.A. Eikrem et al. / Engineering Fracture Mechanics 75 (2008) 4568–4582
Because the J-integral is not well suited for cyclic plasticity problem, the CTOD has been used as the crack driving forceparameter. It is known that for monotonic loading and nonlinear elastic material, an intrinsic relation between the CTOD andJ-integral exists [31]. However, this relation is not clear in the present prestrain history problem. The CTOD was selected as aresult of convenience, and it is beyond the scope of this paper to discuss which parameter is the most appropriate one for theprestrain problem.
2.4. Definition of crack initiation and propagation
In the simulation of crack growth using the complete Gurson model with ABAQUS, the element is not allowed to fail com-pletely and a residual stiffness is necessary to avoid numerical oscillation and non-convergence problem. In the present anal-ysis after critical void volume fraction is reached void growth continues until f � reaches 0:91f �u [11]. Then no further voidgrowth is allowed and the element can still have a small residual load carrying capacity.
The common way to estimate crack growth in a numerical simulation is to multiply the initial element length by thenumber of damaged elements, without accounting for the deformation of the damaged elements [11,26], see Fig. 4a. Con-sidering the fact that elements deform during crack growth, a new method to calculate the crack growth is used in this study.The crack growth is calculated as the absolute horizontal distance from the node above the initial crack tip to the node form-ing the current crack tip, see Fig. 4b. This technique generally predicts shorter crack growth (especially when the crack
0 0.5 1 1.5 2 2.5 30
0.2
0.4
0.6
0.8
1
1.2
1.4
CT
OD
(m
m)
Crack growth (mm)
Deformed Element TechniqueUndeformed Element Technique
Fig. 4. (a) The conventional method to calculate crack growth, (b) the new method used in this study and (c) comparison of the results by the two methodsfor, f0 = 0.005, q1 = 1.50 and q2 = 1.0.

P.A. Eikrem et al. / Engineering Fracture Mechanics 75 (2008) 4568–4582 4573
growth is large) at a given crack driving force due to element contraction, Fig. 4c. The crack growth calculated by this tech-nique should be more close to the crack growth measured in an experiment where the finite deformation is accounted for.
3. Resistance curves without prestrain history
In this section monotonic loading of the SENT specimens is analyzed and the results will be taken as the references forstudying the prestrain history effect. We briefly comment on the effect of the following three material and geometry param-eters that have a direct bearing on the computed fracture resistance. The three parameters considered are initial void volumefraction f0, crack size/specimen width ratio a/w, and strain hardening exponent n.
3.1. Effect of initial void volume fraction
The initial void volume fraction represents the degree of damage in the material. The larger the initial void volume frac-tion is the larger damage has the material. Fig. 5 shows the predicted resistance curves by the complete Gurson model forthree initial void volume fractions, f0 = 0.001, 0.005 and 0.010, respectively. In the present case where a cluster void nucle-ation model is used, the initial void volume fraction is the only damage parameter and no additional parameters are neces-sary. The strain hardening exponent of the matrix material for the results shown in Fig. 5 is 0.05 and the crack size/specimenwidth ratio, a/w is 0.14. It can be clearly seen that the initial void volume fraction influences both the crack initiation tough-ness and the crack growth resistance curve. Increasing the initial void volume fraction increases the damage and reduces thecrack growth resistance.
0 0.5 1 1.5 2 2.5 30
0.5
1
1.5
2
2.5
CT
OD
[mm
]
Crack growth [mm]
f0=0.1%
f0=0.5%
f0=1.0%
Fig. 5. Resistance curves for f0 = 0.001, 0.005 and 0.010. a/w = 0.14 and n = 0.05.
0 0.5 1 1.5 2 2.5 30
0.5
1
1.5
2
CT
OD
[mm
]
Crack growth [mm]
a/w=0.14a/w=0.26a/w=0.60
Fig. 6. Resistance curves for a/w = 0.14, 0.26 and 0.60. f0 = 0.005 and n = 0.05.

4574 P.A. Eikrem et al. / Engineering Fracture Mechanics 75 (2008) 4568–4582
3.2. Effect of crack size/specimen width aspect ratio a/w
Fig. 6 shows the fracture resistance for different initial crack size to width ratios (the specimen width is fixed). The initialcrack size to width ratios analyzed are a/w = 0.14, 0.26 and 0.60, respectively. For three-point-bending specimens, it is well
0 0.5 1 1.5 2 2.5 30
0.5
1
1.5
2
2.5
CT
OD
[mm
]
Crack growth [mm]
n=0.01n=0.05n=0.10n=0.20
Fig. 7. Effect of strain hardening on the resistance curve. Four hardening exponents are considered, n = 0.01, 0.05, 0.10 and 0.20. f0 = 0.005 and a/w = 0.14.
–4 –2 0 2 4 6
x 103
–0.5
0
0.5
1
1.5
2
CT
OD
[mm
]
εnom
0.4% sym. prestrain
0.3% sym. prestrain
0.2% sym. prestrain
0.0% prestrain
0 0.5 1 1.5 2 2.5 30
0.5
1
1.5
2
CT
OD
[mm
]
Crack growth [mm]
0.4% sym. prestrain0.3% sym. prestrain
0.2% sym. prestrain
0.0% prestrain
Fig. 8. (a) CTOD versus nominal strain for different symmetrical prestrain cycles (b) effect of symmetrical prestrain on the fracture resistance. n = 0.05, a/w = 0.14 and f0 = 0.005.

P.A. Eikrem et al. / Engineering Fracture Mechanics 75 (2008) 4568–4582 4575
known that shallow crack, for example the specimen with a/w = 0.14, corresponds to a low constraint case with negative Tstress, while deep crack specimen with a/w = 0.60 has high crack tip constraint with positive T stress. Both experimental re-sults and numerical simulations have shown that shallow and deep cracked three-point-bending specimens give rise to dif-ferent fracture resistance behaviour – a significantly higher resistance curve was obtained from the shallow crack geometry[26]. However, for the present clamped SENT specimens, Fig. 6, only a relatively small increase of the resistance for the shal-low crack specimen has been observed. This is somewhat surprising and we may expect a larger difference between the casewith a/w = 0.14 and a/w = 0.60. However, the present results support the experimental findings by Nyhus et al. [32] whichindicate that the effect of initial crack size to width ratio on the fracture resistance is insignificant.
3.3. Effect of strain hardening
The effect of strain hardening on the ductile fracture resistance is controversial. Xia and Shih [26] reported that raisingmaterials’ hardening capacity, and keeping other parameters fixed, increases the ductile resistance. Using the complete Gur-son model, the effect of the material strain hardening exponent (n) on the crack resistance curves are plotted in Fig. 7 formaterials with n = 0.01, 0.05, 0.10 and 0.20, respectively. Similar to the results of [26], the crack initiation toughness mea-sured by CTOD is rather independent of the strain hardening exponent. However, it is interesting to observe that decreasingthe hardening exponent will significantly raise the resistance curve. The results of the strain hardening effect on the resis-tance curves reported by [26] and the ones shown in the present study are just opposite. The present results are similar tothe recent results of Østby et al. [33–34]. It should be noted that it is very difficult to experimentally verify the strain hard-ening effect on the fracture resistance, because it is nearly impossible to produce materials with different hardening capac-ities while keeping other parameters (yield stress, initial volume fraction) unchanged. A detailed study on the effect of strainhardening effect on the crack resistance behaviour has been carried out by the authors [25] and it has been found that theeffect of strain hardening is very sensitive to the constitutive model used.
–6 –4 –2 0 2 4 6
x 10–3
0.5
0
0.5
1
1.5
2
2.5
CT
OD
[mm
]
εnom
0.55% sym. prestrain
0.4% sym. prestrain
0.2% sym. prestrain
0.0% prestrain
0 0.5 1 1.5 2 2.5 30
0.2
0.4
0.6
0.8
1
1.2
1.4
CT
OD
[mm
]
Crack growth [mm]
0.55% sym. prestrain
0.4% sym. prestrain
0.2% sym. prestrain
0.0% prestrain
Fig. 9. (a) CTOD versus nominal strain for different symmetrical prestrain cycles and (b) effect of symmetrical prestrain on the fracture resistance. n = 0.10,a/w = 0.14 and f0 = 0.005.

4576 P.A. Eikrem et al. / Engineering Fracture Mechanics 75 (2008) 4568–4582
4. Resistance curves with a prestain history
In this section we present the results of the ductile fracture resistance curves with a prestrain history. It should be notedthat void growth is only allowed during tensile deformation and is suppressed during compression. Both symmetrical andnon-symmetrical prestrain cycles have been considered. Nominal strain is used as the global loading parameters. Nominalstrain is measured by the ratio of the applied displacement divided by the initial length. The SENT specimens with differentcrack size to width ratios and different strain hardening have also been studied. The initial void volume fraction has beenkept constant 0.5%.
4.1. Effect of prestrain on ductile crack growth
For each SENT specimen three prestrain cycles have been analyzed in addition to the case with monotonic tension. It mustbe noted that the crack models have an initial opening 0.02 mm and therefore a maximum closure 0.02 mm is allowed. In allthe cases considered the specimens were loaded by tension first. Reverse loading was applied at different nominal strain lev-els. The CTOD versus nominal strain curves for the four cases with symmetrical prestrains are shown in Fig. 8a for a/w = 0.14and n = 0.05. Prestrains 0.2%, 0.3% and 0.4% were applied. It can be seen that during the loading a typical elastic–plastic CTODversus nominal strain behaviour can be observed. The CTOD increases slowly in the beginning and rapidly when substantialyielding has reached. It is interesting to note that during the reverse loading, the CTOD decreases also slowly in the beginning(elastic unloading) and then rapidly when compressive loading has re-induced yielding.
Prestrain will not only change the shape of CTOD versus nominal strain curve, but will also affect the fracture resistancebehaviour. The effect of the three symmetrical prestrains on the ductile fracture resistance of the SENT specimen is shown inFig. 8b. The red line indicates crack growth during prestrain. The result of monotonic loading without a prestrain history is
–4 –2 0 2 4 6
x 10–3
0
0.5
1
1.5
CT
OD
[mm
]
εnom
0.30% sym. prestrain
0.25% sym. prestrain
0.20% sym. prestrain
0.0% prestrain
0 0.5 1 1.5 2 2.5 30
0.5
1
1.5
2
CT
OD
[mm
]
Crack growth [mm]
0.30% sym. prestrain
0.25% sym. prestrain
0.20% sym. prestrain
0.0% prestrain
Fig. 10. (a) CTOD versus nominal strain for different symmetrical prestrain cycles and (b) effect of symmetrical prestrain on the fracture resistance. n = 0.05,a/w = 0.26 and f0 = 0.005.

P.A. Eikrem et al. / Engineering Fracture Mechanics 75 (2008) 4568–4582 4577
plotted in the same figure as a reference case. It can be clearly observed that a symmetrical prestrain up to 0.2% can alreadyresult in an observable reduction in the fracture resistance both in terms of initiation toughness and crack growth resistance.The crack initiation toughness for the case with 0.3% prestrain reduced to about zero. For the 0.4% prestrain case a smallcrack growth occurred in the prestrain cycle and crack growth in the re-loading stage starts almost immediately whenthe CTOD becomes positive. The general observation is that crack initiation toughness in the re-loading stage reduces withincreasing prestrain amplitudes and approaches to zero when the applied prestrain is large enough. It should be noted thatthe exact prestrain level at which the re-loading crack initiation toughness becomes zero is dependent on the material andgeometry combination. It is not the intention of this study to establish a quantitative link between the prestrain and theseparameters.
Similar analyses have been extended to the same SENT specimen but with a high hardening material, n = 0.10. Three pre-strains, 0.2%, 0.4% and 0.55% have been analyzed. The results are displayed in Fig. 9. The general trend is the same – increas-ing symmetrical prestrain levels, while keeping other parameters fixed, will reduce both the initiation toughness as well asthe resistance. For the high strain hardening material (n = 0.10) no crack growth occurs in the prestrain cycle for the casewith 0.4% prestrain, as did for the low hardening material with n = 0.05. A larger prestrain (0.55%) is needed to induce crackgrowth in the prestrain cycle.
The effect of prestrain has also been explored for the SENT specimen with a deeper crack length to width ratio, a/w = 0.26and n = 0.05. Three symmetrical prestrain cycles, 0.2%, 0.25% and 0.3% are analyzed. The results are displayed in Fig. 10. Crackgrowth is observed during the 0.3% prestrain cycle. As it can be expected, the prestrain level at which crack growth first oc-curs in the prestrain cycle for the deep crack is smaller than for the shallow crack with a/w = 0.14.
So far, only symmetrical prestrain cycles have been considered. The effect of non-symmetrical prestrain cycles has alsobeen studied. Here the specimen is loaded in tension to the specified prestrain level and then unloaded and followed by acompression to about the initial specimen length. Three prestrains, 0.4%, 0.5% and 0.6% are applied. The CTOD versus nominal
0 2 4 6 8
x 10–3
0
0.5
1
1.5
2
CT
OD
[mm
]
εnom
0.6% non sym. prestrain
0.5% non sym. prestrain
0.4% non sym. prestrain
0.0% prestrain
0 0.5 1 1.5 2 2.5 30
0.5
1
1.5
2
CT
OD
[mm
]
Crack growth [mm]
0.6% non sym. prestrain
0.5% non sym. prestrain
0.4% non sym. prestrain
0.0% prestrain
Fig. 11. (a) CTOD versus nominal strain for the non-symmetrical prestrain levels and (b) Effect of non-symmetrical prestrain on fracture resistance. n = 0.05,a/w = 0.14 and f0 = 0.005.

4578 P.A. Eikrem et al. / Engineering Fracture Mechanics 75 (2008) 4568–4582
strain curves and the corresponding fracture resistance curves are shown in Fig. 11. Crack growth occurred in all the appliedprestrain cycles. After the prestrain cycle crack growth starts at a lower CTOD than the CTOD at the end of pre-tension load-ing, but greater than the initiation CTOD in the monotonic loading. It must be noted that the 0.4% symmetrical prestrain cycleand the 0.4% non-symmetrical prestrain cycle have the same amount of elongation during prestrain, but different degrees ofcompression. Their fracture resistances in the re-loading stage differ significantly with much lower initiation toughness andresistance for the case with symmetrical prestrain cycle. Figs. 8 and 11 clearly indicate that the compression in the prestraincycle plays a significant role in the resistance behaviour after the prestrain cycle.
Fig. 12. Damage (void volume fraction) and crack growth during the prestrain cycle and further tearing. The prestrain applied was a 0.4% symmetricalprestrain cycle. a/w = 0.14, n = 0.05 and f0 = 0.005.
Fig. 13. Residual stress distribution of the SENT specimen after a 0.4% symmetric plastic strain cycle, f0 = 0.005 and n = 0.05.

P.A. Eikrem et al. / Engineering Fracture Mechanics 75 (2008) 4568–4582 4579
The general conclusions which can be drawn from Figs. 8–11 are that a plastic strain history will reduce both the initi-ation and resistance curves. The degree of reduction is dependent on materials hardening exponent, prestrain level as well asthe crack tip geometry constraint level. The prestrain effect becomes stronger for the cases with low hardening and high
0 0.5 1 1.5 2 2.5 30
0.2
0.4
0.6
0.8
1
1.2
1.4
CT
OD
[mm
]
Crack growth [mm]
pretensionretensionapproximated retension
0 0.5 1 1.5 2 2.5 30
0.2
0.4
0.6
0.8
1
CT
OD
[mm
]
Crack growth [mm]
pretensionretensionapproximated retension
Fig. 15. Comparison between approximated and numerical resistance curve, after a symmetrical prestrain cycle. (a) 0.4% prestrain, n = 0. 05 and a/w = 0.14and (b) 0.55% prestrain, n = 0.10 and a/w = 0.14.
Fig. 14. History-dependent R curve.
4580 P.A. Eikrem et al. / Engineering Fracture Mechanics 75 (2008) 4568–4582
geometry constraint. Prestrain nature (type) seems to influence the reduction of resistance curve strongly. Symmetrical pre-strain cycle is more detrimental compared with the non-symmetrical prestrain analyzed in the paper. Figs. 8–11 also showthat the resistance curves after the prestrain cycle are to a large degree similar to each other, and the shapes of these resis-tance curves resemble to the resistance curve without a prestrain history. This observation will be the basis for the history-dependent resistance model proposed and will be further elaborated in the following.
4.2. Prestrain induced crack tip damage
The observed reduction in fracture resistance can possibly be explained by Fig. 12. Fig. 12 shows the development of cracktip damage (void volume fraction) for the case with 0.4% symmetrical prestrain cycle. Fig. 12a shows the condition at the endof the pre-tension loading. A small amount of crack growth is observed in the first tensile loading (red indicates totally dam-aged element). The crack is closed and the near tip crack field is distorted during reverse compressive loading (Fig. 12b).When the second tensile loading starts the damage will starts to accumulate immediately (Fig. 12c). New crack growth ini-tiates at a CTOD approximately equal to zero in the second tensile loading loading due to the accumulated damage duringthe first tensile loading. In Fig. 12d it can be observed that at approximately the same CTOD as in Fig. 12a, the ductile dam-aged zone and ductile crack growth in the second tensile cycle is much greater than that in the first tensile cycle.
As noted previously, it is interesting to observe that even though crack initiation in the second tension starts at differentCTOD levels and crack growth amounts, the shapes, and in particular the curvature of the resistance curves are similar to theresistance curve for the monotonic loading. It seems that the resistance curve in the monotonic loading case will be verticallyshifted down when a plastic prestrain cycle is applied. It is apparent that the initial stage of crack growth after the prestraincycle is disturbed by the prestrain induced damage. The resistance curve starts with a small flat segment before it increasesrapidly to the similar shape as the resistance curve for monotonic loading. This behaviour is most evident for prestrain cycleswith a great amount of plastic yielding during reverse loading. The behaviour can be explained by the distortion of the near
0 0.5 1 1.5 2 2.5 30
0.2
0.4
0.6
0.8
1
1.2
1.4
CT
OD
[mm
]
Crack growth [mm]
pretensionretensionapproximated retension
0 0.5 1 1.5 2 2.5 30
0.2
0.4
0.6
0.8
1
1.2
1.4
1.6
CT
OD
[mm
]
Crack growth [mm]
pretensionretensionapproximated retension
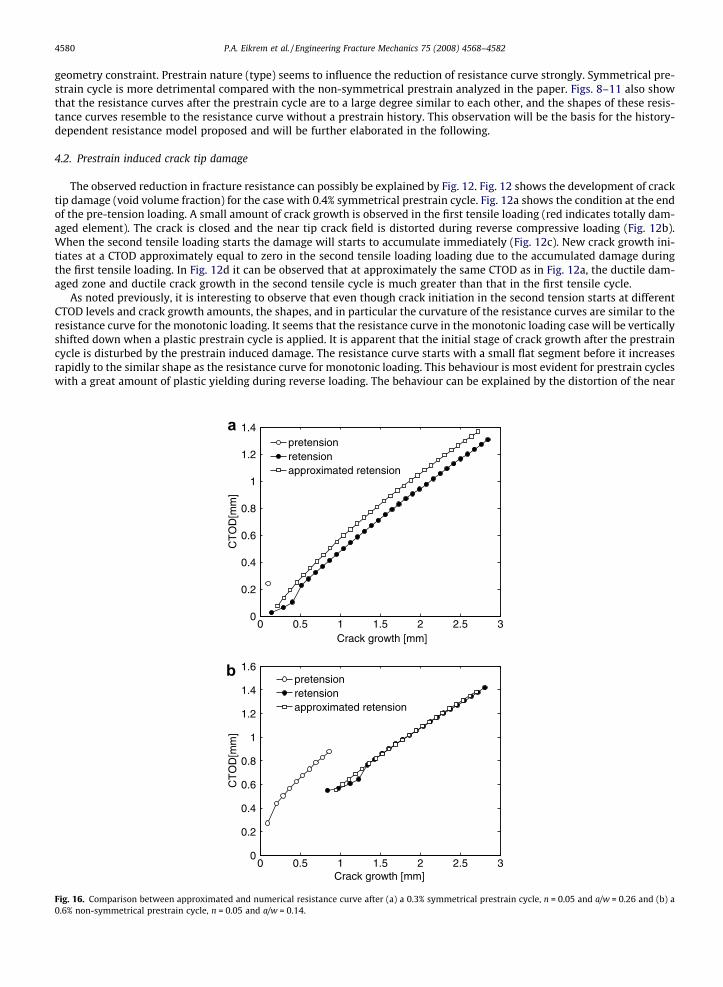
Fig. 16. Comparison between approximated and numerical resistance curve after (a) a 0.3% symmetrical prestrain cycle, n = 0.05 and a/w = 0.26 and (b) a0.6% non-symmetrical prestrain cycle, n = 0.05 and a/w = 0.14.

P.A. Eikrem et al. / Engineering Fracture Mechanics 75 (2008) 4568–4582 4581
crack tip field and the strain hardening during the reverse compressive loading. In the second tension loading (re-loading)accumulation of ductile damage occurs close to the crack tip even tough the global load is negative. This behaviour can orig-inate from the distortion of the near crack tip field and explain the flat segment of the resistance curve in the initial stage ofre-loading. During compression significant strain hardening occurs. This results in a lower effective material hardening expo-nent (n). According to the effect of strain hardening reported in Section 2, decreased hardening increases the tangent to theresistance curve. The competition between the effect of strain hardening and distortion of the near crack tip field can pos-sibly explain the complex shape of the resistance curve after the prestrain cycle. It is clear that only the area close to thecrack tip is significantly affected by the stress concentration, see Fig. 13.
4.3. History-dependent R curve
The present results tend to conclude that the resistance curve depends on the prestrain history. Neither today’s recom-mended practice (history-independent R curve) nor the material-memory resistance curve presented by Ernst et al. [6] fit thepresent numerical results. Based on the observation in the previous section, a new resistance model is proposed to describethe present results. The new model is called history-dependent R curve which is schematically explained in Fig. 14. The resis-tance curve for the monotonic loading is used as the basis for the history-dependent R curve model. The point on the mono-tonic resistance curve where the first tensile loading ended becomes the new origin of the resistance in the second tension.After the first prestrain cycle (both the tension and the compression stage) the CTOD and crack growth are reset and the ori-gin will be moved to a new position. The position of the new origin depends on the prestrain levels and type.
If the CTOD versus crack growth curve for a prestrain cycle followed by re-tension is plotted in the same coordinate sys-tem, the resistance curve for the second tensile cycle is located below the resistance curve of monotonic loading. Accordingto the history-dependent R curve model the vertical shift of the resistance curve equals the change in CTOD during the com-pression stage of the prestrain cycle. In Figs. 15 and 16 the resistance curve constructed according to the new history-depen-dent R curve model is compared with the original numerical fracture resistance. It can be seen that the estimated resistancecurve by the history-dependent R curve model is in reasonable agreement with the numerical resistance curve both for thesymmetrical prestrain cycles and the non-symmetrical prestrain cycle.
5. Concluding remarks
The complete Gurson model has been used to numerically predict ductile crack growth of SENT specimens. A new tech-nique has been applied to calculate the crack growth by taking the plastic deformation of the elements into account. To theauthors’ knowledge such technique has not been used or reported by others. This new technique should not alter the trendsof the predicted ductile fracture behaviour. However, the predicted resistance curve is supposed to be more close to theexperimental measured ones.
The effect of the hardening exponent (n) on the fracture resistance is controversial. Opposite trends have been observed inthis study compared with the early studies reported in the literature. The readers are referred to [25] for a detailed accounton this topic.
The results show that plastic prestain cycles (first tension followed by compression) influence the fracture resistance withfurther loading. Reduced fracture resistance in the second tensile cycle comes from accumulated ductile damage in the firsttensile cycle. How much the resistance curve is reduced is dependent on the amount of plastic compression between the twosubsequent tensile cycles. In the study a new and simple model to predict the resistance curve through deformation cycles isproposed. The history-dependent R curve model takes no account for change in material properties and redistribution ofstress due to compressive loading. In the present study only small prestrain amplitudes have been investigated. In case ofgreater prestrain amplitudes significantly change of material properties and near crack tip field distortion may occur duringcompression. This may cause that the history-dependent R curve model function improperly.
This study has only considered simple prestrain cycles. Pipe reeling or other industrial and service processes may involvemulti prestrain cycles and the first cycle may not necessarily be in tension. Finally it should be noted that only the influenceof prestrain on ductile fracture has been considered. The prestrain can also change the failure mechanisms and failure modes.A systematic experimental work is planned to verify the numerical results.
References
[1] Martinez M, Brown G. Evolution of pipe properties during reel-lay process: experimental characterisation and finite element modelling. In:Proceedings of the 24th international conference on offshore mechanics and arctic engineering (OMAE 2005), June 12–17, Halkidiki, Greece; 2005.
[2] Fukuda N, Hagiwara N, Masuda T. Effect of prestrain on tensile and fracture properties of line pipes. J Offshore Mech Artic Engng 2005;127:263–8.[3] Enami K. The effects of compressive and tensile prestrain on ductile fracture initiation in steels. Engng Fract Mech 2005;72:1089–105.[4] Qiu H, Enoki M, Hiraoka K, Kishi T. Effect of prestrain on fracture toughness of ductile structural steels under static and dynamic loading. Engng Fract
Mech 2005;72:1624–33.[5] Cosham A. A model of prestrain effects on fracture toughness. J Offshore Mech Arctic Engng 2001;123:182–90.[6] Ernst H., Bravo RE, Daguerre F, Izquierdo A. Strain history effects on fracture mechanics parameters – application to reeling. In: Proceedings of the 24th
international conference on offshore mechanics and arctic engineering (OMAE 2005), June 12–17, Halkidiki, Greece; 2005.[7] Sivaprasad S, Tarafder S, Ranganath VR, Ray KK. Effect of prestrain on fracture toughness of hsla steels. Mater Sci Engng 2000;A284:195–201.

4582 P.A. Eikrem et al. / Engineering Fracture Mechanics 75 (2008) 4568–4582
[8] Zhang ZL, Østby E, Nyhus B, Ødegård J. Prestrain history effect on ductile fracture of pipeline steels. In: international seminar on application of highstrength line pipe and assessment of pipeline 2006. China: Xi’an; 2006. June.
[9] Eikrem PA, Zhang ZL, Nyhus B. Effect of plastic prestrain on the crack tip constraint of pipeline steels. Int J Pressure Vessels Pipings 2007;84:708–15.[10] Wastberg S, Pisarki H, Nyhus B. Guidelines for engineering critical assessments for pipelines installation methods introducing cyclic plastic strain. In:
International conference on offshore mechanics and arctic engineering (OMAE 2004), Canada: Vancouver; 2004.[11] Zhang ZL, Thaulow C, Ødegård J. A complete Gurson model approach for ductile fracture. Engng Fract Mech 2000;67:155–68.[12] Nyhus B, Polanco ML, Ørjas�ther O. SENT specimens an alternative to SENB specimens for fracture mechanics testing of pipelines. In: Proceedings of
the 22nd international conference on offshore mechanics and arctic engineering (OMAE 2002), Jun 8–13, 2001, Cancun, Mexico; 2003. p. 259–266.[13] Gurson AL. Continuum theory of ductile rupture by void nucleation and growth: part 1-yield criteria and flow rules for porous ductile media. J Engng
Mater Technol 1977;99:2–15.[14] Tvergaard V. Influence of voids on shear band instabilities under plane strain conditions. Int J Fract 1981;17:389–407.[15] Tvergaard V. On localization in ductile materials containing spherical voids. Int J Fract 1982;18:237–52.[16] Tvergaard V, Needleman A. Analysis of the cup-cone fracture in a round tensile bar. Acta Metall 1984;32:157–69.[17] Thomason PF. Ductile fracture of metals. Oxford: Pergamon Press; 1990.[18] Benzerga A. Micromechanics of coalescence in ductile fracture. J Mech Phys Solids 2002;50:1331–62.[19] Gologanu M, Leblond J-P, Perrin G, Devaux J. Theoretical models for void coalescence in porous ductile solids, I. Coalescence ‘‘in layers”. Int J Solids
Struct 2001;38:5581–94.[20] Pardoen T, Hutchinson JW. An extended model of void growth and coalescence. J Mech Phys Solids 2000;48:2467–512.[21] Zhang ZL, Niemi E. A new failure criterion for the Gurson–Tvergard dilatational constitutive model. Int J Fract 1995;70:321–34.[22] Zhang ZL, Niemi E. Analyzing ductile fracture by using dual dilatational constitutive equations. Fatigue Fracture Engng Mater Struct 1994;17:695–707.[23] Koplik J, Needleman A. Void growth and coalescence in porous plastic solids. Int J Solids Struct 1988;24:835–53.[24] Zhang ZL, Hauge M. On the Gurson parameters, fatigue and fracture mechanics. In: Panontin TL, Sheppard SD, editors. American Society for Testing and
Materials. STP: ASTM; 1998. vol. 29:1321.[25] Eikrem PA, Zhang ZL, Østby E, Nyhus B. Numerical study on the effect of strain hardening on ductile crack resistance, in preparation.[26] Xia L, Shih F. Ductile crack growth-i. a numerical study using computational cells with microstructurally-based length scales. J Mech Phys Solids
1995;43:223–59.[27] Zhang ZL, Niemi E. A class of generalized mid-point algorithms for Gurson–Tvergaard continuum damage material model. Int J Numerical Meth Engng
1995;38:2033–53.[28] Zhang ZL. On the accuracies of numerical integration algorithms for Gurson pressure-dependent elastoplastic constitutive models. Computer Meth
Appl Mech Engng 1995;121:15–28.[29] Zhang ZL. Explicit consistent tangent moduli with a return mapping algorithm for pressure-dependent elastoplasticity models. Computer Meth Appl
Mech Engng 1995;121:29–44.[30] Aravas N. On the numerical integration of a class of pressure-dependnet plasticity models. Int J Numerical Meth Engng 1987;24:1395–416.[31] Shih CF. Relationship between the J-integral and the crack opening displacement for stationary and extending cracks. J Mech Phys Solids
1981;29:305–26.[32] Nyhus B, Østby E, Kragenhjem HO, Black S, Røstadsand PA. Experimental studies on the effect of crack depth and asymmetric geometries on the ductile
tearing resistance. In: Proceedings of the 24th international conference on offshore mechanics and artic engineering (OMAE2005), June 12–17,Halkidiki, Greece; 2005.
[33] Østby E, Thaulow E, Zhang ZL. Numerical simulations of specimen size and mismatch effects in ductile crack growth – part I: tearing resistance andcrack growth paths. Engng Fract Mech 2007;74:1770–92.
[34] Østby E, Thaulow E, Zhang ZL. Numerical simulations of specimen size and mismatch effects in ductile crack growth – part II: near-tip stress fields.Engng Fract Mech 2007;74:1793–809.