Engineering Failure Analysis - University of...
19
Engineering failure analysis and design optimisation with HiP-HOPS Yiannis Papadopoulos a,⇑ , Martin Walker a , David Parker a , Erich Rüde b , Rainer Hamann b , Andreas Uhlig c , Uwe Grätz c , Rune Lien d a University of Hull, Cottingham Road, Hull, HU6 7RX, United Kingdom b Germanischer Lloyd AG, Brooktorkai 18, 20457 Hamburg, Germany c ITI GmbH, Webergasse 1, D-01067 Dresden, Germany d Agito SA, Postbox 792, N-3606 Kongsberg, Norway article info Article history: Available online 23 October 2010 Keywords: Failure analysis Hazards Safety abstract The scale and complexity of computer-based safety critical systems, like those used in the transport and manufacturing industries, pose significant challenges for failure analysis. Over the last decade, research has focused on automating this task. In one approach, pre- dictive models of system failure are constructed from the topology of the system and local component failure models using a process of composition. An alternative approach employs model-checking of state automata to study the effects of failure and verify system safety properties. In this paper, we discuss these two approaches to failure analysis. We then focus on Hier- archically Performed Hazard Origin & Propagation Studies (HiP-HOPS) – one of the more advanced compositional approaches – and discuss its capabilities for automatic synthesis of fault trees, combinatorial Failure Modes and Effects Analyses, and reliability versus cost optimisation of systems via application of automatic model transformations. We summarise these contributions and demonstrate the application of HiP-HOPS on a simplified fuel oil system for a ship engine. In light of this example, we discuss strengths and limitations of the method in relation to other state-of-the-art techniques. In particular, because HiP-HOPS is deductive in nature, relating system failures back to their causes, it is less prone to combinatorial explosion and can more readily be iterated. For this reason, it enables exhaustive assessment of combinations of failures and design optimisation using computationally expensive meta-heuristics. Ó 2010 Elsevier Ltd. All rights reserved. 1. Introduction Increasing complexity in the design of modern engineering systems challenges the applicability of rule-based design and classical safety and reliability analysis techniques. As new technologies introduce complex failure modes, classical manual analysis of systems becomes increasingly difficult and error prone. To address these difficulties, we have developed a computerised tool called ‘HiP-HOPS’ (Hierarchically Performed Hazard Origin & Propagation Studies) that simplifies aspects of the engineering and analysis process. The central capability of this tool is the automatic synthesis of Fault Trees and Failure Modes and Effects Analyses (FMEAs) by interpreting reusable spec- ifications of component failure in the context of a system model. The analysis is largely automated, requiring only the initial component failure data to be provided, therefore reducing the manual effort required to examine safety; at the same time, 1350-6307/$ - see front matter Ó 2010 Elsevier Ltd. All rights reserved. doi:10.1016/j.engfailanal.2010.09.025 ⇑ Corresponding author. Tel.: +44 (0)1482 465981. E-mail address: [email protected] (Y. Papadopoulos). Engineering Failure Analysis 18 (2011) 590–608 Contents lists available at ScienceDirect Engineering Failure Analysis journal homepage: www.elsevier.com/locate/engfailanal
Transcript of Engineering Failure Analysis - University of...
Engineering Failure Analysis 18 (2011) 590–608
Contents lists available at ScienceDirect
Engineering Failure Analysis
journal homepage: www.elsevier .com/locate /engfai lanal
Engineering failure analysis and design optimisation with HiP-HOPS
Yiannis Papadopoulos a,⇑, Martin Walker a, David Parker a, Erich Rüde b, Rainer Hamann b,Andreas Uhlig c, Uwe Grätz c, Rune Lien d
a University of Hull, Cottingham Road, Hull, HU6 7RX, United Kingdomb Germanischer Lloyd AG, Brooktorkai 18, 20457 Hamburg, Germanyc ITI GmbH, Webergasse 1, D-01067 Dresden, Germanyd Agito SA, Postbox 792, N-3606 Kongsberg, Norway
a r t i c l e i n f o a b s t r a c t
Article history:Available online 23 October 2010
Keywords:Failure analysisHazardsSafety
1350-6307/$ - see front matter � 2010 Elsevier Ltddoi:10.1016/j.engfailanal.2010.09.025
⇑ Corresponding author. Tel.: +44 (0)1482 465981E-mail address: [email protected] (Y.
The scale and complexity of computer-based safety critical systems, like those used in thetransport and manufacturing industries, pose significant challenges for failure analysis.Over the last decade, research has focused on automating this task. In one approach, pre-dictive models of system failure are constructed from the topology of the system and localcomponent failure models using a process of composition. An alternative approachemploys model-checking of state automata to study the effects of failure and verify systemsafety properties.
In this paper, we discuss these two approaches to failure analysis. We then focus on Hier-archically Performed Hazard Origin & Propagation Studies (HiP-HOPS) – one of the moreadvanced compositional approaches – and discuss its capabilities for automatic synthesisof fault trees, combinatorial Failure Modes and Effects Analyses, and reliability versus costoptimisation of systems via application of automatic model transformations.
We summarise these contributions and demonstrate the application of HiP-HOPS on asimplified fuel oil system for a ship engine. In light of this example, we discuss strengthsand limitations of the method in relation to other state-of-the-art techniques. In particular,because HiP-HOPS is deductive in nature, relating system failures back to their causes, it isless prone to combinatorial explosion and can more readily be iterated. For this reason, itenables exhaustive assessment of combinations of failures and design optimisation usingcomputationally expensive meta-heuristics.
� 2010 Elsevier Ltd. All rights reserved.
1. Introduction
Increasing complexity in the design of modern engineering systems challenges the applicability of rule-based design andclassical safety and reliability analysis techniques. As new technologies introduce complex failure modes, classical manualanalysis of systems becomes increasingly difficult and error prone.
To address these difficulties, we have developed a computerised tool called ‘HiP-HOPS’ (Hierarchically Performed HazardOrigin & Propagation Studies) that simplifies aspects of the engineering and analysis process. The central capability of thistool is the automatic synthesis of Fault Trees and Failure Modes and Effects Analyses (FMEAs) by interpreting reusable spec-ifications of component failure in the context of a system model. The analysis is largely automated, requiring only the initialcomponent failure data to be provided, therefore reducing the manual effort required to examine safety; at the same time,
. All rights reserved.
.Papadopoulos).
Y. Papadopoulos et al. / Engineering Failure Analysis 18 (2011) 590–608 591
the underlying algorithms can scale up to analyse complex systems relatively quickly, enabling the analysis of systems thatwould otherwise require partial or fragmented manual analyses.
More recently, we have extended the above concept to solve a design optimisation problem: reliability versus cost opti-misation via selection and replication of components and alternative subsystem architectures. HiP-HOPS employs geneticalgorithms to evolve initial non-optimal designs into new designs that better achieve reliability requirements with minimalcost. By selecting different component implementations with different reliability and cost characteristics, or substitutingalternative subsystem architectures with more robust patterns of failure behaviour, many solutions from a large designspace can be explored and evaluated quickly.
Our hope is that these capabilities, used in conjunction with computer-aided design and modelling tools, allow HiP-HOPSto facilitate the useful integration of a largely automated and simplified form of safety and reliability analysis in the contextof an improved design process. This in turn will, we hope, address the broader issue of how to make safety a more controlledfacet of the design so as to enable early detection of potential hazards and to direct the design of preventative measures. Theutilisation of the approach and tools has been shown to be beneficial in case studies on engineering systems in the shipping[1] and offshore industries [2].
This paper outlines these safety analysis and reliability optimisation technologies and their application in an advancedand largely automated engineering process. In Section 2 we discuss the context behind these technologies and discuss somerelated approaches. In Section 3, we describe how automatic safety analysis can be performed using HiP-HOPS, and then inSection 4 we relate the new optimisation capabilities of HiP-HOPS. We apply these capabilities to a simplified marine fuel oilsystem in Section 5 and highlight the benefits of using automated tools in this way. Finally in Section 6 we discuss theserecent developments in HiP-HOPS and locate them in the context of other contemporary research in the area, and then inSection 7 we present our conclusions.
The paper makes two contributions: firstly, it gives a summary of the current state of HiP-HOPS, focusing on recent work onoptimisation, and relates this approach to the present state of the art; secondly, it presents a case study on optimisation ofsystem architecture using genetic algorithms and shows how this technique can automate, rationalise and simplify the clas-sical cost-benefit analysis that drives decisions about system optimisation. The example provides an opportunity to discussstrengths and limitations of HiP-HOPS in relation to other state-of-the-art techniques. We show that HiP-HOPS is less prone tocombinatorial explosion and can therefore be used for design optimisation using computationally expensive meta-heuristics.
2. Safety analysis and reliability optimisation
2.1. Classical safety analysis techniques: FTA and FMEA
Fault Tree Analysis (FTA) [3] and FMEA [4] are well-known and widely used system analysis techniques used in reliabilityengineering. Both are long established – FMEA was formally introduced in the late 1940s, and FTA has been around since the1960s – and both have been employed in a number of different areas, including the aerospace, nuclear power, and automo-tive industries. They are methods that we can use to identify potential faults in a system, so that we can then use that infor-mation to correct or prevent those faults.
Fault Tree Analysis (FTA) is a flexible technique, equally applicable to quantitative and qualitative analyses, and easy touse and understand. Fault trees themselves are graphical representations of logical combinations of failures, and show therelationship between a failure or fault and the events that cause them. A fault tree normally consists of a top event, which istypically a system failure, connected to one or more basic events via a system of logical gates, such as AND and OR. Basicevents are usually either component failures or events expected to happen as part of the normal operation of the system.Analysis of the fault tree consists of two parts: qualitative (logical) analysis, and quantitative (probabilistic) analysis. Quali-tative analysis is performed by reducing the logical expression represented by the fault tree into a set of minimal cut sets,which are the smallest possible combinations of failures required to cause the top event. Quantitative analysis is performedby calculating the probability of the top event given the probability of each of the basic events occurring.
In an FMEA, the basic process consists of compiling lists of possible component failure modes (all the ways in which anentity may fail), gathered from descriptions of each part of the system, and then trying to infer the effects of those failureson the rest of the system. Usually, these effects are evaluated according to a number of criteria, such as severity, probability,and detectability, and often these criteria are then combined into an overall estimate of risk. All of this data is then presentedin the form of a table which allows the analyst to quickly see what the effects of each failure mode are.
There are obvious differences between the two techniques, but one of the most fundamental is the direction of the anal-ysis. FTA is a deductive technique, which means it works from the top down – assuming the system has failed, and then tryingto work out why it failed. This is done by working backwards to determine what possible combinations of events might havecaused it; the system failure then becomes the top event of the fault tree and the individual component failures form thebasic events, and they are all combined using a network of logical gates. FMEA, by contrast, is an inductive technique,and works from the bottom up – assuming a component failure has occurred, and then trying to work out what its effectswould be. It involves proposing a certain event or condition, and then trying to assess the effects of that initial event onthe rest of the system. The end result is a table of failures and their effects on the system, which provide the analyst withan overview of the possible faults.
592 Y. Papadopoulos et al. / Engineering Failure Analysis 18 (2011) 590–608
Both techniques are useful and provide a lot of valuable information about systems, and each can be used to complementthe other, but both suffer from the same flaw: they are primarily manual methods. The process of performing these analysescan be laborious, especially for larger and more complex systems. Whilst this provides the analyst with an in-depth knowl-edge of the system being studied, it also makes application of these techniques error prone, and the results (once obtained)are often too numerous to interpret efficiently. As a consequence, it is not uncommon for FTA and FMEA to take place onlyonce or twice in the life cycle of the system. This is unfortunate, because systems analysis techniques like FTA and FMEA canbe of great benefit during an iterative design process. By estimating the reliability and gaining a more thorough understand-ing of the failure behaviour of the system in each iteration, it is possible to see how the changes in design impact upon theoverall safety of the system. It also enables the analysts to identify and remedy potential flaws much earlier, thereby savingboth time and effort and producing a more reliable product.
However, before FTA or FMEA can be incorporated into the design cycle in this way, it is necessary to overcome the dif-ficulties inherent in such manual techniques. Experience from the aerospace and process industries suggests that the appli-cation of classical safety analysis is hindered by the increasing complexity of systems. For relatively simple systems, this is amanageable process, although fault trees and FMEAs can rapidly become very elaborate. In complex systems, however, man-ual analysis is laborious and error prone, and a thorough assessment and interpretation of the results becomes increasinglydifficult to achieve within the constraints of most projects. Furthermore, the results of the analyses are divorced from thedesign being analysed, meaning that the effects of any changes in the system design may only become apparent after anotherlong and costly analysis.
While guidance is available on how technical justification for alternative designs and arrangements can be provided in theform of engineering and safety analyses, such as FTA and FMEA, there is a need for specific supporting measures and tools toassist in the application of such techniques. One obvious approach would be to automate at least part of the process. Thiswould mean that the analyses could be carried out more quickly and efficiently, leaving more time for the results to be stud-ied and allowing more useful conclusions to be drawn.
2.2. Modern safety analysis techniques and tools
The deficiencies in manual safety analysis techniques like FTA and FMEA have not gone unrecognised, and over the yearsa number of different tools and techniques have been established to try to automate the process. Although pure analysistools have a long history, e.g. FTA tools range from modern examples like Fault Tree+ [5] to more venerable tools like SETS[6], these typically require the fault tree (or FMEA, etc.) to be built manually. Recently, however, tools have begun to inte-grate more closely with the design process, allowing the synthesis of the fault models (i.e. fault trees, FMEA) to be achievedautomatically. This enables designers and safety analysts to better take advantage of ever-increasing computer processingpower and also helps to facilitate the reuse of information as part of a more iterative design process in which safety becomesa driving factor.
Many of these tools and techniques have tended to fall into one of two categories [7]. The first category consists of thecompositional safety analysis approaches: the development of formal and semi-formal languages to enable specification,composition, and analysis of system failure behaviour based on safety information about the components that comprisethe system. Although most are not fully automated, in that they depend on the manual entry of the initial component failuredata, they can be usefully applied in the analysis of both hardware and software architectures in the context of a model-based design process. The second category centres on adaptations of formal verification techniques to support safety anal-ysis. These tend to involve more rigorous modelling to enable model-checking and related processes to take place, analysingthe effects of failures by simulating them and verifying whether or not the system meets its safety goals in the presence ofthose failures.
2.2.1. Compositional safety analysis techniquesPerhaps the earliest compositional safety analysis technique, and one that has influenced those that followed, is the Fail-
ure Propagation and Transformation Notation (FPTN), which emerged in the 1990s [8]. It is a graphical description of thefailure behaviour of the system, based around the idea of component modules which describe the generation and propaga-tion of component failures in the system. These component modules are connected via inputs and outputs to other modules,allowing combination and propagation of failures from one module to another, and they can be composed into subsystemsthat can be used to build a system hierarchy. FPTN was designed to provide a bridge between the deductive FTA and induc-tive FMEA processes, allowing both cause and effect to be studied. However, FPTN’s component module approach meansbuilding an error model that is separate from the system model, which is then prone to becoming desynchronised fromthe original system it represents as the design evolves [9]. As such, the original FPTN remained primarily a notation fordescribing specifications of failure. Unlike HiP-HOPS, it was never extended with capabilities for system analysis or designoptimisation.
The concepts introduced in FPTN were taken further in the Fault Propagation and Transformation Calculus (FPTC) [9],which was an attempt to overcome the deficiencies in FPTN. The main way in which this was achieved was to link the failuremodel to the architectural model so that all dependencies are identified and maintained. FPTC defines different failure clas-ses (like omission, commission, and value errors) and these are specified in annotations directly in the components of thesystem model. The inputs and outputs of those components are then used to transmit failure information to the rest of
Y. Papadopoulos et al. / Engineering Failure Analysis 18 (2011) 590–608 593
the system by using a set of expressions that detail how failures are transformed and propagated from input to output. Rep-resenting mitigation of failure is possible by transforming a failure into normal behaviour. The failure propagation defined bythese expressions and the original model structure can then be evaluated as a token-passing network, determining the ef-fects of each component failure on the system as a whole. FPTC has also been extended [10] to permit quantitative (prob-abilistic) analysis by including probability values in each expression. The major advantage of FPTC over FPTN is that ituses the actual architectural model of the system, meaning that any localised changes to the model do not require a newfailure model to be built; instead, only a subset of the failure expressions need updating. However, whereas FPTN was de-signed to support both inductive and deductive analysis, FPTC is primarily inductive in nature, since it relies upon injectingone failure or combination of failures into the system at a time and repeating the analysis. As a result, the type of informationgiven by an FTA is more difficult to achieve with FPTC and its inductive nature makes it prone to combinatorial explosion,particularly for systems with large numbers of failure modes.
Other approaches build upon the foundations laid by FPTN in other ways. Two such examples are State-Event Fault Trees(SEFTs) [11,12] and Component Fault Trees (CFTs) [13,14]. In the CFT approach, the failure logic of components is defined as agraph of interconnected fault trees using a specification similar to that used in FPTN and HiP-HOPS. The CFTs themselves canbe composed to produce larger CFTs for subsystems to build the system hierarchy. Because CFTs are based on fault trees, theyare less prone to the problems with combinatorial explosion that afflicts FPTC. SEFTs are a development of CFTs designed toovercome the static logic inherent in FTA and FMEA and enable analysis of dynamic systems that feature transitions betweendifferent states. Whereas most FTA/FMEA-based approaches feature only basic failure events, SEFTs distinguish between asystem being in a certain state (which is a condition that is true over a period of time) and an event that triggers a state tran-sition (which is an instantaneous occurrence); this makes SEFTs better suited to analysing software systems or hardwaresystems with more complex dynamic behaviour. As with FPTC, failure behaviour is modelled at the component level, butthe simple Boolean logic of FPTC is extended to enable the representation of sequences and histories of events, as well asthe concept of negation (i.e. an event that has not happened yet) using the NOT gate. However, this more complex logicmeans that analysis of SEFTs is not possible using traditional FTA algorithms and instead relies upon a conversion to Deter-ministic Stochastic Petri Nets (DSPNs) [15]. These DSPNs can then be quantitatively analysed using Petri Net tools like Time-NET [16]. The disadvantage of modelling different states is that the state-space can grow exponentially in larger models,reducing the scalability of the SEFT approach.
Finally, HiP-HOPS also falls into this category, since it is based upon the synthesis and analysis of fault trees using com-positional component failure data. However, it will be described in detail in Section 3 and its capabilities will be discussedand compared with other approaches in Section 6.
2.2.2. Extensions of formal verification techniques for safety analysisAnother category of modern safety analysis techniques involves the use of formal modelling engines to simulate the nor-
mal functioning of the system design and then inject faults to determine their effects on the system. The benefit of this typeof approach is that it does not typically require any additional annotation (e.g. to describe the propagation of failures andcomponent failure logic) as all required information can be automatically extracted from the model, although this is onlypossible where simulation data for the domain in question is available in the first place.
There are a number of different tools and techniques that fall into this category. Two of the best known are FSAP-NuSMV[17] and Altarica [18]. Formal Safety Analysis Platform (FSAP) is a graphical interface for the NuSMV-SA model-checking &safety analysis engine; together they provide a single environment for model design and safety analysis. It is capable of bothinjected fault simulation and normal model-checking processes like property verification and counter-example generation.FSAP-NuSMV can be used to generate fault trees, although these fault trees essentially consist only of top events and basicevents and therefore link directly from effects to combinations of causes, although they can also include NOT gates. Its maindrawback, in common with the other model-checking approaches, is its susceptibility to combinatorial explosion as thenumber of potential failure modes increases.
Altarica is a formal modelling language that can describe complex hierarchical models [19]; it can also model states andevents and is therefore capable of representing the behaviour of dynamic or state-based systems. As with SEFTs describedabove, Altarica can be used to generate Petri Nets as well as static fault trees for non-dynamic systems. In both cases, thefailure model is then analysed by external tools. One issue with Altarica, as identified by Bieber in [18], is that it can be sub-ject to loops of fault propagation logic in the model, particularly when bidirectional signals or flows are involved. In thesecases, the SMV-based approach is usually employed instead [20].
There are other examples of this category, for example Model-based Deviation Analysis (MDA) [21] and Deductive CauseConsequence Analysis (DCCA) [22]. MDA differs from the others in that it is less concerned with system faults and insteadattempts to model the effects of deviations of system input data. It is an extension of the earlier Software Deviation Analysisthat seeks to relate deviations of input data to deviations of output. MDA uses quantifiable limits and ranges that can be for-mulated in temporal logic and then simulated using a model checker. By comparing simulations of nominal data and errordata, critical deviations from the normal can be detected and their causes identified. One downside of MDA, however, is itsrequirement for two datasets (nominal and error), although it is possible in some cases for these to be combined in the samemodel or environment.
DCCA is similar to the other model-checking approaches and uses mathematical proofs to verify whether a componentfailure will lead to system failure. The behaviour of the system is defined using finite automata and temporal logic; the

594 Y. Papadopoulos et al. / Engineering Failure Analysis 18 (2011) 590–608
system can then be simulated with regard to a set of component faults and system hazards to determine whether those com-ponent faults will cause one or more of the system hazards being investigated. The goal is to determine the minimal criticalset, i.e. the smallest combination of failure modes capable of causing a hazard. Other model checkers like SMV can also beused to verify the proofs. DCCA offers some other advantages: it has been modified to work with an industrial design tool,SCADE [23], and although it also suffers to a degree from combinatorial and state-space explosion, this can be minimised bymaking prior use of more informal techniques like classical FTA to determine failures of interest to investigate further. DCCAalso features an extension named DFOA (Deductive Failure Order Analysis) that enables analysis of dynamic systems usingtemporal fault trees generated automatically from the system model [24].
2.2.3. ImplicationsAlthough both kinds of approach have advantages and disadvantages [25], e.g. in terms of the level of automation,
amount of detail provided, scalability to handle multiple failures in combination, or ability to analyse dynamic systems withmultiple states, all of them offer a distinct advantage over classical manual techniques in that they can utilise tool supportand therefore offer a much faster, more detailed analysis. This makes it more practical to use these safety analysis techniquesas part of the design process, and in some cases multiple techniques can be used to complement each other.
However, if some portion of the design evolution is to be iterated automatically by using a model-based optimisationalgorithm, then the compositional safety analysis approach offers one significant advantage over the formal approaches: per-formance. Although the compositional approaches require the prior annotation of the model with failure logic, which can betime-consuming, subsequent synthesis and analysis of fault trees is typically very fast, since it normally operates in a deduc-tive manner and is less prone to combinatorial explosion. By contrast, although formal fault simulation techniques like Alta-rica do not require this initial step, since the required information can be automatically extracted from domain libraries ofcomponents with failure properties, the actual simulation and analysis is typically inductive and therefore slower and morevulnerable to combinatorial explosion. As a result, it is usually impractical to consider the effects of combinations of failures,or at least more than two failures in conjunction.
Automatic design optimisation, e.g. with meta-heuristics such as genetic algorithms, is an iterative process that may re-quire a model to be evaluated thousands or even millions of times. As a result, the performance and therefore scalability ofthe evaluation technique is a critical factor. Furthermore, since the evaluation is being used primarily to differentiate differ-ent potential design candidates, the level of detail that can be provided by fault simulation approaches is often unnecessary.Therefore, the compositional approaches tend to be better suited to this process; they can of course be complemented by ananalysis of certain promising design candidates using a fault simulation technique once the optimisation has finished.
2.3. Automatic optimisation of system reliability
2.3.1. Need for automatic optimisationAs described above, modern safety analysis techniques permit a wealth of information about the safety and reliability of a
system to be gathered much more quickly and easily than ever before. This information permits designers to use safety andreliability as a major factor in the decisions they make during the evolution of a system design: by evaluating the effects ofone or more potential design choices, e.g. increased reliability at the expense of greater cost or increased weight, etc., design-ers are able to make informed choices.
However, just as classical manual safety analyses restrict the rate that information can be obtained about a system, man-ually evaluating different design choices is time-consuming and restricts the number of design candidates that can be inves-tigated. If this process could be automated, it would be possible to examine hundreds or thousands of potential designcandidates – a much greater portion of the total design space – and thus hopefully provide a better foundation for the nextiteration of the system design.
Unfortunately, even automation using modern computing technology is insufficient to examine the total design spaceeven for a relatively simple system with a limited number of substitutable components. It is therefore not possible to eval-uate every design candidate except in the most trivial of cases. This is particularly the case if multiple methods of variabilityare taken into account, e.g. swapping one subsystem architecture for another as well as just substituting one component foranother with an alternative implementation.
Furthermore, an additional issue is that system reliability is seldom the only concern of the designer: the major constrainton any design is likely to be its cost, and as most characteristics of a system increase, cost typically increases too. These con-flicting goals – e.g. to increase reliability while reducing cost – result in any design having to reach a careful balance betweendifferent objectives. Any automated optimisation process must therefore take into account not just a single objective, butmultiple – and often contradictory – objectives.
2.3.2. Comparison of different optimisation approachesThere are a number of different optimisation algorithms available, most revolving around the use of meta-heuristics in-
tended to explore the design search space as extensively and as effectively as possible; the aim is to find the optimal solu-tions as soon as possible but without getting trapped in one local area of the search space (known as a ‘local optimum’).
One such algorithm is known as tabu search [26,27]. Tabu search explores the design space on the basis of evaluationfunctions, e.g. if one solution has better characteristics, it uses that one as the basis for its next iteration. Multiple objectives

Y. Papadopoulos et al. / Engineering Failure Analysis 18 (2011) 590–608 595
can be evaluated by multiple functions in multiple iterations, e.g. objective #1 in the first iteration, objective #2 in the sec-ond, and so forth. Furthermore, tabu search remembers the solutions it has explored, preventing the algorithm from loopingor getting stuck in a local optimum; these are known as the taboo or tabu solutions and force the algorithm to focus on unex-plored areas of the search space. The list is typically finite, however, and eventually the oldest members of the list are re-moved. After a set number of iterations, the best solution(s) found so far are presented as the results.
A different approach is the ant colony approach, which is based on the behaviour of ant colonies in nature [28,29]. Antsuse pheromone trails to establish and navigate efficient routes between food sources and their nest; poor routes disappearover time as less ants use them, while good routes are reinforced by more and more ants using them. Ant colony optimisa-tion works in the same way: in each iteration, one solution is used as the base and the neighbouring solutions are exploredby the ‘ants’. Good solutions are reinforced and in the next iteration, the best solution found is used as the next base or ‘nest’.
Simulated annealing is another technique, this time based on metallurgical annealing (i.e. controlling the rate of cooling inmetal to encourage the atoms in the metal to form stronger shapes) [30]. In simulated annealing, the current solution ischanged in some random way to obtain a different solution; whether or not that new solution is accepted depends onthe global temperature: a hot temperature allows more radical changes, a cool temperature permits only minor changes.At each stage, the most optimal solution is chosen from those allowed, and then the temperature is lowered and the processcontinues.
Another approach is to use genetic algorithms [31]. Genetic algorithms are designed to mimic the evolution of biologicallife in nature: a population of different candidates are evaluated according to their fitness and the best are chosen to repro-duce and form the basis of the next generation of candidates. Each candidate is represented using a ‘genetic’ encoding, whichdescribes its characteristics; when two candidates are chosen to produce a new design candidate, their encodings are sub-jected to crossover, i.e. the encoding of the new design is a mix of the encodings of its ancestor candidates. This promotesconvergence on optimal solutions by ensuring ‘survival of the fittest’. In addition, random mutation is included to allow agreater portion of the search space to be explored and to try to limit the likelihood of becoming stuck in a local optimum.
There are different versions of genetic algorithms tailored towards different goals. One form of genetic algorithm is thepenalty-based approach; in this form, the multiple objectives are combined into a single function. One objective (e.g. reli-ability) is optimised, but constraints on the other objectives (e.g. cost, weight, etc.) are imposed and any infringement ofthose constraints incurs a penalty which is subtracted from the fitness score for the candidate. Thus if two potential solutionshave the same reliability, but one violates the constraints, it is ranked lower than the one that does not violate the con-straints. The penalty incurred can be tweaked so that the design space is not too confined, e.g. by having smaller penaltiesat the start of the optimisation and steadily increasing them as time goes on, which can result in better solutions [32].
Another form of genetic algorithm is the Non-Dominated Sorting Genetic Algorithm (NSGA-II) [33], which is a true multi-objective approach (as opposed to the penalty-based approach, which combines multiple objectives into one). Full multi-objective approaches tend to be better at exploring the design space more widely, albeit typically with a performance pen-alty, since more evaluation is taking place. NSGA-II works by constructing a multi-dimensional graph plotting the currentsolutions in the population, as in the example of Fig. 1.
For a given solution B, if there is another solution A that is better in at least one objective and no worse in any others, thensolution B is said to be dominated by A. The set of all non-dominated solutions is known as the Pareto front, and is the set ofcurrently identified optimal solutions. These represent different trade-offs between the multiple objectives, e.g. one mighthave the best reliability for a given high cost, whereas another might have the lowest cost for a lower reliability value; atone extreme the Pareto front would contain the cheapest solution and at the other extreme it would contain the most reli-able. The nature of the Pareto front means that it is not possible to move from one solution to another without sacrificing atleast one objective, e.g. one could not choose a more reliable solution from the Pareto front without also increasing cost (orsome other objective). The Pareto front can be managed using different techniques to ensure a good base population for thenext generation, e.g. by pruning out clusters of similar solutions (so the Pareto solutions remain more widely spread out overthe search space).
2.3.3. Choosing an optimisation algorithmAlthough there are many different optimisation techniques – and many variations of individual techniques – for the pur-
poses of design optimisation, the most suitable techniques are those that allow multiple objectives to be considered, sincesafety and/or reliability are rarely the only factors being considered. In particular, cost is typically a critical factor, and
Fig. 1. Dominated & non-dominated solutions.
596 Y. Papadopoulos et al. / Engineering Failure Analysis 18 (2011) 590–608
depending on the nature of the system, other objectives like weight, volume, or timing (i.e. performance of software) mayform elements of the optimisation as well.
For our purposes in HiP-HOPS, we developed a modification of the NSGA-II variant of the genetic algorithm approach.Genetic algorithms offer one of the best balances between design space exploration and convergence on optimal solutionsbecause of the combination of the crossover and mutation operators. They are also readily adaptable to multiple objectives.Although different multi-objective genetic algorithms exist, e.g. PESA-II and SPEA2, NSGA-II is regarded as efficient and well-tested [34] and it is more open to modification than some of the others. The optimisation process used in HiP-HOPS is de-scribed in more detail in Section 4.
3. Safety analysis using HiP-HOPS
HiP-HOPS is a compositional safety analysis tool that takes a set of local component failure data, which describes howoutput failures of those components are generated from combinations of internal failure modes and deviations receivedat the components’ inputs, and then synthesises fault trees that reflect the propagation of failures throughout the whole sys-tem. From those fault trees, it can generate both qualitative and quantitative results as well as a multiple failure mode FMEA[35].
A HiP-HOPS study of a system design typically has three main phases:
� Modelling phase: system modelling & failure annotation.� Synthesis phase: fault tree synthesis.� Analysis phase: fault tree analysis & FMEA synthesis.
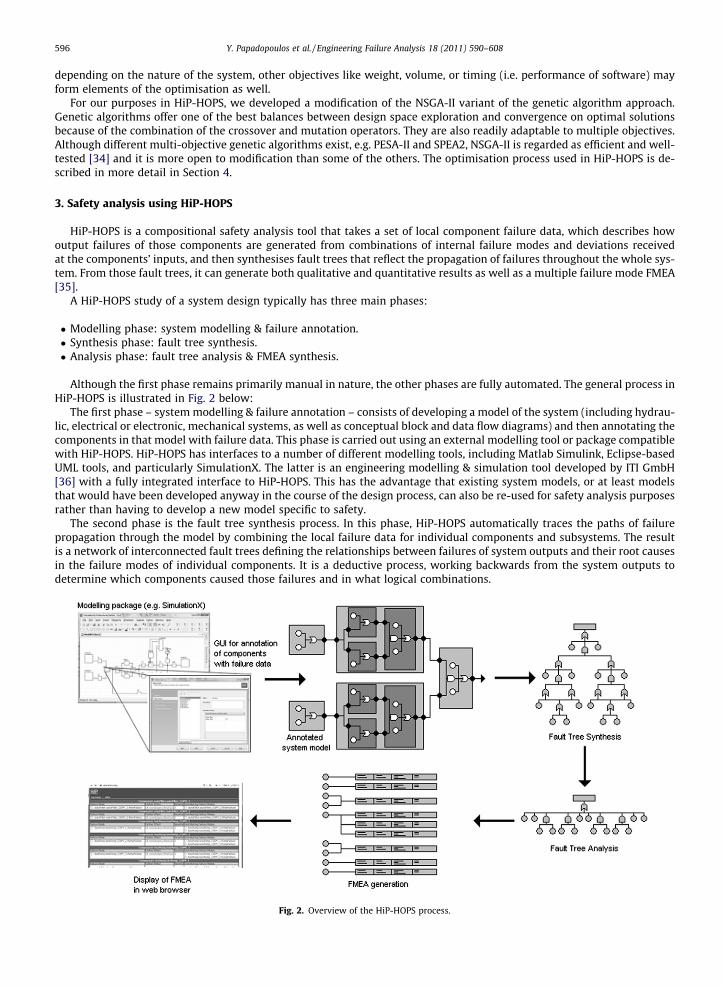
Although the first phase remains primarily manual in nature, the other phases are fully automated. The general process inHiP-HOPS is illustrated in Fig. 2 below:
The first phase – system modelling & failure annotation – consists of developing a model of the system (including hydrau-lic, electrical or electronic, mechanical systems, as well as conceptual block and data flow diagrams) and then annotating thecomponents in that model with failure data. This phase is carried out using an external modelling tool or package compatiblewith HiP-HOPS. HiP-HOPS has interfaces to a number of different modelling tools, including Matlab Simulink, Eclipse-basedUML tools, and particularly SimulationX. The latter is an engineering modelling & simulation tool developed by ITI GmbH[36] with a fully integrated interface to HiP-HOPS. This has the advantage that existing system models, or at least modelsthat would have been developed anyway in the course of the design process, can also be re-used for safety analysis purposesrather than having to develop a new model specific to safety.
The second phase is the fault tree synthesis process. In this phase, HiP-HOPS automatically traces the paths of failurepropagation through the model by combining the local failure data for individual components and subsystems. The resultis a network of interconnected fault trees defining the relationships between failures of system outputs and their root causesin the failure modes of individual components. It is a deductive process, working backwards from the system outputs todetermine which components caused those failures and in what logical combinations.
Fig. 2. Overview of the HiP-HOPS process.
Y. Papadopoulos et al. / Engineering Failure Analysis 18 (2011) 590–608 597
The final phase involves the analysis of those fault trees and the generation of an FMEA. The fault trees are first minimisedto obtain the minimal cut sets – the smallest possible combinations of failures capable of causing any given system failure –and these are then used as the basis of both quantitative analysis (to determine the probability of a system failure) and theFMEA, which directly relates individual component failures to their effects on the rest of the system. The FMEA takes theform of a table indicating which system failures are caused by each component failure.
The various phases of a HiP-HOPS safety analysis will now be described in more detail.
3.1. Modelling phase
HiP-HOP studies can be performed on any model of a system that identifies components and the material, energy or datatransactions among those components. Typically these models will have been produced in a modelling tool such as MatlabSimulink or SimulationX. In addition, the models can be defined hierarchically, using a composition of components and sub-systems, to help manage complexity. Failures can therefore propagate ‘vertically’ through the hierarchy as well as horizon-tally through the system.
Once a model has been obtained, it is necessary to annotate it with failure data. At its core, HiP-HOPS operates on the ideathat an output failure of a component is caused by a logical combination of input failures and internal faults and that theoutput failure will then propagate along structural connections in the model to another component to be received as anew input failure. Thus for the purposes of the safety analysis, each component in the model needs to be annotated withits own local failure data, describing how that component can fail and how it responds to failures propagated from othercomponents in the system.
The local failure data takes the form of a set of failure expressions relating failures at a component’s outputs (known asoutput deviations) to a logical combination of internal failure modes (basic events) and input deviations (i.e. failures received atthe component’s inputs). For the specification of input and output deviations, a generic and abstract syntax was developed,consisting of two parts; the first part is the failure class, an identifier that describes the type of failure, and the second is theinput or output port at which the failure is received or propagated. There are different ways of classifying failures, e.g. byrelating them to the function of the component, or by classifying according to the degree of failure – complete, partial, inter-mittent, etc. [37]. In general, however, the failure of a component will have adverse local effects on the outputs of the com-ponent which, in turn, may cause further effects travelling though the system on material, energy or data exchanged withother components. Therefore in HiP-HOPS, we generally classify the effects into one of three main failure classes, all equallyapplicable to material, energy or data outputs: omissions, i.e. the failure to provide the input or output; commissions, i.e. acondition in which the input or output is provided inadvertently and in the wrong context of operation; and finally malfunc-tions, a general condition in which the input or output is provided but in a form which deviates from the design intention, e.g.with a value that exceeds thresholds or is transmitted at the wrong time. Since this classification adopts a functional view-point which is independent of technology, it could provide a common basis for describing component failures and their localeffects. However, HiP-HOPS can work with any classification of failures as long as it is used consistently from one componentto the next, and indeed it allows users to define their own failure classes.
In HiP-HOPS, failure classes are often abbreviated, e.g. O = Omission, C = Commission, V = Value, etc., and combined withthe name of the port at which they occur, thus ‘‘O-input1” might be an omission of input at port ‘‘input1”. Sometimes it isuseful to parameterise the failure class as well, e.g. OF for omission of flow or HP for high pressure, etc. HiP-HOPS also makesuse of the standard Boolean logic operators AND and OR to combine input deviations and basic events and then relate theseto a given output deviation, e.g. ‘‘O-out1 = O-in1 OR internalFailure” is an expression that describes how an omission of out-put is caused by a corresponding omission of input or some internal failure of the component itself. Internal failure modestypically depend on the domain, e.g. a blockage for a hydraulic system or a short circuit in an electrical system, etc. Note thatfailure classes can also be transformed from input to output; for example, if a particular component was designed to fail si-lent in response to input errors, it may transform value input failures into an omission of output: ‘‘O-out = V-in OR C-in”, etc.In this way, mitigation of failures can also be represented.
The set of failure expressions for a component therefore describes all possible deviations of all outputs for that compo-nent in terms of its possible internal failure modes and any relevant deviations at its inputs (which are in turn propagatedfrom output deviations of other components). In addition to the logical information, it is possible to add numerical data forthe failure modes of the component, detailing the probability of the occurrence each failure. HiP-HOPS allows multiple dif-ferent probabilistic models to be used, e.g. constant failure & repair rates, MTTF & MTTR values, Binomial and Poisson dis-tributions, dormant failures, and Weibull variable failure rates, etc. This provides a great deal of flexibility when modellingthe quantitative aspects of component failure (assuming the probability data for the failure modes are available). This data islater used to arrive at an estimate of the unavailability for each system failure.
The local failure data – both the logical expressions and the probabilistic data – can also be stored in a component library,allowing it to be re-used in other system models and thereby reducing the time needed for failure annotations of future sys-tems. Since the failure data is local to each component, there are no dependencies on other components that would compli-cate their reuse.
As an example of local component failure data in HiP-HOPS, Fig. 3 below shows an analysis of a computer controlledvalve. The figure shows the valve as it might be illustrated in a plant diagram and records the results of the local safety anal-ysis of the component in two tables that define the internal failure modes of the valve and its output deviations respectively.
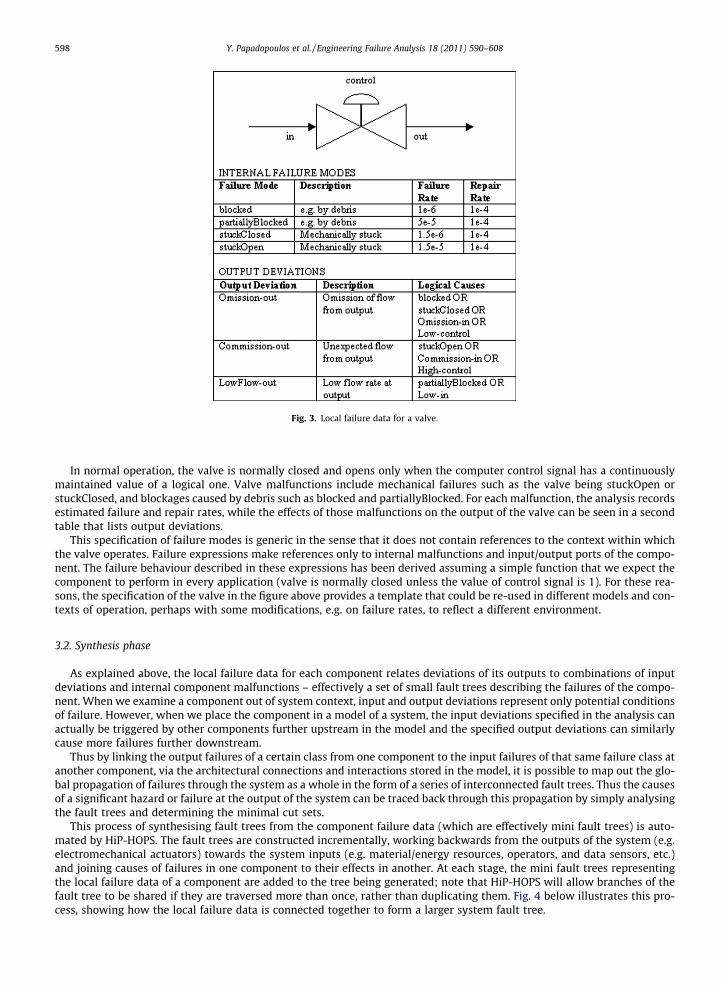
Fig. 3. Local failure data for a valve.
598 Y. Papadopoulos et al. / Engineering Failure Analysis 18 (2011) 590–608
In normal operation, the valve is normally closed and opens only when the computer control signal has a continuouslymaintained value of a logical one. Valve malfunctions include mechanical failures such as the valve being stuckOpen orstuckClosed, and blockages caused by debris such as blocked and partiallyBlocked. For each malfunction, the analysis recordsestimated failure and repair rates, while the effects of those malfunctions on the output of the valve can be seen in a secondtable that lists output deviations.
This specification of failure modes is generic in the sense that it does not contain references to the context within whichthe valve operates. Failure expressions make references only to internal malfunctions and input/output ports of the compo-nent. The failure behaviour described in these expressions has been derived assuming a simple function that we expect thecomponent to perform in every application (valve is normally closed unless the value of control signal is 1). For these rea-sons, the specification of the valve in the figure above provides a template that could be re-used in different models and con-texts of operation, perhaps with some modifications, e.g. on failure rates, to reflect a different environment.
3.2. Synthesis phase
As explained above, the local failure data for each component relates deviations of its outputs to combinations of inputdeviations and internal component malfunctions – effectively a set of small fault trees describing the failures of the compo-nent. When we examine a component out of system context, input and output deviations represent only potential conditionsof failure. However, when we place the component in a model of a system, the input deviations specified in the analysis canactually be triggered by other components further upstream in the model and the specified output deviations can similarlycause more failures further downstream.
Thus by linking the output failures of a certain class from one component to the input failures of that same failure class atanother component, via the architectural connections and interactions stored in the model, it is possible to map out the glo-bal propagation of failures through the system as a whole in the form of a series of interconnected fault trees. Thus the causesof a significant hazard or failure at the output of the system can be traced back through this propagation by simply analysingthe fault trees and determining the minimal cut sets.
This process of synthesising fault trees from the component failure data (which are effectively mini fault trees) is auto-mated by HiP-HOPS. The fault trees are constructed incrementally, working backwards from the outputs of the system (e.g.electromechanical actuators) towards the system inputs (e.g. material/energy resources, operators, and data sensors, etc.)and joining causes of failures in one component to their effects in another. At each stage, the mini fault trees representingthe local failure data of a component are added to the tree being generated; note that HiP-HOPS will allow branches of thefault tree to be shared if they are traversed more than once, rather than duplicating them. Fig. 4 below illustrates this pro-cess, showing how the local failure data is connected together to form a larger system fault tree.
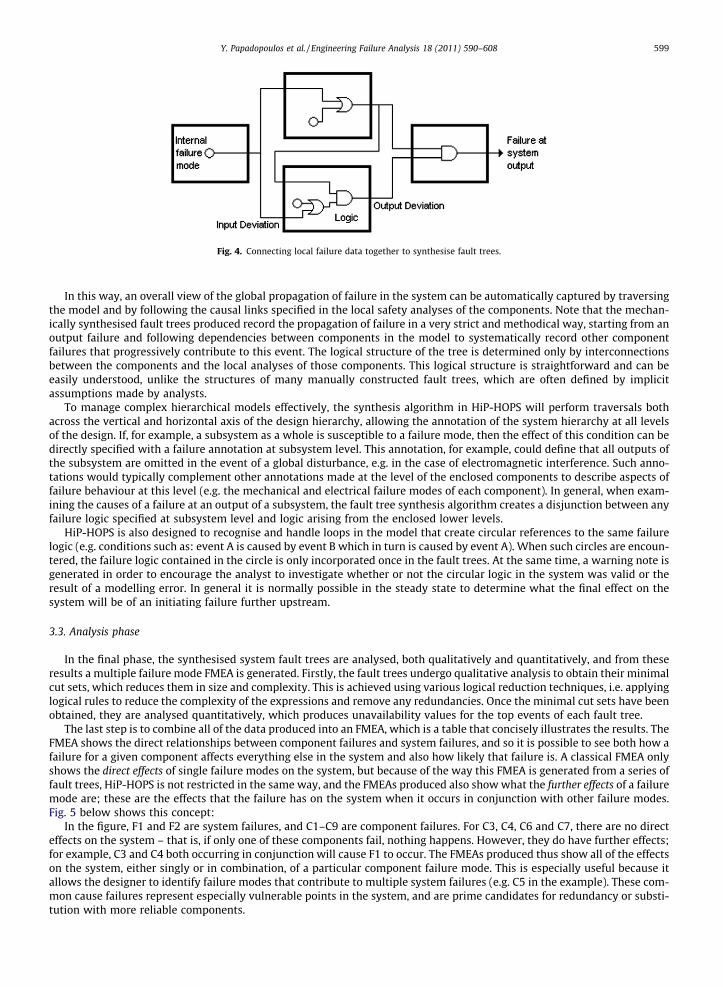
Fig. 4. Connecting local failure data together to synthesise fault trees.
Y. Papadopoulos et al. / Engineering Failure Analysis 18 (2011) 590–608 599
In this way, an overall view of the global propagation of failure in the system can be automatically captured by traversingthe model and by following the causal links specified in the local safety analyses of the components. Note that the mechan-ically synthesised fault trees produced record the propagation of failure in a very strict and methodical way, starting from anoutput failure and following dependencies between components in the model to systematically record other componentfailures that progressively contribute to this event. The logical structure of the tree is determined only by interconnectionsbetween the components and the local analyses of those components. This logical structure is straightforward and can beeasily understood, unlike the structures of many manually constructed fault trees, which are often defined by implicitassumptions made by analysts.
To manage complex hierarchical models effectively, the synthesis algorithm in HiP-HOPS will perform traversals bothacross the vertical and horizontal axis of the design hierarchy, allowing the annotation of the system hierarchy at all levelsof the design. If, for example, a subsystem as a whole is susceptible to a failure mode, then the effect of this condition can bedirectly specified with a failure annotation at subsystem level. This annotation, for example, could define that all outputs ofthe subsystem are omitted in the event of a global disturbance, e.g. in the case of electromagnetic interference. Such anno-tations would typically complement other annotations made at the level of the enclosed components to describe aspects offailure behaviour at this level (e.g. the mechanical and electrical failure modes of each component). In general, when exam-ining the causes of a failure at an output of a subsystem, the fault tree synthesis algorithm creates a disjunction between anyfailure logic specified at subsystem level and logic arising from the enclosed lower levels.
HiP-HOPS is also designed to recognise and handle loops in the model that create circular references to the same failurelogic (e.g. conditions such as: event A is caused by event B which in turn is caused by event A). When such circles are encoun-tered, the failure logic contained in the circle is only incorporated once in the fault trees. At the same time, a warning note isgenerated in order to encourage the analyst to investigate whether or not the circular logic in the system was valid or theresult of a modelling error. In general it is normally possible in the steady state to determine what the final effect on thesystem will be of an initiating failure further upstream.
3.3. Analysis phase
In the final phase, the synthesised system fault trees are analysed, both qualitatively and quantitatively, and from theseresults a multiple failure mode FMEA is generated. Firstly, the fault trees undergo qualitative analysis to obtain their minimalcut sets, which reduces them in size and complexity. This is achieved using various logical reduction techniques, i.e. applyinglogical rules to reduce the complexity of the expressions and remove any redundancies. Once the minimal cut sets have beenobtained, they are analysed quantitatively, which produces unavailability values for the top events of each fault tree.
The last step is to combine all of the data produced into an FMEA, which is a table that concisely illustrates the results. TheFMEA shows the direct relationships between component failures and system failures, and so it is possible to see both how afailure for a given component affects everything else in the system and also how likely that failure is. A classical FMEA onlyshows the direct effects of single failure modes on the system, but because of the way this FMEA is generated from a series offault trees, HiP-HOPS is not restricted in the same way, and the FMEAs produced also show what the further effects of a failuremode are; these are the effects that the failure has on the system when it occurs in conjunction with other failure modes.Fig. 5 below shows this concept:
In the figure, F1 and F2 are system failures, and C1–C9 are component failures. For C3, C4, C6 and C7, there are no directeffects on the system – that is, if only one of these components fail, nothing happens. However, they do have further effects;for example, C3 and C4 both occurring in conjunction will cause F1 to occur. The FMEAs produced thus show all of the effectson the system, either singly or in combination, of a particular component failure mode. This is especially useful because itallows the designer to identify failure modes that contribute to multiple system failures (e.g. C5 in the example). These com-mon cause failures represent especially vulnerable points in the system, and are prime candidates for redundancy or substi-tution with more reliable components.
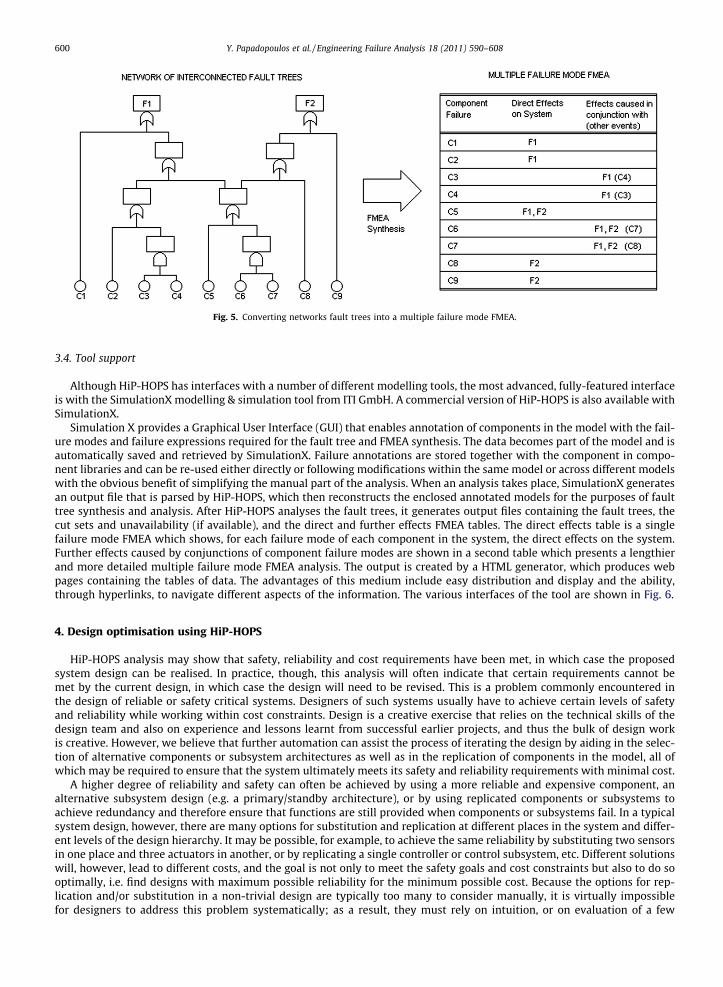
Fig. 5. Converting networks fault trees into a multiple failure mode FMEA.
600 Y. Papadopoulos et al. / Engineering Failure Analysis 18 (2011) 590–608
3.4. Tool support
Although HiP-HOPS has interfaces with a number of different modelling tools, the most advanced, fully-featured interfaceis with the SimulationX modelling & simulation tool from ITI GmbH. A commercial version of HiP-HOPS is also available withSimulationX.
Simulation X provides a Graphical User Interface (GUI) that enables annotation of components in the model with the fail-ure modes and failure expressions required for the fault tree and FMEA synthesis. The data becomes part of the model and isautomatically saved and retrieved by SimulationX. Failure annotations are stored together with the component in compo-nent libraries and can be re-used either directly or following modifications within the same model or across different modelswith the obvious benefit of simplifying the manual part of the analysis. When an analysis takes place, SimulationX generatesan output file that is parsed by HiP-HOPS, which then reconstructs the enclosed annotated models for the purposes of faulttree synthesis and analysis. After HiP-HOPS analyses the fault trees, it generates output files containing the fault trees, thecut sets and unavailability (if available), and the direct and further effects FMEA tables. The direct effects table is a singlefailure mode FMEA which shows, for each failure mode of each component in the system, the direct effects on the system.Further effects caused by conjunctions of component failure modes are shown in a second table which presents a lengthierand more detailed multiple failure mode FMEA analysis. The output is created by a HTML generator, which produces webpages containing the tables of data. The advantages of this medium include easy distribution and display and the ability,through hyperlinks, to navigate different aspects of the information. The various interfaces of the tool are shown in Fig. 6.
4. Design optimisation using HiP-HOPS
HiP-HOPS analysis may show that safety, reliability and cost requirements have been met, in which case the proposedsystem design can be realised. In practice, though, this analysis will often indicate that certain requirements cannot bemet by the current design, in which case the design will need to be revised. This is a problem commonly encountered inthe design of reliable or safety critical systems. Designers of such systems usually have to achieve certain levels of safetyand reliability while working within cost constraints. Design is a creative exercise that relies on the technical skills of thedesign team and also on experience and lessons learnt from successful earlier projects, and thus the bulk of design workis creative. However, we believe that further automation can assist the process of iterating the design by aiding in the selec-tion of alternative components or subsystem architectures as well as in the replication of components in the model, all ofwhich may be required to ensure that the system ultimately meets its safety and reliability requirements with minimal cost.
A higher degree of reliability and safety can often be achieved by using a more reliable and expensive component, analternative subsystem design (e.g. a primary/standby architecture), or by using replicated components or subsystems toachieve redundancy and therefore ensure that functions are still provided when components or subsystems fail. In a typicalsystem design, however, there are many options for substitution and replication at different places in the system and differ-ent levels of the design hierarchy. It may be possible, for example, to achieve the same reliability by substituting two sensorsin one place and three actuators in another, or by replicating a single controller or control subsystem, etc. Different solutionswill, however, lead to different costs, and the goal is not only to meet the safety goals and cost constraints but also to do sooptimally, i.e. find designs with maximum possible reliability for the minimum possible cost. Because the options for rep-lication and/or substitution in a non-trivial design are typically too many to consider manually, it is virtually impossiblefor designers to address this problem systematically; as a result, they must rely on intuition, or on evaluation of a few
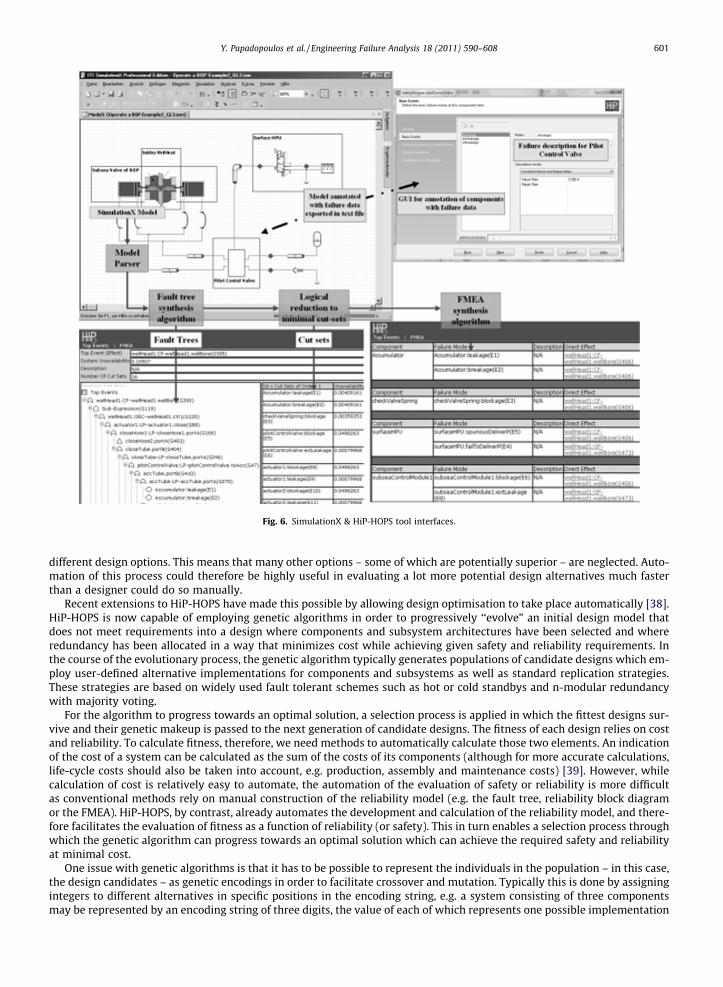
Fig. 6. SimulationX & HiP-HOPS tool interfaces.
Y. Papadopoulos et al. / Engineering Failure Analysis 18 (2011) 590–608 601
different design options. This means that many other options – some of which are potentially superior – are neglected. Auto-mation of this process could therefore be highly useful in evaluating a lot more potential design alternatives much fasterthan a designer could do so manually.
Recent extensions to HiP-HOPS have made this possible by allowing design optimisation to take place automatically [38].HiP-HOPS is now capable of employing genetic algorithms in order to progressively ‘‘evolve” an initial design model thatdoes not meet requirements into a design where components and subsystem architectures have been selected and whereredundancy has been allocated in a way that minimizes cost while achieving given safety and reliability requirements. Inthe course of the evolutionary process, the genetic algorithm typically generates populations of candidate designs which em-ploy user-defined alternative implementations for components and subsystems as well as standard replication strategies.These strategies are based on widely used fault tolerant schemes such as hot or cold standbys and n-modular redundancywith majority voting.
For the algorithm to progress towards an optimal solution, a selection process is applied in which the fittest designs sur-vive and their genetic makeup is passed to the next generation of candidate designs. The fitness of each design relies on costand reliability. To calculate fitness, therefore, we need methods to automatically calculate those two elements. An indicationof the cost of a system can be calculated as the sum of the costs of its components (although for more accurate calculations,life-cycle costs should also be taken into account, e.g. production, assembly and maintenance costs) [39]. However, whilecalculation of cost is relatively easy to automate, the automation of the evaluation of safety or reliability is more difficultas conventional methods rely on manual construction of the reliability model (e.g. the fault tree, reliability block diagramor the FMEA). HiP-HOPS, by contrast, already automates the development and calculation of the reliability model, and there-fore facilitates the evaluation of fitness as a function of reliability (or safety). This in turn enables a selection process throughwhich the genetic algorithm can progress towards an optimal solution which can achieve the required safety and reliabilityat minimal cost.
One issue with genetic algorithms is that it has to be possible to represent the individuals in the population – in this case,the design candidates – as genetic encodings in order to facilitate crossover and mutation. Typically this is done by assigningintegers to different alternatives in specific positions in the encoding string, e.g. a system consisting of three componentsmay be represented by an encoding string of three digits, the value of each of which represents one possible implementation
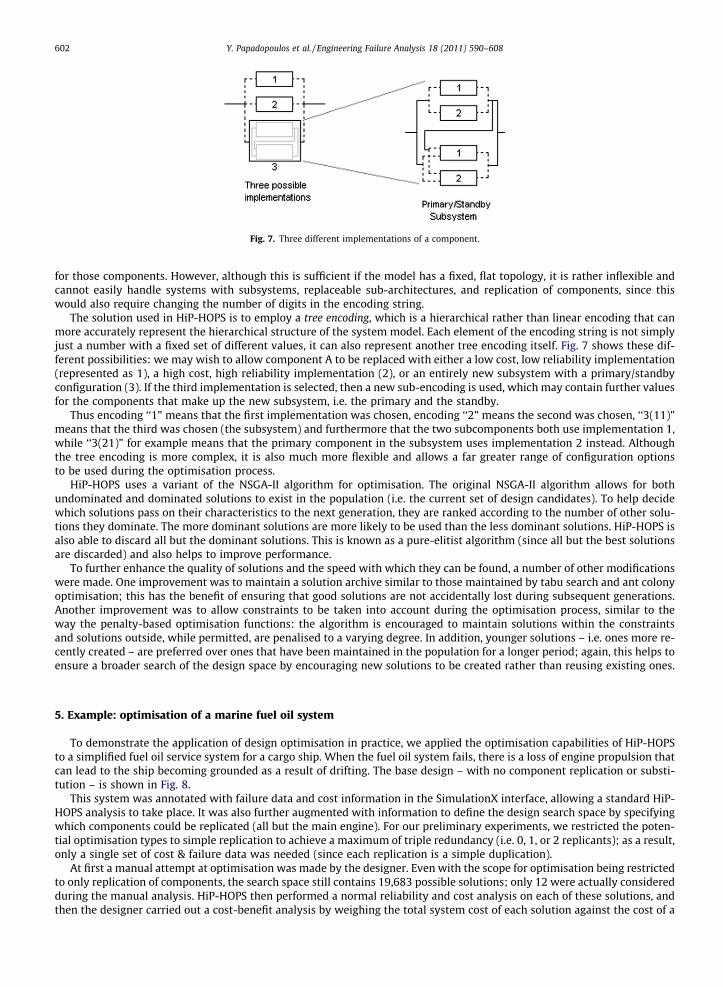
Fig. 7. Three different implementations of a component.
602 Y. Papadopoulos et al. / Engineering Failure Analysis 18 (2011) 590–608
for those components. However, although this is sufficient if the model has a fixed, flat topology, it is rather inflexible andcannot easily handle systems with subsystems, replaceable sub-architectures, and replication of components, since thiswould also require changing the number of digits in the encoding string.
The solution used in HiP-HOPS is to employ a tree encoding, which is a hierarchical rather than linear encoding that canmore accurately represent the hierarchical structure of the system model. Each element of the encoding string is not simplyjust a number with a fixed set of different values, it can also represent another tree encoding itself. Fig. 7 shows these dif-ferent possibilities: we may wish to allow component A to be replaced with either a low cost, low reliability implementation(represented as 1), a high cost, high reliability implementation (2), or an entirely new subsystem with a primary/standbyconfiguration (3). If the third implementation is selected, then a new sub-encoding is used, which may contain further valuesfor the components that make up the new subsystem, i.e. the primary and the standby.
Thus encoding ‘‘1” means that the first implementation was chosen, encoding ‘‘2” means the second was chosen, ‘‘3(11)”means that the third was chosen (the subsystem) and furthermore that the two subcomponents both use implementation 1,while ‘‘3(21)” for example means that the primary component in the subsystem uses implementation 2 instead. Althoughthe tree encoding is more complex, it is also much more flexible and allows a far greater range of configuration optionsto be used during the optimisation process.
HiP-HOPS uses a variant of the NSGA-II algorithm for optimisation. The original NSGA-II algorithm allows for bothundominated and dominated solutions to exist in the population (i.e. the current set of design candidates). To help decidewhich solutions pass on their characteristics to the next generation, they are ranked according to the number of other solu-tions they dominate. The more dominant solutions are more likely to be used than the less dominant solutions. HiP-HOPS isalso able to discard all but the dominant solutions. This is known as a pure-elitist algorithm (since all but the best solutionsare discarded) and also helps to improve performance.
To further enhance the quality of solutions and the speed with which they can be found, a number of other modificationswere made. One improvement was to maintain a solution archive similar to those maintained by tabu search and ant colonyoptimisation; this has the benefit of ensuring that good solutions are not accidentally lost during subsequent generations.Another improvement was to allow constraints to be taken into account during the optimisation process, similar to theway the penalty-based optimisation functions: the algorithm is encouraged to maintain solutions within the constraintsand solutions outside, while permitted, are penalised to a varying degree. In addition, younger solutions – i.e. ones more re-cently created – are preferred over ones that have been maintained in the population for a longer period; again, this helps toensure a broader search of the design space by encouraging new solutions to be created rather than reusing existing ones.
5. Example: optimisation of a marine fuel oil system
To demonstrate the application of design optimisation in practice, we applied the optimisation capabilities of HiP-HOPSto a simplified fuel oil service system for a cargo ship. When the fuel oil system fails, there is a loss of engine propulsion thatcan lead to the ship becoming grounded as a result of drifting. The base design – with no component replication or substi-tution – is shown in Fig. 8.
This system was annotated with failure data and cost information in the SimulationX interface, allowing a standard HiP-HOPS analysis to take place. It was also further augmented with information to define the design search space by specifyingwhich components could be replicated (all but the main engine). For our preliminary experiments, we restricted the poten-tial optimisation types to simple replication to achieve a maximum of triple redundancy (i.e. 0, 1, or 2 replicants); as a result,only a single set of cost & failure data was needed (since each replication is a simple duplication).
At first a manual attempt at optimisation was made by the designer. Even with the scope for optimisation being restrictedto only replication of components, the search space still contains 19,683 possible solutions; only 12 were actually consideredduring the manual analysis. HiP-HOPS then performed a normal reliability and cost analysis on each of these solutions, andthen the designer carried out a cost-benefit analysis by weighing the total system cost of each solution against the cost of a
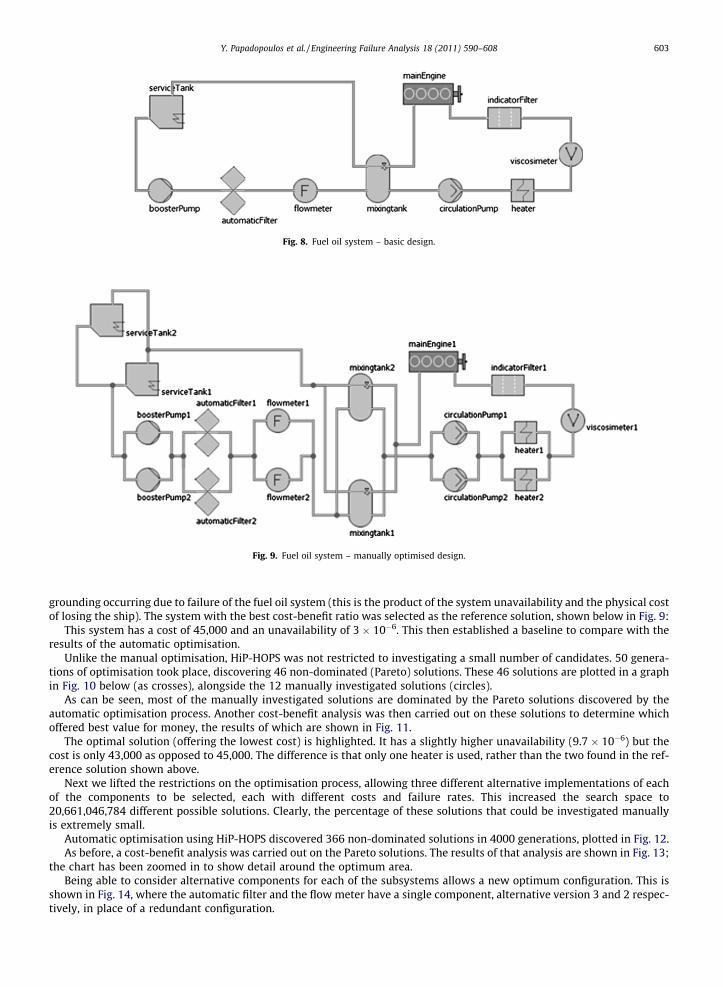
Fig. 8. Fuel oil system – basic design.
Fig. 9. Fuel oil system – manually optimised design.
Y. Papadopoulos et al. / Engineering Failure Analysis 18 (2011) 590–608 603
grounding occurring due to failure of the fuel oil system (this is the product of the system unavailability and the physical costof losing the ship). The system with the best cost-benefit ratio was selected as the reference solution, shown below in Fig. 9:
This system has a cost of 45,000 and an unavailability of 3 � 10�6. This then established a baseline to compare with theresults of the automatic optimisation.
Unlike the manual optimisation, HiP-HOPS was not restricted to investigating a small number of candidates. 50 genera-tions of optimisation took place, discovering 46 non-dominated (Pareto) solutions. These 46 solutions are plotted in a graphin Fig. 10 below (as crosses), alongside the 12 manually investigated solutions (circles).
As can be seen, most of the manually investigated solutions are dominated by the Pareto solutions discovered by theautomatic optimisation process. Another cost-benefit analysis was then carried out on these solutions to determine whichoffered best value for money, the results of which are shown in Fig. 11.
The optimal solution (offering the lowest cost) is highlighted. It has a slightly higher unavailability (9.7 � 10�6) but thecost is only 43,000 as opposed to 45,000. The difference is that only one heater is used, rather than the two found in the ref-erence solution shown above.
Next we lifted the restrictions on the optimisation process, allowing three different alternative implementations of eachof the components to be selected, each with different costs and failure rates. This increased the search space to20,661,046,784 different possible solutions. Clearly, the percentage of these solutions that could be investigated manuallyis extremely small.
Automatic optimisation using HiP-HOPS discovered 366 non-dominated solutions in 4000 generations, plotted in Fig. 12.As before, a cost-benefit analysis was carried out on the Pareto solutions. The results of that analysis are shown in Fig. 13;
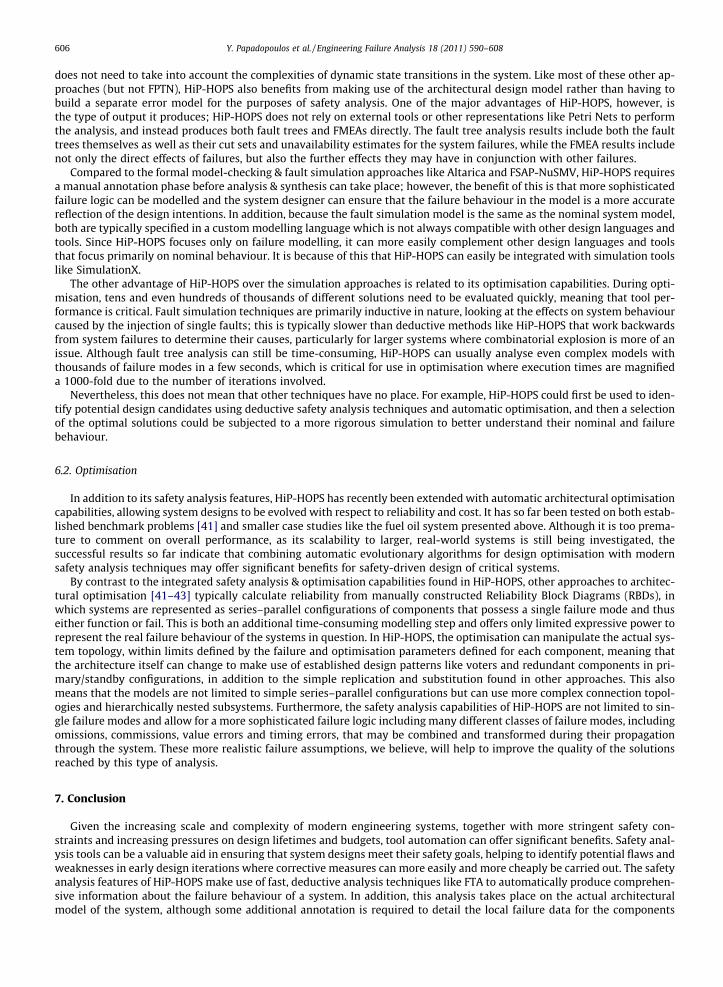
the chart has been zoomed in to show detail around the optimum area.Being able to consider alternative components for each of the subsystems allows a new optimum configuration. This is
shown in Fig. 14, where the automatic filter and the flow meter have a single component, alternative version 3 and 2 respec-tively, in place of a redundant configuration.
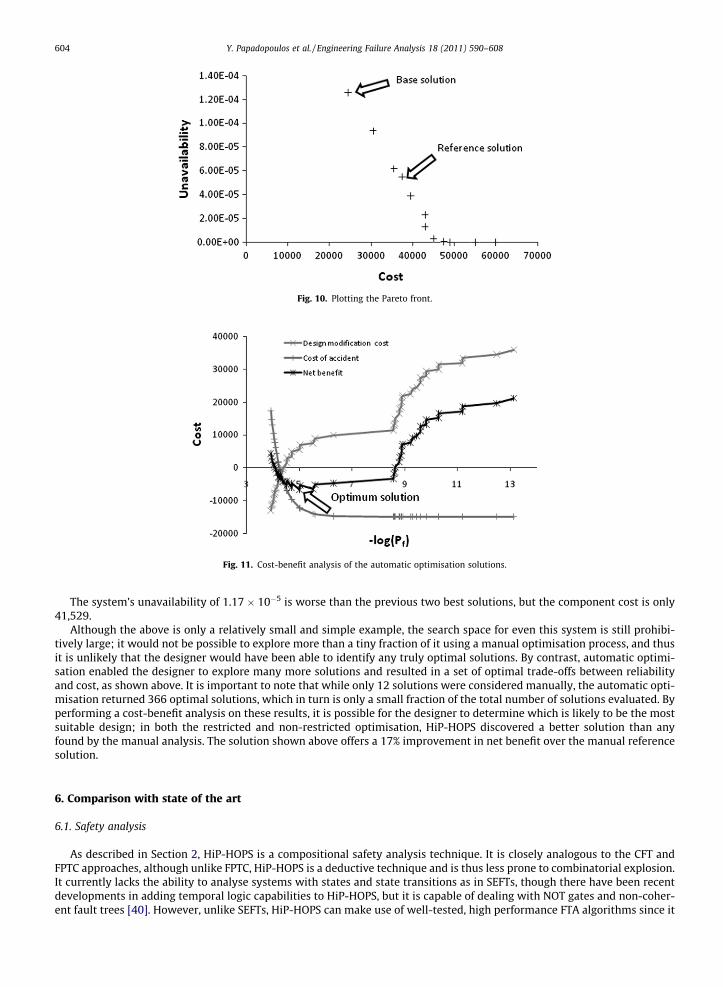
Fig. 10. Plotting the Pareto front.
Fig. 11. Cost-benefit analysis of the automatic optimisation solutions.
604 Y. Papadopoulos et al. / Engineering Failure Analysis 18 (2011) 590–608
The system’s unavailability of 1.17 � 10�5 is worse than the previous two best solutions, but the component cost is only41,529.
Although the above is only a relatively small and simple example, the search space for even this system is still prohibi-tively large; it would not be possible to explore more than a tiny fraction of it using a manual optimisation process, and thusit is unlikely that the designer would have been able to identify any truly optimal solutions. By contrast, automatic optimi-sation enabled the designer to explore many more solutions and resulted in a set of optimal trade-offs between reliabilityand cost, as shown above. It is important to note that while only 12 solutions were considered manually, the automatic opti-misation returned 366 optimal solutions, which in turn is only a small fraction of the total number of solutions evaluated. Byperforming a cost-benefit analysis on these results, it is possible for the designer to determine which is likely to be the mostsuitable design; in both the restricted and non-restricted optimisation, HiP-HOPS discovered a better solution than anyfound by the manual analysis. The solution shown above offers a 17% improvement in net benefit over the manual referencesolution.
6. Comparison with state of the art
6.1. Safety analysis
As described in Section 2, HiP-HOPS is a compositional safety analysis technique. It is closely analogous to the CFT andFPTC approaches, although unlike FPTC, HiP-HOPS is a deductive technique and is thus less prone to combinatorial explosion.It currently lacks the ability to analyse systems with states and state transitions as in SEFTs, though there have been recentdevelopments in adding temporal logic capabilities to HiP-HOPS, but it is capable of dealing with NOT gates and non-coher-ent fault trees [40]. However, unlike SEFTs, HiP-HOPS can make use of well-tested, high performance FTA algorithms since it
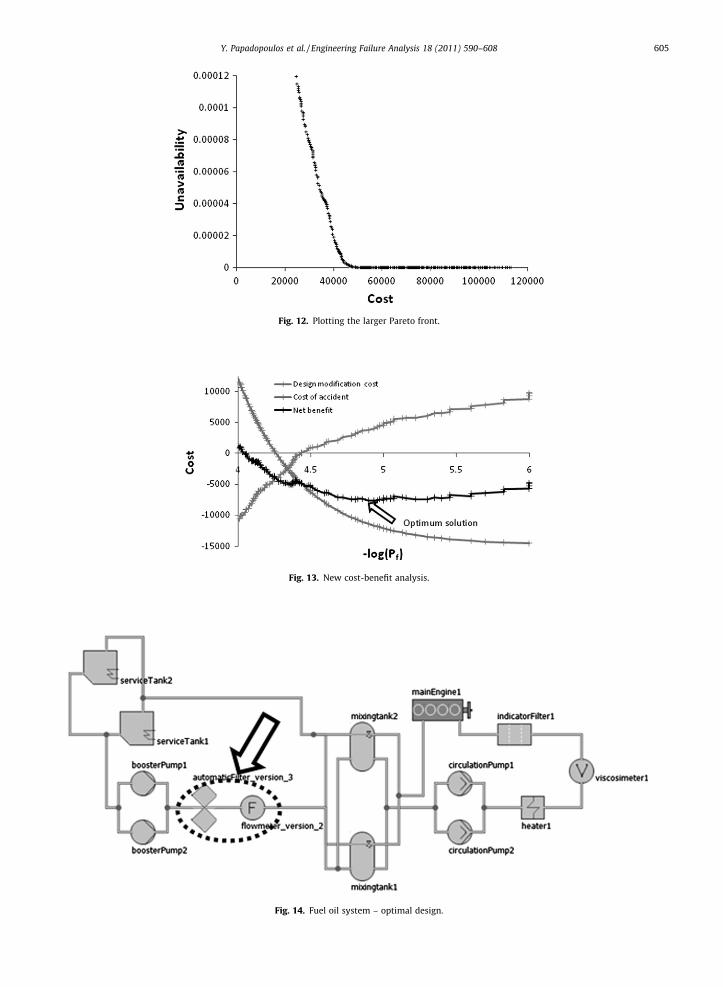
Fig. 12. Plotting the larger Pareto front.
Fig. 13. New cost-benefit analysis.
Fig. 14. Fuel oil system – optimal design.
Y. Papadopoulos et al. / Engineering Failure Analysis 18 (2011) 590–608 605
606 Y. Papadopoulos et al. / Engineering Failure Analysis 18 (2011) 590–608
does not need to take into account the complexities of dynamic state transitions in the system. Like most of these other ap-proaches (but not FPTN), HiP-HOPS also benefits from making use of the architectural design model rather than having tobuild a separate error model for the purposes of safety analysis. One of the major advantages of HiP-HOPS, however, isthe type of output it produces; HiP-HOPS does not rely on external tools or other representations like Petri Nets to performthe analysis, and instead produces both fault trees and FMEAs directly. The fault tree analysis results include both the faulttrees themselves as well as their cut sets and unavailability estimates for the system failures, while the FMEA results includenot only the direct effects of failures, but also the further effects they may have in conjunction with other failures.
Compared to the formal model-checking & fault simulation approaches like Altarica and FSAP-NuSMV, HiP-HOPS requiresa manual annotation phase before analysis & synthesis can take place; however, the benefit of this is that more sophisticatedfailure logic can be modelled and the system designer can ensure that the failure behaviour in the model is a more accuratereflection of the design intentions. In addition, because the fault simulation model is the same as the nominal system model,both are typically specified in a custom modelling language which is not always compatible with other design languages andtools. Since HiP-HOPS focuses only on failure modelling, it can more easily complement other design languages and toolsthat focus primarily on nominal behaviour. It is because of this that HiP-HOPS can easily be integrated with simulation toolslike SimulationX.
The other advantage of HiP-HOPS over the simulation approaches is related to its optimisation capabilities. During opti-misation, tens and even hundreds of thousands of different solutions need to be evaluated quickly, meaning that tool per-formance is critical. Fault simulation techniques are primarily inductive in nature, looking at the effects on system behaviourcaused by the injection of single faults; this is typically slower than deductive methods like HiP-HOPS that work backwardsfrom system failures to determine their causes, particularly for larger systems where combinatorial explosion is more of anissue. Although fault tree analysis can still be time-consuming, HiP-HOPS can usually analyse even complex models withthousands of failure modes in a few seconds, which is critical for use in optimisation where execution times are magnifieda 1000-fold due to the number of iterations involved.
Nevertheless, this does not mean that other techniques have no place. For example, HiP-HOPS could first be used to iden-tify potential design candidates using deductive safety analysis techniques and automatic optimisation, and then a selectionof the optimal solutions could be subjected to a more rigorous simulation to better understand their nominal and failurebehaviour.
6.2. Optimisation
In addition to its safety analysis features, HiP-HOPS has recently been extended with automatic architectural optimisationcapabilities, allowing system designs to be evolved with respect to reliability and cost. It has so far been tested on both estab-lished benchmark problems [41] and smaller case studies like the fuel oil system presented above. Although it is too prema-ture to comment on overall performance, as its scalability to larger, real-world systems is still being investigated, thesuccessful results so far indicate that combining automatic evolutionary algorithms for design optimisation with modernsafety analysis techniques may offer significant benefits for safety-driven design of critical systems.
By contrast to the integrated safety analysis & optimisation capabilities found in HiP-HOPS, other approaches to architec-tural optimisation [41–43] typically calculate reliability from manually constructed Reliability Block Diagrams (RBDs), inwhich systems are represented as series–parallel configurations of components that possess a single failure mode and thuseither function or fail. This is both an additional time-consuming modelling step and offers only limited expressive power torepresent the real failure behaviour of the systems in question. In HiP-HOPS, the optimisation can manipulate the actual sys-tem topology, within limits defined by the failure and optimisation parameters defined for each component, meaning thatthe architecture itself can change to make use of established design patterns like voters and redundant components in pri-mary/standby configurations, in addition to the simple replication and substitution found in other approaches. This alsomeans that the models are not limited to simple series–parallel configurations but can use more complex connection topol-ogies and hierarchically nested subsystems. Furthermore, the safety analysis capabilities of HiP-HOPS are not limited to sin-gle failure modes and allow for a more sophisticated failure logic including many different classes of failure modes, includingomissions, commissions, value errors and timing errors, that may be combined and transformed during their propagationthrough the system. These more realistic failure assumptions, we believe, will help to improve the quality of the solutionsreached by this type of analysis.
7. Conclusion
Given the increasing scale and complexity of modern engineering systems, together with more stringent safety con-straints and increasing pressures on design lifetimes and budgets, tool automation can offer significant benefits. Safety anal-ysis tools can be a valuable aid in ensuring that system designs meet their safety goals, helping to identify potential flaws andweaknesses in early design iterations where corrective measures can more easily and more cheaply be carried out. The safetyanalysis features of HiP-HOPS make use of fast, deductive analysis techniques like FTA to automatically produce comprehen-sive information about the failure behaviour of a system. In addition, this analysis takes place on the actual architecturalmodel of the system, although some additional annotation is required to detail the local failure data for the components

Y. Papadopoulos et al. / Engineering Failure Analysis 18 (2011) 590–608 607
in the system. This means that no separate error model is required and the failure data, once annotated, can be stored innormal component libraries and re-used in different models and contexts with at most minor modifications, resulting inimportant savings in time and effort.
However, even though safety analysis tools like HiP-HOPS can help to ensure that safety is included as a driving factor ineach iteration of the design, the iterations themselves remain a manual process, relying on the intuition and experience ofthe designers to evolve the system in a productive way. Design optimisation tools offer a way of accelerating this process byautomatically investigating many more design possibilities than would be possible to evaluate manually; by adding someadditional information to the system model to define the search space, modern evolutionary optimisation techniques likegenetic algorithms can quickly and efficiently explore that search space to identify optimal solutions that feature improvedtrade-offs between conflicting objectives like cost and reliability. These solutions can then be investigated more closely bythe designers and used as the basis for the next iteration of the system design.
The recent optimisation extensions to HiP-HOPS present a unique capability: by combining fast safety analysis abilitieswith state-of-the-art optimisation technology, it becomes possible to evaluate and optimise system models with regard tomultiple objectives like cost and reliability within the same tool, resulting in a more integrated process with better perfor-mance. Although the technology is still experimental and only preliminary results have been obtained, they suggest that thistype of combined analysis & optimisation automation potentially offers great advantages to designers of modern safety–crit-ical systems. We hope to conduct further research to refine and enhance these optimisation capabilities to allow them to bescaled up to larger, more complex systems and to ensure they produce useful results for real-world engineering systems suchas those found in the marine and automotive transport industries.
Acknowledgements
This work was supported by the EU Projects SAFEDOR (Grant 516278), ATESST2 (Grant 224442), and MAENAD (Grant260057).
References
[1] Uhlig A, Kurzbach G, Hamann R, Papadopoulos Y, Walker M, Lühmann B. Simulation model based risk and reliability analysis. In: Tagung TechnischeZuverlässigkeit, Stuttgart, proceedings on CD; 22–23 April, 2007. ISBN: 978-3-18-091984-3.
[2] Hamann R, Uhlig A, Papadopoulos Y, Rüde E, Grätz U, Walker M, et al. Semi-automatic failure analysis based on simulation models, paper no. In:OMAE2008-57256, proceeding OMAE 2008, Estoril, Portugal; 2008.
[3] Vesely WE, Stamatelatos M, Dugan J, Fragola J, Minarick J, Railsback J. Fault tree handbook with aerospace applications. NASA Office of Safety andMission Assurance; 2002.
[4] US Military. Procedure for performing a failure mode effect and criticality analysis. United States military procedure MIL-P-1629; 1949.[5] Isograph Software. Fault Tree + v11. Software tool; 2002. <http://www.isograph-software.com/index.htm>.[6] Worrell RB, Stack DW. A SETS user manual for the fault tree analyst. NUREG CR-04651, US Nuclear Regulatory Commission; 1978.[7] Lisagor O, McDermid JA, Pumfrey DJ. Towards a practicable process for automated safety analysis. In: Proceedings of the 16th international ship and
offshore structures conference (ISSC’06); 2006.[8] Fenelon P, McDermid JA. An integrated toolset for software safety analysis. J Syst Software 1993;21(3):279–90.[9] Wallace M. Modular architectural representation and analysis of fault propagation. Electron Notes Theor Comput Sci 2005;141(3):53–71.
[10] Ge X, Paige RF, McDermid JA. Probabilistic failure propagation and transformation analysis. Comput Safety, Reliab, Secur 2009;5775:215–28.[11] Grunske L, Kaiser B, Papadopoulos YI. Model-driven safety evaluation with state-event-based component failure annotations. In: 8th international
symposium on component-based software engineering; 2005. p. 33–48.[12] Kaiser B, Gramlich C, Forster M. State/event fault trees – a safety analysis model for software-controlled systems. Reliab Eng Syst Safety
2007;92:1521–37.[13] Grunske L, Kaiser B. An automated dependability analysis method for COTS-based systems. Lecture Notes in Computer Science; 2005. p. 178–90.[14] Grunske L, Neumann R. Quality improvement by integrating non-functional properties in software architecture specification. In: EASY’02 second
workshop on evaluating and architecting system dependability. San Jose, California, USA; 2002. p. 23–32.[15] Ciardo G, Lindermann C. Analysis of deterministic and stochastic Petri nets. In: Proceedings of the 5th international workshop on petri nets and
performance models PNPM’93, Toulouse, France; 1993.[16] Zimmermann A, German R, Freiheit J, Hommel G. TimeNET 3.0 tool description. In: International conference on petri nets and performance models,
Zaragoza, Spain; 1999.[17] Bozzano M, Villafiorita A. The FSAP/NuSMV-SA safety analysis platform. ECAI 2006. Riva del Garda, Italy.[18] Bieber P, Bougnol C, Castel C, Heckmann J-P, Kehren C, Metge S, et al. Safety assessment with AltaRica. In: IFIP congress topical sessions; 2004. p. 505–
10.[19] Griffault A, Arnold A, Point G, Rauzy A. The Altarica formalism for describing concurrent systems. Fundamenta informaticae; 1999. p. 34.[20] McMillan KL. Symbolic model checking. Kluwer Academic Publishers; 1990.[21] Heimdahl MP, Choi Y, Whalen MW. Deviation analysis though model checking. In: Proceedings of the 17th IEEE international conference on automated
software engineering, Edinburgh, UK.[22] Ortmeier F, Reif W, Schellhorn G. Deductive cause-consequence analysis (DCCA). In: The 16th IFAC world congress; 2005.[23] Reer F, Reif W. Using deductive cause-consequence analysis (DCCA) with SCADE. In: 26th International conference in computer safety, reliability and
security; 2007. p. 465–78.[24] Güdemann M, Ortmeier F, Reif W. Computing ordered minimal critical sets. In: Proceedings of formal methods for automation and safety in railway
and automotive systems; 2008.[25] Lisagor O, McDermid JA. Towards a practicable process for automated safety analysis. In: 24th International system safety conference; 2008.[26] Kulturel-Konak S, Smith AE, Coit DW. Efficiently solving the redundancy allocation problem using tabu search. IIE Trans 2003;35:515–26.[27] Kulturel-Konak S, Smith AE, Norman BA. Multi-objective tabu search using a multinomial probability mass function. Eur J Oper Res 2006;169:918–31.[28] Liang YC, Smith AE. An ant colony optimisation algorithm for the redundancy allocation problem (RAP). IEEE Trans Reliab 2004;53(3):417–23.[29] Zhao J, Liu Z, Dao M. Reliability optimisation using multiobjective ant colony system approaches. Reliab Eng Syst Safety 2007;92:109–20.[30] Kim H, Bae C, Park S. Simulated annealing algorithm for redundancy optimization with multiple component choices. In: advanced reliability modelling,
proceedings of the 2004 Asian internationals workshop. World Scientific; 2004. p. 237–44.

608 Y. Papadopoulos et al. / Engineering Failure Analysis 18 (2011) 590–608
[31] Goldberg DE. Genetic algorithms in search, optimization, and machine learning. USA: Addison-Wesley Professional; 1989.[32] Coit DW, Smith AE. Penalty guided genetic search for reliability design optimisation. Comput Ind Eng 1996;30(4):895–904.[33] Deb K, Pratap A, Agarwal S, Meyarivan T. A fast and elitist multiobjective genetic algorithm: NSGA-II. IEEE Trans Evol Comput 2002;6(2):182–97.[34] Konak A, Coit DW, Smith AE. Multi-objective optimisation using genetic algorithms: a tutorial. Reliab Eng Syst Safety 2006;91:992–1007.[35] Papadopoulos YI, McDermid JA. Hierarchically performed hazard origin and propagation studies. In: 18th International conference in computer safety,
reliability and security, Toulouse, France; 1999. p. 139–52.[36] ITI Gmbh. SimulationX 3; 2010. <http://www.simulationx.com>.[37] Rausand M, Oien K. The basic concepts of failure analysis. Reliab Eng Syst Safety 1996;53:73–83.[38] Parker D, Papadopoulos Y. Effective multicriteria redundancy allocation via model-based safety analysis. IFAC workshop on intelligent manufacturing
systems, 23–25 May, Alicante, Spain; 2007.[39] Grante C, Andersson J. Optimisation of design specifications for mechatronic systems. Res Eng Des 2003;14(4):224–35.[40] Sharvia S, Papadopoulos YI. Non-coherent modelling in compositional safety analysis. In: IFAC 17th world congress, Seoul, South Korea; 2008.[41] Coit DW, Smith AE. Reliability optimisation of series-parallel systems using a genetic algorithm. IEEE Trans Reliab 1996;45(2):254–60.[42] Deb K. Evolutionary algorithms for multi-criterion optimisation in engineering design. Evolutionary algorithms in engineering and computer science.
John Wiley & Sons; 1999. p. 135–61.[43] Grunske L. Identifying ‘‘good” architectural design alternatives with multi-objective optimisation strategies. In: 28th International conference on
software engineering (ICSE 2006), Shanghai, China; May 20–28, 2006.