Engineering Failure Analysis -...
22
Failures of masonry and concrete buildings during the March 8, 2010 Kovancılar and Palu (Elazıg ˘) Earthquakes in Turkey Zekai Celep a , Ayfer Erken b , Beyza Taskin a , Alper Ilki c,⇑ a Istanbul Technical University, Civil Engineering Faculty, Structural Engineering Department, 34469 Istanbul, Turkey b Istanbul Technical University, Civil Engineering Faculty, Geotechnical Engineering Department, 34469 Istanbul, Turkey c Istanbul Technical University, Civil Engineering Faculty, Structural and Earthquake Engineering Laboratory, 34469 Istanbul, Turkey article info Article history: Received 16 May 2010 Received in revised form 31 October 2010 Accepted 4 November 2010 Available online 3 December 2010 Keywords: Earthquake damage survey Kovancılar (Elazıg ˘) earthquake Masonry buildings Reinforced concrete buildings Strong ground motions abstract The March 8, 2010 earthquakes that hit Kovancılar and Palu districts of Elazıg ˘ province in Turkey and their impacts on masonry and concrete buildings are studied in this paper. According to United States Geological Survey (USGS), magnitudes of these earthquakes, which caused partial or total collapse in many buildings with life losses, were 6.1 and 5.5, respectively. This paper outlines the seismological aspects of the region, the character- istics of the strong ground motion, the geotechnical characteristics of the region and the structural damages based on site assessments. The structural damage level is observed to be directly proportional with the amount of the insufficient quality in the workmanship and usage of inadequate building materials. If a minimum amount of engineering attention had been paid during the construction stages, most of the existing buildings could have sustained the earthquakes without considerable damage. Ó 2010 Elsevier Ltd. All rights reserved. 1. Introduction On March 8, 2010, an earthquake of moderate intensity shook Kovancılar district and the surrounding villages of Elazıg ˘ province at 04:32 (02:32 GMT) local time. Being one of the most seismically active zones in Turkey, Elazıg ˘ settles on the East Anatolian Fault (EAF), almost at the north-eastern end, where EAF meets the well known North Anatolian Fault (NAF) at the Karlıova triple junction. Magnitude and source characteristics of the earthquake are defined by various institutions as given in Table 1. In the table, h hypo is the depth of hypocenter of the earthquake and M is the local magnitude (M L ) for the top two rows and the moment magnitude (M w ) for the other rows. The earthquake struck a region of about 10,000 population and caused 42 human casualties and injuries of 137 individ- uals. According to the Governorship of Elazıg ˘ [1], approximately 3000 residential and 181 office buildings were heavily dam- aged. Stockbreeding sector is seriously affected with a loss of more than 3000 farm animals due to the collapse of barns. Most of the damages were observed in Okçular, Yukarı Demirci, Kayalık and Göçmezler villages within the political boundaries of Kovancılar district. Although Kovancılar and Palu city centers were the two closest districts to the epicenter, most buildings withstood against the shock without experiencing damages. Followed by the main event, however, an aftershock of M L = 5.6 at 07:47GMT caused damages in Palu district (Table 2). Few days after the earthquakes, our reconnaissance team arrived at the region (Fig. 1) to carry out site investigation and damage assessment. Kovancılar and Palu districts and the villages Kayalık, Yukarı Demirci, Okçular, Göçmezler, Taban Özü, Çakırkas ß, Köklüce, Gökdere, Arındık and Beyhan, are taken into the scope of this survey. 1350-6307/$ - see front matter Ó 2010 Elsevier Ltd. All rights reserved. doi:10.1016/j.engfailanal.2010.11.001 ⇑ Corresponding author. Tel.: +90 212 285 3838; fax: +90 212 285 6587. E-mail addresses: [email protected] (Z. Celep), [email protected] (A. Erken), [email protected] (B. Taskin), [email protected] (A. Ilki). Engineering Failure Analysis 18 (2011) 868–889 Contents lists available at ScienceDirect Engineering Failure Analysis journal homepage: www.elsevier.com/locate/engfailanal
Transcript of Engineering Failure Analysis -...
Engineering Failure Analysis 18 (2011) 868–889
Contents lists available at ScienceDirect
Engineering Failure Analysis
journal homepage: www.elsevier .com/locate /engfai lanal
Failures of masonry and concrete buildings during the March 8, 2010Kovancılar and Palu (Elazıg) Earthquakes in Turkey
Zekai Celep a, Ayfer Erken b, Beyza Taskin a, Alper Ilki c,⇑a Istanbul Technical University, Civil Engineering Faculty, Structural Engineering Department, 34469 Istanbul, Turkeyb Istanbul Technical University, Civil Engineering Faculty, Geotechnical Engineering Department, 34469 Istanbul, Turkeyc Istanbul Technical University, Civil Engineering Faculty, Structural and Earthquake Engineering Laboratory, 34469 Istanbul, Turkey
a r t i c l e i n f o
Article history:Received 16 May 2010Received in revised form 31 October 2010Accepted 4 November 2010Available online 3 December 2010
Keywords:Earthquake damage surveyKovancılar (Elazıg) earthquakeMasonry buildingsReinforced concrete buildingsStrong ground motions
1350-6307/$ - see front matter � 2010 Elsevier Ltddoi:10.1016/j.engfailanal.2010.11.001
⇑ Corresponding author. Tel.: +90 212 285 3838;E-mail addresses: [email protected] (Z. Celep), erk
a b s t r a c t
The March 8, 2010 earthquakes that hit Kovancılar and Palu districts of Elazıg province inTurkey and their impacts on masonry and concrete buildings are studied in this paper.According to United States Geological Survey (USGS), magnitudes of these earthquakes,which caused partial or total collapse in many buildings with life losses, were 6.1 and5.5, respectively. This paper outlines the seismological aspects of the region, the character-istics of the strong ground motion, the geotechnical characteristics of the region and thestructural damages based on site assessments. The structural damage level is observedto be directly proportional with the amount of the insufficient quality in the workmanshipand usage of inadequate building materials. If a minimum amount of engineering attentionhad been paid during the construction stages, most of the existing buildings could havesustained the earthquakes without considerable damage.
� 2010 Elsevier Ltd. All rights reserved.
1. Introduction
On March 8, 2010, an earthquake of moderate intensity shook Kovancılar district and the surrounding villages of Elazıgprovince at 04:32 (02:32 GMT) local time. Being one of the most seismically active zones in Turkey, Elazıg settles on the EastAnatolian Fault (EAF), almost at the north-eastern end, where EAF meets the well known North Anatolian Fault (NAF) at theKarlıova triple junction. Magnitude and source characteristics of the earthquake are defined by various institutions as givenin Table 1. In the table, hhypo is the depth of hypocenter of the earthquake and M is the local magnitude (ML) for the top tworows and the moment magnitude (Mw) for the other rows.
The earthquake struck a region of about 10,000 population and caused 42 human casualties and injuries of 137 individ-uals. According to the Governorship of Elazıg [1], approximately 3000 residential and 181 office buildings were heavily dam-aged. Stockbreeding sector is seriously affected with a loss of more than 3000 farm animals due to the collapse of barns. Mostof the damages were observed in Okçular, Yukarı Demirci, Kayalık and Göçmezler villages within the political boundaries ofKovancılar district. Although Kovancılar and Palu city centers were the two closest districts to the epicenter, most buildingswithstood against the shock without experiencing damages. Followed by the main event, however, an aftershock of ML = 5.6at 07:47GMT caused damages in Palu district (Table 2).
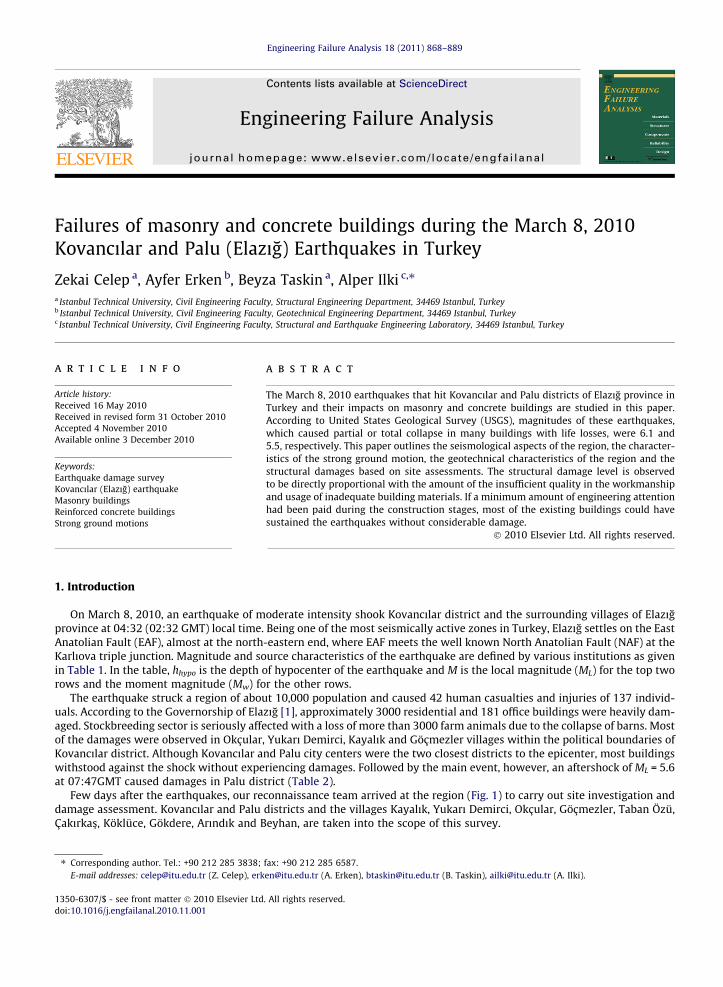
Few days after the earthquakes, our reconnaissance team arrived at the region (Fig. 1) to carry out site investigation anddamage assessment. Kovancılar and Palu districts and the villages Kayalık, Yukarı Demirci, Okçular, Göçmezler, Taban Özü,Çakırkas�, Köklüce, Gökdere, Arındık and Beyhan, are taken into the scope of this survey.
. All rights reserved.
fax: +90 212 285 [email protected] (A. Erken), [email protected] (B. Taskin), [email protected] (A. Ilki).
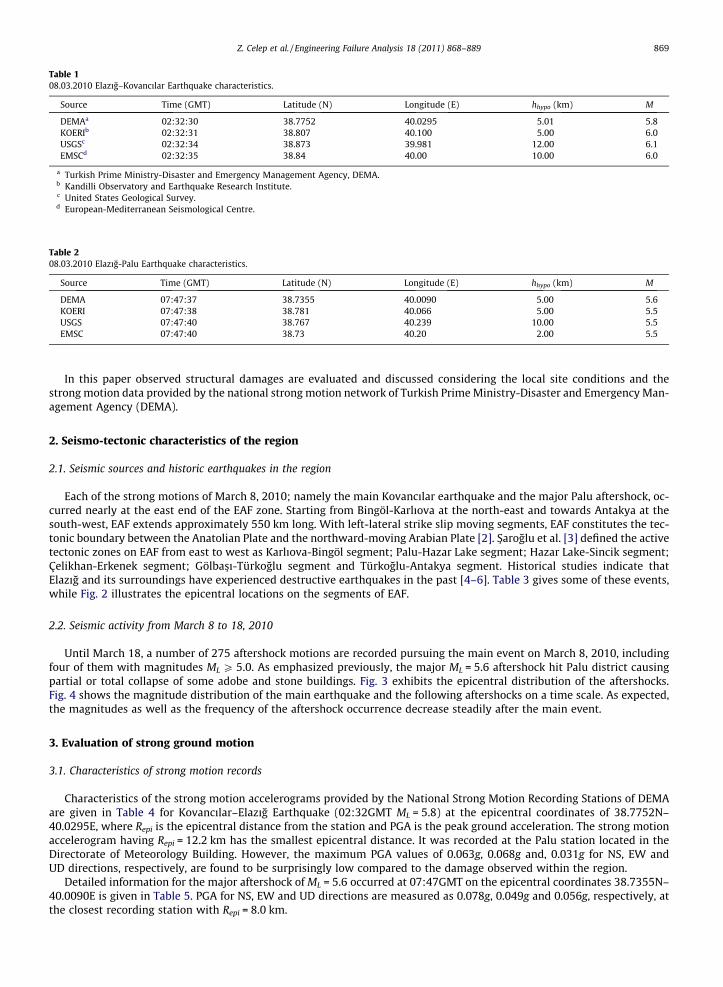
Table 108.03.2010 Elazıg–Kovancılar Earthquake characteristics.
Source Time (GMT) Latitude (N) Longitude (E) hhypo (km) M
DEMAa 02:32:30 38.7752 40.0295 5.01 5.8KOERIb 02:32:31 38.807 40.100 5.00 6.0USGSc 02:32:34 38.873 39.981 12.00 6.1EMSCd 02:32:35 38.84 40.00 10.00 6.0
a Turkish Prime Ministry-Disaster and Emergency Management Agency, DEMA.b Kandilli Observatory and Earthquake Research Institute.c United States Geological Survey.d European-Mediterranean Seismological Centre.
Table 208.03.2010 Elazıg-Palu Earthquake characteristics.
Source Time (GMT) Latitude (N) Longitude (E) hhypo (km) M
DEMA 07:47:37 38.7355 40.0090 5.00 5.6KOERI 07:47:38 38.781 40.066 5.00 5.5USGS 07:47:40 38.767 40.239 10.00 5.5EMSC 07:47:40 38.73 40.20 2.00 5.5
Z. Celep et al. / Engineering Failure Analysis 18 (2011) 868–889 869
In this paper observed structural damages are evaluated and discussed considering the local site conditions and thestrong motion data provided by the national strong motion network of Turkish Prime Ministry-Disaster and Emergency Man-agement Agency (DEMA).
2. Seismo-tectonic characteristics of the region
2.1. Seismic sources and historic earthquakes in the region
Each of the strong motions of March 8, 2010; namely the main Kovancılar earthquake and the major Palu aftershock, oc-curred nearly at the east end of the EAF zone. Starting from Bingöl-Karlıova at the north-east and towards Antakya at thesouth-west, EAF extends approximately 550 km long. With left-lateral strike slip moving segments, EAF constitutes the tec-tonic boundary between the Anatolian Plate and the northward-moving Arabian Plate [2]. S�aroglu et al. [3] defined the activetectonic zones on EAF from east to west as Karlıova-Bingöl segment; Palu-Hazar Lake segment; Hazar Lake-Sincik segment;Çelikhan-Erkenek segment; Gölbas�ı-Türkoglu segment and Türkoglu-Antakya segment. Historical studies indicate thatElazıg and its surroundings have experienced destructive earthquakes in the past [4–6]. Table 3 gives some of these events,while Fig. 2 illustrates the epicentral locations on the segments of EAF.
2.2. Seismic activity from March 8 to 18, 2010
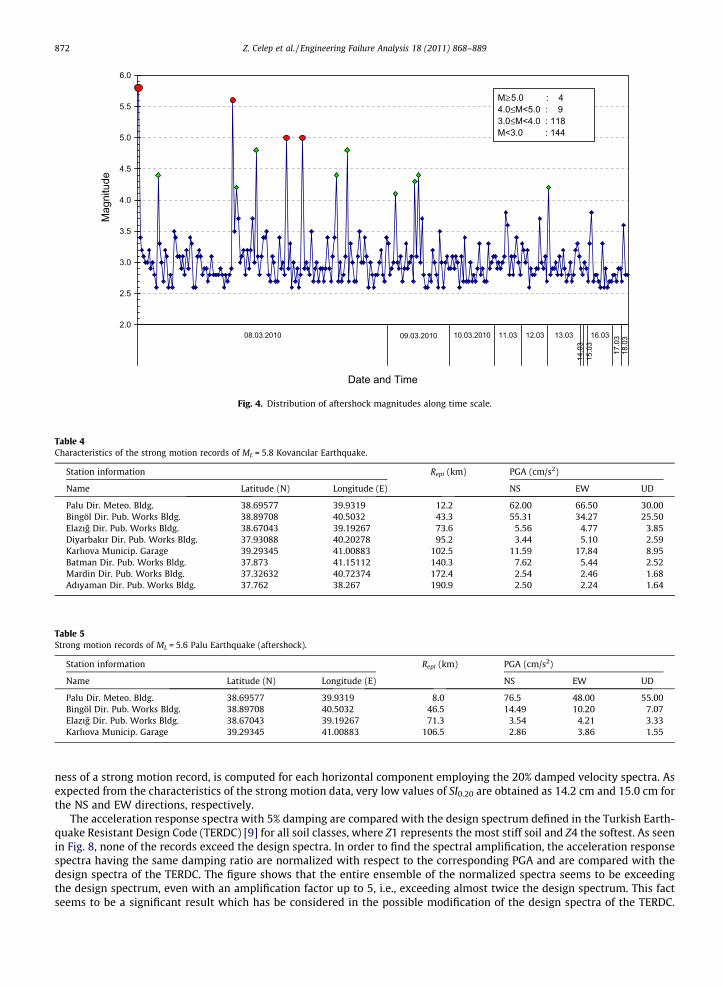
Until March 18, a number of 275 aftershock motions are recorded pursuing the main event on March 8, 2010, includingfour of them with magnitudes ML P 5.0. As emphasized previously, the major ML = 5.6 aftershock hit Palu district causingpartial or total collapse of some adobe and stone buildings. Fig. 3 exhibits the epicentral distribution of the aftershocks.Fig. 4 shows the magnitude distribution of the main earthquake and the following aftershocks on a time scale. As expected,the magnitudes as well as the frequency of the aftershock occurrence decrease steadily after the main event.
3. Evaluation of strong ground motion
3.1. Characteristics of strong motion records
Characteristics of the strong motion accelerograms provided by the National Strong Motion Recording Stations of DEMAare given in Table 4 for Kovancılar–Elazıg Earthquake (02:32GMT ML = 5.8) at the epicentral coordinates of 38.7752N–40.0295E, where Repi is the epicentral distance from the station and PGA is the peak ground acceleration. The strong motionaccelerogram having Repi = 12.2 km has the smallest epicentral distance. It was recorded at the Palu station located in theDirectorate of Meteorology Building. However, the maximum PGA values of 0.063g, 0.068g and, 0.031g for NS, EW andUD directions, respectively, are found to be surprisingly low compared to the damage observed within the region.
Detailed information for the major aftershock of ML = 5.6 occurred at 07:47GMT on the epicentral coordinates 38.7355N–40.0090E is given in Table 5. PGA for NS, EW and UD directions are measured as 0.078g, 0.049g and 0.056g, respectively, atthe closest recording station with Repi = 8.0 km.
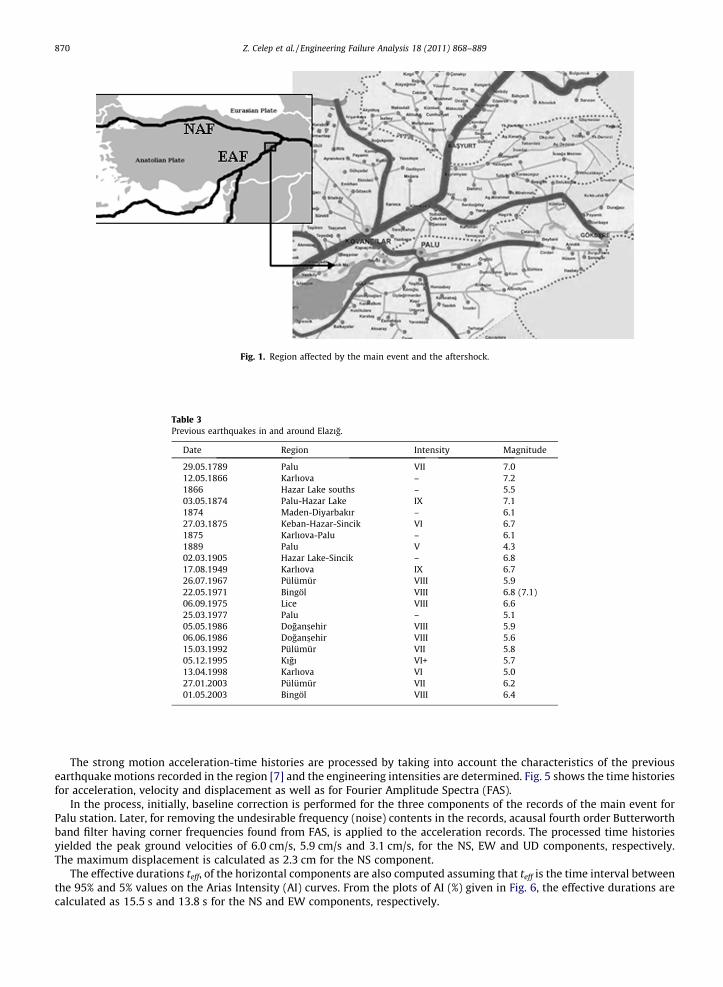
Fig. 1. Region affected by the main event and the aftershock.
Table 3Previous earthquakes in and around Elazıg.
Date Region Intensity Magnitude
29.05.1789 Palu VII 7.012.05.1866 Karlıova – 7.21866 Hazar Lake souths – 5.503.05.1874 Palu-Hazar Lake IX 7.11874 Maden-Diyarbakır – 6.127.03.1875 Keban-Hazar-Sincik VI 6.71875 Karlıova-Palu – 6.11889 Palu V 4.302.03.1905 Hazar Lake-Sincik – 6.817.08.1949 Karlıova IX 6.726.07.1967 Pülümür VIII 5.922.05.1971 Bingöl VIII 6.8 (7.1)06.09.1975 Lice VIII 6.625.03.1977 Palu – 5.105.05.1986 Dogans�ehir VIII 5.906.06.1986 Dogans�ehir VIII 5.615.03.1992 Pülümür VII 5.805.12.1995 Kıgı VI+ 5.713.04.1998 Karlıova VI 5.027.01.2003 Pülümür VII 6.201.05.2003 Bingöl VIII 6.4
870 Z. Celep et al. / Engineering Failure Analysis 18 (2011) 868–889
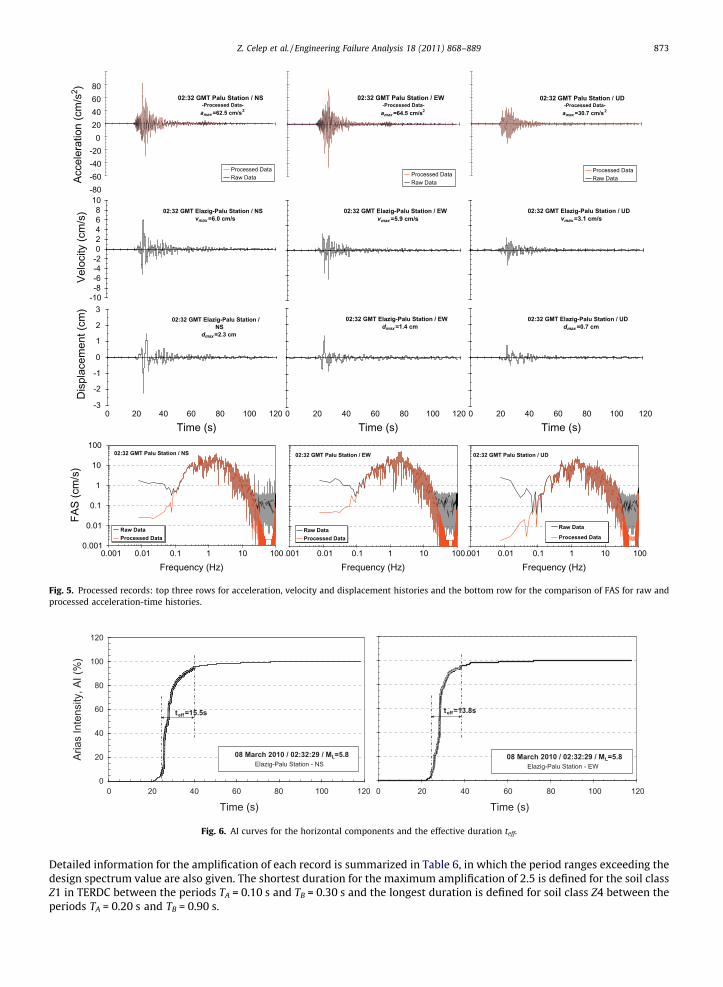
The strong motion acceleration-time histories are processed by taking into account the characteristics of the previousearthquake motions recorded in the region [7] and the engineering intensities are determined. Fig. 5 shows the time historiesfor acceleration, velocity and displacement as well as for Fourier Amplitude Spectra (FAS).
In the process, initially, baseline correction is performed for the three components of the records of the main event forPalu station. Later, for removing the undesirable frequency (noise) contents in the records, acausal fourth order Butterworthband filter having corner frequencies found from FAS, is applied to the acceleration records. The processed time historiesyielded the peak ground velocities of 6.0 cm/s, 5.9 cm/s and 3.1 cm/s, for the NS, EW and UD components, respectively.The maximum displacement is calculated as 2.3 cm for the NS component.
The effective durations teff, of the horizontal components are also computed assuming that teff is the time interval betweenthe 95% and 5% values on the Arias Intensity (AI) curves. From the plots of AI (%) given in Fig. 6, the effective durations arecalculated as 15.5 s and 13.8 s for the NS and EW components, respectively.
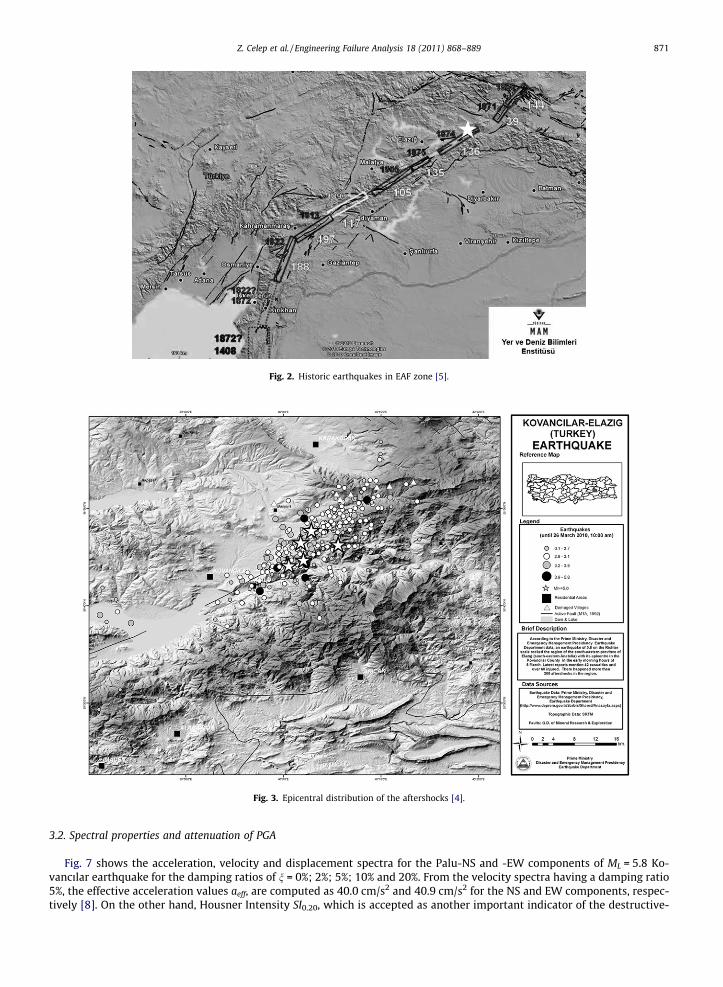
Fig. 2. Historic earthquakes in EAF zone [5].
Fig. 3. Epicentral distribution of the aftershocks [4].
Z. Celep et al. / Engineering Failure Analysis 18 (2011) 868–889 871
3.2. Spectral properties and attenuation of PGA
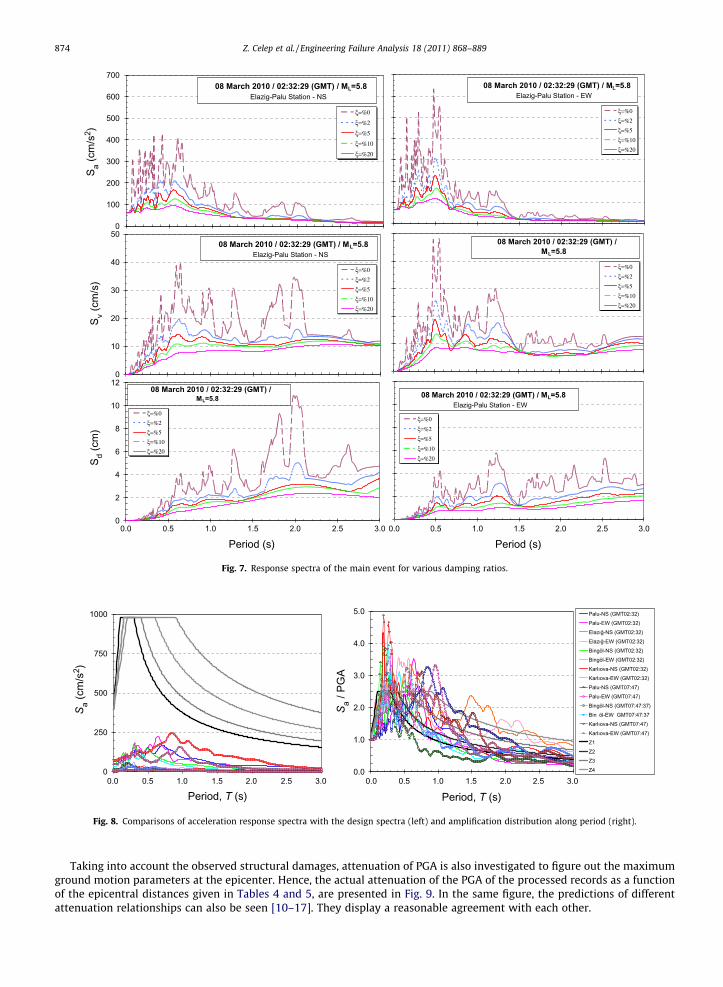
Fig. 7 shows the acceleration, velocity and displacement spectra for the Palu-NS and -EW components of ML = 5.8 Ko-vancılar earthquake for the damping ratios of n = 0%; 2%; 5%; 10% and 20%. From the velocity spectra having a damping ratio5%, the effective acceleration values aeff, are computed as 40.0 cm/s2 and 40.9 cm/s2 for the NS and EW components, respec-tively [8]. On the other hand, Housner Intensity SI0.20, which is accepted as another important indicator of the destructive-
2.0
2.5
3.0
3.5
4.0
4.5
5.0
5.5
6.0
Date and Time
Mag
nitu
de
08.03.2010 09.03.2010 10.03.2010 11.03 12.03 13.03 16.03
17.0
318
.03
14.0
315
.03
M≥5.0 : 4 4.0≤M<5.0 : 9 3.0≤M<4.0 : 118 M<3.0 : 144
Fig. 4. Distribution of aftershock magnitudes along time scale.
Table 4Characteristics of the strong motion records of ML = 5.8 Kovancılar Earthquake.
Station information Repi (km) PGA (cm/s2)
Name Latitude (N) Longitude (E) NS EW UD
Palu Dir. Meteo. Bldg. 38.69577 39.9319 12.2 62.00 66.50 30.00Bingöl Dir. Pub. Works Bldg. 38.89708 40.5032 43.3 55.31 34.27 25.50Elazıg Dir. Pub. Works Bldg. 38.67043 39.19267 73.6 5.56 4.77 3.85Diyarbakır Dir. Pub. Works Bldg. 37.93088 40.20278 95.2 3.44 5.10 2.59Karlıova Municip. Garage 39.29345 41.00883 102.5 11.59 17.84 8.95Batman Dir. Pub. Works Bldg. 37.873 41.15112 140.3 7.62 5.44 2.52Mardin Dir. Pub. Works Bldg. 37.32632 40.72374 172.4 2.54 2.46 1.68Adıyaman Dir. Pub. Works Bldg. 37.762 38.267 190.9 2.50 2.24 1.64
Table 5Strong motion records of ML = 5.6 Palu Earthquake (aftershock).
Station information Repi (km) PGA (cm/s2)
Name Latitude (N) Longitude (E) NS EW UD
Palu Dir. Meteo. Bldg. 38.69577 39.9319 8.0 76.5 48.00 55.00Bingöl Dir. Pub. Works Bldg. 38.89708 40.5032 46.5 14.49 10.20 7.07Elazıg Dir. Pub. Works Bldg. 38.67043 39.19267 71.3 3.54 4.21 3.33Karlıova Municip. Garage 39.29345 41.00883 106.5 2.86 3.86 1.55
872 Z. Celep et al. / Engineering Failure Analysis 18 (2011) 868–889
ness of a strong motion record, is computed for each horizontal component employing the 20% damped velocity spectra. Asexpected from the characteristics of the strong motion data, very low values of SI0.20 are obtained as 14.2 cm and 15.0 cm forthe NS and EW directions, respectively.
The acceleration response spectra with 5% damping are compared with the design spectrum defined in the Turkish Earth-quake Resistant Design Code (TERDC) [9] for all soil classes, where Z1 represents the most stiff soil and Z4 the softest. As seenin Fig. 8, none of the records exceed the design spectra. In order to find the spectral amplification, the acceleration responsespectra having the same damping ratio are normalized with respect to the corresponding PGA and are compared with thedesign spectra of the TERDC. The figure shows that the entire ensemble of the normalized spectra seems to be exceedingthe design spectrum, even with an amplification factor up to 5, i.e., exceeding almost twice the design spectrum. This factseems to be a significant result which has be considered in the possible modification of the design spectra of the TERDC.
-80-60-40-20
020406080
Acce
lera
tion
(cm
/s2 )
Processed DataRaw Data
02:32 GMT Palu Station / NS-Processed Data-a =62.5 cm/s
Processed DataRaw Data
02:32 GMT Palu Station / EW-Processed Data-a =64.5 cm/s
Processed DataRaw Data
02:32 GMT Palu Station / UD-Processed Data-a =30.7 cm/s
-10-8-6-4-202468
10
Velo
city
(cm
/s) 02:32 GMT Elazig-Palu Station / NS
v =6.0 cm/s02:32 GMT Elazig-Palu Station / EW
v =5.9 cm/s02:32 GMT Elazig-Palu Station / UD
v =3.1 cm/s
Time (s)
Dis
plac
emen
t (cm
)
02:32 GMT Elazig-Palu Station / NS
d =2.3 cm
Time (s)
02:32 GMT Elazig-Palu Station / EWd =1.4 cm
0 20 40 60 80 100 120 0 20 40 60 80 100 120
Time (s)
02:32 GMT Elazig-Palu Station / UDd =0.7 cm
0.001
0.01
0.1
1
10
100
0.001 0.01 0.1 1 10 100
Frequency (Hz)
FAS
(cm
/s)
Raw DataProcessed Data
02:32 GMT Palu Station / NS
.001 0.01 0.1 1 10 100
Frequency (Hz)
Raw DataProcessed Data
02:32 GMT Palu Station / EW
.001 0.01 0.1 1 10 100
Frequency (Hz)
Raw Data
Processed Data
02:32 GMT Palu Station / UD
3
2
1
0
-1
-2
-30 20 40 60 80 100 120
Fig. 5. Processed records: top three rows for acceleration, velocity and displacement histories and the bottom row for the comparison of FAS for raw andprocessed acceleration-time histories.
0
20
40
60
80
100
120
Time (s)
Aria
s In
tens
ity, A
I (%
)
08 March 2010 / 02:32:29 / ML=5.8Elazig-Palu Station - NS
teff=15.5s
0 20 40 60 80 100 120 0 20 40 60 80 100 120
Time (s)
teff=13.8s
08 March 2010 / 02:32:29 / ML=5.8Elazig-Palu Station - EW
Fig. 6. AI curves for the horizontal components and the effective duration teff.
Z. Celep et al. / Engineering Failure Analysis 18 (2011) 868–889 873
Detailed information for the amplification of each record is summarized in Table 6, in which the period ranges exceeding thedesign spectrum value are also given. The shortest duration for the maximum amplification of 2.5 is defined for the soil classZ1 in TERDC between the periods TA = 0.10 s and TB = 0.30 s and the longest duration is defined for soil class Z4 between theperiods TA = 0.20 s and TB = 0.90 s.
0
100
200
300
400
500
600
700
S a (c
m/s
2 )
ξ=%0
ξ=%2
ξ=%5
ξ=%10
ξ=%20
08 March 2010 / 02:32:29 (GMT) / ML=5.8Elazig-Palu Station - NS
ξ=%0ξ=%2ξ=%5ξ=%10ξ=%20
08 March 2010 / 02:32:29 (GMT) / ML=5.8Elazig-Palu Station - EW
0
10
20
30
40
50
S v (cm
/s)
ξ=%0ξ=%2ξ=%5ξ=%10ξ=%20
08 March 2010 / 02:32:29 (GMT) / ML=5.8Elazig-Palu Station - NS
ξ=%0ξ=%2ξ=%5ξ=%10ξ=%20
08 March 2010 / 02:32:29 (GMT) / ML=5.8
0
2
4
6
8
10
12
0.0 0.5 1.0 1.5 2.0 2.5 3.0
Period (s)
S d (c
m)
ξ=%0ξ=%2ξ=%5ξ=%10ξ=%20
08 March 2010 / 02:32:29 (GMT) / ML=5.8
0.0 0.5 1.0 1.5 2.0 2.5 3.0
Period (s)
ξ=%0
ξ=%2
ξ=%5
ξ=%10
ξ=%20
08 March 2010 / 02:32:29 (GMT) / ML=5.8Elazig-Palu Station - EW
Fig. 7. Response spectra of the main event for various damping ratios.
0
250
500
750
1000
Period, T (s)
S a (c
m/s
2 )
0.0
1.0
2.0
3.0
4.0
5.0
0.0 0.5 1.0 1.5 2.0 2.5 3.0 0.0 0.5 1.0 1.5 2.0 2.5 3.0
Period, T (s)
S a /
PGA
Palu-NS (GMT02:32)Palu-EW (GMT02:32)
Elazığ-NS (GMT02:32)Elazığ-EW (GMT02:32)Bingöl-NS (GMT02:32)Bingöl-EW (GMT02:32)
Karlıova-NS (GMT02:32)Karlıova-EW (GMT02:32)Palu-NS (GMT07:47)Palu-EW (GMT07:47)
Bingöl-NS (GMT07:47:37)Bin öl-EW GMT07:47:37Karlıova-NS (GMT07:47)
Karlıova-EW (GMT07:47)Z1Z2Z3
Z4
Fig. 8. Comparisons of acceleration response spectra with the design spectra (left) and amplification distribution along period (right).
874 Z. Celep et al. / Engineering Failure Analysis 18 (2011) 868–889
Taking into account the observed structural damages, attenuation of PGA is also investigated to figure out the maximumground motion parameters at the epicenter. Hence, the actual attenuation of the PGA of the processed records as a functionof the epicentral distances given in Tables 4 and 5, are presented in Fig. 9. In the same figure, the predictions of differentattenuation relationships can also be seen [10–17]. They display a reasonable agreement with each other.
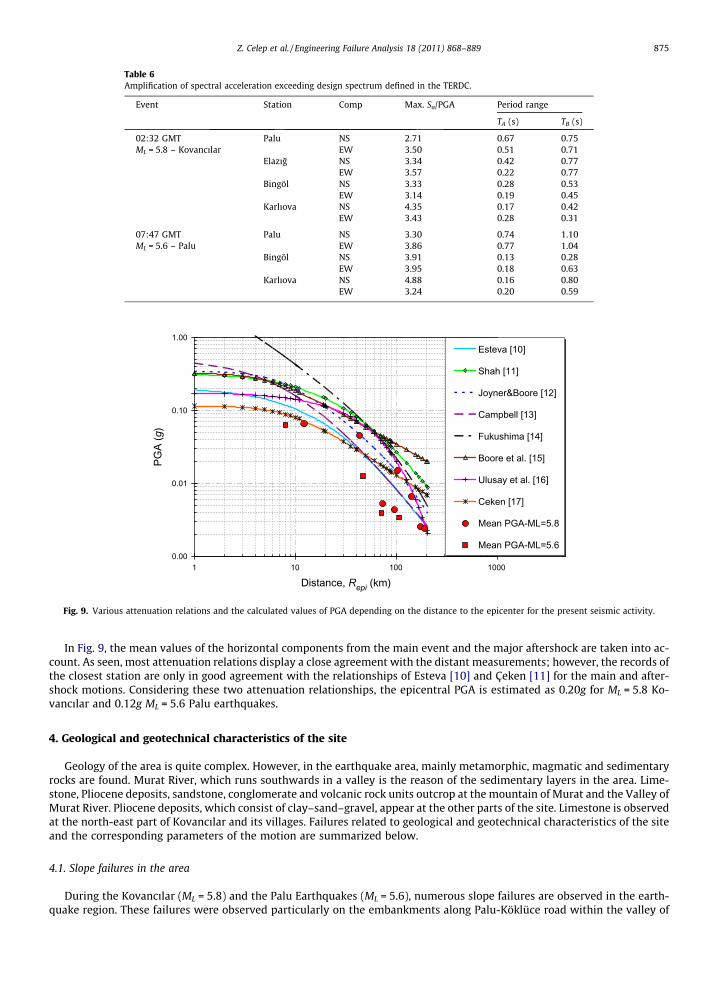
Table 6Amplification of spectral acceleration exceeding design spectrum defined in the TERDC.
Event Station Comp Max. Sa/PGA Period range
TA (s) TB (s)
02:32 GMT Palu NS 2.71 0.67 0.75ML = 5.8 – Kovancılar EW 3.50 0.51 0.71
Elazıg NS 3.34 0.42 0.77EW 3.57 0.22 0.77
Bingöl NS 3.33 0.28 0.53EW 3.14 0.19 0.45
Karlıova NS 4.35 0.17 0.42EW 3.43 0.28 0.31
07:47 GMT Palu NS 3.30 0.74 1.10ML = 5.6 – Palu EW 3.86 0.77 1.04
Bingöl NS 3.91 0.13 0.28EW 3.95 0.18 0.63
Karlıova NS 4.88 0.16 0.80EW 3.24 0.20 0.59
0.00
0.01
0.10
1.00
1 10 100 1000
Distance, Repi (km)
PGA
(g)
Esteva [10]
Shah [11]
Joyner&Boore [12]
Campbell [13]
Fukushima [14]
Boore et al. [15]
Ulusay et al. [16]
Ceken [17]
Mean PGA-ML=5.8
Mean PGA-ML=5.6
Fig. 9. Various attenuation relations and the calculated values of PGA depending on the distance to the epicenter for the present seismic activity.
Z. Celep et al. / Engineering Failure Analysis 18 (2011) 868–889 875
In Fig. 9, the mean values of the horizontal components from the main event and the major aftershock are taken into ac-count. As seen, most attenuation relations display a close agreement with the distant measurements; however, the records ofthe closest station are only in good agreement with the relationships of Esteva [10] and Çeken [11] for the main and after-shock motions. Considering these two attenuation relationships, the epicentral PGA is estimated as 0.20g for ML = 5.8 Ko-vancılar and 0.12g ML = 5.6 Palu earthquakes.
4. Geological and geotechnical characteristics of the site
Geology of the area is quite complex. However, in the earthquake area, mainly metamorphic, magmatic and sedimentaryrocks are found. Murat River, which runs southwards in a valley is the reason of the sedimentary layers in the area. Lime-stone, Pliocene deposits, sandstone, conglomerate and volcanic rock units outcrop at the mountain of Murat and the Valley ofMurat River. Pliocene deposits, which consist of clay–sand–gravel, appear at the other parts of the site. Limestone is observedat the north-east part of Kovancılar and its villages. Failures related to geological and geotechnical characteristics of the siteand the corresponding parameters of the motion are summarized below.
4.1. Slope failures in the area
During the Kovancılar (ML = 5.8) and the Palu Earthquakes (ML = 5.6), numerous slope failures are observed in the earth-quake region. These failures were observed particularly on the embankments along Palu-Köklüce road within the valley of
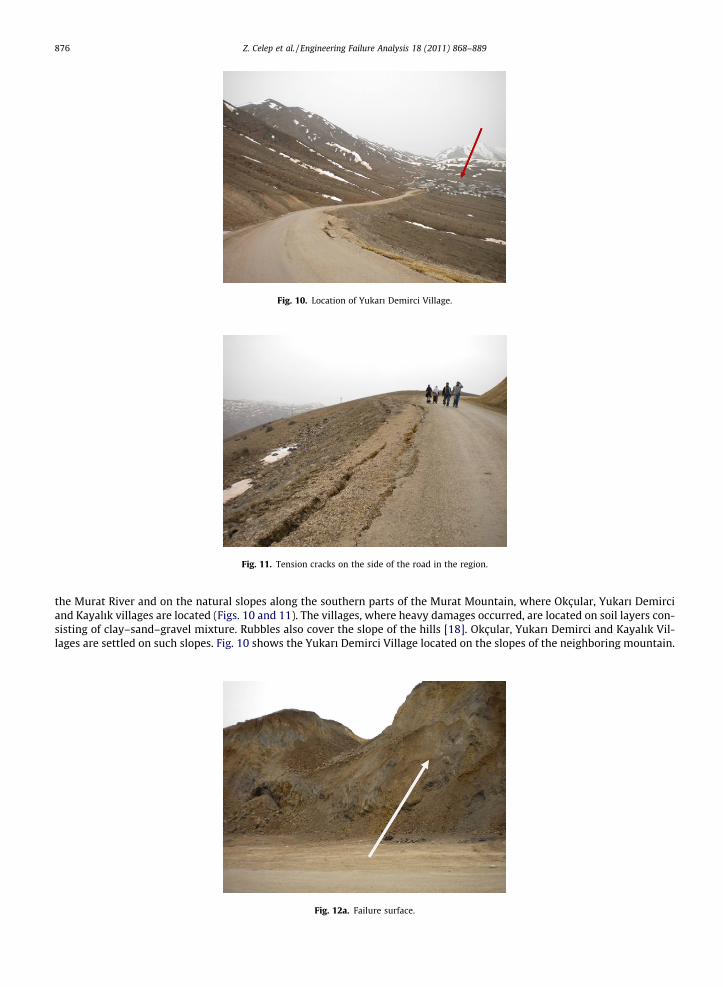
Fig. 10. Location of Yukarı Demirci Village.
Fig. 11. Tension cracks on the side of the road in the region.
876 Z. Celep et al. / Engineering Failure Analysis 18 (2011) 868–889
the Murat River and on the natural slopes along the southern parts of the Murat Mountain, where Okçular, Yukarı Demirciand Kayalık villages are located (Figs. 10 and 11). The villages, where heavy damages occurred, are located on soil layers con-sisting of clay–sand–gravel mixture. Rubbles also cover the slope of the hills [18]. Okçular, Yukarı Demirci and Kayalık Vil-lages are settled on such slopes. Fig. 10 shows the Yukarı Demirci Village located on the slopes of the neighboring mountain.
Fig. 12a. Failure surface.
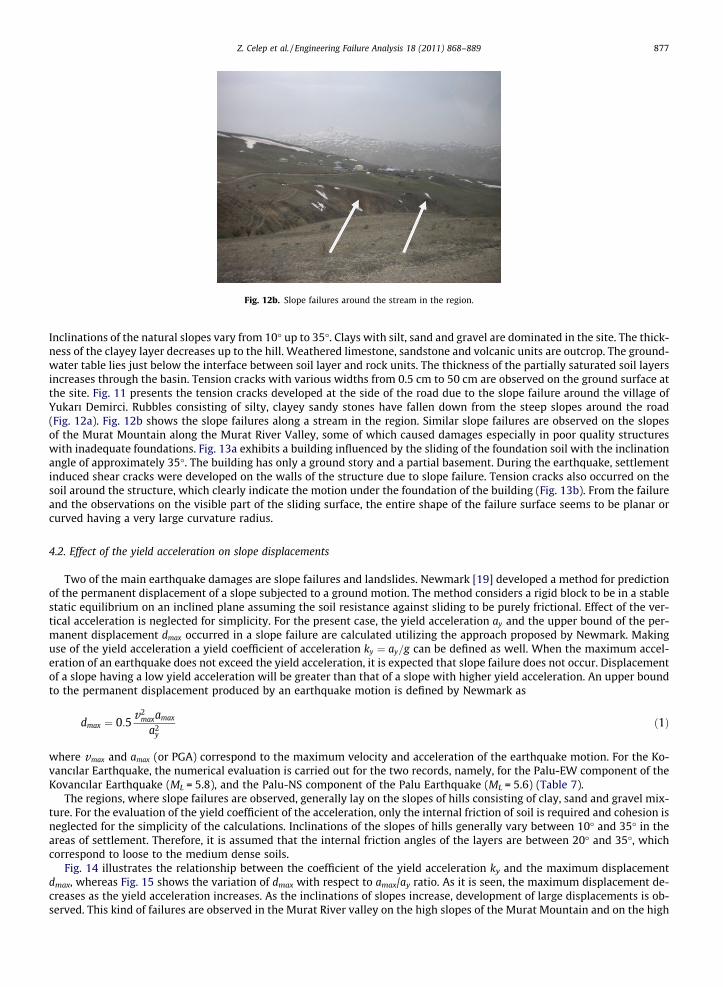
Fig. 12b. Slope failures around the stream in the region.
Z. Celep et al. / Engineering Failure Analysis 18 (2011) 868–889 877
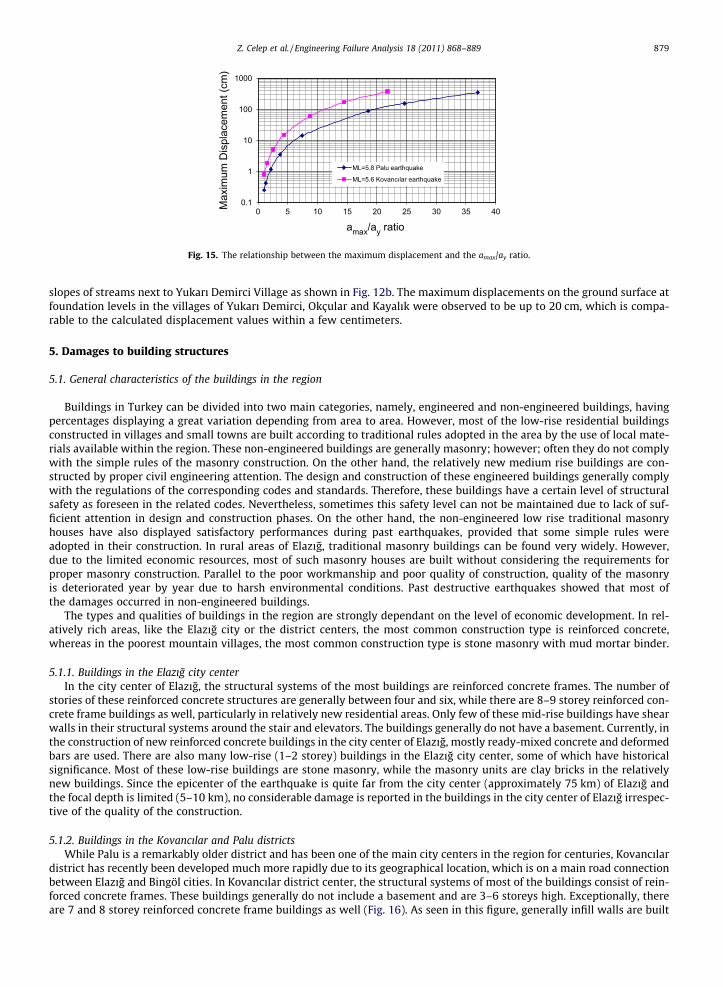
Inclinations of the natural slopes vary from 10� up to 35�. Clays with silt, sand and gravel are dominated in the site. The thick-ness of the clayey layer decreases up to the hill. Weathered limestone, sandstone and volcanic units are outcrop. The ground-water table lies just below the interface between soil layer and rock units. The thickness of the partially saturated soil layersincreases through the basin. Tension cracks with various widths from 0.5 cm to 50 cm are observed on the ground surface atthe site. Fig. 11 presents the tension cracks developed at the side of the road due to the slope failure around the village ofYukarı Demirci. Rubbles consisting of silty, clayey sandy stones have fallen down from the steep slopes around the road(Fig. 12a). Fig. 12b shows the slope failures along a stream in the region. Similar slope failures are observed on the slopesof the Murat Mountain along the Murat River Valley, some of which caused damages especially in poor quality structureswith inadequate foundations. Fig. 13a exhibits a building influenced by the sliding of the foundation soil with the inclinationangle of approximately 35�. The building has only a ground story and a partial basement. During the earthquake, settlementinduced shear cracks were developed on the walls of the structure due to slope failure. Tension cracks also occurred on thesoil around the structure, which clearly indicate the motion under the foundation of the building (Fig. 13b). From the failureand the observations on the visible part of the sliding surface, the entire shape of the failure surface seems to be planar orcurved having a very large curvature radius.
4.2. Effect of the yield acceleration on slope displacements
Two of the main earthquake damages are slope failures and landslides. Newmark [19] developed a method for predictionof the permanent displacement of a slope subjected to a ground motion. The method considers a rigid block to be in a stablestatic equilibrium on an inclined plane assuming the soil resistance against sliding to be purely frictional. Effect of the ver-tical acceleration is neglected for simplicity. For the present case, the yield acceleration ay and the upper bound of the per-manent displacement dmax occurred in a slope failure are calculated utilizing the approach proposed by Newmark. Makinguse of the yield acceleration a yield coefficient of acceleration ky ¼ ay=g can be defined as well. When the maximum accel-eration of an earthquake does not exceed the yield acceleration, it is expected that slope failure does not occur. Displacementof a slope having a low yield acceleration will be greater than that of a slope with higher yield acceleration. An upper boundto the permanent displacement produced by an earthquake motion is defined by Newmark as
dmax ¼ 0:5v2
maxamax
a2y
ð1Þ
where vmax and amax (or PGA) correspond to the maximum velocity and acceleration of the earthquake motion. For the Ko-vancılar Earthquake, the numerical evaluation is carried out for the two records, namely, for the Palu-EW component of theKovancılar Earthquake (ML = 5.8), and the Palu-NS component of the Palu Earthquake (ML = 5.6) (Table 7).
The regions, where slope failures are observed, generally lay on the slopes of hills consisting of clay, sand and gravel mix-ture. For the evaluation of the yield coefficient of the acceleration, only the internal friction of soil is required and cohesion isneglected for the simplicity of the calculations. Inclinations of the slopes of hills generally vary between 10� and 35� in theareas of settlement. Therefore, it is assumed that the internal friction angles of the layers are between 20� and 35�, whichcorrespond to loose to the medium dense soils.
Fig. 14 illustrates the relationship between the coefficient of the yield acceleration ky and the maximum displacementdmax, whereas Fig. 15 shows the variation of dmax with respect to amax/ay ratio. As it is seen, the maximum displacement de-creases as the yield acceleration increases. As the inclinations of slopes increase, development of large displacements is ob-served. This kind of failures are observed in the Murat River valley on the high slopes of the Murat Mountain and on the high
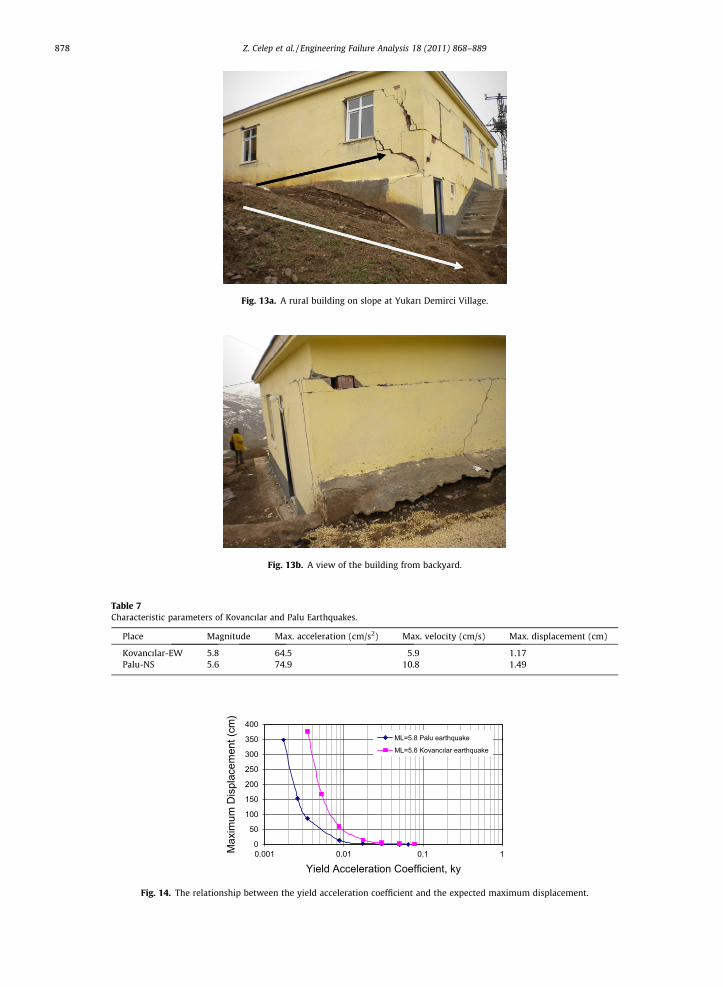
Fig. 13a. A rural building on slope at Yukarı Demirci Village.
Fig. 13b. A view of the building from backyard.
Table 7Characteristic parameters of Kovancılar and Palu Earthquakes.
Place Magnitude Max. acceleration (cm/s2) Max. velocity (cm/s) Max. displacement (cm)
Kovancılar-EW 5.8 64.5 5.9 1.17Palu-NS 5.6 74.9 10.8 1.49
0
50
100
150
200
250
300
350
400
0.001 0.01 0.1 1
Yield Acceleration Coefficient, ky
Max
imum
Dis
plac
emen
t (cm
)
ML=5.8 Palu earthquake
ML=5.6 Kovancılar earthquake
Fig. 14. The relationship between the yield acceleration coefficient and the expected maximum displacement.
878 Z. Celep et al. / Engineering Failure Analysis 18 (2011) 868–889
0.1
1
10
100
1000
0 5 10 15 20 25 30 35 40
amax/ay ratio M
axim
um D
ispl
acem
ent (
cm)
ML=5.8 Palu earthquake
ML=5.6 Kovancılar earthquake
Fig. 15. The relationship between the maximum displacement and the amax/ay ratio.
Z. Celep et al. / Engineering Failure Analysis 18 (2011) 868–889 879
slopes of streams next to Yukarı Demirci Village as shown in Fig. 12b. The maximum displacements on the ground surface atfoundation levels in the villages of Yukarı Demirci, Okçular and Kayalık were observed to be up to 20 cm, which is compa-rable to the calculated displacement values within a few centimeters.
5. Damages to building structures
5.1. General characteristics of the buildings in the region
Buildings in Turkey can be divided into two main categories, namely, engineered and non-engineered buildings, havingpercentages displaying a great variation depending from area to area. However, most of the low-rise residential buildingsconstructed in villages and small towns are built according to traditional rules adopted in the area by the use of local mate-rials available within the region. These non-engineered buildings are generally masonry; however; often they do not complywith the simple rules of the masonry construction. On the other hand, the relatively new medium rise buildings are con-structed by proper civil engineering attention. The design and construction of these engineered buildings generally complywith the regulations of the corresponding codes and standards. Therefore, these buildings have a certain level of structuralsafety as foreseen in the related codes. Nevertheless, sometimes this safety level can not be maintained due to lack of suf-ficient attention in design and construction phases. On the other hand, the non-engineered low rise traditional masonryhouses have also displayed satisfactory performances during past earthquakes, provided that some simple rules wereadopted in their construction. In rural areas of Elazıg, traditional masonry buildings can be found very widely. However,due to the limited economic resources, most of such masonry houses are built without considering the requirements forproper masonry construction. Parallel to the poor workmanship and poor quality of construction, quality of the masonryis deteriorated year by year due to harsh environmental conditions. Past destructive earthquakes showed that most ofthe damages occurred in non-engineered buildings.
The types and qualities of buildings in the region are strongly dependant on the level of economic development. In rel-atively rich areas, like the Elazıg city or the district centers, the most common construction type is reinforced concrete,whereas in the poorest mountain villages, the most common construction type is stone masonry with mud mortar binder.
5.1.1. Buildings in the Elazıg city centerIn the city center of Elazıg, the structural systems of the most buildings are reinforced concrete frames. The number of
stories of these reinforced concrete structures are generally between four and six, while there are 8–9 storey reinforced con-crete frame buildings as well, particularly in relatively new residential areas. Only few of these mid-rise buildings have shearwalls in their structural systems around the stair and elevators. The buildings generally do not have a basement. Currently, inthe construction of new reinforced concrete buildings in the city center of Elazıg, mostly ready-mixed concrete and deformedbars are used. There are also many low-rise (1–2 storey) buildings in the Elazıg city center, some of which have historicalsignificance. Most of these low-rise buildings are stone masonry, while the masonry units are clay bricks in the relativelynew buildings. Since the epicenter of the earthquake is quite far from the city center (approximately 75 km) of Elazıg andthe focal depth is limited (5–10 km), no considerable damage is reported in the buildings in the city center of Elazıg irrespec-tive of the quality of the construction.
5.1.2. Buildings in the Kovancılar and Palu districtsWhile Palu is a remarkably older district and has been one of the main city centers in the region for centuries, Kovancılar
district has recently been developed much more rapidly due to its geographical location, which is on a main road connectionbetween Elazıg and Bingöl cities. In Kovancılar district center, the structural systems of most of the buildings consist of rein-forced concrete frames. These buildings generally do not include a basement and are 3–6 storeys high. Exceptionally, thereare 7 and 8 storey reinforced concrete frame buildings as well (Fig. 16). As seen in this figure, generally infill walls are built
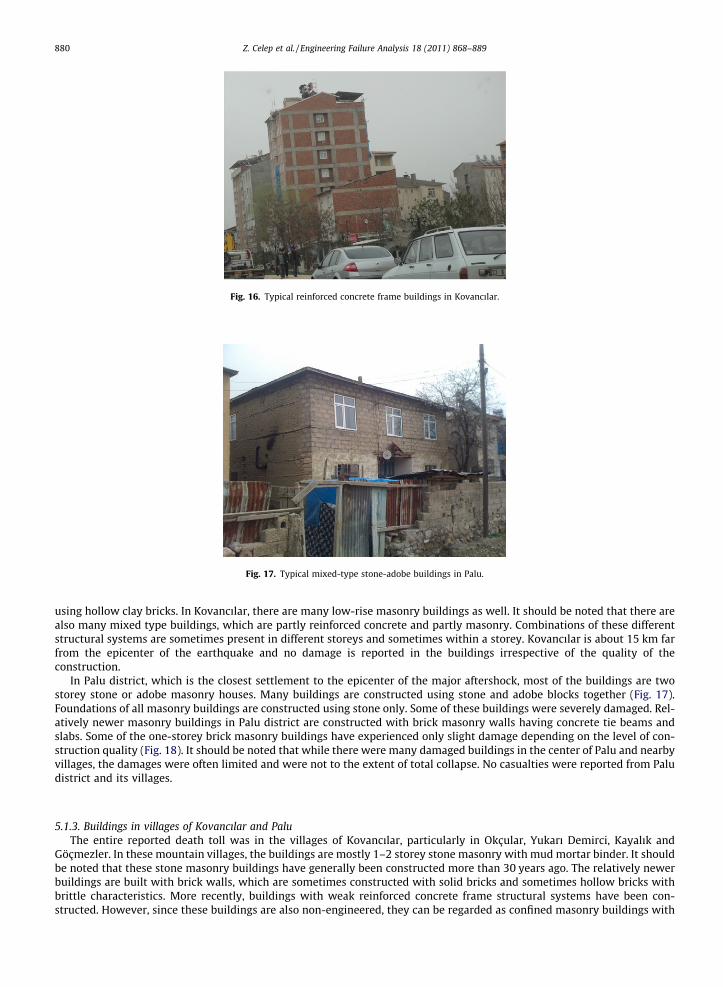
Fig. 16. Typical reinforced concrete frame buildings in Kovancılar.
Fig. 17. Typical mixed-type stone-adobe buildings in Palu.
880 Z. Celep et al. / Engineering Failure Analysis 18 (2011) 868–889
using hollow clay bricks. In Kovancılar, there are many low-rise masonry buildings as well. It should be noted that there arealso many mixed type buildings, which are partly reinforced concrete and partly masonry. Combinations of these differentstructural systems are sometimes present in different storeys and sometimes within a storey. Kovancılar is about 15 km farfrom the epicenter of the earthquake and no damage is reported in the buildings irrespective of the quality of theconstruction.
In Palu district, which is the closest settlement to the epicenter of the major aftershock, most of the buildings are twostorey stone or adobe masonry houses. Many buildings are constructed using stone and adobe blocks together (Fig. 17).Foundations of all masonry buildings are constructed using stone only. Some of these buildings were severely damaged. Rel-atively newer masonry buildings in Palu district are constructed with brick masonry walls having concrete tie beams andslabs. Some of the one-storey brick masonry buildings have experienced only slight damage depending on the level of con-struction quality (Fig. 18). It should be noted that while there were many damaged buildings in the center of Palu and nearbyvillages, the damages were often limited and were not to the extent of total collapse. No casualties were reported from Paludistrict and its villages.
5.1.3. Buildings in villages of Kovancılar and PaluThe entire reported death toll was in the villages of Kovancılar, particularly in Okçular, Yukarı Demirci, Kayalık and
Göçmezler. In these mountain villages, the buildings are mostly 1–2 storey stone masonry with mud mortar binder. It shouldbe noted that these stone masonry buildings have generally been constructed more than 30 years ago. The relatively newerbuildings are built with brick walls, which are sometimes constructed with solid bricks and sometimes hollow bricks withbrittle characteristics. More recently, buildings with weak reinforced concrete frame structural systems have been con-structed. However, since these buildings are also non-engineered, they can be regarded as confined masonry buildings with
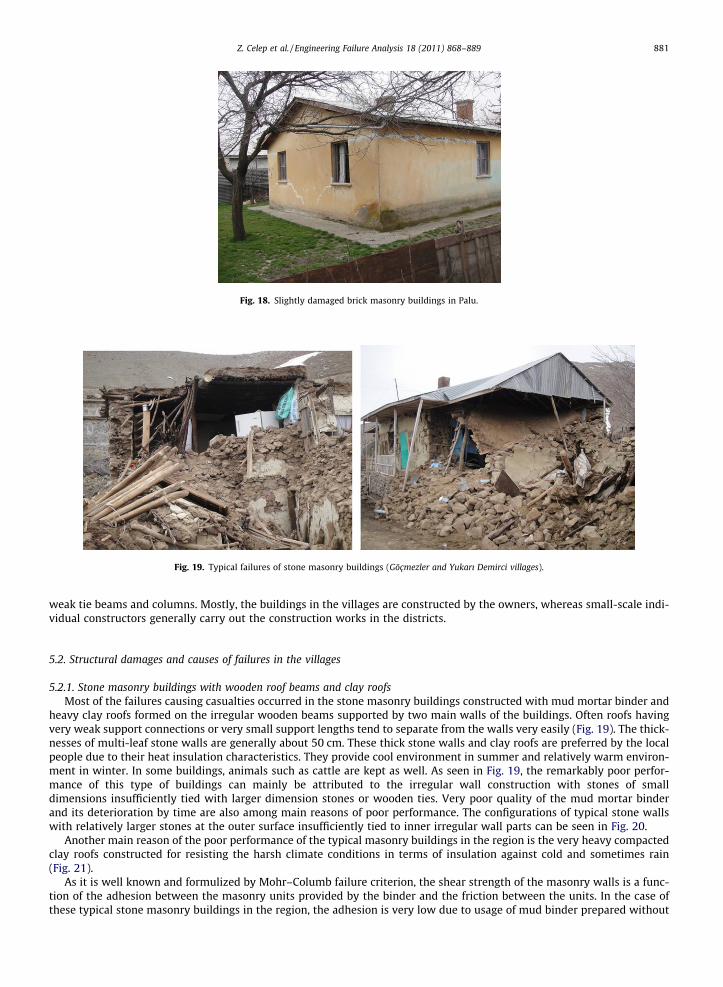
Fig. 18. Slightly damaged brick masonry buildings in Palu.
Fig. 19. Typical failures of stone masonry buildings (Göçmezler and Yukarı Demirci villages).
Z. Celep et al. / Engineering Failure Analysis 18 (2011) 868–889 881
weak tie beams and columns. Mostly, the buildings in the villages are constructed by the owners, whereas small-scale indi-vidual constructors generally carry out the construction works in the districts.
5.2. Structural damages and causes of failures in the villages
5.2.1. Stone masonry buildings with wooden roof beams and clay roofsMost of the failures causing casualties occurred in the stone masonry buildings constructed with mud mortar binder and
heavy clay roofs formed on the irregular wooden beams supported by two main walls of the buildings. Often roofs havingvery weak support connections or very small support lengths tend to separate from the walls very easily (Fig. 19). The thick-nesses of multi-leaf stone walls are generally about 50 cm. These thick stone walls and clay roofs are preferred by the localpeople due to their heat insulation characteristics. They provide cool environment in summer and relatively warm environ-ment in winter. In some buildings, animals such as cattle are kept as well. As seen in Fig. 19, the remarkably poor perfor-mance of this type of buildings can mainly be attributed to the irregular wall construction with stones of smalldimensions insufficiently tied with larger dimension stones or wooden ties. Very poor quality of the mud mortar binderand its deterioration by time are also among main reasons of poor performance. The configurations of typical stone wallswith relatively larger stones at the outer surface insufficiently tied to inner irregular wall parts can be seen in Fig. 20.
Another main reason of the poor performance of the typical masonry buildings in the region is the very heavy compactedclay roofs constructed for resisting the harsh climate conditions in terms of insulation against cold and sometimes rain(Fig. 21).
As it is well known and formulized by Mohr–Columb failure criterion, the shear strength of the masonry walls is a func-tion of the adhesion between the masonry units provided by the binder and the friction between the units. In the case ofthese typical stone masonry buildings in the region, the adhesion is very low due to usage of mud binder prepared without
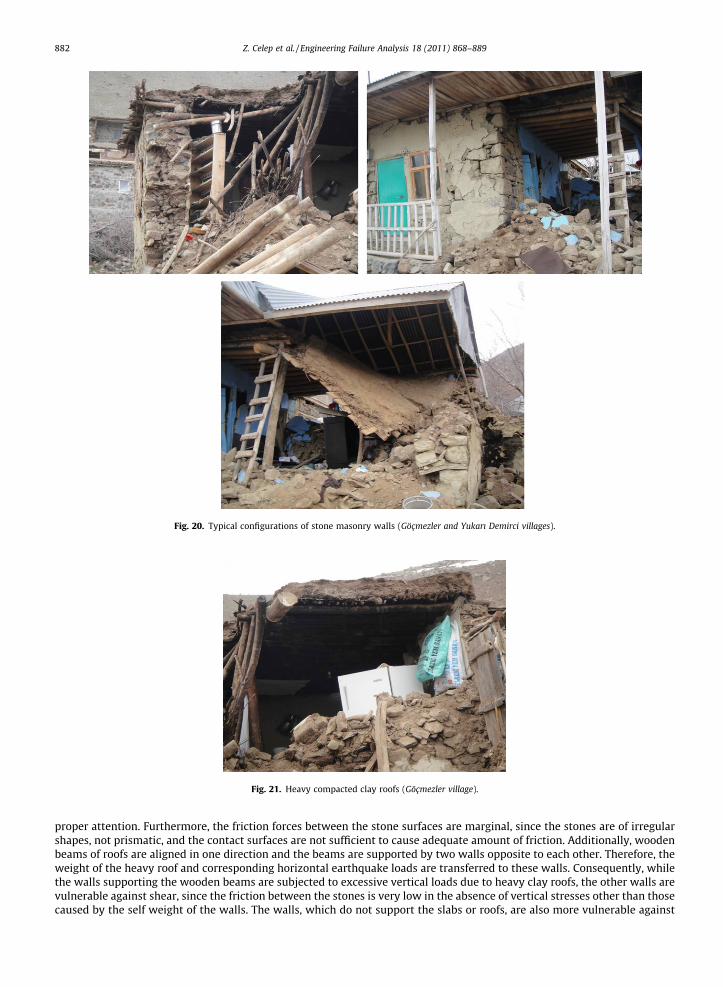
Fig. 20. Typical configurations of stone masonry walls (Göçmezler and Yukarı Demirci villages).
Fig. 21. Heavy compacted clay roofs (Göçmezler village).
882 Z. Celep et al. / Engineering Failure Analysis 18 (2011) 868–889
proper attention. Furthermore, the friction forces between the stone surfaces are marginal, since the stones are of irregularshapes, not prismatic, and the contact surfaces are not sufficient to cause adequate amount of friction. Additionally, woodenbeams of roofs are aligned in one direction and the beams are supported by two walls opposite to each other. Therefore, theweight of the heavy roof and corresponding horizontal earthquake loads are transferred to these walls. Consequently, whilethe walls supporting the wooden beams are subjected to excessive vertical loads due to heavy clay roofs, the other walls arevulnerable against shear, since the friction between the stones is very low in the absence of vertical stresses other than thosecaused by the self weight of the walls. The walls, which do not support the slabs or roofs, are also more vulnerable against
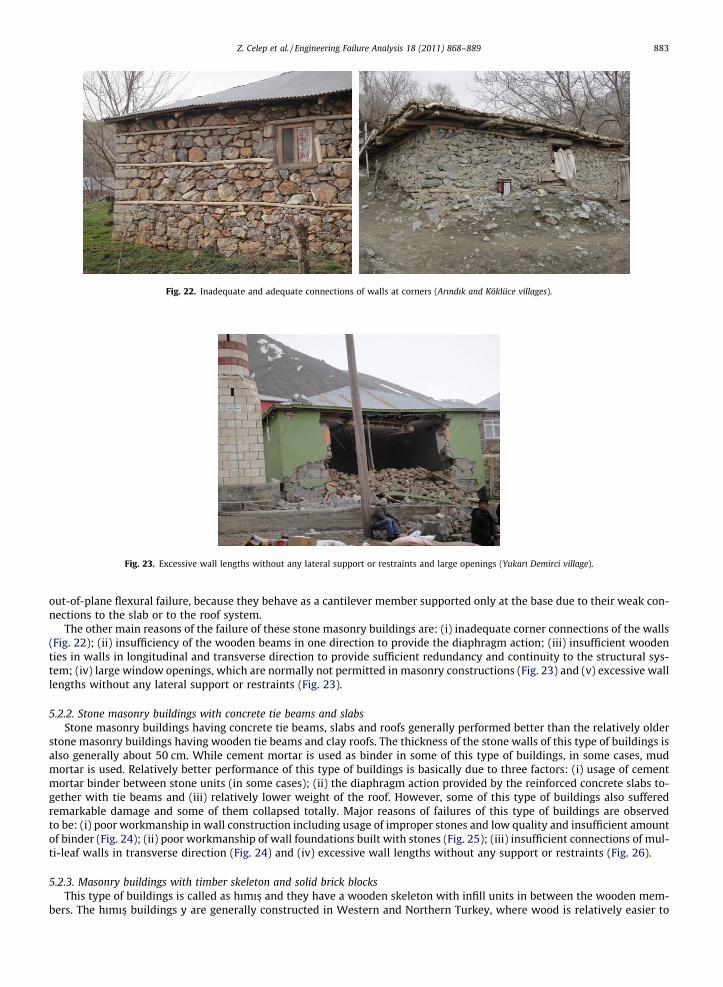
Fig. 22. Inadequate and adequate connections of walls at corners (Arındık and Köklüce villages).
Fig. 23. Excessive wall lengths without any lateral support or restraints and large openings (Yukarı Demirci village).
Z. Celep et al. / Engineering Failure Analysis 18 (2011) 868–889 883
out-of-plane flexural failure, because they behave as a cantilever member supported only at the base due to their weak con-nections to the slab or to the roof system.
The other main reasons of the failure of these stone masonry buildings are: (i) inadequate corner connections of the walls(Fig. 22); (ii) insufficiency of the wooden beams in one direction to provide the diaphragm action; (iii) insufficient woodenties in walls in longitudinal and transverse direction to provide sufficient redundancy and continuity to the structural sys-tem; (iv) large window openings, which are normally not permitted in masonry constructions (Fig. 23) and (v) excessive walllengths without any lateral support or restraints (Fig. 23).
5.2.2. Stone masonry buildings with concrete tie beams and slabsStone masonry buildings having concrete tie beams, slabs and roofs generally performed better than the relatively older
stone masonry buildings having wooden tie beams and clay roofs. The thickness of the stone walls of this type of buildings isalso generally about 50 cm. While cement mortar is used as binder in some of this type of buildings, in some cases, mudmortar is used. Relatively better performance of this type of buildings is basically due to three factors: (i) usage of cementmortar binder between stone units (in some cases); (ii) the diaphragm action provided by the reinforced concrete slabs to-gether with tie beams and (iii) relatively lower weight of the roof. However, some of this type of buildings also sufferedremarkable damage and some of them collapsed totally. Major reasons of failures of this type of buildings are observedto be: (i) poor workmanship in wall construction including usage of improper stones and low quality and insufficient amountof binder (Fig. 24); (ii) poor workmanship of wall foundations built with stones (Fig. 25); (iii) insufficient connections of mul-ti-leaf walls in transverse direction (Fig. 24) and (iv) excessive wall lengths without any support or restraints (Fig. 26).
5.2.3. Masonry buildings with timber skeleton and solid brick blocksThis type of buildings is called as hımıs� and they have a wooden skeleton with infill units in between the wooden mem-
bers. The hımıs� buildings y are generally constructed in Western and Northern Turkey, where wood is relatively easier to
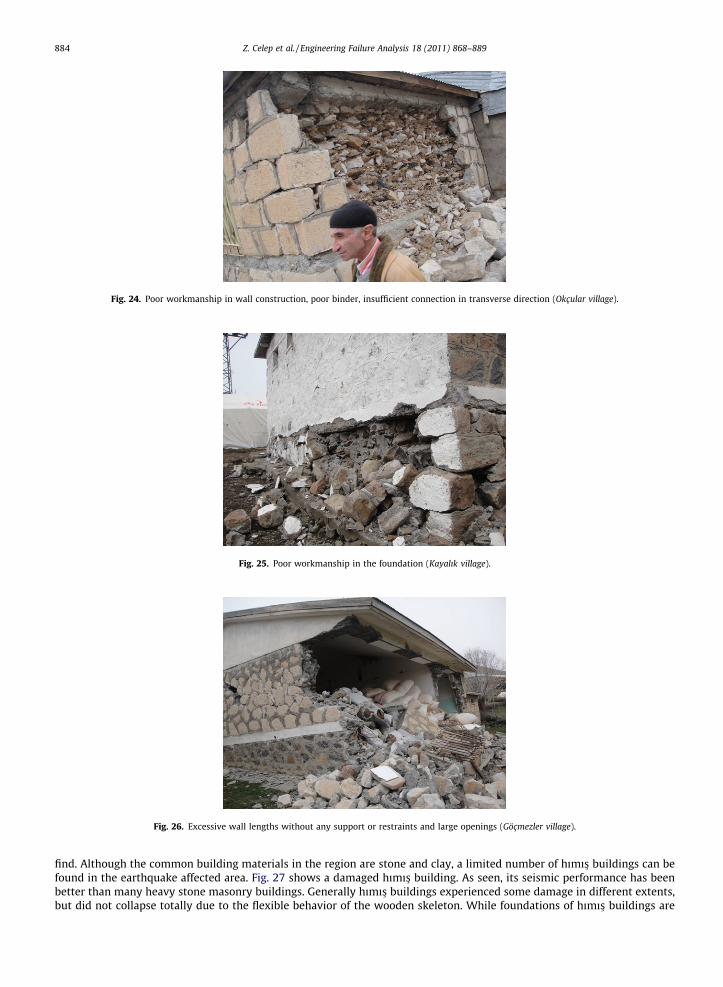
Fig. 24. Poor workmanship in wall construction, poor binder, insufficient connection in transverse direction (Okçular village).
Fig. 25. Poor workmanship in the foundation (Kayalık village).
Fig. 26. Excessive wall lengths without any support or restraints and large openings (Göçmezler village).
884 Z. Celep et al. / Engineering Failure Analysis 18 (2011) 868–889
find. Although the common building materials in the region are stone and clay, a limited number of hımıs� buildings can befound in the earthquake affected area. Fig. 27 shows a damaged hımıs� building. As seen, its seismic performance has beenbetter than many heavy stone masonry buildings. Generally hımıs� buildings experienced some damage in different extents,but did not collapse totally due to the flexible behavior of the wooden skeleton. While foundations of hımıs� buildings are
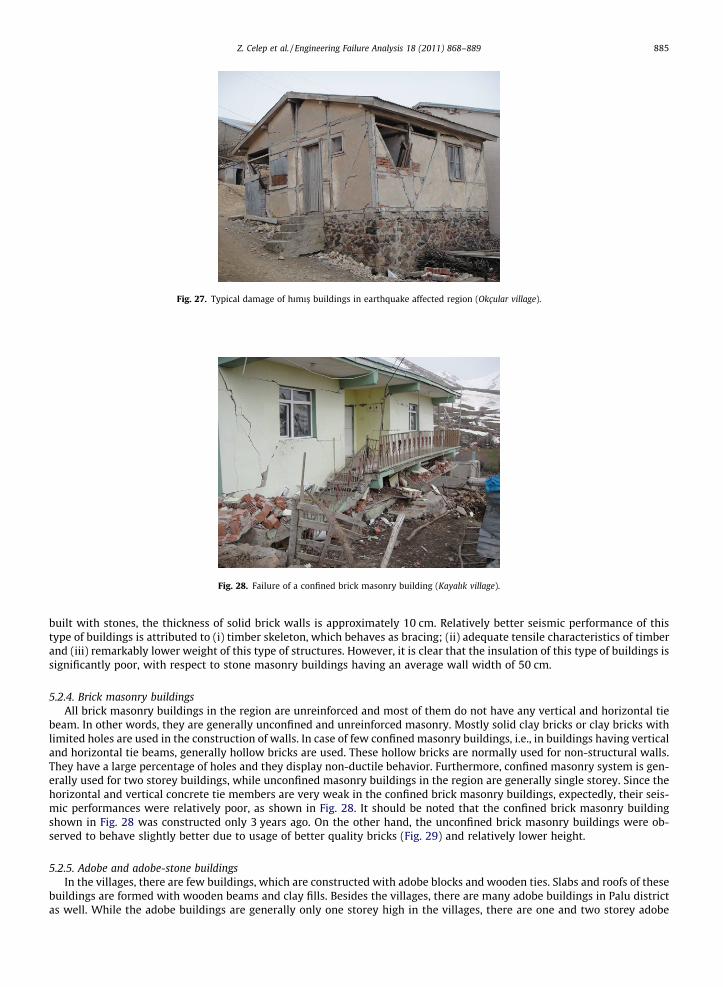
Fig. 27. Typical damage of hımıs� buildings in earthquake affected region (Okçular village).
Fig. 28. Failure of a confined brick masonry building (Kayalık village).
Z. Celep et al. / Engineering Failure Analysis 18 (2011) 868–889 885
built with stones, the thickness of solid brick walls is approximately 10 cm. Relatively better seismic performance of thistype of buildings is attributed to (i) timber skeleton, which behaves as bracing; (ii) adequate tensile characteristics of timberand (iii) remarkably lower weight of this type of structures. However, it is clear that the insulation of this type of buildings issignificantly poor, with respect to stone masonry buildings having an average wall width of 50 cm.
5.2.4. Brick masonry buildingsAll brick masonry buildings in the region are unreinforced and most of them do not have any vertical and horizontal tie
beam. In other words, they are generally unconfined and unreinforced masonry. Mostly solid clay bricks or clay bricks withlimited holes are used in the construction of walls. In case of few confined masonry buildings, i.e., in buildings having verticaland horizontal tie beams, generally hollow bricks are used. These hollow bricks are normally used for non-structural walls.They have a large percentage of holes and they display non-ductile behavior. Furthermore, confined masonry system is gen-erally used for two storey buildings, while unconfined masonry buildings in the region are generally single storey. Since thehorizontal and vertical concrete tie members are very weak in the confined brick masonry buildings, expectedly, their seis-mic performances were relatively poor, as shown in Fig. 28. It should be noted that the confined brick masonry buildingshown in Fig. 28 was constructed only 3 years ago. On the other hand, the unconfined brick masonry buildings were ob-served to behave slightly better due to usage of better quality bricks (Fig. 29) and relatively lower height.
5.2.5. Adobe and adobe-stone buildingsIn the villages, there are few buildings, which are constructed with adobe blocks and wooden ties. Slabs and roofs of these
buildings are formed with wooden beams and clay fills. Besides the villages, there are many adobe buildings in Palu districtas well. While the adobe buildings are generally only one storey high in the villages, there are one and two storey adobe
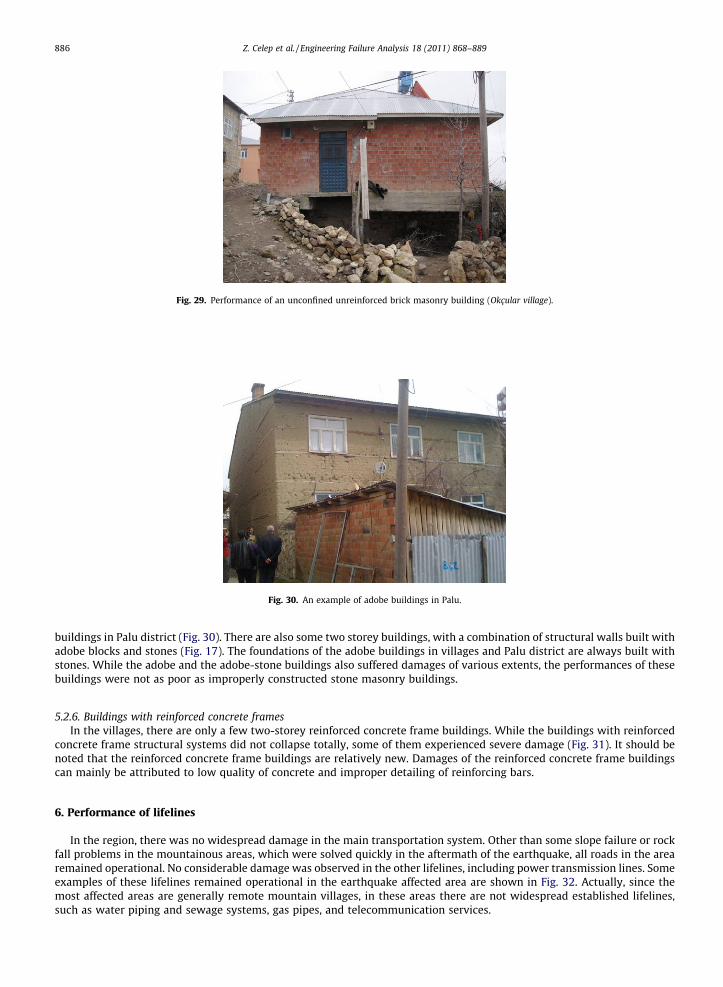
Fig. 29. Performance of an unconfined unreinforced brick masonry building (Okçular village).
Fig. 30. An example of adobe buildings in Palu.
886 Z. Celep et al. / Engineering Failure Analysis 18 (2011) 868–889
buildings in Palu district (Fig. 30). There are also some two storey buildings, with a combination of structural walls built withadobe blocks and stones (Fig. 17). The foundations of the adobe buildings in villages and Palu district are always built withstones. While the adobe and the adobe-stone buildings also suffered damages of various extents, the performances of thesebuildings were not as poor as improperly constructed stone masonry buildings.
5.2.6. Buildings with reinforced concrete framesIn the villages, there are only a few two-storey reinforced concrete frame buildings. While the buildings with reinforced
concrete frame structural systems did not collapse totally, some of them experienced severe damage (Fig. 31). It should benoted that the reinforced concrete frame buildings are relatively new. Damages of the reinforced concrete frame buildingscan mainly be attributed to low quality of concrete and improper detailing of reinforcing bars.
6. Performance of lifelines
In the region, there was no widespread damage in the main transportation system. Other than some slope failure or rockfall problems in the mountainous areas, which were solved quickly in the aftermath of the earthquake, all roads in the arearemained operational. No considerable damage was observed in the other lifelines, including power transmission lines. Someexamples of these lifelines remained operational in the earthquake affected area are shown in Fig. 32. Actually, since themost affected areas are generally remote mountain villages, in these areas there are not widespread established lifelines,such as water piping and sewage systems, gas pipes, and telecommunication services.
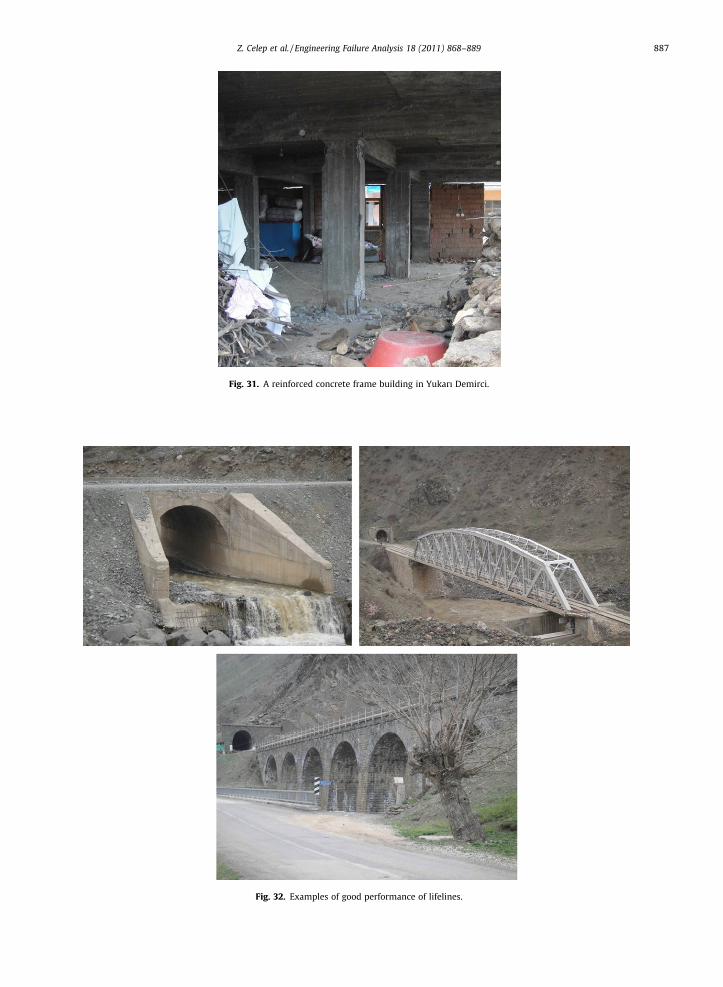
Fig. 31. A reinforced concrete frame building in Yukarı Demirci.
Fig. 32. Examples of good performance of lifelines.
Z. Celep et al. / Engineering Failure Analysis 18 (2011) 868–889 887
888 Z. Celep et al. / Engineering Failure Analysis 18 (2011) 868–889
7. General evaluation and recommendations
7.1. General evaluation
General evaluation of the observations in the earthquake area can be summarized as follows:
a. It is well known that the magnitude of earthquake is somehow proportional to the damage level in buildings. Althoughthe magnitude of the earthquake is reported to be 6.1 (or 5.8) in Richter scale, the structural damages occurred in alimited area. This is probably due to the lower focal depth of the seismic activity. As known, the damage assessment isone of the crucial steps of response and recovery phases of the disaster management. It is observed that the centraland the local administrations, including the Ministry of Public Works and the Elazıg Governorship, paid the requiredattention and assessed the building damages officially in a relatively short time.
b. Life losses were due to collapse of buildings, which are of stone masonry type having mud binder. They often have roofsconsisting of wooden beams in one direction having a thick clay cover. For the other building types, damages were lim-ited and they caused less life losses. Most of the structural failures were associated with deficiencies in the structurecaused by lack of supervision and/or with improper construction practices (poor materials, poor workmanship).
c. Observations reveal that masonry buildings, which conform to the main rules of construction, did not experience sig-nificant damage. By considering these observations together with the previous experiences, one can deduct thatmasonry buildings constructed according to the requirements of the TERDC have adequate seismic safety to resistto moderate earthquakes with controlled damages. The same statement can be made for the reinforced concrete build-ings as well.
d. The maximum acceleration of the records is found to be around 0.10-0.20g. In fact the acceleration value is low com-pared to the value 0.40g, the effective ground acceleration defined in the TERDC for the earthquake affected area. Thisfact exhibits that the damaged buildings, whether they are masonry or concrete, are those which have very low seis-mic load capacity. This information indicates another important fact related with the seismic capacity of the buildingswhich did not experience any damage after these earthquakes. Satisfactory performances of the undamaged buildingsdo not confirm that these buildings necessarily have adequate seismic safety.
e. Failures of natural slopes, which were associated with earthquake induced forces, have affected poorly constructedstructures and caused damages.
7.2. Recommendations
Recommendations for risk reduction in future are summarized below:
a. The decision of the Turkish government after the earthquakes indicates that an intense construction activity will takeplace in the area for the replacement of the damaged buildings. This activity will involve design of various typicalbuildings, selection of the construction areas and the actual construction. Considering the conditions in Turkey, gen-erally, the weak link of these phases is the construction stage. It is of prime importance to pay attention to the con-struction stage to attain the construction quality foreseen in the design phase.
b. Construction of masonry buildings in rural areas of Turkey is unavoidable. Furthermore, when properly designed andconstructed, masonry construction is a good option for buildings of two stories in rural areas. While there is an excel-lent printed information document prepared by the Ministry of Public Works and Settlement showing the construc-tion steps of a masonry building, it seems that the dissemination of the information has not been done adequately. It isrecommended that this type of information documents should be distributed properly. Village elders and teachers arethe potential people to be informed in detail. Furthermore, the village people can be informed, when they are in mil-itary for compulsory military service.
c. The requirements for the earthquake resistant masonry construction are already given in TERDC. These requirementscan be grouped into two categories. The requirements in the first category may only involve some simple constructionrules (in terms of geometry and dimensions) to be applied for the masonry buildings having only one or two stories.The requirements in the second category may be the additional rules to be applied for masonry buildings, when therequirements of the first category can not be satisfied. In this way construction of simple masonry buildings by thelocal people conforming to TERDC can be made possible.
d. As it is well known, in the earthquake area, construction of adobe or stone buildings is preferred due to local availabil-ity and their insulation properties. It is worth to state one well known important fact that any type of structure (con-crete, masonry, timber and adobe) having adequate seismic safety can be constructed by following the requirementsof the seismic codes within the certain limits described by the relevant codes.
8. Conclusions
Conclusions deducted from the observations in the earthquake area can be summarized as follows:
Z. Celep et al. / Engineering Failure Analysis 18 (2011) 868–889 889
a. There were failures of natural slopes in some localities in the region during ML = 5.8 Kovancılar and ML = 5.6 Paluearthquakes. These failures, which were associated with the triggering of the earthquake induced forces, have affectedpoorly constructed structures.
b. Although the peak accelerations were around 0.1–0.2g, there were many collapsed and damaged buildings. However,it is clearly seen that all collapsed and damaged buildings were non-engineered buildings constructed improperly. Thebuildings, which were constructed with a minimum amount of care withstood against the earthquakes without anydamage.
c. It was clearly observed that if a minimum set of practical rules, outlined above, have been obeyed in construction, thecollapses and casualties could have been avoided.
d. In many parts of Turkey and many other developing countries, which are prone to earthquakes, there are many non-engineered houses like the ones collapsed in Elazıg. To avoid further significant losses because of this kind of smallscale seismic events, proper construction of new buildings should be encouraged and existing non-engineered build-ings should be evaluated and strengthened at least to avoid total collapse.
Acknowledgement
The authors are grateful to Tubitak Marmara Research Center and Turkish Prime Ministry Disaster and Emergency Man-agement Presidency for permitting the authors to use Figs. 2 and 3, respectively.
References
[1] www.elazig.gov.tr.[2] Arpat E, S�aroglu F. Some observations related with North Anatolian Fault. MTA Journal 1972;78:44–50 (in Turkish).[3] S�aroglu F, Emre Ö, Kus�çu _I. 1:1000 000 Active Fault Map of Turkey. Ankara: MTA Publications; 1992 (in Turkish).[4] www.deprem.gov.tr.[5] www.mam.gov.tr.[6] www.koeri.boun.edu.tr.[7] B. Taskin, A. Sezen, F.I. Kara, Ü. Mert Tugsal, Derivation of Empirical Relationships for Determination of Target Displacements through Turkish
Earthquake Records for Performance Based Design of Reinforced Concrete Structures, TÜB_ITAK Project Report, No: 106M048, Ankara, 2008 (in Turkish).[8] Z. Hasgür, The investigation of seismic intensities observed in Turkey in terms of structural engineering, Technical Journal of Chamber of Civil
Engineers (July) (1991) 319–333 (in Turkish).[9] Turkish Earthquake Resistant Design Code, Ministry of Public Works and Settlement, Ankara, 2007.
[10] L. Esteva, Seismicity prediction: a Bayesian approach, in: Proceedings of IV WCEE, Santiago, 1969.[11] Mortgat CP, Shah HC. A Bayesian model for seismic hazard mapping. Bulletin of the Seismological Society of America 1979;69:1237–51.[12] Joyner WB, Boore DM. Peak horizontal acceleration and velocity from strong motion records including records from the 1979 Imperial Valley,
California Earthquake. Bulletin of Seismological Society of America 1981;71(6):2011–38.[13] Campbell KW. Strong motion attenuation relations: a ten-year perspective. Earthquake Spectra 1985;1:759–804.[14] Y. Fukushima, T. Tanaka, S. Kataokas, A new attenuation relationship for peak ground acceleration derived from strong motion accelerograms, in:
Proceedings of the IX WCEE, Tokyo, 1998.[15] Boore DM, Joyner WB, Fumal TE. Equations for estimating horizontal response spectra and peak acceleration from Eastern North American
earthquakes: a summary of recent work. Seismological Research Letters 1997;86(1):128–53.[16] Ulusay R, Tuncay E, Sönmez H, Gökçeoglu C. An attenuation relationship based on Turkish strong motion data and iso-acceleration map of Turkey.
Engineering Geology 2004;74:265–91.[17] U. Çeken, Strong Ground Motion Attenuation Relationship for Marmara Region, MSc Thesis, Geophysics Dept., Sakarya University, Sakarya, 2007 (in
Turkish).[18] Geology and Seismicity of Cities, Ministry of Public Works and Settlement, Ankara, 1980 (in Turkish).[19] Newmark N. Effects of earthquakes on dams and embankments. Geotechnique 1965;15(2):139–60.