Successfully Replacing Oil-Based Drilling Fluids With Water-Based Drilling Fluids Case

Research, Development and Technology
MoDOT
RDT 04-019
Engineering Evaluation of Polymer-Based Drilling Fluids
for Applications in Missouri Shale
July, 2004
RI 03-008
University of Missouri-Columbia

Final Report
Research Investigation RI03-008 Report No. RDT 04-019
Engineering Evaluation of Polymer-Based Drilling Fluids for Applications in Missouri Shale
Prepared by:
William J. Likos, Ph.D. Assistant Professor of Civil Engineering
J. Erik Loehr, Ph.D.
Associate Professor of Civil Engineering
Kiranmayee Akunuri Graduate Research Assistant
University of Missouri – Columbia
Department of Civil and Environmental Engineering Columbia, MO 65211
Prepared for:
MISSOURI DEPARTMENT OF TRANSPORTATION RESEARCH, DEVELOPMENT AND TECHNOLOGY
JEFFERSON CITY, MISSOURI DATE SUBMITTED: July 2004
The opinions, findings, and conclusions expressed in this publication are those of the principal investigators and the Missouri Department of Transportation, Research, Development and Technology. They are not necessarily those of the U.S. Department of Transportation, Federal Highway Administration. This report does not constitute a standard or regulation.
Technical Report Documentation Page
1. Report No. 2. Government Accession No. 3. Recipient's Catalog No. RDT 04-019 4. Title and Subtitle 5. Report Date
July 2004 6. Performing Organization Code
Engineering Evaluation of Polymer-Based Drilling Fluids for Applications in Missouri Shale
7. Author(s) 8. Performing Organization Report No. William J. Likos, J. Erik Loehr, and Kiranmayee Akunuri 9. Performing Organization Name and Address 10. Work Unit No.
11. Contract or Grant No.
University of Missouri – Columbia Department of Civil and Environmental Engineering Columbia, MO 65211 RI03-008 12. Sponsoring Agency Name and Address 13. Type of Report and Period Covered
Final Report 14. Sponsoring Agency Code
Missouri Department of Transportation Research, Development and Technology Division P. O. Box 270, Jefferson City, MO 65102 15. Supplementary Notes 16. Abstract The objective of this study is to improve the general state of understanding regarding the performance and specification of polymer-based drilling fluids for geotechnical drilling applications in Missouri shale formations. The practical product of the work is a demonstrated and documented series of laboratory procedures that may be followed to more effectively specify polymer-based fluids on a site-specific basis. Specific tasks accomplished are as follows: (1) Quantify the engineering index (liquid limit, plastic limit), mineralogical, and strength properties of soil/rock materials obtained from three select Missouri shale formations; (2) Quantify the slake durability and jar slake durability of shale specimens upon interaction with control fluids (water) and various types and concentrations of polymer-based drilling fluids; (3) Quantify the swelling behavior of shale specimens in control fluids and various types and concentrations of polymer-based slurries; (4) Quantify the softening behavior of shale specimens after exposure to control fluids and various types and concentrations of polymer-based drilling slurries; and (5) Quantify the rheological properties of polymer slurries as a function of slurry concentration and elapsed time since preparation. Specific conclusions resulting from the effort are as follows: (1) Complete realization of polymer slurry viscosity requires at least 5 hours and as much as more than 48 hours; (2) Solid-based slurries develop full viscosity more rapidly than liquid-based (emulsified) slurries; (3) Solid-based slurries develop consistently higher viscosity than liquid-based slurries; (4) Shale durability is only slightly enhanced relative to baseline values for distilled water and not enhanced relative to baseline values for tap water; (5) There is no significant dependence on the type (manufacturer) or form (solid or liquid) of polymer in terms of slurry performance; (6) Durability, swelling inhibition, and hardness all increase with increasing polymer concentration and appear to reach an optimum value at the manufacturer recommended concentration. Recommendations for future work include: (1) Additional efforts to test procedures proposed in this study for site-specific polymer slurry specification; (2) Detailed consideration of slurry pH; (3) Efforts to develop alternatives to Marsh funnel testing for viscosity quality control; and (4) Additional laboratory and field tests to systematically quantify the load capacity of drilled shafts constructed using polymer slurry techniques. 17. Key Words 18. Distribution Statement geotechnical engineering, shale, drilling fluid, slurry, polymer, drilled shaft
No restrictions. This document is available to the public through National Technical Information Center, Springfield, Virginia 22161
19. Security Classification (of this report) 20. Security Classification (of this page) 21. No. of Pages 22. Price Unclassified Unclassified 73
Form DOT F 1700.7 (06/98)
ii
Executive Summary
The objective of this study is to improve the general state of understanding regarding the
performance and specification of polymer-based drilling fluids for geotechnical drilling
applications in Missouri shale formations. The practical product of the work is a demonstrated
and documented series of laboratory procedures that may be followed to more effectively specify
polymer-based fluids on a site-specific basis.
Specific tasks accomplished in the study are as follows: (1) Quantify the engineering
index (liquid limit, plastic limit), mineralogical, and strength properties of soil/rock materials
obtained from three select Missouri shale formations; (2) Quantify the slake durability and jar
slake durability of shale specimens upon interaction with control fluids (water) and various types
and concentrations of polymer-based drilling fluids; (3) Quantify the swelling behavior of shale
specimens in control fluids and various types and concentrations of polymer-based slurries; (4)
Quantify the softening behavior of shale specimens after exposure to control fluids and various
types and concentrations of polymer-based drilling slurries; and (5) Quantify the rheological
properties of polymer slurries as a function of slurry concentration and elapsed time since
preparation.
Specific conclusions resulting from the effort are as follows: (1) Complete realization of
polymer slurry viscosity requires at least 5 hours and may require more than 48 hours; (2) Solid-
based slurries develop full viscosity more rapidly than liquid-based (emulsified) slurries; (3)
Solid-based slurries develop consistently higher viscosity than liquid-based slurries; (4) Shale
durability is only slightly enhanced relative to baseline values for distilled water and not
enhanced relative to baseline values for tap water; (5) There is no significant dependence on the
type (manufacturer) or form (solid or liquid) of polymer in terms of slurry performance; (6)
Durability, swelling inhibition, and hardness all increase with increasing polymer concentration
and appear to reach an optimum value at the manufacturer recommended concentration.
Recommendations for future work include: (1) Additional efforts to test procedures
proposed in this study for site-specific polymer slurry specification; (2) Detailed consideration of
slurry pH; (3) Efforts to develop alternatives to Marsh funnel testing for viscosity quality control;
and (4) Additional laboratory and field tests to systematically quantify the load capacity of drilled
shafts constructed using polymer slurry techniques.
iii

Table of Contents
Executive Summary ..........................................................................................................................iii
Table of Contents...............................................................................................................................iv
List of Figures ....................................................................................................................................vi
List of Tables .....................................................................................................................................viii
1. Introduction....................................................................................................................................1
1.1 Motivation........................................................................................................................1
1.2 Project Objectives and Tasks ...........................................................................................3
1.3 Structure of Report...........................................................................................................4
2. Background....................................................................................................................................5
2.1 Polymer Slurry (PHPA) ...................................................................................................5
2.2 Present Technical Conditions ..........................................................................................8
3. Technical Approach (Materials and Methods) ..............................................................................12
3.1 Shale Materials.................................................................................................................12
3.1.1 Geology and Preliminary Characterization.......................................................12
3.1.2 Mineralogy........................................................................................................19
3.2 Slurry Materials ...............................................................................................................25
3.3 Slurry Preparation ............................................................................................................26
3.4 Slurry Viscosity Testing ..................................................................................................28
3.5 Slake Durability Testing ..................................................................................................29
3.6 Jar Slake Testing..............................................................................................................32
3.7 Unconfined Axial Swell Testing......................................................................................32
3.8 Bulk Hardness Testing.....................................................................................................34
4. Results and Discussion ..................................................................................................................39
4.1 Slurry Viscosity ...............................................................................................................39
4.1.1 Viscosity as a Function of Concentration .........................................................39
4.1.2 Viscosity as a Function of Time .......................................................................41
4.1.3 Discussion .........................................................................................................44
4.2 Slake Durability Results ..................................................................................................45
4.2.1 Durability Relative to Baseline Tests ...............................................................45
iv
4.2.2 Durability as a Function of Slurry Concentration.............................................48
4.3 Jar Slake Results ..............................................................................................................51
4.4 Unconfined Axial Swell Results......................................................................................52
4.4.1 Swell Relative to Baseline Tests.......................................................................52
4.4.2 Swell as a Function of Slurry Concentration ....................................................54
4.4.3 Discussion .........................................................................................................55
4.5 Bulk Hardness Results .....................................................................................................56
4.5.1 Bulk Hardness as a Function of Slurry Concentration......................................56
4.5.2 Discussion .........................................................................................................58
5. Summary, Conclusions, and Recommendations............................................................................58
5.1 Summary ..........................................................................................................................58
5.2 Conclusions......................................................................................................................59
5.3 Recommendations............................................................................................................61
5.3.1 Recommendations for Implementation.............................................................61
5.3.2 Recommendations for Future Research ............................................................64
References..........................................................................................................................................66
Appendices.........................................................................................................................................68
Appendix A: Current MoDOT Drilling Fluid Specifications ................................................68
Appendix B: Original Boring Logs for Macon County Core ................................................71
Appendix C: Original Boring Logs for McDonald County Core ..........................................73
v
List of Figures
2.1. Acrylamide –Sodium Acrylate (PHPA) Polymer .......................................................................6 2.2. SEM image showing polymer bundle penetrating a medium sand formation............................7 2.3. Coating and encapsulation of charged clay packet by an anionic PHPA polymer chain ...........8 3.1. Photograph (a) and boring data (b) for Lafayette County material. ...........................................15 3.2. Pennsylvanian System, Desmoinesian Series (Cherokee group, Cabaniss subgroup). ..............17 3.3. Photograph of core box for Macon County material. ................................................................18 3.4. Photographs of material from McDonald County: (a) 5.9’ – 15.9’, and (b) 15.9’-20.9’............19 3.5. XRD results; Lafayette County Core (26.84m), Bevier C1 Formation: (a) air dried, (b)
glycolated, (c) heat treated at 500º C for 1 hour. ...................................................................21 3.6. XRD results; Lafayette County Core (29.38m), Bevier C2 Formation: (a) air dried, (b)
glycolated, (c) heat treated at 500º C for 1 hour. ...................................................................22 3.7. XRD results; Macon County Core (41.0’), Lagonda Formation: (a) air dried, (b) glycolated,
(c) heat treated at 500º C for 1 hour.......................................................................................23 3.8. XRD results; McDonald County Core (6.5’), Chattanooga Formation: (a) air dried, (b)
glycolated, (c) heat treated at 500º C for 1 hour. ...................................................................24 3.9. Photographs of concentrated polymer slurries: (a) Super Mud and Super Mud Dry, (b) close
up of Super Mud Dry. ............................................................................................................25 3.10. (a) Schematic diagram and (b) photograph of a Marsh Funnel. ...............................................28 3.11. Photograph of slake durability testing equipment. ...................................................................30 3.12. Series of photographs illustrating the appearance of jar slake categories 1 through 6. ............33 3.13. Unconfined axial swell testing system: (a) schematic diagram and (b) photograph. ...............35 3.14. Bulk hardness testing device: (a) schematic diagram and (b) photograph of loading frame
and modified consolidation cell. ............................................................................................37 3.15. Detail of modified base plate: (a) pattern of 0.25” holes; (b) example of shale specimen
after extrusion. .......................................................................................................................37
vi
3.16. Bulk hardness testing results for fragments from the Lafayette County core (Bevier C2) immersed for 24 hours in PDSCo Solid slurry (100% Mfg. concentration)..........................38
4.1. Viscosity as a function of concentration: MFV measured immediately after mixing. ...............39 4.2. Viscosity as a function of concentration: MFV measured 24 hours after mixing. .....................40 4.3. Viscosity as a function of concentration: MFV measured 48 hours after mixing. .....................40 4.4. MFV as a function of time since mixing: PDSCo Solid Polymer (100 % Mfg). .......................41 4.5. MFV as a function of time since mixing: PDSCo Liquid Polymer (100 % Mfg). .....................42 4.6. MFV as a function of time since mixing: Baroid Solid Polymer (100 % Mfg)..........................42 4.7. MFV as a function of time since mixing: Baroid Liquid Polymer (100 % Mfg). ......................43 4.8. MFV as a function of time since mixing: all four polymers (100 % Mfg). ................................43 4.9. Results of slake durability tests for Lafayette County core (Bevier C1 Formation) and
PDSCo solid slurry mixed to various concentrations. ...........................................................49 4.10. Results of slake durability tests for Macon County core (Verdigris Formation) and PDSCo
solid slurry mixed to various concentrations. ........................................................................49 4.11. Results of slake durability tests for McDonald County core (Chattanooga Formation) and
PDSCo solid slurry mixed to various concentrations. ...........................................................50 4.12. Combined results for slake durability as a function of PDSCo solid slurry concentration. .....50 4.13. Results of swell tests using Lafayette County core (Bevier C2) and tap water. .......................54 4.14. Maximum axial strain as a function of PDSCo Solid slurry concentration..............................55 4.15. Bulk hardness as a function of PDSCo solid slurry concentration ...........................................57 5.1. Suggested sequence of laboratory efforts for site specific specification of polymer based
slurries....................................................................................................................................63
vii
List of Tables
Table 2.1. MoDOT specifications for acceptance range of values for mineral and polymer slurries (API Standard 13B) in fresh water without additives. ..........................................................10 Table 2.2. Summary of specifications for acceptance range of values for mineral and polymer slurries (adapted from Majano and O’Neill, 1993)............................................................................11 Table 2.3. Recommended mineral and polymer slurry properties in sands for fresh water applications (Majano and O’Neill, 1993). .........................................................................................12 Table 3.1. Results of jar slake tests for Lafayette County specimens (from Miller, 2003). ..............14
Table 3.2. Results of strength tests for Lafayette County specimens (from Miller, 2003)................14 Table 3.3. Qualitative mineralogy for select shale specimens...........................................................20
Table 3.4. Recommended mixing ratios for freshwater applications in clay shale. ..........................27
Table 3.5. Mixing ratios for range of slurry concentrations prepared. .............................................27 Table 4.1. Initial and final Marsh funnel viscosity for polymers mixed to 100% Mfg. recommended concentration. .............................................................................................................45 Table 4.2. Summary of slake durability results: Lafayette County, Bevier C1 Formation. ..............46
Table 4.3. Summary of slake durability results for PDSCo solid slurry mixed to various concentrations. ...................................................................................................................................51 Table 4.4. Summary of jar slake results.............................................................................................52
Table 4.5. Summary of swell testing Results for Lafayette core (Bevier C2). ..................................53
Table 4.6. Summary of bulk hardness index results. .........................................................................57
viii
1. Introduction
1.1 Motivation
Clay-rich sedimentary shale formations are highly sensitive to both mechanical and
chemical disturbance, making them particularly problematic to drill. Instability, sloughing, and
the potential loss of interface shear strength along uncased borehole walls are primarily the result
of swelling processes that occur when active (expansive) clays comprising the shale formation
interact with free water comprising the drilling fluid used to lubricate and stabilize the borehole.
Effective specification and quality control of appropriate drilling fluids to minimize these
swelling processes, while remaining environmentally friendly and providing the sufficient
density, viscosity, and filtration characteristics required to stabilize the borehole, can
significantly improve the efficiency, cost, and overall quality of the drilling operation and the
resulting hole. For drilled shaft applications, where the strength and integrity of the shaft-hole
interface are important considerations in perimeter load transfer, interactions between the drilling
fluid and the borehole wall are particularly important to understand and control.
Since roughly the 1960’s, contractors have been using commercially available processed
clay minerals to maintain borehole stability during foundation drilling, most notably bentonite
and attapulgite (palygorskite). Mineral based drilling slurries rapidly became and continue to be
very popular because of their efficient ability to yield the viscosity, density, and filter cake
formation characteristics required to carry and suspend cuttings, provide positive pressure to the
borehole wall, and minimize fluid losses, each of which is an important requirement in
geotechnical or recovery-related drilling applications. Recently, however, state and federal
agencies have started to require that mineral-based slurries be disposed in landfills because of
their particulate nature and because some of the additives commonly used in mineral based
1

slurries can be harmful to aquatic life (Ata and O’Neill, 2000). The costs associated with this
requirement can potentially impact negatively on the economic advantage of drilled shafts
(Majano and O’Neill, 1993). An additional large component of the cost associated with mineral-
based slurries is determined by the desanding and recirculation machinery required to keep the
slurry clean for subsequent reuse (Bacon et al., 2000). Alternatives to mineral-based slurries,
therefore, are often desirable.
Organic or synthetic polymer-based slurries have emerged in recent years (early 1990’s)
as an attractive alternative to conventional water-based or oil-based mineral slurries for drilling
in a wide range of soil and rock types, including problematic swelling shale formations (e.g.,
Darley and Gray, 1988; Young, 2001; Turner and Macnab, 2003). Polymer-based slurries, which
are considered to be non-particulate, non-hazardous, and are readily disposable on-site, retain
environmental advantages over traditional drilling fluids while in many cases providing effective
inhibition of swelling pressure and deformation at the borehole wall. The relatively low density
of polymer-based slurry significantly increases the efficiency of on-site desanding operations and
subsequent slurry reuse. Polymer slurry can simply be pumped into an open tank, left for a few
hours, and then reused.
Despite the apparent advantages of polymer-based fluids, developing the most
appropriate practice for their specification and quality control is an important practical aspect
that remains to a large extent uncertain. General guidelines for the use of polymer slurries are for
the most part derived from specifications originally developed for mineral-based slurries.
MoDOT’s recent experiences using polymer slurries for drilled shaft installation in shale have
demonstrated that site specific evaluation of the slurry-shale interaction behavior is desirable.
Specific questions that remain unanswered include the following: 1) What is the optimum type of
2
polymer-based drilling fluid to use for specific Missouri shale sites?; 2) What is the optimum
concentration of polymer slurry required to adequately inhibit swelling, softening, and slaking of
the materials located at a specific site?; 3) What types of quality control measures are the most
efficient, applicable, and reliable?; 4) Can specification of polymer slurries for use in drilled
shaft applications be improved? To date, very little research has been conducted either inside or
outside the state of Missouri to investigate polymer slurry - shale interactions and the consequent
effects on the durability and strength of the shale.
1.2 Project Objectives and Tasks
The activities described in this final report have been conducted to address the
uncertainties presently associated with the usage, performance, and specification of polymer-
based slurries for drilling operations in Missouri shale. The primary objective of the project has
been to improve our general understanding of polymer slurry – shale interaction for
representative Missouri shale types and to examine the effects of changes in the primary
variables expected to affect polymer performance (e.g., polymer type, polymer concentration).
The long term objective of the work has been to provide evidence that may be used to more
efficiently specify the use of polymer-based slurries in Missouri shale. Specific tasks have been
as follows:
1) Quantify the engineering index (liquid limit, plastic limit), mineralogical (X-
ray diffraction), and strength (unconfined compression) properties of soil/rock
materials obtained from three select Missouri shale formations.
2) Quantify the slake durability and jar slake (erosion and sloughing
characteristics) of selected shale specimens upon interaction with control fluids
3
(distilled water or tap water) and various types and concentrations of
commercially available polymer-based drilling fluids.
3) Quantify the volume change characteristics of the shale specimens upon
inundation with control fluid (tap water) and various types and concentrations of
commercially available polymer-based slurries.
4) Develop a new testing apparatus and procedure to evaluate the hardness
(softening characteristics) of the shale specimens after exposure to control fluids
and various types and concentrations of polymer-based drilling slurries.
5) Quantify the rheological (Marsh Funnel Viscosity) properties of select polymer
slurries as a function of slurry concentration and elapsed time since slurry
preparation.
1.3 Structure of Report
This report provides detailed documentation of the activities performed to accomplish the
project objectives. Section 2, Background, is included to clarify the basic molecular structure and
generalities associated with polymer-based drilling slurries. Section 3, Technical Approach,
summarizes the materials and methods undertaken in this study. Section 4, Results and
Discussion, presents results and describes the implications from four specific testing series that
were undertaken to evaluate slurry/shale interaction performance, including: (1) slake durability
testing series, (2) jar slake testing series, (3) unconfined axial swell testing series, and (4) bulk
hardness testing series. Finally, Section 5 summarizes the research effort, develops an associated
list of conclusions, and provides a series of recommendations for implementation of the present
effort and future research directions to expand the present effort.
4
2. Background
2.1 Polymer Slurry (PHPA)
Darley and Gray (1988) provide a detailed description of the basic form and structure of
polymer-based drilling slurries. In general, polymer slurries are composed of unit cells
(monomers) linked together in either straight or branched chains to form macromolecules. A
single macromolecule may contain hundreds to thousands of unit cells and remains well within
the colloidal size range (Darley and Gray, 1988). Currently, there are natural organic polymers
(e.g., cellulose, xanthum gum, starch), semi-synthetic (modified natural) polymers, or synthetic
polymers available for use in commercial drilling fluid applications. Synthetic polymers have
found far greater use in geotechnical engineering practice (Ata and O’Neill, 2000). The most
notable of synthetic polymers for use in drilled shaft applications is partially hydrolyzed
polyacrylamide (PHPA), which is commercially available in either dry (granular powder) or
emulsified form.
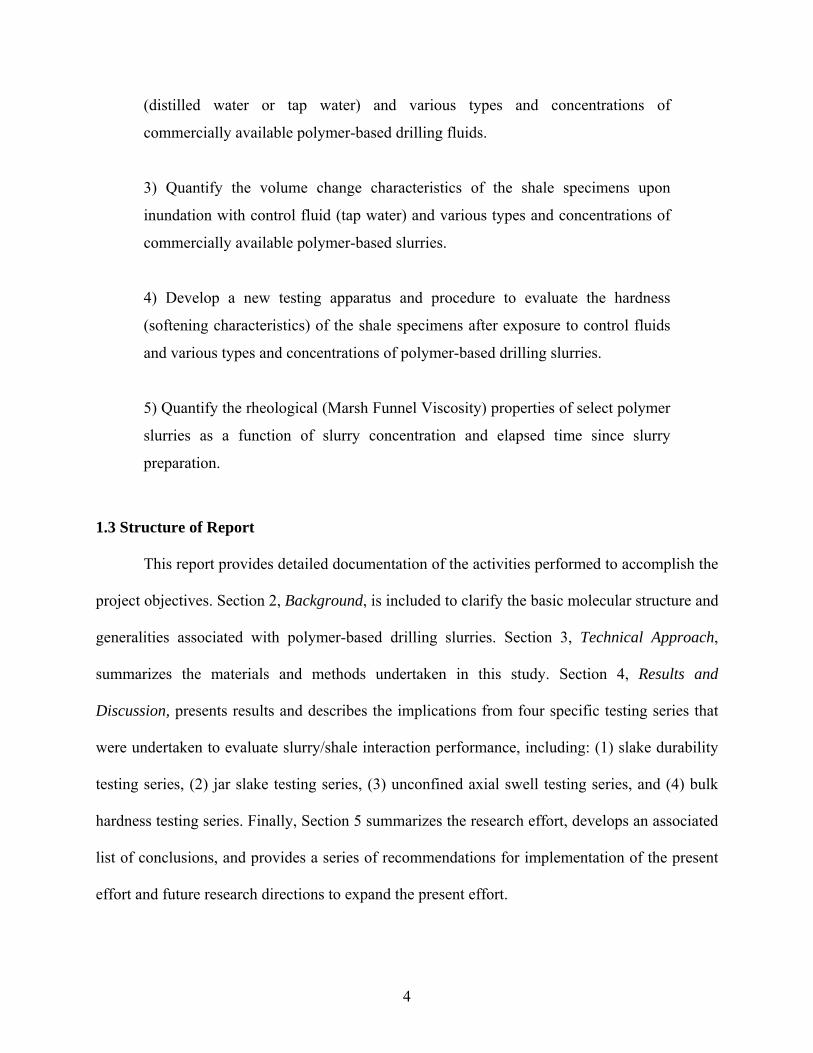
PHPA is a water soluble, anionic polymer chain. Figure 2.1 shows a schematic diagram
of the basic PHPA structure. The polymer is referred to as anionic because it is characterized by
negatively charged sites at specific points located along the molecular chain. Charge sites along
PHPA polymers are manufactured by converting some amides on a polyacrylamide chain to
carboxylates through a process called hydrolysis. As shown, the negatively charged carboxylate
sites are balanced by positively charged cationic species (e.g., Na+), which disassociate from the
macromolecule when it is placed in solution (e.g., when mixed with water to form a drilling
slurry). This disassociation and corresponding ionization causes the negatively charged sites to
repel each other, thus causing the molecular chain to stretch out like an uncoiling spring. The
uncoiling of the polymer chain imparts viscosity to the solution (due to the entanglement and
5
shear strength of the hydrated polymer chains). The uncoiling is also responsible for the filtration
characteristics of PHPA slurries because the relatively long molecules tend to entangle and clog
in the pores of granular material or seal microfractures in shale or rock (see Figure 2.2). PHPA
slurries tend to form a relatively thin filter cake at the borehole wall, a characteristic that is often
cited as an advantage over mineral-based slurries (which tend to form relatively thick and weak
filter cakes) when considering perimeter load transfer for drilled shaft applications. In many
applications (particularly when drilling in very pervious soils), however, the relatively thin filter
cake formed using PHPA is not sufficient to prevent excessive fluid losses.
Figure 2.1. Acrylamide –Sodium Acrylate (PHPA) Polymer (after Darley and Gray, 1988)
6

Figure 2.2. SEM (scanning electron micrograph) image showing polymer bundle penetrating a medium sand formation. Entanglement of the polymer chains in the soil matrix results in the formation of a thin filter cake at the borehole wall (from Ata and O’Neill, 2000).
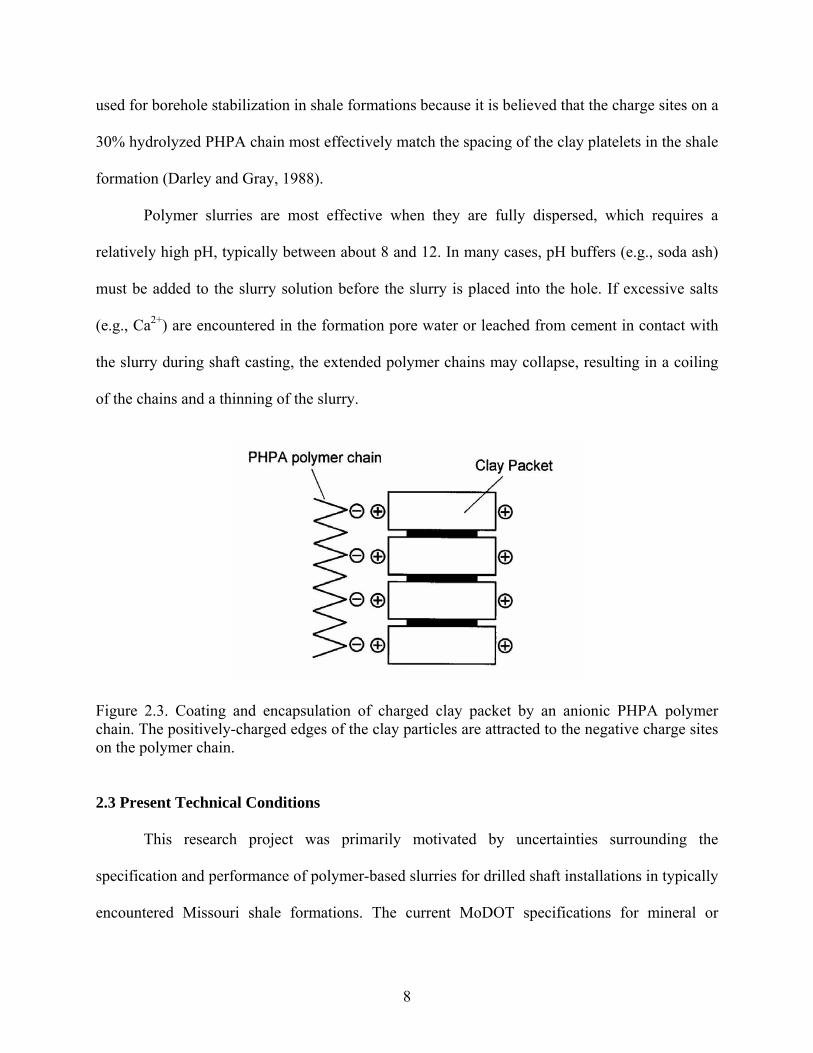
Upon interaction with clay minerals present in shale, the negatively charged sites on the
PHPA molecule are attracted to the positively charged sites on the edges of the clay particles,
thus promoting “coating” or “encapsulation” of the clay with the PHPA (see Figure 2.3). It is this
coating action that is believed to retard swelling, dispersion, and disintegration by creating a
barrier against migration of water into the matrix of the soil/rock being excavated, therefore
increasing the overall stability and integrity of the hole. Similarly, it coats and protects the shale
cuttings to maintain their integrity as the waste material is removed from the hole.
The modifier “partially hydrolyzed” in PHPA refers to the fact that a specific percentage
of amides on the polyacrylamide chain may be converted to carboxylates through hydrolysis.
The amount of hydrolysis, therefore, describes the frequency of occurrence of negatively charged
sites on the polymer chain. Thirty percent (30%) partially hydrolyzed PHPA is most commonly
7
used for borehole stabilization in shale formations because it is believed that the charge sites on a
30% hydrolyzed PHPA chain most effectively match the spacing of the clay platelets in the shale
formation (Darley and Gray, 1988).
Polymer slurries are most effective when they are fully dispersed, which requires a
relatively high pH, typically between about 8 and 12. In many cases, pH buffers (e.g., soda ash)
must be added to the slurry solution before the slurry is placed into the hole. If excessive salts
(e.g., Ca2+) are encountered in the formation pore water or leached from cement in contact with
the slurry during shaft casting, the extended polymer chains may collapse, resulting in a coiling
of the chains and a thinning of the slurry.
Figure 2.3. Coating and encapsulation of charged clay packet by an anionic PHPA polymer chain. The positively-charged edges of the clay particles are attracted to the negative charge sites on the polymer chain.
2.3 Present Technical Conditions
This research project was primarily motivated by uncertainties surrounding the
specification and performance of polymer-based slurries for drilled shaft installations in typically
encountered Missouri shale formations. The current MoDOT specifications for mineral or
8

polymer water-based drilling fluids have been developed following American Petroleum Institute
(API) Standard 13B, “Recommended Standard Procedure for Field Testing Water-Based Drilling
Fluids,” which provides standard procedures for determining the following characteristics of
water-based drilling fluids: a) drilling fluid density (mud weight); b) viscosity and gel strength;
c) filtration; d) water, oil and solids contents; e) sand content; f) methylene blue capacity; g) pH;
h) alkalinity and lime content; i) chloride content; and j) total hardness as calcium.
The current MoDOT drilling fluid specification is included in the appendix of this report.
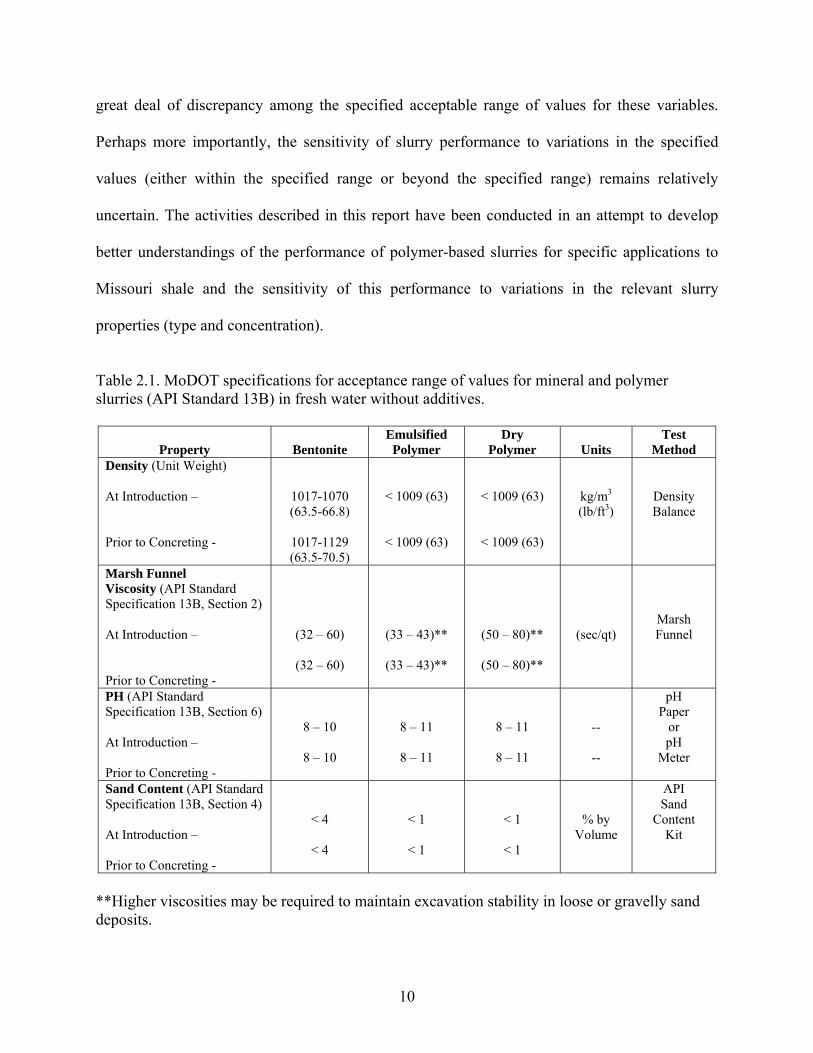
Table 2.1 summarizes the specification in terms of acceptable ranges of values for the four slurry
quality control variables considered (density, Marsh funnel viscosity, pH, and sand content). For
comparison, Table 2.2 summarizes acceptable ranges for these and other field variables
synthesized from a variety of other drilling fluid specifications or reports available in the
literature. Note that with the exception of the ACI specification, these specifications have
primarily been developed for mineral-based (bentonite or attapulgite) slurry applications. Table
2.3 summarizes a series of specifications developed by Majano and O’Neill (1993) that includes
a more detailed treatment of polymer slurries (dry and emulsified). These recommendations were
developed based on a review of results from a comprehensive series of tests for slurry
rheological properties, filtration characteristics, sedimentation (settling) characteristics, small-
scale laboratory extraction tests for model drilled shafts, and field load tests. The specifications
are specifically recommended for use in sands for fresh water applications. The acceptable
ranges recommended by Majano and O’Neill (1993) are quite similar to the current MoDOT
specifications.
For the most part, the specifications summarized in Tables 2.1 through 2.3 share a
common set of quality control variables (density, Marsh viscosity, etc.). There is, however, a
9
great deal of discrepancy among the specified acceptable range of values for these variables.
Perhaps more importantly, the sensitivity of slurry performance to variations in the specified
values (either within the specified range or beyond the specified range) remains relatively
uncertain. The activities described in this report have been conducted in an attempt to develop
better understandings of the performance of polymer-based slurries for specific applications to
Missouri shale and the sensitivity of this performance to variations in the relevant slurry
properties (type and concentration).
Table 2.1. MoDOT specifications for acceptance range of values for mineral and polymer slurries (API Standard 13B) in fresh water without additives.
Property
Bentonite
Emulsified Polymer
Dry Polymer
Units
Test Method
Density (Unit Weight) At Introduction – Prior to Concreting -
1017-1070 (63.5-66.8)
1017-1129 (63.5-70.5)
< 1009 (63)
< 1009 (63)
< 1009 (63)
< 1009 (63)
kg/m3
(lb/ft3)
Density Balance
Marsh Funnel Viscosity (API Standard Specification 13B, Section 2) At Introduction – Prior to Concreting -
(32 – 60)
(32 – 60)
(33 – 43)**
(33 – 43)**
(50 – 80)**
(50 – 80)**
(sec/qt)
Marsh Funnel
PH (API Standard Specification 13B, Section 6) At Introduction – Prior to Concreting -
8 – 10
8 – 10
8 – 11
8 – 11
8 – 11
8 – 11
--
--
pH Paper
or pH
Meter
Sand Content (API Standard Specification 13B, Section 4) At Introduction – Prior to Concreting -
< 4
< 4
< 1
< 1
< 1
< 1
% by Volume
API Sand
Content Kit
**Higher viscosities may be required to maintain excavation stability in loose or gravelly sand deposits.
10
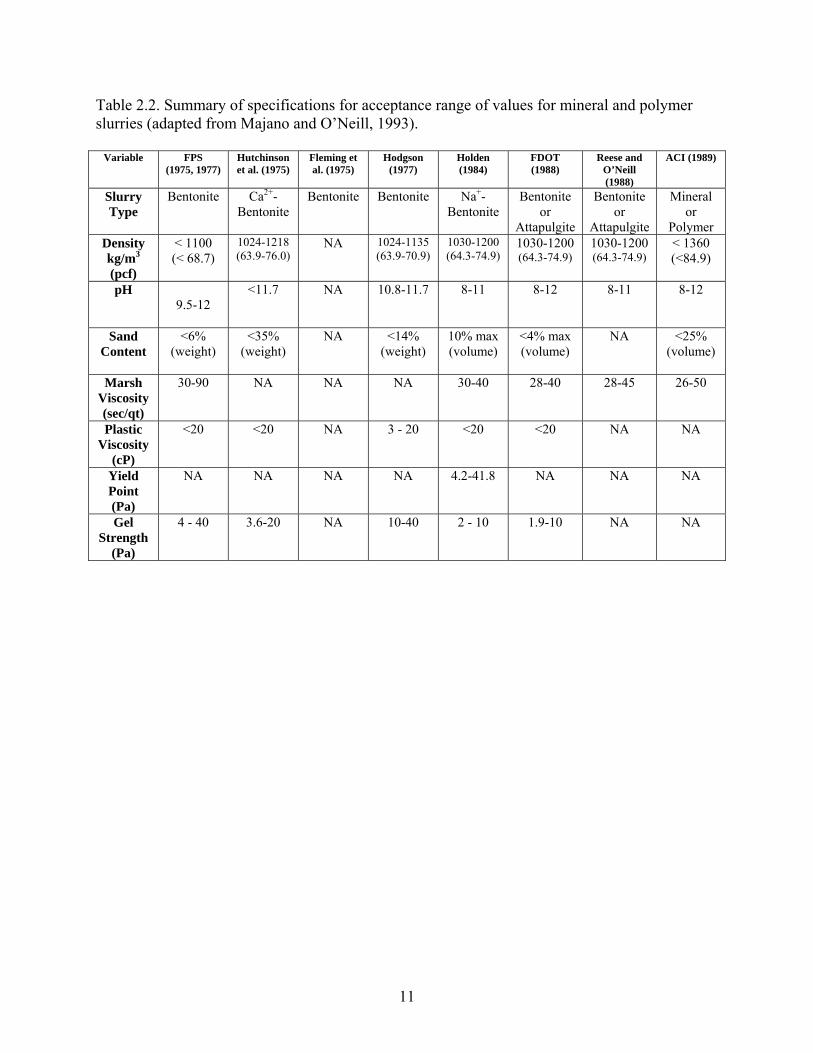
Table 2.2. Summary of specifications for acceptance range of values for mineral and polymer slurries (adapted from Majano and O’Neill, 1993).
Variable FPS (1975, 1977)
Hutchinson et al. (1975)
Fleming et al. (1975)
Hodgson (1977)
Holden (1984)
FDOT (1988)
Reese and O’Neill (1988)
ACI (1989)
Slurry Type
Bentonite Ca2+-Bentonite
Bentonite Bentonite Na+-Bentonite
Bentonite or
Attapulgite
Bentonite or
Attapulgite
Mineral or
Polymer Density kg/m3
(pcf)
< 1100 (< 68.7)
1024-1218 (63.9-76.0)
NA 1024-1135 (63.9-70.9)
1030-1200 (64.3-74.9)
1030-1200 (64.3-74.9)
1030-1200 (64.3-74.9)
< 1360 (<84.9)
pH
9.5-12
<11.7 NA 10.8-11.7 8-11 8-12 8-11 8-12
Sand Content
<6% (weight)
<35% (weight)
NA <14% (weight)
10% max (volume)
<4% max (volume)
NA <25% (volume)
Marsh Viscosity (sec/qt)
30-90 NA NA NA 30-40 28-40 28-45 26-50
Plastic Viscosity
(cP)
<20 <20 NA 3 - 20 <20 <20 NA NA
Yield Point (Pa)
NA NA NA NA 4.2-41.8 NA NA NA
Gel Strength
(Pa)
4 - 40 3.6-20 NA 10-40 2 - 10 1.9-10 NA NA
11
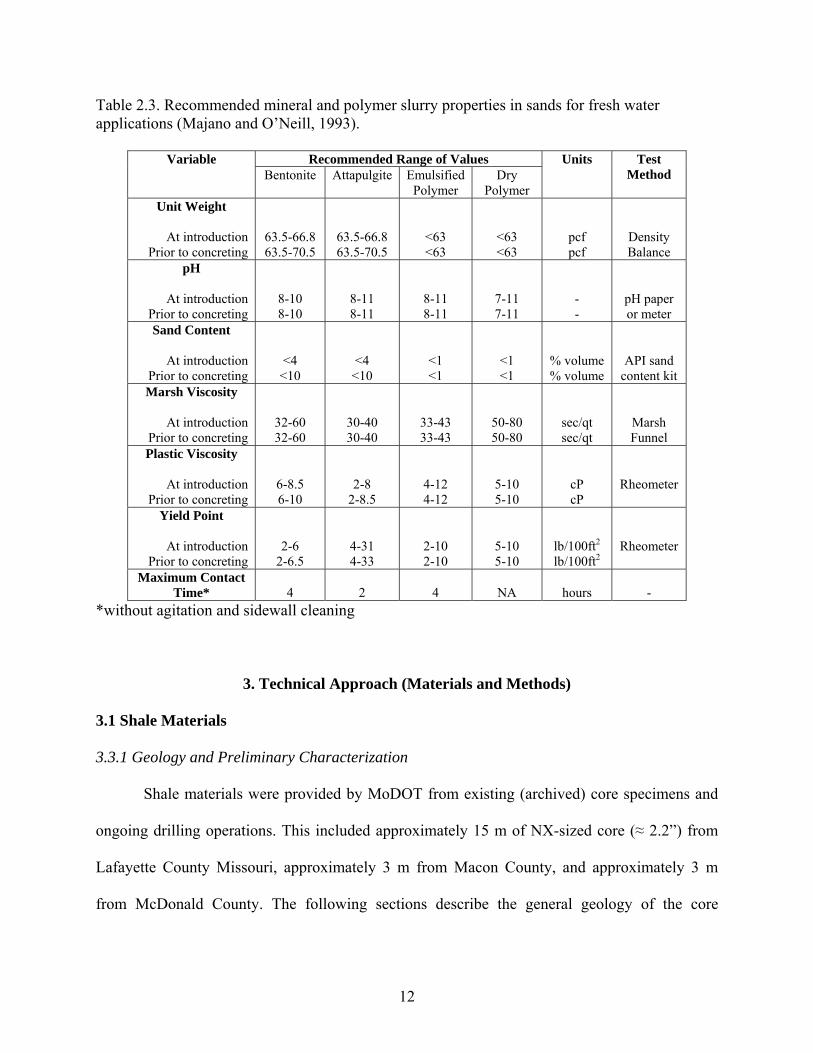
Table 2.3. Recommended mineral and polymer slurry properties in sands for fresh water applications (Majano and O’Neill, 1993).
Recommended Range of Values Variable Bentonite Attapulgite Emulsified
Polymer Dry
Polymer
Units Test Method
Unit Weight
At introduction Prior to concreting
63.5-66.8 63.5-70.5
63.5-66.8 63.5-70.5
<63 <63
<63 <63
pcf pcf
Density Balance
pH
At introduction Prior to concreting
8-10 8-10
8-11 8-11
8-11 8-11
7-11 7-11
- -
pH paper or meter
Sand Content
At introduction Prior to concreting
<4 <10
<4 <10
<1 <1
<1 <1
% volume % volume
API sand content kit
Marsh Viscosity
At introduction Prior to concreting
32-60 32-60
30-40 30-40
33-43 33-43
50-80 50-80
sec/qt sec/qt
Marsh Funnel
Plastic Viscosity
At introduction Prior to concreting
6-8.5 6-10
2-8 2-8.5
4-12 4-12
5-10 5-10
cP cP
Rheometer
Yield Point
At introduction Prior to concreting
2-6 2-6.5
4-31 4-33
2-10 2-10
5-10 5-10
lb/100ft2
lb/100ft2
Rheometer
Maximum Contact Time*
4
2
4
NA
hours
-
*without agitation and sidewall cleaning
3. Technical Approach (Materials and Methods)
3.1 Shale Materials
3.3.1 Geology and Preliminary Characterization
Shale materials were provided by MoDOT from existing (archived) core specimens and
ongoing drilling operations. This included approximately 15 m of NX-sized core (≈ 2.2”) from
Lafayette County Missouri, approximately 3 m from Macon County, and approximately 3 m
from McDonald County. The following sections describe the general geology of the core
12
sequences and summarize the results of X-ray diffraction, Atterberg limits, and compressive
strength tests that were conducted on select specimens from the cores.
Lafayette County Core
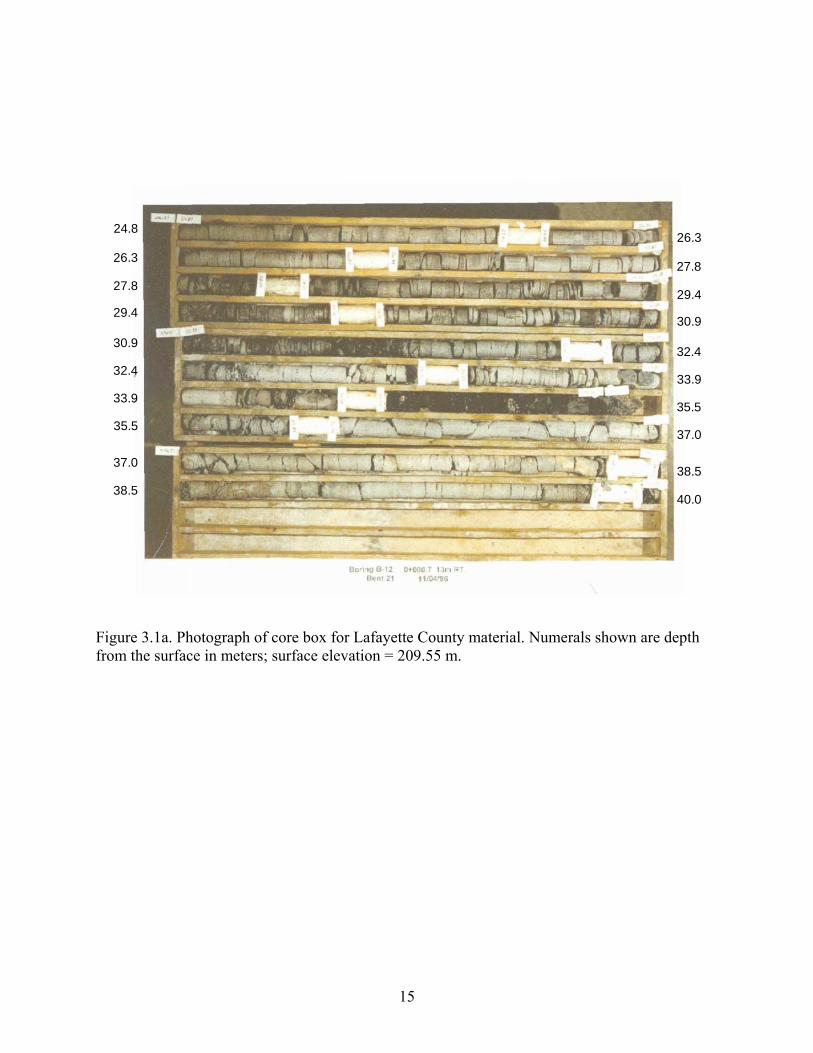
Figures 3.1a and 3.1b show a photograph and boring log, respectively, for the Lafayette
County material. The core has been identified as Pennsylvanian Age, Demoinesian Series, and is
assigned to the Cherokee Group, Cabaniss Subgroup. Figure 3.2 shows a generalized geologic
profile for this series. The Cabaniss subgroup consists of sandstone, siltstone, underclay,
limestone and coal beds. The core shown in Figure 3.1a encounters (from the base upward ) the
Croweburg Formation (40.0m – 35.1m), the Verdigris Formation (35.1m – 31.4m), and the
Bevier Formation (31.4m – 24.8m).
Miller (2003) previously reported results of jar slake, unconfined compressive strength,
and Atterberg limits tests conducted for specimens retrieved from this core series. Summaries of
the jar slake and compressive strength results are shown in Tables 3.1 and 3.2. Jar slake testing
procedures are described in Section 3.6 of this report. Liquid limits (LL) in the Croweburg
Formation varied from 27 to 46 and plasticity indices (PI) varied from 11 to 23. LL and PI in the
Verdigris Formation varied from 34 to 37 and NP to 16, respectively. LL varied from 39 in the
lower Bevier (Zone C2) to 25 in the upper Bevier (Zone C1) and the PI varied from 16 to 2 in the
C2 and C1 zone, respectively (Miller, 2003).
Subsequent tests described in this report using polymer slurries were focused on materials
representing the Bevier C1 and Bevier C2 portions of the Lafayette County core. Referring to the
right-hand-side of Figure 3.1a, the Bevier C1 portion extends from a depth of 24.8m to
approximately 27.9m. The Bevier C2 portion extends from approximately 27.9m to 31.3m. The
13

Bevier sections were selected for in depth testing for two primary reasons: 1) they appeared to be
the most homogeneous sections in the core box, and 2) a sufficient amount of core was available
for directly comparing the results of multiple and redundant tests. Both these requirements were
necessary to ensure that measured indicators of slurry performance for various polymer types
and slurry concentrations (e.g., slake durability, jar slake, swelling inhibition, etc.) could be
directly compared for “identical” shale specimens.
Table 3.1. Results of jar slake tests for Lafayette County specimens (from Miller, 2003).
Formation Zone Elevation (m) Jar Slake Index* Bevier C1 183.95 6 Bevier C1 181.15 6 Bevier C2 180.45 5 Bevier C2 178.57 5
Verdigris D 177.77 1 Verdigris D 176.75 1 Verdigris D 175.27 2
Croweburg D 172.75 2 *See Section 3.6: (1) Degrades to pile of flakes or mud; (2) Breaks rapidly and/or forms many chips; (3) Breaks slowly and/or forms few chips; (4) Breaks rapidly and/or develops several fractures; (5) Breaks slowly and/or forms few fractures; (6) No change Table 3.2. Results of strength tests for Lafayette County specimens (from Miller, 2003).
Average qu Range Std. Dev. Formation Zone Elevation (m) kPa tsf kPa kPa
Bevier C1 180.4-187 3811 39.8 1020-8105 2210 Bevier C2 176.4-180.4 3001 31.3 311-7130 2565
Verdigris D 173.5-176.4 1212 12.7 218-4482 1244 Croweburg E 169-173.5 1716 17.9 253-5590 1552
14
24.8
26.3
27.8
29.4
30.9
32.4
33.9
35.5
37.0
38.5
26.3
27.8
29.4
30.9
32.4
33.9
35.5
37.0
38.5
40.0
Figure 3.1a. Photograph of core box for Lafayette County material. Numerals shown are depth from the surface in meters; surface elevation = 209.55 m.
15

Figure 3.1b. Boring data for core from Lafayette County. Materials used for the tests described in this report represent the Bevier, Verdigris, Croweburg Formations.
Croweburg
Verdigris
Wheeler Coal
Bevier C2
Bevier C1
16

Figure 3.2. Pennsylvanian System, Desmoinesian Series (Cherokee group, Cabaniss subgroup) (from Unklesbay and Vineyard, 1992).
Macon County Core
Figure 3.3 shows a photograph of the material cored from Macon County. Two runs of
core are shown, one extending from depth of 36.0’ to 41.0’ (surface elevation = 814.5’) and
another from a separate hole extending from depth of 69.0’ to 74.0’ (surface elevation = 821.0’).
Material from the first run (36.0’ - 41.0’) has been identified as gray, thinly laminated silt shale
(soft) from the Lagonda Formation of the Pennsylvanian System (see Figure 3.2). Material from
the second run (69.0’ – 74.0’) has been identified as gray, thinly laminated clay shale (very soft)
from the Verdigris Formation. Scanned copies of the original boring logs for each run (Hole H-
17

03-48 and H-03-49) are included in the appendix of this report. The LL and PI of representative
specimens from the Lagonda core were found to be 34 and 24, respectively. LL and PI of the
Verdigris core were 34 and 12, respectively. Atterberg limits were determined following ASTM
Standard D4318 using material pulverized using a mortar and pestle to pass a #40 sieve.
Specimens were cured for 24 hours prior to limits testing.
38.5’36.0’
41.0’ 38.5’
71.5’69.0’ 74.0’71.5’ Figure 3.3. Photograph of core box for Macon County material. Numerals shown are depth from surface in feet.
McDonald County Core
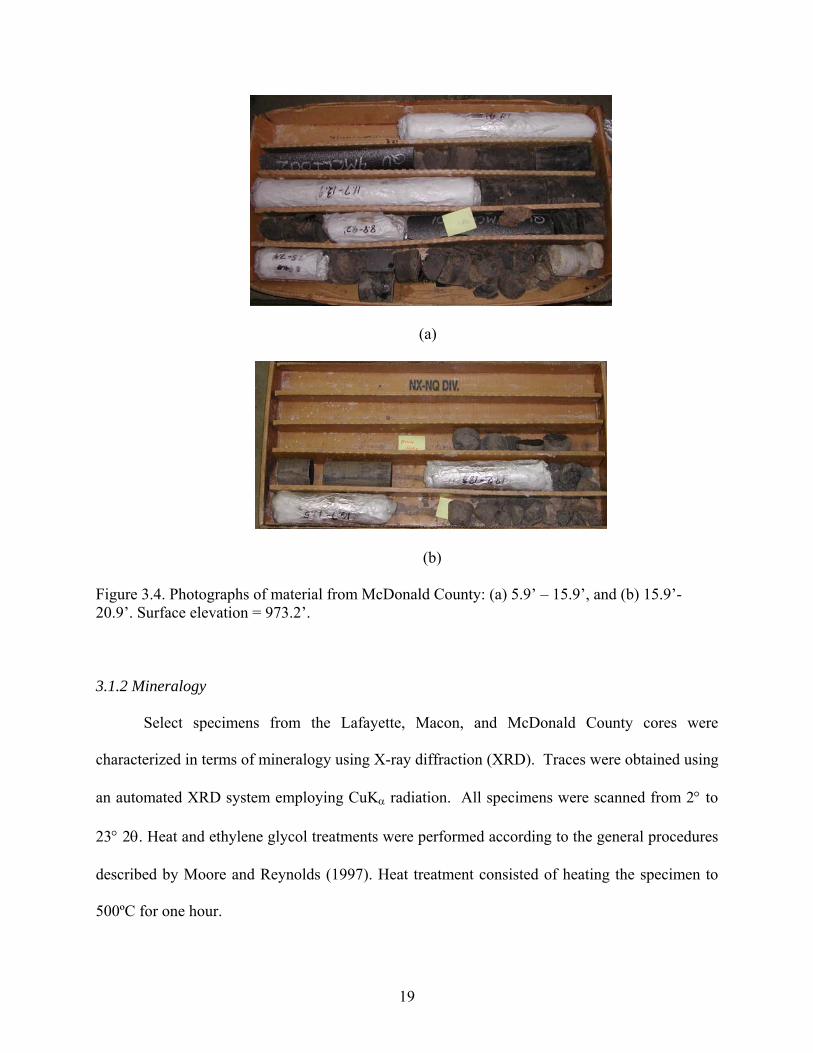
Figures 3.4a and 3.4b show photographs of the McDonald County material. Shale from
this sequence is described as dark gray to black shale, soft to medium hard, thickly laminated.
The material has been identified as Devonian, Chattanooga Formation. A scanned copy of the
original boring log for the material is included in the appendix of this report. The LL and PI of
representative specimens from the core were found to be 28.6 and NP, respectively.
18
(a)
(b) Figure 3.4. Photographs of material from McDonald County: (a) 5.9’ – 15.9’, and (b) 15.9’-20.9’. Surface elevation = 973.2’.
3.1.2 Mineralogy
Select specimens from the Lafayette, Macon, and McDonald County cores were
characterized in terms of mineralogy using X-ray diffraction (XRD). Traces were obtained using
an automated XRD system employing CuKα radiation. All specimens were scanned from 2° to
23° 2θ. Heat and ethylene glycol treatments were performed according to the general procedures
described by Moore and Reynolds (1997). Heat treatment consisted of heating the specimen to
500ºC for one hour.
19

The primary objective of the XRD testing series was to qualitatively identify the clay
mineral fraction of the shale materials and to specifically confirm or rule out the presence of any
expansive clay minerals (e.g., smectite). The complete series of XRD scans is shown as Figures
3.5 through 3.8. Figure 3.5, for example, shows XRD scans for the Bevier C1 portion of the
Lafayette County core for air dried (Fig. 3.5a), glycolated (Fig. 3.5b), and heated specimens (Fig
3.5c.). The strong peaks shown for the air-dried and glycolated specimens at d-spacings of 9.6Å,
7.0Å, 4.9Å, 4.7Å, and 4.4Å suggest the possible presence of kaolinite, illlite, and chlorite in the
clay fraction. The peak at 13.5Å suggests the possible presence of smectite but, because the peak
does not shift to an expanded state after glycolation (Fig. 3.5b), smectite is unlikely to be present.
The destruction of the 6.8Å peak after heat treatment (Fig 3.5c) confirms the presence of
kaolinite and effectively rules out the presence of chlorite.
It was found that the mineralogy of the clay fraction for each specimen selected for
analysis from the Lafayette, Macon, and McDonald County cores was nearly identical,
consisting predominantly of kaolinite and illite. Smectite was not confirmed in any of the
specimens. Table 3.3 summarizes results for the complete suite of XRD tests.
Table 3.3. Qualitative mineralogy for select shale specimens.
Test No. Core (County) Depth of Specimen Analyzed
Formation Qualitative XRD
1 Lafayette 26.84 m Bevier C1 kaolinite, illite 2 Lafayette 29.88 m Bevier C2 kaolinite, illite 3 Macon 41.0’ Lagonda kaolinite, illite 4 McDonald 6.5’ Chattanooga kaolinite, illite
20
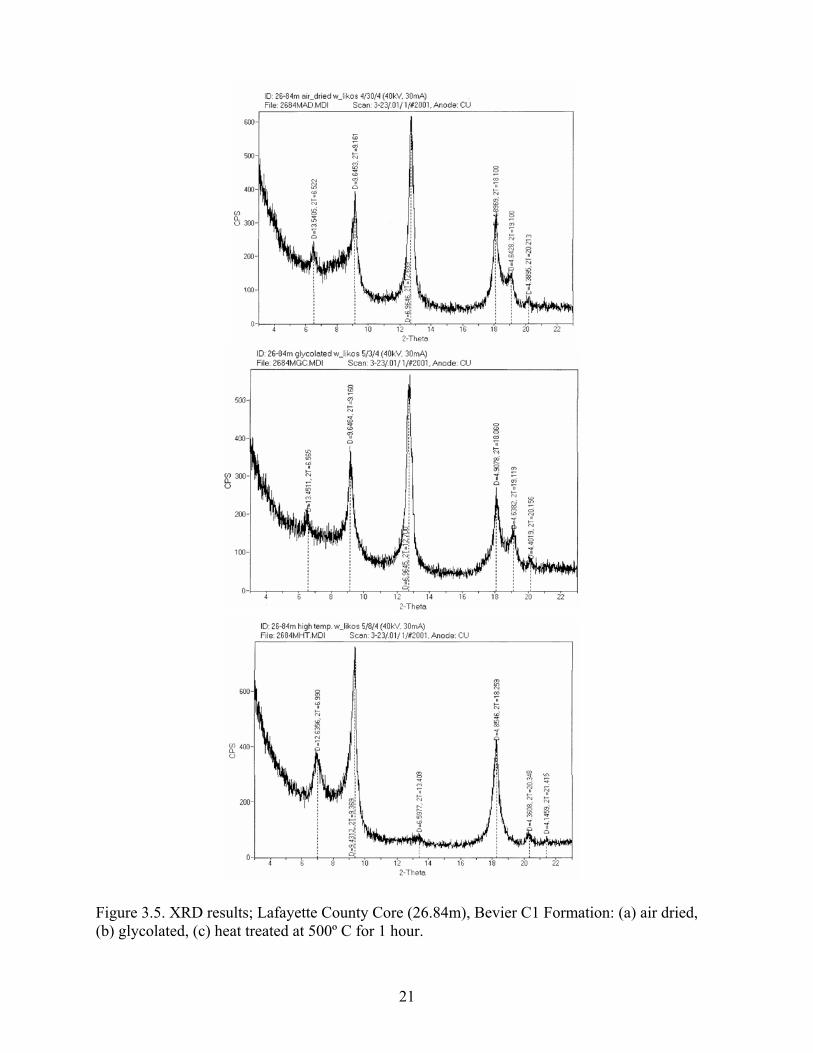
Figure 3.5. XRD results; Lafayette County Core (26.84m), Bevier C1 Formation: (a) air dried, (b) glycolated, (c) heat treated at 500º C for 1 hour.
21
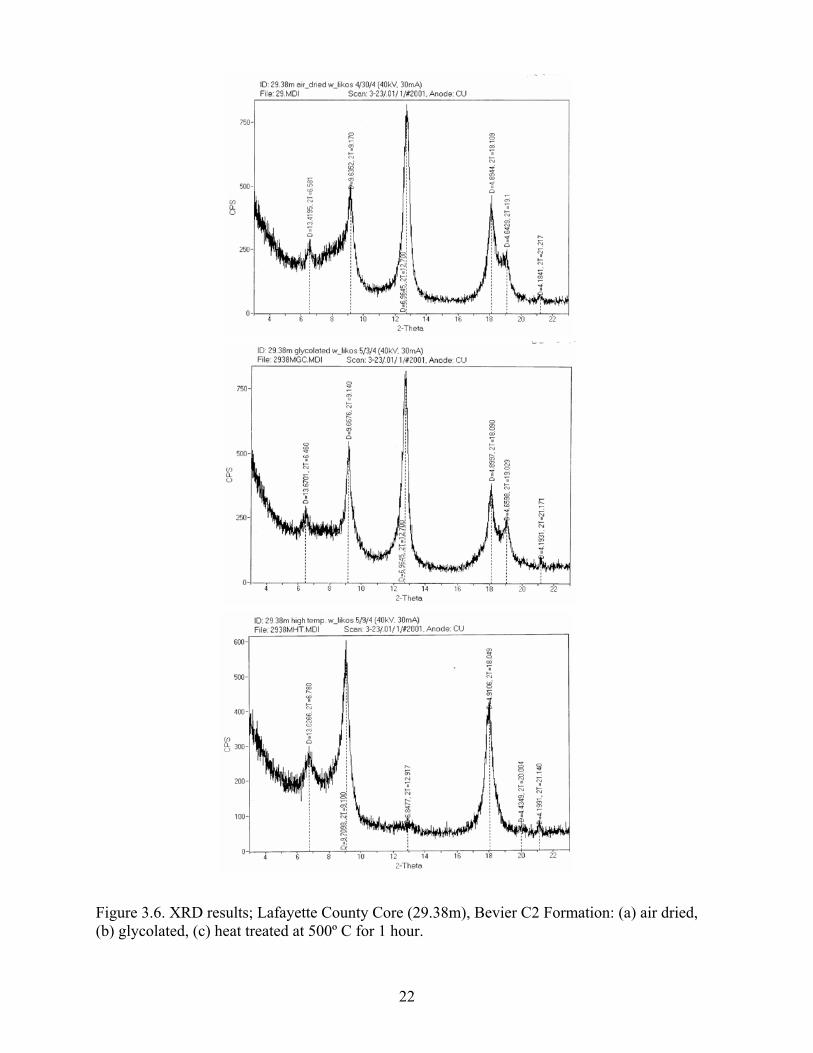
Figure 3.6. XRD results; Lafayette County Core (29.38m), Bevier C2 Formation: (a) air dried, (b) glycolated, (c) heat treated at 500º C for 1 hour.
22
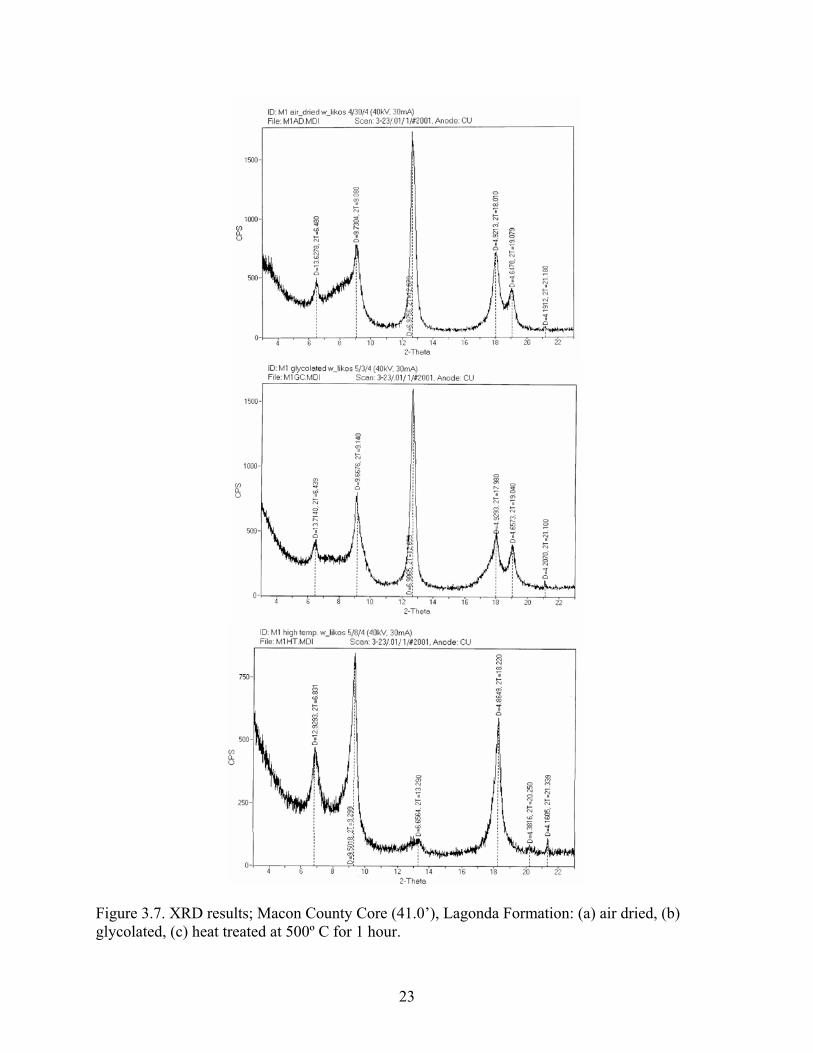
Figure 3.7. XRD results; Macon County Core (41.0’), Lagonda Formation: (a) air dried, (b) glycolated, (c) heat treated at 500º C for 1 hour.
23

Figure 3.8. XRD results; McDonald County Core (6.5’), Chattanooga Formation: (a) air dried, (b) glycolated, (c) heat treated at 500º C for 1 hour.
24
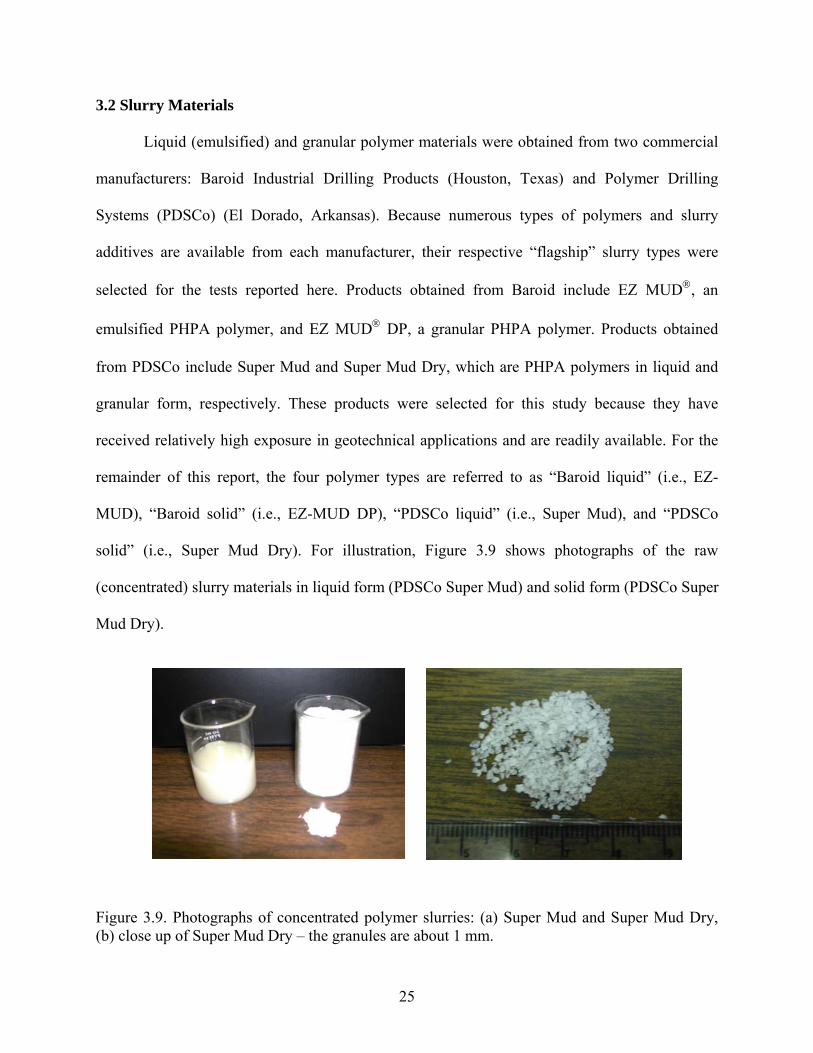
3.2 Slurry Materials
Liquid (emulsified) and granular polymer materials were obtained from two commercial
manufacturers: Baroid Industrial Drilling Products (Houston, Texas) and Polymer Drilling
Systems (PDSCo) (El Dorado, Arkansas). Because numerous types of polymers and slurry
additives are available from each manufacturer, their respective “flagship” slurry types were
selected for the tests reported here. Products obtained from Baroid include EZ MUD®, an
emulsified PHPA polymer, and EZ MUD® DP, a granular PHPA polymer. Products obtained
from PDSCo include Super Mud and Super Mud Dry, which are PHPA polymers in liquid and
granular form, respectively. These products were selected for this study because they have
received relatively high exposure in geotechnical applications and are readily available. For the
remainder of this report, the four polymer types are referred to as “Baroid liquid” (i.e., EZ-
MUD), “Baroid solid” (i.e., EZ-MUD DP), “PDSCo liquid” (i.e., Super Mud), and “PDSCo
solid” (i.e., Super Mud Dry). For illustration, Figure 3.9 shows photographs of the raw
(concentrated) slurry materials in liquid form (PDSCo Super Mud) and solid form (PDSCo Super
Mud Dry).
Figure 3.9. Photographs of concentrated polymer slurries: (a) Super Mud and Super Mud Dry, (b) close up of Super Mud Dry – the granules are about 1 mm.
25
3.3 Slurry Preparation
Slurries were prepared by mixing the various polymer types with tap water in batches
with a volume ranging from three to five liters. Tap water was selected for the slurry make up
water because it was considered most representative of the potable water specified for typical
field drilling operations. Prior to commencing the testing program, a 50-gallon supply of tap
water was set up in the laboratory to provide a consistent source of make up water for all of the
subsequent slurry preparations and shale-fluid interaction tests (e.g., slake durability, jar slake,
swell). The pH of the reserved tap water was periodically measured with an electrode-based
digital meter. The average pH was 8.48 and did not vary by more than 0.1 units over the 12-
month testing period. Because this value falls within the manufacturer’s recommended range for
slurry make up water (pH = 8 - 10), buffering solution was not added to the tap water to adjust its
pH prior to slurry preparation.
Agitation was provided by stirring the slurry suspensions for 5 minutes with a large metal
spoon. This procedure was selected to minimize excessive shear forces, which have been
speculated to negatively affect polymer-based slurries by breaking down the expanded polymer
chains (e.g., Bacon et al., 2000). Five minutes appeared to be a sufficient amount of mixing time
to fully disperse and dissolve each slurry type (i.e., liquid and granular). A similar observation
was noted by Kheng et al. (1991) for a series of tests conducted using the PDSCo liquid polymer.
Slurries were prepared to a wide range of concentrations in order to examine the impact
of polymer concentration (polymer to water mixing ratio) on measured slurry viscosity and
slurry performance. Mixing ratios for the granular polymers (i.e., Baroid solid and PDSCo solid)
are expressed in units of grams of dry polymer to liters of make up water (g/l). Mixing ratios for
the emulsified polymers (i.e., Baroid liquid and PDSCo liquid) are expressed as a direct
26

volumetric ratio of water to polymer (e.g., 800:1). Here, and throughout the remainder of the
report, slurry concentrations are reported in terms of the percentage of the manufacturer’s
recommended water-to-polymer mixing ratio for freshwater applications in clay shale (% mfg).
These values for each polymer type are summarized in Table 3.4. Table 3.5 summarizes the
range of mixing ratios prepared for the tests described in this report.
Table 3.4. Recommended mixing ratios for freshwater applications in clay shale.
Polymer Type Mfg. Recommended Mixing Ratio
PDSCo Solid 0.409 g/l Baroid Solid 0.950 g/l
PDSCo Liquid 800:1 by volume Baroid Liquid 400:1 by volume
Table 3.5. Mixing ratios for range of slurry concentrations prepared.
Concentration (% Mfg.)
PDSCo Solid (mixing ratio)+
PDSCo Liquid (mixing ratio)*
Baroid Solid (mixing ratio)+
Baroid Liquid (mixing ratio)*
25 0.102 g/l 3200:1 0.238 g/l 1600:1 50 0.205 g/l 1600:1 0.475 g/l 800:1 75 0.307 g/l 1067:1 0.713 g/l 534:1 100 0.409 g/l 800:1 0.950 g/l 400:1 125 0.511 g/l 640:1 1.188 g/l 320:1 150 0.614 g/l 533:1 1.425 g/l 267:1
+ grams of dry polymer per liter of tap water * volumetric water-to-polymer mixing ratio
As shown on Table 3.5, the prepared slurry concentrations ranged from 25 % Mfg. to 150
% Mfg. in increments of 25 %. Slurries prepared at concentrations less than 100% are considered
“under-concentrated.” Slurries prepared at concentrations greater than 100% are considered
“over-concentrated.” Slurries prepared to 100 % Mfg. were mixed to the manufacturer
recommended values. Normalizing the reported concentrations with respect to the
27
manufacturer’s recommended values allows the effects of under- or over-concentration for the
various slurry types to be directly compared.
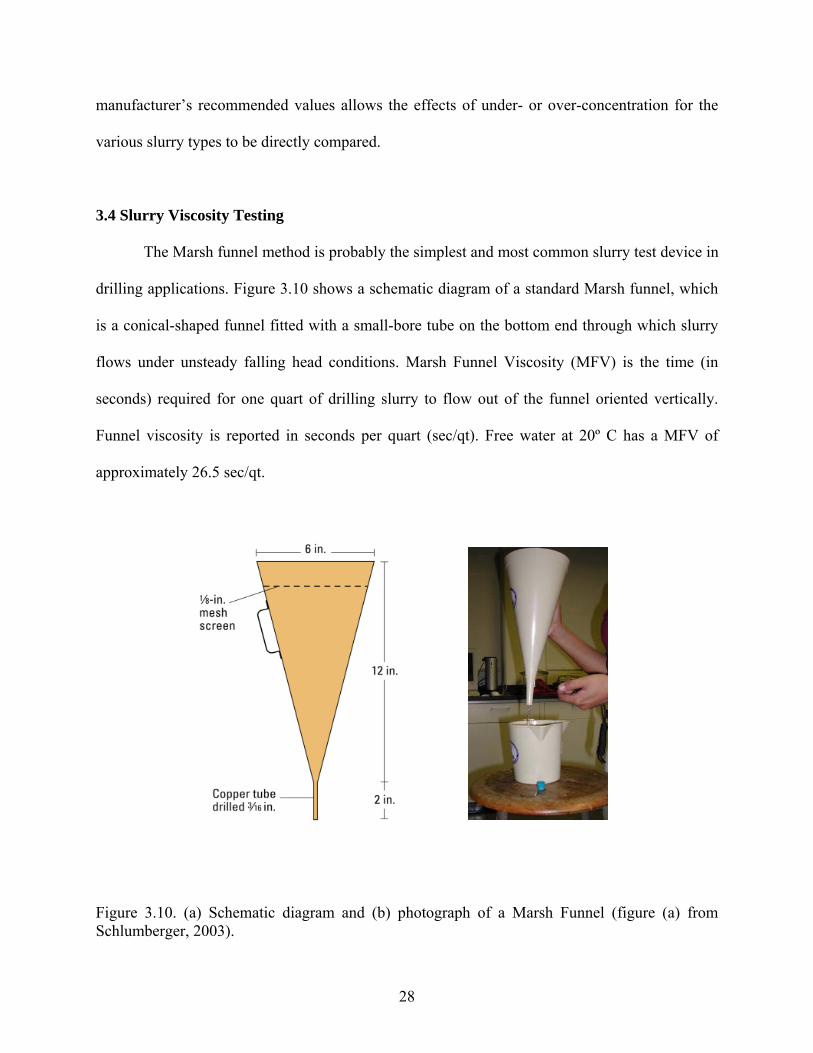
3.4 Slurry Viscosity Testing
The Marsh funnel method is probably the simplest and most common slurry test device in
drilling applications. Figure 3.10 shows a schematic diagram of a standard Marsh funnel, which
is a conical-shaped funnel fitted with a small-bore tube on the bottom end through which slurry
flows under unsteady falling head conditions. Marsh Funnel Viscosity (MFV) is the time (in
seconds) required for one quart of drilling slurry to flow out of the funnel oriented vertically.
Funnel viscosity is reported in seconds per quart (sec/qt). Free water at 20º C has a MFV of
approximately 26.5 sec/qt.
Figure 3.10. (a) Schematic diagram and (b) photograph of a Marsh Funnel (figure (a) from Schlumberger, 2003).
28

A series of tests was conducted to evaluate relationships between slurry concentration
and slurry rheological properties measured using a Marsh funnel. An initial series of tests was
conducted for all four slurry types mixed to the range of concentrations shown in Table 3.5.
Marsh funnel viscosities for these tests were measured immediately after slurry preparation. A
subsequent series of tests was conducted to examine the effect of elapsed time since preparation.
Here, slurries were prepared to various concentrations and stored in large glass beakers in the
laboratory for up to 48 hours. Marsh funnel viscosity was measured at select increments of time
since mixing. Prior to each viscosity test, the slurry were stirred in the beaker for 5 minutes.
Results are described in Section 4 of this report.
3.5 Slake Durability Testing
The durability of shale and weak rock materials depends strongly on interaction with
water, or in the case of drilling applications, interaction with the selected drilling fluid. This
interaction is referred to as “slaking” and often results in dissolution of particles, creation of
fractures, flaking of surface layers, and an overall reduction in hardness and strength. Because of
the physical interdependence of slaking and durability, the durability of shale is often measured
with slaking tests, hence the popular “slake durability” test.
Slake durability testing, which has been standardized as ASTM D4644 (ASTM 2000), is
designed to evaluate the slaking characteristics of disturbed shale or rock aggregates by
measuring the percentage of material retained in a #10 (2.0 mm) mesh drum after two 10-minute
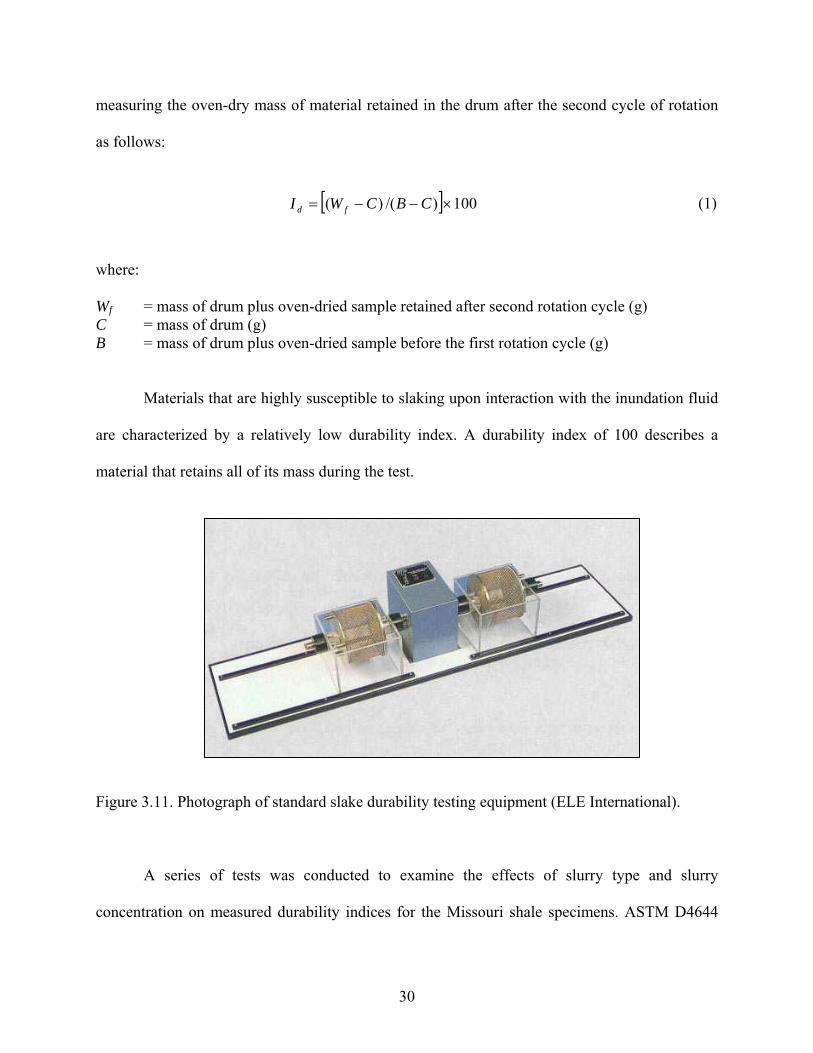
cycles of rotation in a trough of slaking fluid. A photograph of a standard slake durability
apparatus is shown in Figure 3.11. A numerical “slake durability index” Id is calculated by
29
measuring the oven-dry mass of material retained in the drum after the second cycle of rotation
as follows:
[ ] 100)/()( ×−−= CBCWI fd (1)
where: Wf = mass of drum plus oven-dried sample retained after second rotation cycle (g) C = mass of drum (g) B = mass of drum plus oven-dried sample before the first rotation cycle (g)
Materials that are highly susceptible to slaking upon interaction with the inundation fluid
are characterized by a relatively low durability index. A durability index of 100 describes a
material that retains all of its mass during the test.
Figure 3.11. Photograph of standard slake durability testing equipment (ELE International).
A series of tests was conducted to examine the effects of slurry type and slurry
concentration on measured durability indices for the Missouri shale specimens. ASTM D4644
30
(ASTM, 2000) recommends using ten intact and roughly equidimensional shale fragments
weighing 40 to 60 g each. However, a series of preliminary tests following this recommendation
indicated that the repeatability of Id was poor, presumably due to unaccounted for differences in
the degree of fracturing from one shale fragment to another. Because the objective of the tests for
this project is to directly compare durability for “identical” specimens using a variety of test
fluids, modifications to the ASTM recommendation were adopted. It was found that repeatable
measurements could be obtained by reducing the number of shale fragments for each test from
10 small fragments to 3 large fragments weighing a total of 450 to 550 grams. This modification
was adopted for all slake durability results presented herein.
Slake durability tests were conducted using distilled water, tap water, PDSCo solid and
liquid polymer slurries, and Baroid solid and liquid polymer slurries prepared to various
concentrations. Durability indices for the distilled water and tap water tests were treated as
baseline (control) values for comparison with indices measured using the various slurries and
slurry concentrations. Tests using distilled water were conducted as a series of five independent
trials. Tests using tap water were conducted as a series of three independent trials. An initial
series of tests was conducted using all four polymer types prepared to 100% and 50% of the
recommended mixture ratios. A second series of tests focused on the PDSCo solid slurry
prepared to 25%, 50%, 75%, 100%, 125%, and 150% of the recommended ratio. Materials from
all three cores (Lafayette, Macon, and McDonald County) were used for the tests. Results are
described in Section 4 of this report.
31
3.6 Jar Slake Testing
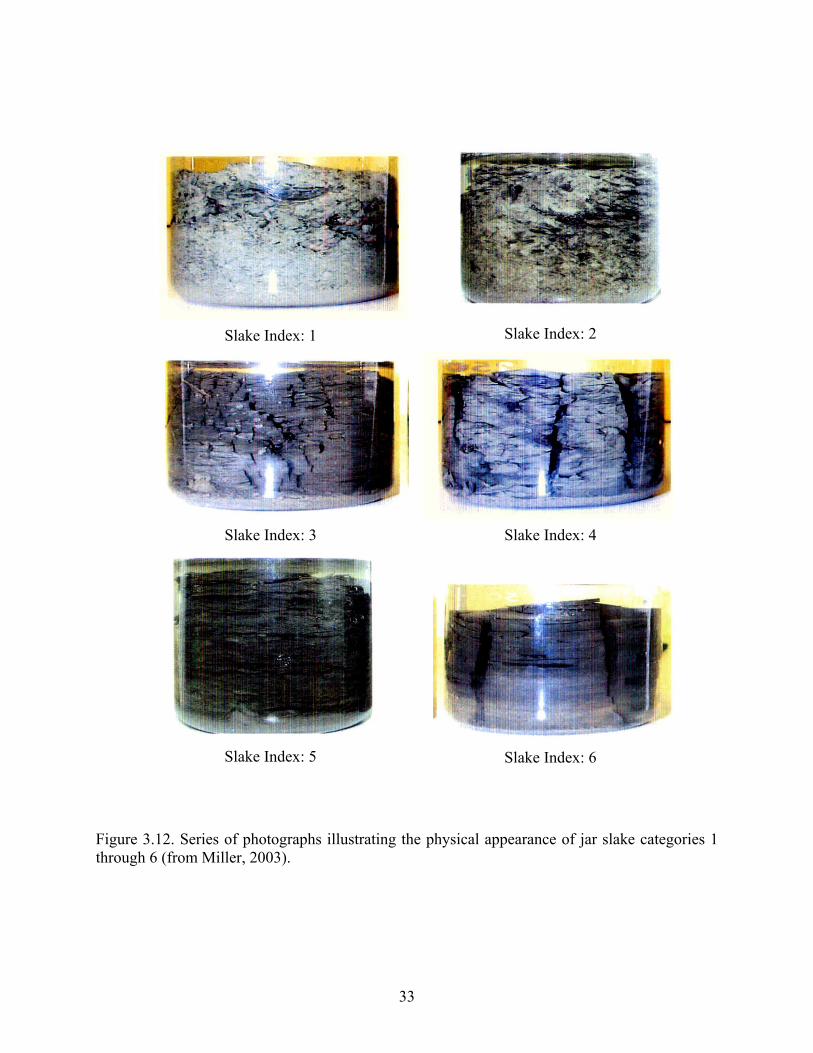
Jar slake testing is a simple, qualitative index test designed to assess the relative
durability of shale upon inundation in select fluids. The test is readily conducted in the field and
requires no specialized or expensive equipment. Wood and Deo (1975), Lutton (1977), and
Walkinshaw and Santi (1996) describe general procedures for conducting the jar slake test. In
summary, a 30 to 50 gram shale specimen is oven dried at 105°C for 16 hours, immersed in
distilled water, and described after 30 minutes and 24 hours. Six qualitative categories (Slake
Indices) are used to describe the durability of the specimen according to its physical appearance
after immersion at either increment: 1) degrades to a pile of flakes or mud; 2) breaks rapidly
and/or forms many chips; 3) breaks slowly and/or forms few chips; 4) breaks rapidly and/or
develops several fractures; 5) breaks slowly and/or forms few fractures; and 6) no change. For
reference, a series of photographs demonstrating the appearance of shale specimens falling into
each of these categories is shown as Figure 3.12. Results for tests conducted using select
specimens from the Lafayette, Macon, and McDonald county cores in distilled water, tap water,
and various slurry concentrations are described in Section 4 of this report.
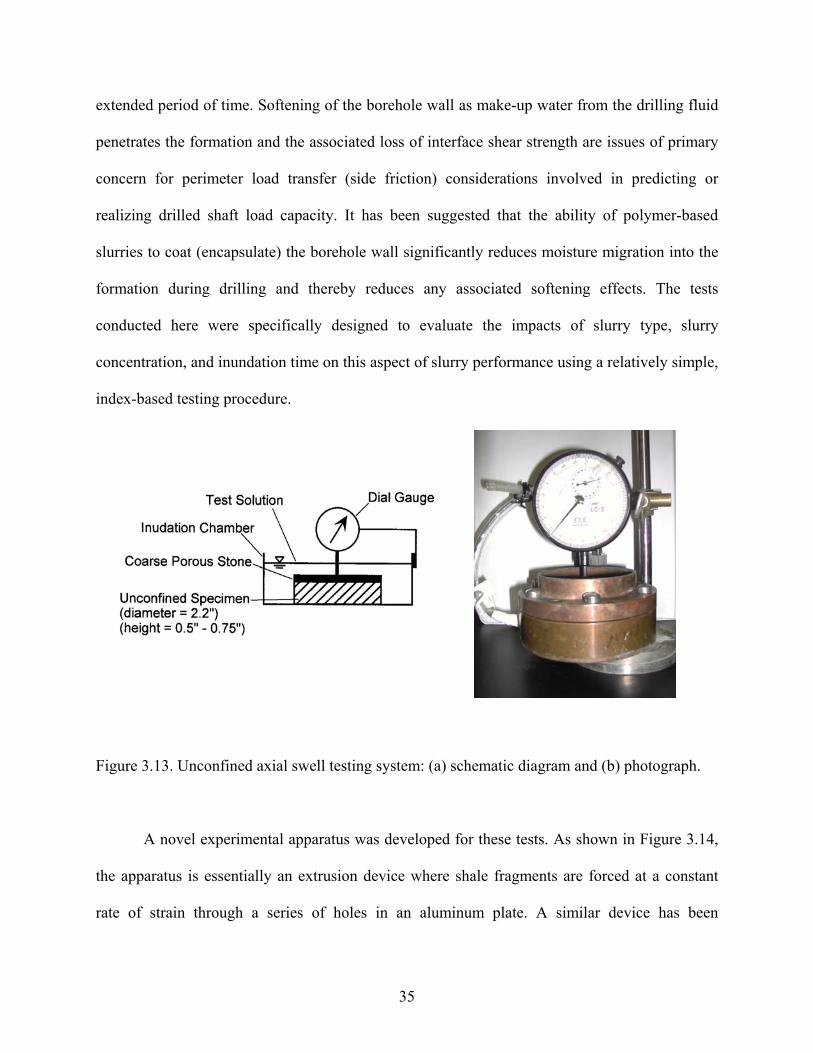
3.7 Unconfined Axial Swell Testing
A series of unconfined axial swell tests was conducted to examine the performance of the
various polymer slurries in terms of their ability to inhibit the swelling of shale specimens upon
complete inundation in select testing fluids. A schematic diagram and photograph of the
apparatus developed for these tests is shown as Figure 3.13. Specific procedures for these tests
were developed at the University of Missouri – Columbia.
32
Slake Index: 4 Slake Index: 3
Slake Index: 2 Slake Index: 1
Slake Index: 5 Slake Index: 6
Figure 3.12. Series of photographs illustrating the physical appearance of jar slake categories 1 through 6 (from Miller, 2003).
33

Tests were conducted by measuring the axial deformation of unconfined cylindrical
specimens as a function of elapsed time after complete inundation in selected testing fluid (e.g.,
water, various slurry concentrations). Specimens were selected from “poker chipped” sections of
the Lafayette, Macon and McDonald County core sequences averaging about 0.5” in height.
Prior to testing, the top and bottom surfaces of the specimens were ground to flat planes using a
belt sander affixed to the laboratory bench. Initial specimen height was determined prior to
testing by taking the average height measured at four locations along the specimen’s perimeter
and at its center. Measurements were made to the nearest 0.001” using Vernier calipers. The
specimens were not trimmed along their diameter (NX core diameter is approximately 2.2”).
Nominal seating load was provided by placing a saturated porous stone on top of the specimen.
Upon inundation in testing fluid, deformations were measured using a manual dial gauge with
0.0001” precision at 5-second increments up to 1 minute, five-minute increments up to 10
minutes, and then as appropriate until swell appeared to cease. Primary swelling typically ceased
within 24 hours (1440 min). Results from the swell tests were reported in terms of axial strain as
a function of time. Numerous tests were conducted to evaluate the effects of polymer type and
polymer concentration on the total amount of axial strain measured at equilibrium. These results
are presented in Section 4.
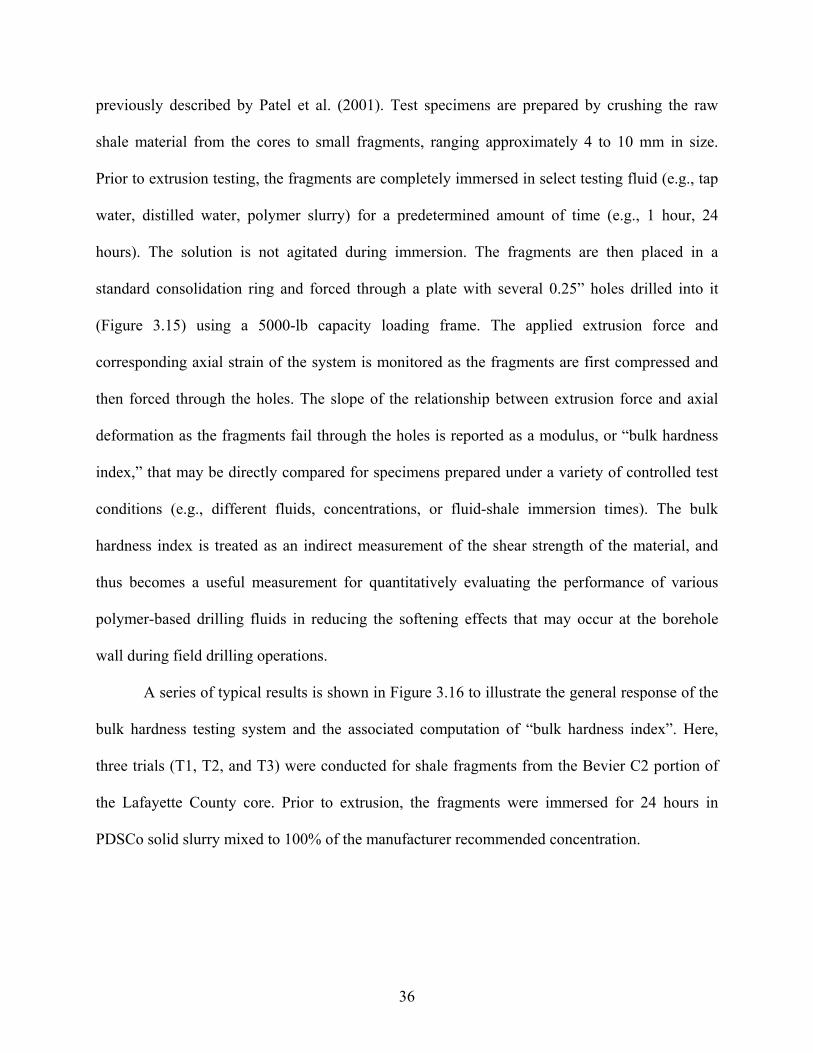
3.8 Bulk Hardness Testing
A “bulk hardness” testing series was conducted to examine the performance of the
various polymer slurries in terms of their ability to reduce softening and strength loss effects
associated with inundation in select testing fluids. These tests were intended to simulate typical
drilled shaft installation conditions where the borehole wall is exposed to drilling fluid for an
34
extended period of time. Softening of the borehole wall as make-up water from the drilling fluid
penetrates the formation and the associated loss of interface shear strength are issues of primary
concern for perimeter load transfer (side friction) considerations involved in predicting or
realizing drilled shaft load capacity. It has been suggested that the ability of polymer-based
slurries to coat (encapsulate) the borehole wall significantly reduces moisture migration into the
formation during drilling and thereby reduces any associated softening effects. The tests
conducted here were specifically designed to evaluate the impacts of slurry type, slurry
concentration, and inundation time on this aspect of slurry performance using a relatively simple,
index-based testing procedure.
Figure 3.13. Unconfined axial swell testing system: (a) schematic diagram and (b) photograph.
A novel experimental apparatus was developed for these tests. As shown in Figure 3.14,
the apparatus is essentially an extrusion device where shale fragments are forced at a constant
rate of strain through a series of holes in an aluminum plate. A similar device has been
35
previously described by Patel et al. (2001). Test specimens are prepared by crushing the raw
shale material from the cores to small fragments, ranging approximately 4 to 10 mm in size.
Prior to extrusion testing, the fragments are completely immersed in select testing fluid (e.g., tap
water, distilled water, polymer slurry) for a predetermined amount of time (e.g., 1 hour, 24
hours). The solution is not agitated during immersion. The fragments are then placed in a
standard consolidation ring and forced through a plate with several 0.25” holes drilled into it
(Figure 3.15) using a 5000-lb capacity loading frame. The applied extrusion force and
corresponding axial strain of the system is monitored as the fragments are first compressed and
then forced through the holes. The slope of the relationship between extrusion force and axial
deformation as the fragments fail through the holes is reported as a modulus, or “bulk hardness
index,” that may be directly compared for specimens prepared under a variety of controlled test
conditions (e.g., different fluids, concentrations, or fluid-shale immersion times). The bulk
hardness index is treated as an indirect measurement of the shear strength of the material, and
thus becomes a useful measurement for quantitatively evaluating the performance of various
polymer-based drilling fluids in reducing the softening effects that may occur at the borehole
wall during field drilling operations.
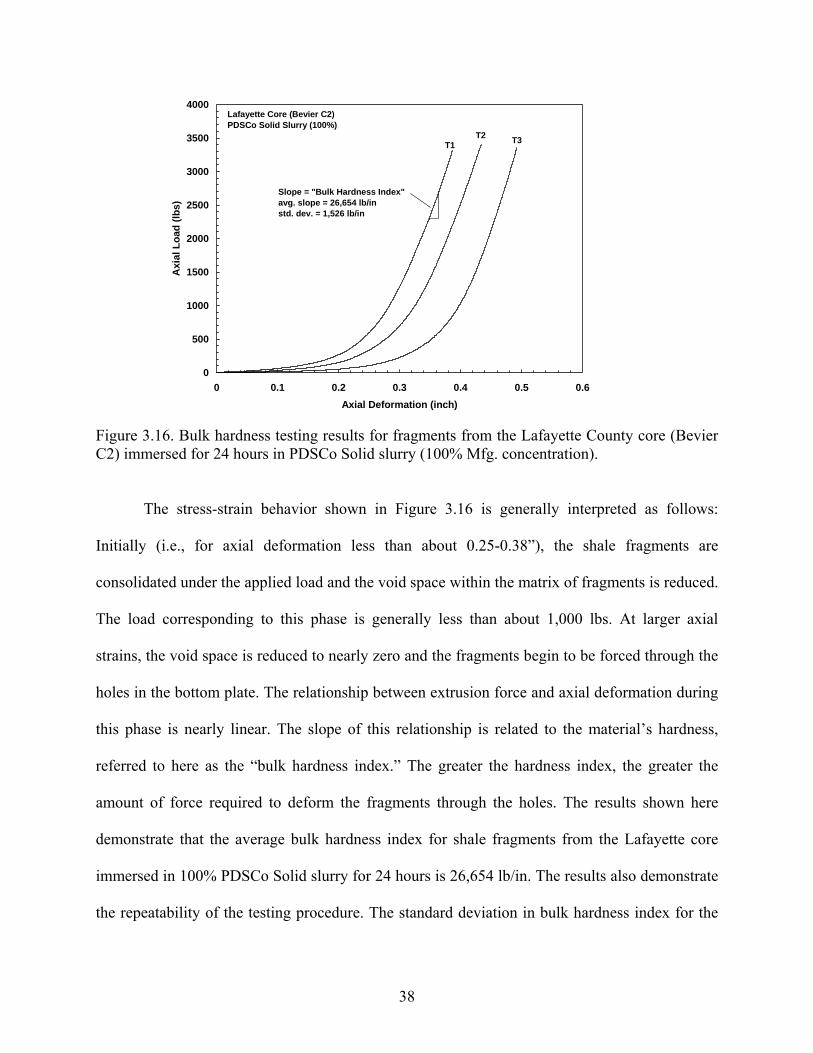
A series of typical results is shown in Figure 3.16 to illustrate the general response of the
bulk hardness testing system and the associated computation of “bulk hardness index”. Here,
three trials (T1, T2, and T3) were conducted for shale fragments from the Bevier C2 portion of
the Lafayette County core. Prior to extrusion, the fragments were immersed for 24 hours in
PDSCo solid slurry mixed to 100% of the manufacturer recommended concentration.
36
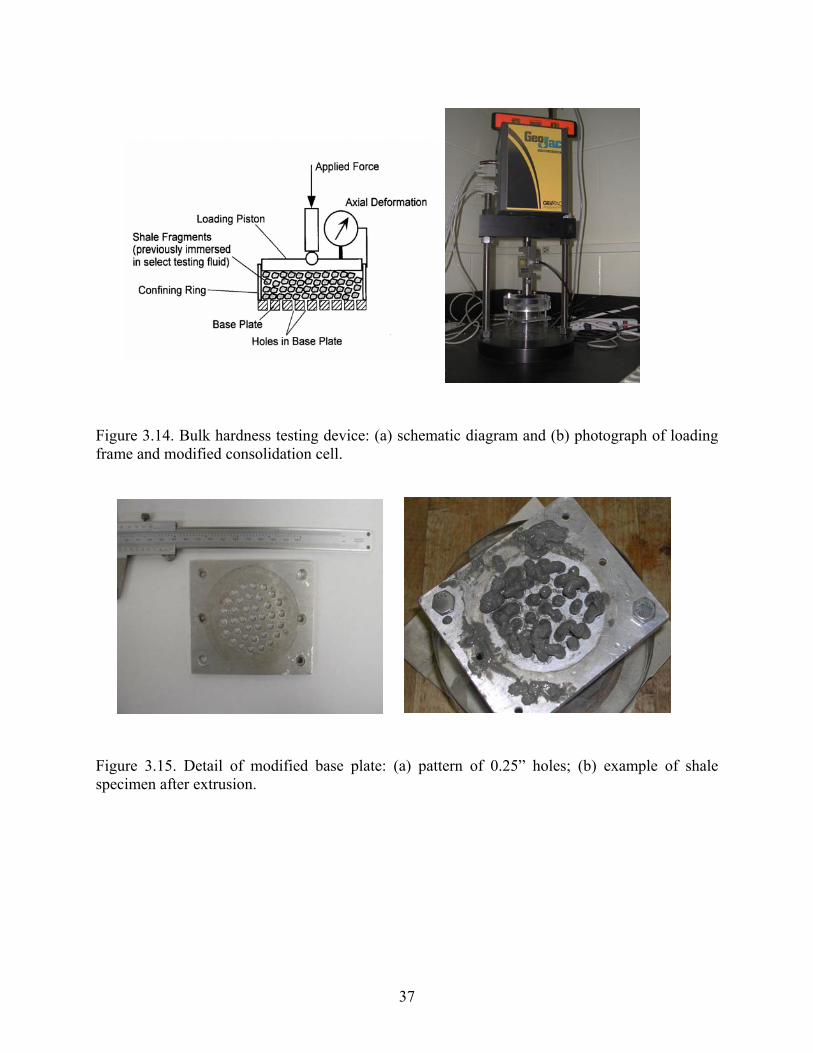
Figure 3.14. Bulk hardness testing device: (a) schematic diagram and (b) photograph of loading frame and modified consolidation cell. Figure 3.15. Detail of modified base plate: (a) pattern of 0.25” holes; (b) example of shale specimen after extrusion.
37
0
500
1000
1500
2000
2500
3000
3500
4000
0 0.1 0.2 0.3 0.4 0.5 0.6Axial Deformation (inch)
Axi
al L
oad
(lbs)
Slope = "Bulk Hardness Index"avg. slope = 26,654 lb/instd. dev. = 1,526 lb/in
T1T2 T3
Lafayette Core (Bevier C2)PDSCo Solid Slurry (100%)
Figure 3.16. Bulk hardness testing results for fragments from the Lafayette County core (Bevier C2) immersed for 24 hours in PDSCo Solid slurry (100% Mfg. concentration).
The stress-strain behavior shown in Figure 3.16 is generally interpreted as follows:
Initially (i.e., for axial deformation less than about 0.25-0.38”), the shale fragments are
consolidated under the applied load and the void space within the matrix of fragments is reduced.
The load corresponding to this phase is generally less than about 1,000 lbs. At larger axial
strains, the void space is reduced to nearly zero and the fragments begin to be forced through the
holes in the bottom plate. The relationship between extrusion force and axial deformation during
this phase is nearly linear. The slope of this relationship is related to the material’s hardness,
referred to here as the “bulk hardness index.” The greater the hardness index, the greater the
amount of force required to deform the fragments through the holes. The results shown here
demonstrate that the average bulk hardness index for shale fragments from the Lafayette core
immersed in 100% PDSCo Solid slurry for 24 hours is 26,654 lb/in. The results also demonstrate
the repeatability of the testing procedure. The standard deviation in bulk hardness index for the
38

three trials is 1,526 lb/in. Preliminary tests also showed that bulk hardness index is relatively
insensitive to shale-fluid immersion time (hardness indices for specimens immersed in slurry for
one hour were generally shown to be about 7% greater than for specimens immersed for 24
hours). For all subsequent tests, therefore, an immersion time of 24 hours was maintained for
consistency.
4. Results and Discussion
4.1 Slurry Viscosity
4.1.1 Viscosity as a Function of Concentration
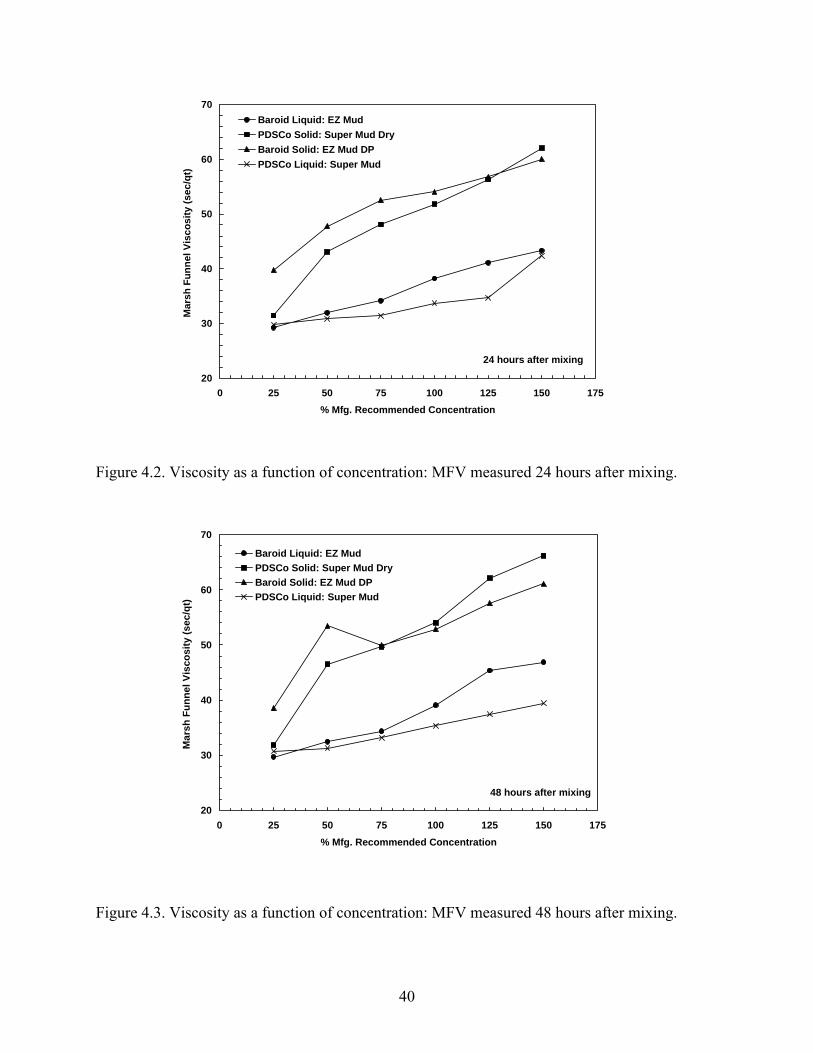
Figures 4.1 through 4.3 show Marsh funnel viscosity (MFV) for the four polymer types
as a function of concentration. Concentration is expressed in terms of the percentage of the
manufacturer recommended mixture ratio per Table 3.5. MFV in Figure 4.1 was measured
immediately after preparation of the slurry. MFV values in Figures 4.2 and 4.3 were determined
at 24 hours and 48 hours after mixing, respectively. The data points on all three figures represent
the average of at least six measurements.
20
22
24
26
28
30
32
34
36
38
40
0 25 50 75 100 125 150 175% Mfg. Recommended Concentration
Mar
sh F
unne
l Vis
cosi
ty (s
ec/q
t)
Baroid Liquid: EZ MudPDSCo Solid: Super Mud DryBaroid Solid: EZ Mud DPPDSCo Liquid: Super Mud
immediately after mixing
Figure 4.1. Viscosity as a function of concentration: MFV measured immediately after mixing.
39
20
30
40
50
60
70
0 25 50 75 100 125 150 175% Mfg. Recommended Concentration
Mar
sh F
unne
l Vis
cosi
ty (s
ec/q
t)
Baroid Liquid: EZ MudPDSCo Solid: Super Mud DryBaroid Solid: EZ Mud DPPDSCo Liquid: Super Mud
24 hours after mixing
Figure 4.2. Viscosity as a function of concentration: MFV measured 24 hours after mixing.
20
30
40
50
60
70
0 25 50 75 100 125 150 175% Mfg. Recommended Concentration
Mar
sh F
unne
l Vis
cosi
ty (s
ec/q
t)
Baroid Liquid: EZ MudPDSCo Solid: Super Mud DryBaroid Solid: EZ Mud DPPDSCo Liquid: Super Mud
48 hours after mixing
Figure 4.3. Viscosity as a function of concentration: MFV measured 48 hours after mixing.
40
4.1.2 Viscosity as a Function of Time
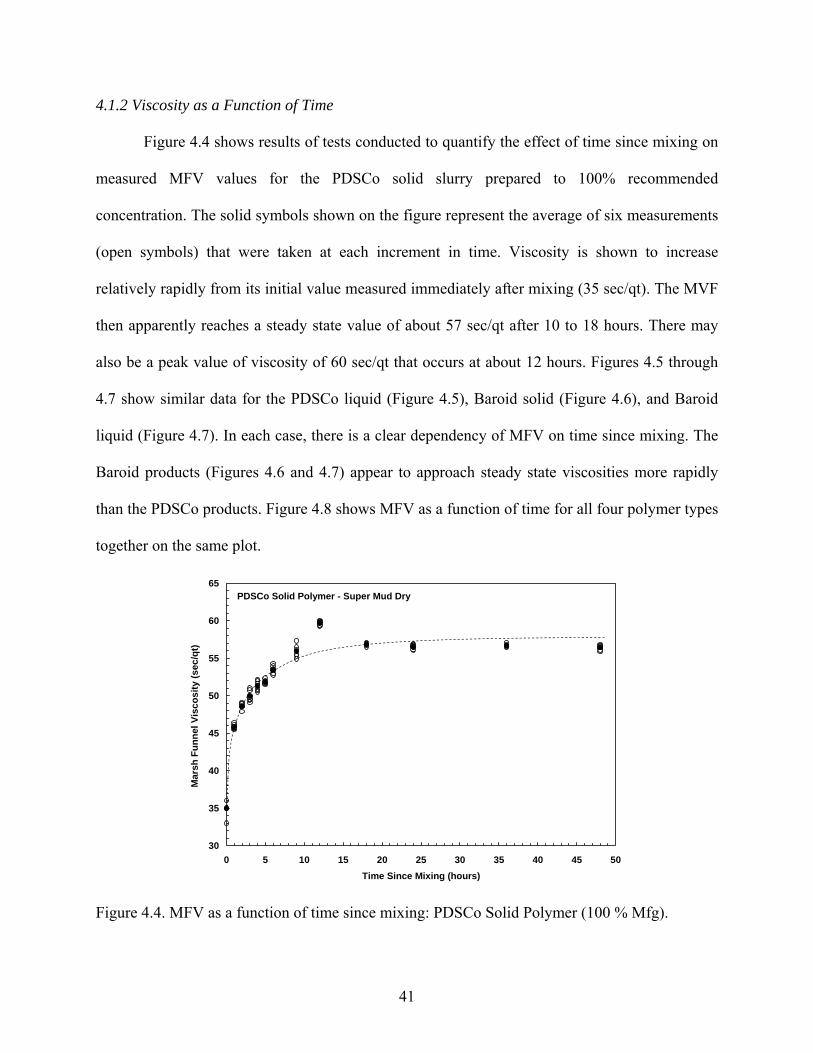
Figure 4.4 shows results of tests conducted to quantify the effect of time since mixing on
measured MFV values for the PDSCo solid slurry prepared to 100% recommended
concentration. The solid symbols shown on the figure represent the average of six measurements
(open symbols) that were taken at each increment in time. Viscosity is shown to increase
relatively rapidly from its initial value measured immediately after mixing (35 sec/qt). The MVF
then apparently reaches a steady state value of about 57 sec/qt after 10 to 18 hours. There may
also be a peak value of viscosity of 60 sec/qt that occurs at about 12 hours. Figures 4.5 through
4.7 show similar data for the PDSCo liquid (Figure 4.5), Baroid solid (Figure 4.6), and Baroid
liquid (Figure 4.7). In each case, there is a clear dependency of MFV on time since mixing. The
Baroid products (Figures 4.6 and 4.7) appear to approach steady state viscosities more rapidly
than the PDSCo products. Figure 4.8 shows MFV as a function of time for all four polymer types
together on the same plot.
30
35
40
45
50
55
60
65
0 5 10 15 20 25 30 35 40 45 50Time Since Mixing (hours)
Mar
sh F
unne
l Vis
cosi
ty (s
ec/q
t)
PDSCo Solid Polymer - Super Mud Dry
Figure 4.4. MFV as a function of time since mixing: PDSCo Solid Polymer (100 % Mfg).
41

28
30
32
34
36
38
40
42
0 5 10 15 20 25 30 35 40 45 50Time Since Mixing (hours)
Mar
sh F
unne
l Vis
cosi
ty (s
ec/q
t)
PDSCo Liquid Polymer - Super Mud
Figure 4.5. MFV as a function of time since mixing: PDSCo Liquid Polymer (100 % Mfg).
25
30
35
40
45
50
55
60
0 5 10 15 20 25 30 35 40 45 50Time Since Mixing (hours)
Mar
sh F
unne
l Vis
cosi
ty (s
ec/q
t)
Baroid Solid Polymer - EZ Mud DP
Figure 4.6. MFV as a function of time since mixing: Baroid Solid Polymer (100 % Mfg).
42

30
31
32
33
34
35
36
37
38
39
40
0 5 10 15 20 25 30 35 40 45 50Time Since Mixing (hours)
Mar
sh F
unne
l Vis
cosi
ty (s
ec/q
t)
Baroid Liquid Polymer - EZ Mud
Figure 4.7. MFV as a function of time since mixing: Baroid Liquid Polymer (100 % Mfg).
25
30
35
40
45
50
55
60
65
0 10 20 30 40 50Time Since Mixing (hours)
Mar
sh F
unne
l Vis
cosi
ty (s
ec/q
t)
PDSCo Solid
PDSCo Liquid
Baroid Solid
Baroid Liquid
Figure 4.8. MFV as a function of time since mixing: all four polymers (100% Mfg).
43
4.1.3 Discussion
The results clearly show that viscosity dramatically increases with both concentration and
time. Initial and final (48 hour) viscosity values for each polymer type mixed to 100% Mfg. are
summarized on Table 4.1. Here, the initial MFV values correspond to measurements made
immediately after mixing. Final values correspond to MFV measured at 48 hours since mixing.
The fourth column of the table shows the percent change between the initial value and the final
value. The fifth column shows the approximate amount of time for steady state MFV to be
reached, which, as also indicated on Figures 4.5 and 4.7, has not clearly been reached for the
liquid slurries after 48 hours. Steady state for the solid-based slurries is reached after about 5-18
hours.
Although steady state had not been fully reached for the liquid-based slurries, the percent
change in MFV from initial to final conditions is significantly larger for the solid polymer
slurries. It is also clear that the solid slurries tend to develop significantly higher final viscosity
than the liquid slurries (about 57 sec/qt compared with 39 sec/qt). This observation is consistent
with both the MoDOT and Majano and O’Neill (1993) specifications, which specifically
differentiate acceptable MFV ranges for liquid-based and solid-based slurry (see Tables 2.1 and
2.3).
The MFV at 48 hours for all four slurry types mixed to 100% Mfg. falls within the
acceptable ranges noted in both the MoDOT and Majano and O’Neill (1993) specifications.
However, the fact that viscosity does not appear to fully develop until an extended time since
mixing (5 hours to > 48 hours) may have important practical implications. For example, it is
generally assumed that a distinct advantage of polymer-based slurries over mineral-based slurries
is the lack of a requirement for excessive hydration time after mixing. The results presented here
44
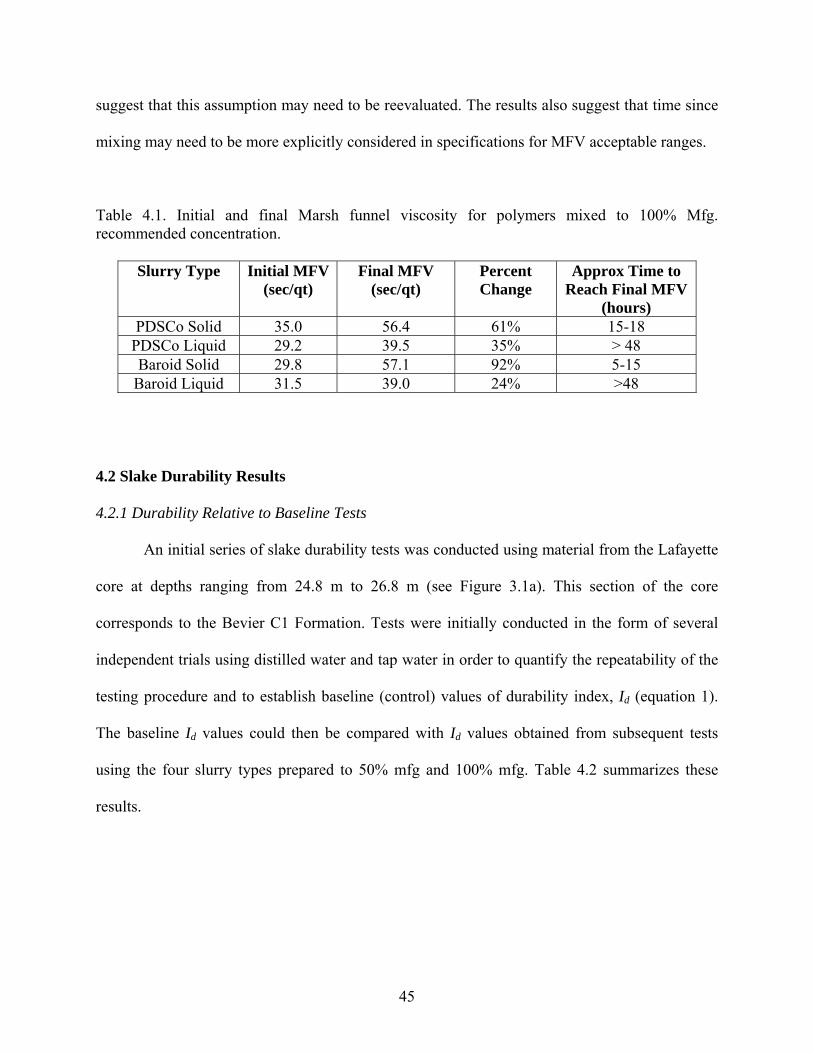
suggest that this assumption may need to be reevaluated. The results also suggest that time since
mixing may need to be more explicitly considered in specifications for MFV acceptable ranges.
Table 4.1. Initial and final Marsh funnel viscosity for polymers mixed to 100% Mfg. recommended concentration.
Slurry Type Initial MFV(sec/qt)
Final MFV (sec/qt)
Percent Change
Approx Time to Reach Final MFV
(hours) PDSCo Solid 35.0 56.4 61% 15-18
PDSCo Liquid 29.2 39.5 35% > 48 Baroid Solid 29.8 57.1 92% 5-15
Baroid Liquid 31.5 39.0 24% >48
4.2 Slake Durability Results
4.2.1 Durability Relative to Baseline Tests
An initial series of slake durability tests was conducted using material from the Lafayette
core at depths ranging from 24.8 m to 26.8 m (see Figure 3.1a). This section of the core
corresponds to the Bevier C1 Formation. Tests were initially conducted in the form of several
independent trials using distilled water and tap water in order to quantify the repeatability of the
testing procedure and to establish baseline (control) values of durability index, Id (equation 1).
The baseline Id values could then be compared with Id values obtained from subsequent tests
using the four slurry types prepared to 50% mfg and 100% mfg. Table 4.2 summarizes these
results.
45
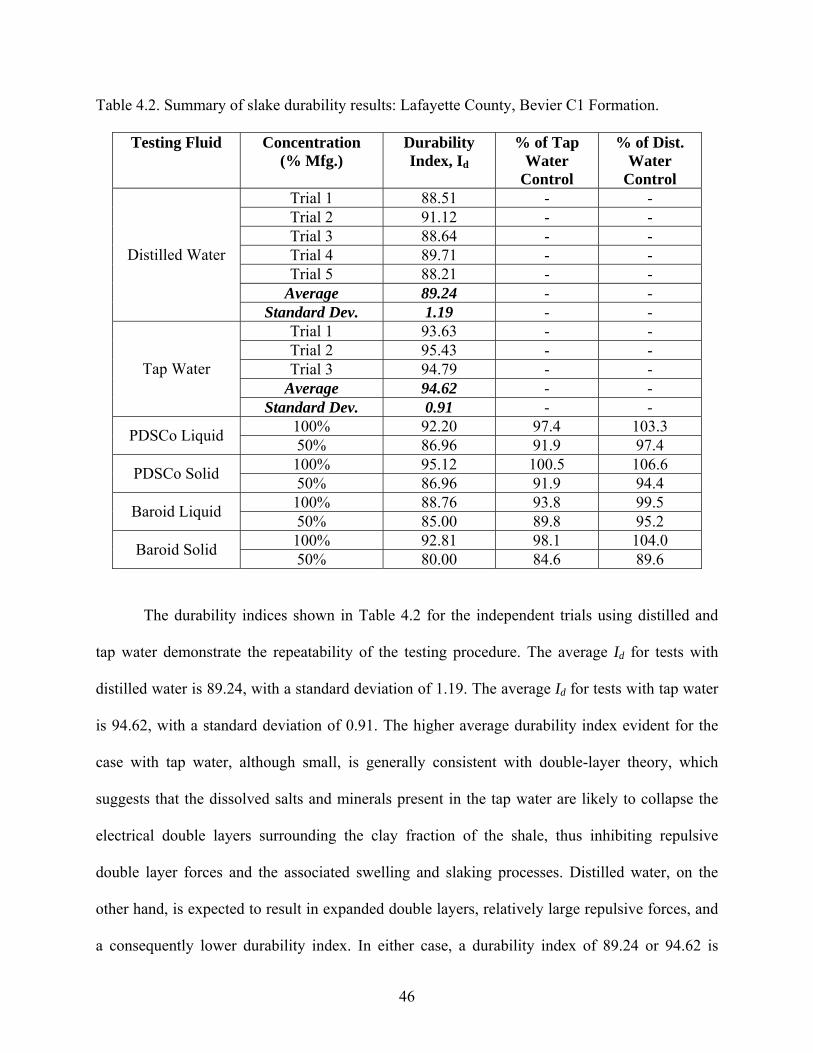
Table 4.2. Summary of slake durability results: Lafayette County, Bevier C1 Formation.
Testing Fluid Concentration (% Mfg.)
Durability Index, Id
% of Tap Water
Control
% of Dist. Water
Control Trial 1 88.51 - - Trial 2 91.12 - - Trial 3 88.64 - - Trial 4 89.71 - - Trial 5 88.21 - -
Average 89.24 - -
Distilled Water
Standard Dev. 1.19 - - Trial 1 93.63 - - Trial 2 95.43 - - Trial 3 94.79 - -
Average 94.62 - - Tap Water
Standard Dev. 0.91 - - 100% 92.20 97.4 103.3 PDSCo Liquid 50% 86.96 91.9 97.4 100% 95.12 100.5 106.6 PDSCo Solid 50% 86.96 91.9 94.4 100% 88.76 93.8 99.5 Baroid Liquid 50% 85.00 89.8 95.2 100% 92.81 98.1 104.0 Baroid Solid 50% 80.00 84.6 89.6
The durability indices shown in Table 4.2 for the independent trials using distilled and
tap water demonstrate the repeatability of the testing procedure. The average Id for tests with
distilled water is 89.24, with a standard deviation of 1.19. The average Id for tests with tap water
is 94.62, with a standard deviation of 0.91. The higher average durability index evident for the
case with tap water, although small, is generally consistent with double-layer theory, which
suggests that the dissolved salts and minerals present in the tap water are likely to collapse the
electrical double layers surrounding the clay fraction of the shale, thus inhibiting repulsive
double layer forces and the associated swelling and slaking processes. Distilled water, on the
other hand, is expected to result in expanded double layers, relatively large repulsive forces, and
a consequently lower durability index. In either case, a durability index of 89.24 or 94.62 is
46
relatively high. The high durability indices are consistent with the small degree of fracturing
noted in the Bevier C1 material, its relatively high compressive strength (qu = 1020-8105 kPa),
its high jar slake index (6), and the absence of expansive smectite noted in the XRD results.
The results shown in Table 4.2 for the PDSCo and Baroid slurries mixed to 100%
recommended concentration generally show that the durability of the material is enhanced
relative to the case for distilled water but may not be enhanced relative to the case for tap water.
The two columns on the right-hand-side of Table 4.2, for example, report Id as a percentage of
the average values for control tests conducted using either tap water (Column 4) or distilled
water (Column 5). Values in these columns greater than 100% indicate that durability is
improved relative to the baseline value for distilled water or tap water. Values less than 100%
indicate a lower durability relative to the baseline value. Given the standard deviations
determined from the previous tests, it can be concluded that use of the polymer types examined
here mixed to 100% recommended concentration results in a statistically significant (i.e., ± 1
s.d.), but minor, improvement in durability index relative to the case for distilled water. The
average improvement in Id is only 3.4%. Results relative to the control tests using tap water are
not statistically significant (i.e., the durability for slurry tests relative to the tap water control
tests are generally within one standard deviation). In other words, the data does not indicate a
significant benefit of using slurry relative over tap water for the particular shale material and
slurry types under consideration. Additional observations are as follows: (1) There does not
appear to be a significant dependence on the type (PDSCo or Baroid) or form (solid or liquid) of
slurry in terms of improvement to durability index; (2) At recommended concentrations, the solid
polymer appears to perform better than the liquid polymer; (3) In all cases, slurries mixed to 50%
of the recommended concentration result in Id values less than the cases for either distilled or tap
47
water; (4) Use of slurry mixed to 100% of the recommended concentration provides a
statistically significant improvement over the use of slurry mixed to 50% concentration.
4.2.2 Durability as a Function of Slurry Concentration
A second series of tests was conducted to explore slake durability index as a function of
polymer slurry concentration in more detail. Tests focused on using PDSCo solid slurry mixed to
25%, 50%, 75%, 100%, 125%, and 150% of the recommended mixture ratio. Materials for these
tests were selected from the Lafayette (Bevier C1 Formation), Macon (Verdigris Formation), and
McDonald County cores.
Figure 4.9 shows results in the form of Id versus slurry concentration for specimens of the
Bevier C1 Formation from the Lafayette County core. Average values and standard deviations
determined from the control tests conducted using distilled water and tap water are included on
the figure for comparison. Figure 4.10 shows results obtained for specimens of the Verdigris
Formation from the Macon County core. Results from a single test conducted using tap water are
included on the figure for comparison. Figure 4.11 shows results obtained for specimens from
the McDonald County core. Figure 4.12 shows the results for specimens from all three cores
plotted to the same scale. The combined results are also summarized on Table 4.3. The trends
demonstrated in these results suggest that durability index systematically increases with
increasing slurry concentration and reaches an optimum value near 100% of the recommended
concentration. Over-concentrated slurries (i.e., >100% Mfg.) do not appear to improve durability
and may even diminish it.
48

80
85
90
95
100
0 25 50 75 100 125 150 175% Mfg. Recommended Slurry Concentration
Slak
e D
urab
ility
Inde
x, I d
Distilled Water, Id = 89.24
Tap Water, Id = 94.62
PDSCo Solid Polymer
+ 1 s.d.
- 1 s.d.
+ 1 s.d.
- 1 s.d.
Figure 4.9. Results of slake durability tests for Lafayette County core (Bevier C1 Formation) and PDSCo solid slurry mixed to various concentrations.
80
85
90
95
100
0 25 50 75 100 125 150 175% Mfg. Recommended Slurry Concentration
Slak
e D
urab
ility
Inde
x, I d
Tap Water, Id = 98.90
PDSCo Solid Polymer
Figure 4.10. Results of slake durability tests for Macon County core (Verdigris Formation) and PDSCo solid slurry mixed to various concentrations.
49
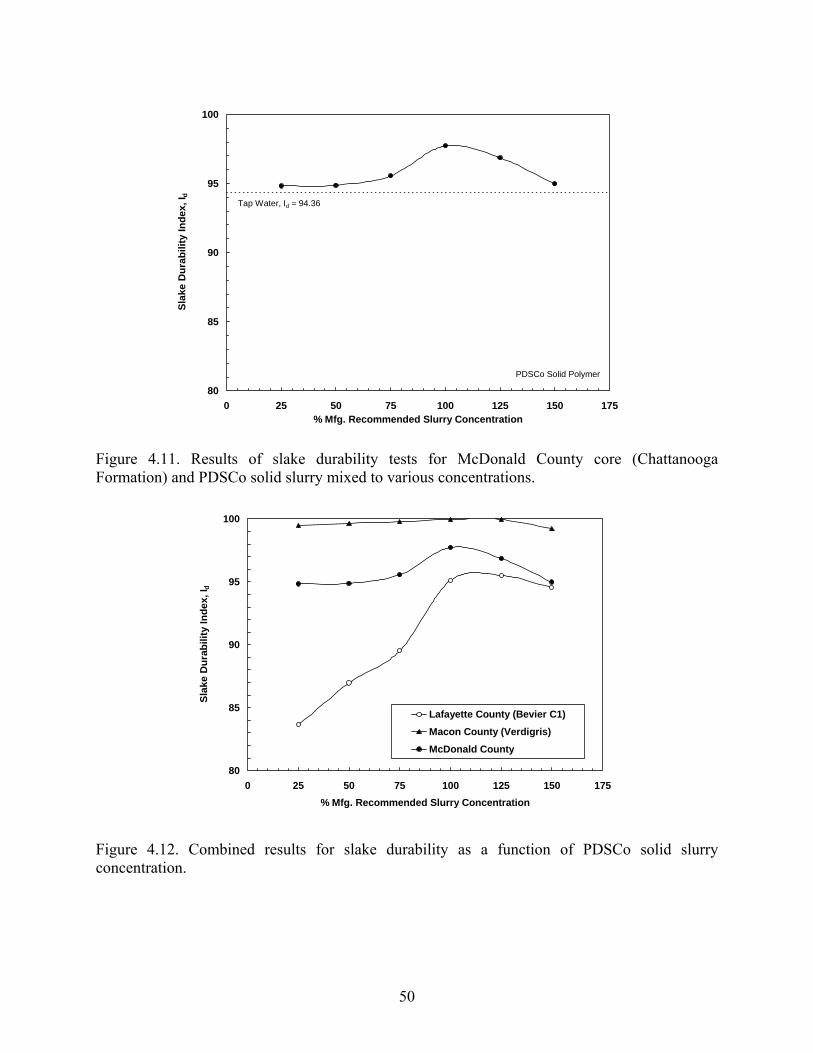
80
85
90
95
100
0 25 50 75 100 125 150 175% Mfg. Recommended Slurry Concentration
Slak
e D
urab
ility
Inde
x, I d Tap Water, Id = 94.36
PDSCo Solid Polymer
Figure 4.11. Results of slake durability tests for McDonald County core (Chattanooga Formation) and PDSCo solid slurry mixed to various concentrations.
80
85
90
95
100
0 25 50 75 100 125 150 175% Mfg. Recommended Slurry Concentration
Slak
e D
urab
ility
Inde
x, I d
Lafayette County (Bevier C1)
Macon County (Verdigris)
McDonald County
Figure 4.12. Combined results for slake durability as a function of PDSCo solid slurry concentration.
50

Table 4.3. Summary of slake durability results for PDSCo solid slurry mixed to various concentrations.
Lafayette Core (Bevier C1)
Macon Core (Verdigris)
McDonald Core (Chattanooga)
Concentration (% Mfg.)
Id Id IdTap Water 94.62 98.90 94.36
Distilled Water 89.24 - - 25% 83.64 99.50 94.83 50% 86.96 99.66 94.88 75% 89.52 99.79 95.56 100% 95.12 99.96 97.93 125% 95.52 99.96 96.86 150% 94.55 99.21 94.98
4.3 Jar Slake Results
Table 4.4 summarizes the results of jar slake tests conducted using materials from the
Lafayette, Macon, and McDonald County cores and a variety of immersion fluids. While these
results are inherently qualitative, there is some indication that the polymer slurries improve the
slaking characteristics of the materials. For example, tests using material from the Bevier C2
portion of the Lafayette County core and distilled or tap water both resulted in slake index
categories of 4. The index was improved to a value of 5 (or 6 in one case) when polymer slurries
were used. There does not appear to be a significant effect of reducing the slurry concentration to
50% Mfg. in these tests. Results using material from the Verdigris Formation of the Macon
County core showed no change in slake index category (5) between distilled water, tap water, or
any of the slurries mixed to 100% of the recommended concentration. Material from the
McDonald County core showed an improvement from a category 5 using distilled water and tap
water to a category 6 when polymer slurries were used.
51
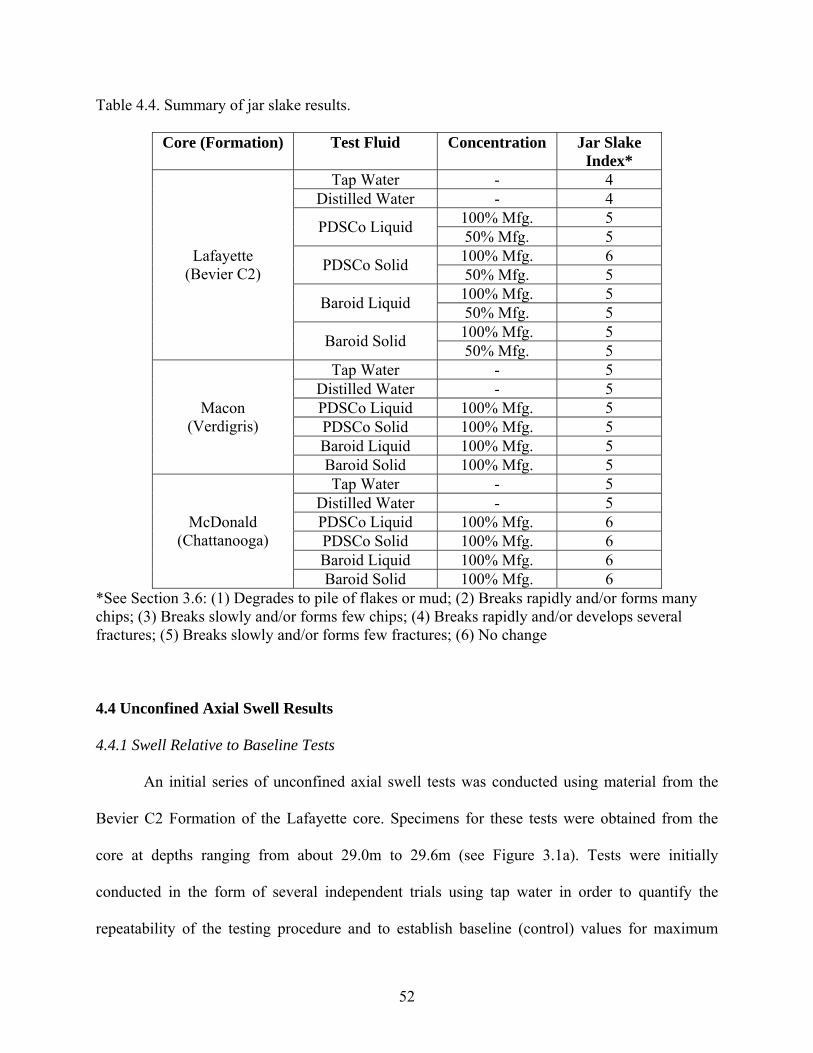
Table 4.4. Summary of jar slake results.
Core (Formation) Test Fluid Concentration Jar Slake Index*
Tap Water - 4 Distilled Water - 4
100% Mfg. 5 PDSCo Liquid 50% Mfg. 5 100% Mfg. 6 PDSCo Solid 50% Mfg. 5 100% Mfg. 5 Baroid Liquid 50% Mfg. 5 100% Mfg. 5
Lafayette (Bevier C2)
Baroid Solid 50% Mfg. 5 Tap Water - 5
Distilled Water - 5 PDSCo Liquid 100% Mfg. 5 PDSCo Solid 100% Mfg. 5 Baroid Liquid 100% Mfg. 5
Macon (Verdigris)
Baroid Solid 100% Mfg. 5 Tap Water - 5
Distilled Water - 5 PDSCo Liquid 100% Mfg. 6 PDSCo Solid 100% Mfg. 6 Baroid Liquid 100% Mfg. 6
McDonald (Chattanooga)
Baroid Solid 100% Mfg. 6 *See Section 3.6: (1) Degrades to pile of flakes or mud; (2) Breaks rapidly and/or forms many chips; (3) Breaks slowly and/or forms few chips; (4) Breaks rapidly and/or develops several fractures; (5) Breaks slowly and/or forms few fractures; (6) No change
4.4 Unconfined Axial Swell Results
4.4.1 Swell Relative to Baseline Tests
An initial series of unconfined axial swell tests was conducted using material from the
Bevier C2 Formation of the Lafayette core. Specimens for these tests were obtained from the
core at depths ranging from about 29.0m to 29.6m (see Figure 3.1a). Tests were initially
conducted in the form of several independent trials using tap water in order to quantify the
repeatability of the testing procedure and to establish baseline (control) values for maximum
52

axial strain upon inundation. The baseline axial strain value could then be compared with values
obtained from subsequent tests using the four slurry types prepared to 50% Mfg. and 100% Mfg.
Table 4.5 summarizes the results of these tests. Maximum axial strain is reported as the
apparent steady state value obtained at 24 hours. The value reported for tap water (εa = 0.75%)
represents the average of five independent trials. The standard deviation for these trails is 0.11%.
Values for all other fluids shown in the table are based on a single trial. The column on the right-
hand-side of Table 4.5 reports maximum axial strain for each slurry test in terms of the
percentage of tap water control value. Time series data for the tap water control tests are given in
Figure 4.13.
Table 4.5. Summary of swell testing Results for Lafayette core (Bevier C2).
Testing Fluid Fluid Concentration
Max. Axial Strain, εa (%)
Percent of Tap Water Control Value (%)
- 0.624 - - 0.700 - - 0.908 - - 0.687 - 0.824
Average 0.75 -
Tap Water
Stand. Dev. 0.11 - 100% Mfg. 0.46 61.1 PDSCo Liquid 50% Mfg. 0.55 73.3 100% Mfg. 0.44 58.6 100% Mfg. 0.38 50.7 PDSCo Solid 50% Mfg. 0.95 126.7 100% Mfg. 0.69 92.0 Baroid Liquid 50% Mfg. 0.35 46.7 100% Mfg. 0.37 49.3 Baroid Solid 50% Mfg. 0.74 98.7
53

0.000
0.100
0.200
0.300
0.400
0.500
0.600
0.700
0.800
0.900
1.000
0 200 400 600 800 1000 1200 1400 1600Time (minutes)
Axi
al S
trai
n (%
)
Trial # 1
Trial # 2
Trial # 3
Trial # 4
Trial # 5
Average
Figure 4.13. Results of swell tests using Lafayette County core (Bevier C2) and tap water.
4.4.2 Swell as a Function of Slurry Concentration
A second series of tests was conducted to quantify the effect of slurry concentration on
measured values of maximum axial swell. These tests were conducted using material from the
Lafayette (Bevier C2), Macon (Verdigris), and McDonald County (Chattanooga) cores. PDSCo
solid slurry was prepared in concentrations ranging from 50% Mfg. to 150% Mfg. Results are
shown on Figure 4.14 in the form of maximum axial strain as a function of slurry concentration.
54

0
0.1
0.2
0.3
0.4
0.5
0.6
0.7
0.8
0.9
1
1.1
0 25 50 75 100 125 150 175
% Mfg. Recommended Slurry Concentration
Max
imum
Axi
al S
trai
n, ε a
(%)
Lafayette (Bevier C2)
Macon (Verdigris)
McDonald
Figure 4.14. Maximum axial strain as a function of PDSCo Solid slurry concentration.
4.4.3 Discussion
The results summarized in Table 4.5 indicate that the various polymer slurries appear to
be effective in inhibiting swelling. The reported maximum axial strain is as little as 46.7% of the
control test results using tap water. With the exception of the Baroid liquid, maximum axial
strain for each slurry at 100% Mfg. concentration is less than the tap water baseline value minus
one standard deviation. In two cases, however, (PDSCo solid 50% and Baroid solid 50%) the
maximum axial strain is near or more than the amount measured for the tap water baseline tests.
Results from the more detailed investigation of slurry concentration (Figure 4.14) suggest that
maximum axial strain decreases systematically with increasing slurry concentration and that an
optimum level of swelling inhibition corresponds to slurries mixed to 100% of the manufacturer
recommended value. Under-concentrated and over-concentrated slurries appear to be less
55
effective in inhibiting swelling. It is interesting to note that a similar optimum was observed in
slake durability index as a function of slurry concentration (Section 4.2.2; Figure 4.12).
It should be noted that the swelling potential of the shale materials examined in these
tests is inherently quite low. This is indicated both by the relatively low plasticity indices for the
materials and the absence of a significant smectite fraction noted in the XRD results (as
described in Section 3.3.1, PI ranged from 2-16 for the Lafayette material, was 12 for the Macon
material, and was NP for the McDonald material). Thus, while the swelling inhibition apparent
in these results appears to be statistically significant, it may not be practically significant for the
materials examined here. Additional tests using materials with significant swelling potential are
required to validate and expand the trends noted in these results.
4.5 Bulk Hardness Results
4.5.1 Bulk Hardness as a Function of Slurry Concentration
Bulk hardness tests were conducted using material from the Lafayette (Bevier C2),
Macon (Lagonda), and McDonald County cores using tap water and PDSCo Solid slurry mixed
to concentrations ranging from 25% Mfg. to 150% Mfg. Shale fragments were immersed in the
respective solutions for 24 hours prior to hardness testing. Results from these tests are plotted on
Figure 4.15. Here, the hardness indices reported for 0% Mfg. concentration correspond to the
values measured using tap water. The results are also summarized on Table 4.6.
56
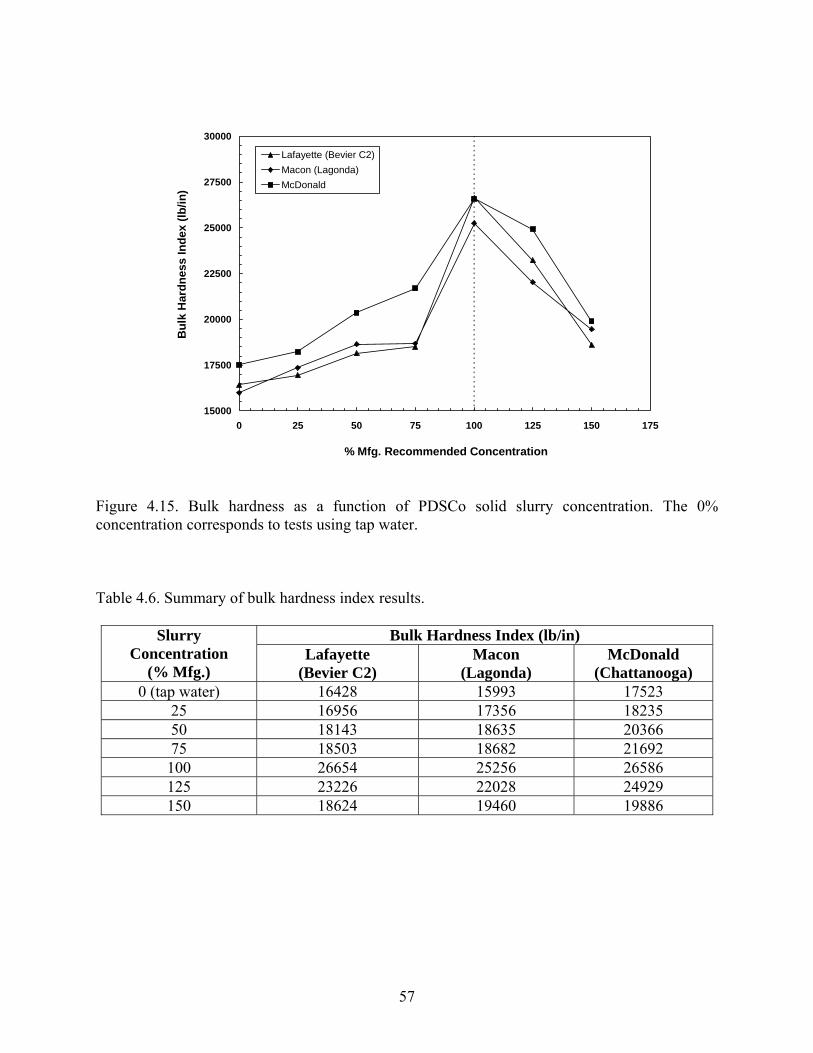
15000
17500
20000
22500
25000
27500
30000
0 25 50 75 100 125 150 175
% Mfg. Recommended Concentration
Bul
k H
ardn
ess
Inde
x (lb
/in)
Lafayette (Bevier C2)Macon (Lagonda)McDonald
Figure 4.15. Bulk hardness as a function of PDSCo solid slurry concentration. The 0% concentration corresponds to tests using tap water. Table 4.6. Summary of bulk hardness index results.
Bulk Hardness Index (lb/in) Slurry Concentration
(% Mfg.) Lafayette
(Bevier C2) Macon
(Lagonda) McDonald
(Chattanooga) 0 (tap water) 16428 15993 17523
25 16956 17356 18235 50 18143 18635 20366 75 18503 18682 21692 100 26654 25256 26586 125 23226 22028 24929 150 18624 19460 19886
57
4.5.2 Discussion
The results shown in Figure 4.15 and Table 4.6 indicate that bulk hardness index for all
three materials systematically increases with increasing slurry concentration and reaches an
optimum condition at 100% of the Mfg. recommended concentration. Over-concentrated slurries
clearly result in softening of the material in all three cases. The notion of an optimum slurry
concentration occurring at or near the manufacturer recommended concentration in the bulk
hardness results is supported by the slake durability and axial swell results presented previously,
where it was also shown that optimum durability and swelling inhibition tend to occur at 100%
Mfg.
5. Summary, Conclusions, and Recommendations
5.1 Summary
A laboratory experimental program has been undertaken to develop a better quantitative
understanding of the performance of polymer-based slurries for geotechnical drilling applications
in shale. A series of laboratory experiments has been developed to quantify slurry performance
in terms of its capability to improve the durability, swelling, and softening characteristics of
shale specimens retrieved from formations typically encountered during drilled shaft
construction in Missouri. A primary objective of the work has been to develop a set of
experimental procedures and results that may be used to more efficiently and effectively specify
the use of polymer-based slurries in Missouri.
Tests focused on four PHPA polymer products from two manufacturers, including: 1)
PDSCo Super Mud, 2) PDSCo Super Mud Dry, 3) Baroid EZ Mud, and 4) Baroid EZ Mud DP.
Shale materials of Pennsylvanian and Devonian age were obtained from cores drilled at three
58

locations in Missouri, including Lafayette, Macon, and McDonald Counties. Specific laboratory
experiments included preliminary Atterberg limits and mineralogical (XRD) characterization, jar
slake testing, slake durability (drum slake) testing, unconfined axial swell testing, and bulk
hardness testing. The latter was conducted using a newly developed extrusion testing system.
The objective of each testing series was to quantify polymer slurry performance in terms of shale
durability, swelling inhibition, and softening behavior, as well as to explore the dependency of
each of these performance variables on slurry type and concentration. Slurry concentration was
varied from zero (tap water or distilled water) to 150% of the manufacturer recommended
concentration in increments of 25%.
5.2 Conclusions
Detailed observations and conclusions have been presented at appropriate places in the
individual sections of this report. General conclusions include the following.
1) Preparation of PHPA polymer slurries does not require prolonged mixing time. Uniform
slurry was obtained as long as the polymer dissolved completely during initial mixing.
Full realization of slurry viscosity (quantified using a Marsh funnel), however, required
a significant amount of time after mixing (5 hours to more than 48 hours).
2) Solid-based (granular) polymer slurries considered in this study developed steady state
Marsh funnel viscosity more rapidly (5 – 18 hours) than the liquid-based (emulsified)
polymer slurries considered (> 48 hours).
3) Solid-based (granular) polymer slurries mixed to manufacturer recommended
concentrations developed consistently higher Marsh funnel viscosities (≈ 57 sec/qt) than
liquid-based (emulsified) polymer slurries (≈ 39 sec/qt).
59
4) The durability of shale specimens considered in this study using polymer slurries and
quantified in terms of slake durability index (Id) were only slightly enhanced relative to
baseline values for distilled water and not enhanced relative to baseline values for tap
water.
5) There is no significant dependence on the type (manufacturer) or form (solid or liquid)
of the polymer slurries considered in this study in terms of improvement to slake
durability index.
6) Slake durability index increases with increasing polymer concentration and reaches an
optimum value near 100% of the manufacturer recommended concentration.
7) The durability of shale specimens considered in this study using polymer slurries and
quantified in terms jar slake index were slightly enhanced relative to baseline values for
distilled water and tap water. For the three shale types considered, jar slake indices
increased from category 4 to 5, from 5 to 6, or did not change.
8) Swelling of unconfined shale specimens (quantified using unconfined free swell tests)
appeared to be inhibited by the use of polymer slurry relative to baseline values
measured using tap water. Optimum swelling inhibition appeared to be attained using
slurries mixed exactly to manufacturer recommended concentrations. Additional tests
using shale specimens with significant swelling potential are required to validate these
observations.
9) Bulk hardness index (quantified using an extrusion apparatus) systematically increases
with increasing polymer slurry concentration and reaches an optimum for slurries mixed
exactly to the manufacturer recommended concentration.
60
5.3 Recommendations
5.3.1 Recommendations for Implementation
The practical product of this research is a demonstrated and documented series of
laboratory procedures that may be conducted on a site-specific basis to more effectively specify
polymer based drilling fluids for applications in Missouri shale. The laboratory procedures allow
the relevant shale/slurry performance variables (e.g., durability, swelling inhibition, hardness)
and the effects of slurry type, concentration, or other variables (e.g., pH) to be systematically and
directly quantified, thus creating a useful framework for site specific slurry specification. It is
recommended, therefore, that soil/rock specimens obtained during future site investigations
where polymer slurries are under consideration for drilled shaft construction should be tested
following the general laboratory procedures described in this report. The objective of the
laboratory effort should be to specify acceptable ranges of polymer slurry properties on a site
specific basis.
Figure 5.1 shows a proposed flowchart describing a sequence of laboratory efforts
leading to site specific polymer slurry specification. The preliminary laboratory phase should
include procedures to quantify three basic material (shale) properties: durability, plasticity, and
strength. Recommended tests to quantify these properties are jar slake, slake durability (drum
slake), Atterberg limits testing (PI), and unconfined compression testing. These tests are
recommended for their simplicity and because they are already routine to most site investigations
(with the possible exception of slake durability). The numerical products of these tests (i.e., jar
slake index, Id, PI, and qu) may then be used as quantitative indices to assess whether or not the
durability, swelling potential, or strength of the shale under consideration meets some
predetermined acceptance criteria. If one or more of the acceptance criteria are not met, then a
61

more detailed investigation of the material’s durability, plasticity and strength, and the
dependency of these properties on interactions with drilling fluid, are warranted. If, for example,
slake durability index during the preliminary laboratory investigation is less than perhaps 50,
then borehole integrity may be an issue during construction and detailed investigation using jar
slake and drum slake tests and a variety of polymer slurries and slurry concentrations is
warranted. Similarly, if plasticity index is greater than some predetermined value, perhaps 30-35,
then swelling and dispersion of the borehole wall may be an issue during construction and
detailed investigation of swelling behavior using unconfined axial swell tests and a variety of
polymer slurries and slurry concentrations is warranted. Finally, if unconfined compressive
strength is relatively low, then the shear strength of the shaft/borehole interface may be an issue
and more detailed investigation of softening effects using bulk hardness tests and a variety of
polymer slurries and slurry concentrations is warranted. The product of the detailed investigation
is an optimum slurry type and concentration to ensure acceptable shale durability, inhibit
swelling, and reduce softening effects. Quality control criteria (e.g., MFV) can then be matched
to this specific polymer type and concentration to afford site specific specification of acceptable
ranges for that quality control criterion.
62

Figure 5.1. Suggested sequence of laboratory efforts for site specific specification of polymer based slurries.
63

5.3.2 Recommendations for Future Research
1) The activities described in this report have provided a framework for site specific
polymer slurry specification. Additional efforts to establish the acceptance criteria
described above and to implement the proposed sequence to controlled full-scale
operations are recommended.
2) It is recommended that a representative from the slurry manufacturer be more closely
involved in slurry specification and quality control. If practical, it is desirable to require
in the specifications that a manufacturer’s representative be present at the site during
actual drilling operations to react to any changing field conditions.
3) The pH of the make up (tap) water used for tests described in this experimental program
was 8.48, which is near the lower limit of the manufacturer’s recommended range of 8 –
10. Because pH was not examined as an experimental variable, the sensitivity of the
slurry performance criteria examined in this study (durability, swell, hardness) to pH is
not known. Additional tests are suggested to evaluate the impact of pH over a wide
range of values. Any observed sensitivity to pH should then be evaluated in light of the
expected range of values encountered in typical field drilling operations in Missouri.
4) The current MoDOT specification for viscosity quality control is given in terms of
Marsh Funnel Viscosity (MFV). While MFV is widely accepted in practice and has
historically been adopted in drilling fluid specifications, there is some question about
whether or not the Marsh Funnel is the most appropriate device for viscosity control.
The results presented in this report show that funnel viscosities for polymer slurries are
extremely sensitive to time since mixing. It is recommended that alternative viscosity
standards be examined for potential adoption into MoDOT’s viscosity quality control
64
specifications. Direct measurement of plastic viscosity and yield point using a concentric
rotational viscometer operated on site should be considered. Development of such
specifications would most likely require a study of how viscosity measurements for
polymer slurries obtained using the system depend on slurry concentration, pH, time
since mixing, and suspended solids content.
5) Laboratory and full-scale or reduced-scale field tests are recommended to quantitatively
assess perimeter load transfer in drilled shafts constructed using polymer slurry
techniques. Particular emphasis for the laboratory tests should be placed on investigating
variables that tend to affect filter cake thickness (e.g., cake formation time, borehole
fluid pressure) and how the filter cake thickness affects the concrete/borehole interface
strength. Full-scale or reduced-scale field tests should be performed under controlled
conditions to assess polymer slurry performance in terms of constructability and load
capacity for drilled shaft applications. Ideally, multiple test sites should be selected to
represent wide range of soil/rock types, integrity, and strength.
6) Additional tests are recommended to continue the testing program described in this
report using a wider variety of Missouri shale materials. Shales exhibiting higher
swelling potential, more diverse mineralogy, and lower durability than those examined
here are specifically recommended. These additional tests will allow the effectiveness of
polymer slurries to be more generally evaluated for use in Missouri shales.
65
References
ACI (American Concrete Institute) 1989, “Standard specifications for the construction of drilled piers,” ACI Structural Journal 89, 1, pp. 94-103.
ASTM, 2000, “Standard test method for slake durability of shales and similar weak rocks,”
ASTM D4644-87, Annual Book of ASTM Standards, D18. Ata, A., and O’Neill, M., 2000, “The physicochemical interaction between PHPA polymer slurry
and cement mortar,” Geotechnical Testing Journal, Vol. 23, No. 2, pp. 225-235. Bacon, D., Brenner, B., Das, P., Grebner, L., and Payiatakis, S., 2000, “Polymer and bentonite
slurry on the Central Artery/Tunnel Project: Lessons learned,” In North American Tunneling ’00, Ozdemir (ed.), Balkema, Rotterdam, pp. 327-332.
Darley, H.C.H., and Gray, G.R., 1988, Composition and Properties of Drilling and Completion
Fluids, Fifth Edition, Gulf Professional Publishing, Houston, TX. Fleming, W.K., Fuchsberger, M., Kipps, O., and Sliwinski, Z.J., 1975, “Diaphragm wall
specification,” Proceedings of Conference on Diaphragm Walls and Anchorages, London, Institution of Civil Engineers, pp. 207.
FDOT (Florida Department of Transportation) 1988, “FDOT Standard Specifications for Road
and Bridge Construction,” Section 455: Foundations of Structures, Tallahassee FL. FPS (Federation of Piling Specialists), 1975, “Specification for cast-in-place piles formed under
bentonite suspension,” Ground Engineering, 8(2), 50 pp. FPS (Federation of Piling Specialists), 1977, “Modifications to specification for cast-in-place
concrete diaphragm walling (1973) and specification for cast-in-place piles formed under bentonite suspension (1975),” Ground Engineering, 10(8), 45 pp.
Hodgson, F.T., 1977, “Design and control of bentonite clay suspensions and concrete in
diaphragm wall construction,’ Seminar on a Review of Diaphragm Walls, Institution of Civil Engineers, London, 79, pp.
Holden, J.C., 1984, “Construction of bored piles in weathered rocks, Part 4: Bentonite
construction procedures,” Technical Report No. 69, Road Construction Authority of Victoria, Australia.
Hutchinson, M.T., Daw, G.P., Shotton, P.G., and James, A.N., 1974, “The properties of
bentonite slurries used in diaphragm walling and their control,” Proceedings of Conference on Diaphragm Walls and Anchorages, London, Institution of Civil Engineers, pp. 33.
66
Kheng, H., Bloomquist, D., Townsend, F.C., Thompson, P.Y., and Dobson, E., 1991, “Slurry performance in drilled shaft construction,” Final Report, Florida Department of Transportation, Project 99700-7487-010, reprint available from ADSC, Dallas, TX.
Lutton, R. J., 1977, Slaking Indexes for Design (Report FHWA-RD-77-1), Design and
Construction of Compacted Shale Embankments, US Department of Transportation, Vol. 3.
Majano, R.E., and O’Neill, M.W., 1993, “Effect of mineral and polymer slurries on perimeter
load transfer in drilled shafts,” Report to ADSC: International Association of Foundation Drilling, UHCE 93-1, reprint available from ADSC, Dallas, TX.
Miller, A.D., 2003, “Prediction of ultimate side shear of rock socketed drilled shafts in weak
rock,” M.S. Thesis, University of Missouri – Columbia, Columbia, MO. Moore, D.M., and Reynolds, R.C., 1997, X-Ray Diffraction and the Identification and Analysis
of Clay Minerals, Oxford University Press. Patel, A., Stamatakis, E., Friedham, J.E., and Davis, E., 2001, “Highly inhibitive water-based
fluid system provides superior chemical stabilization of reactive shale formations, Drilling Technology, American Association of Drilling Engineers.
Reese, L.C., and O’Neill, M.W., 1988, “Drilled shafts: Construction procedures and design
methods,” Publication Nos. FHWA-HI-88-042 and ADSC-TL-4, Federal Highway Administration and ADSC.
Schlumberger, 2003, available online at http://www.glossary.oilfield.slb.com. Turner, J., and Macnab, A., 2003, “Advances in constructability for drilled foundations (Part II),
Geo-Strata, October 2003, pp. 20-23. Unklesbay, A.G., and Vineyard, J.D., 1992, Missouri Geology, University of Missouri Press. Walkinshaw, J.L. and Santi, P.M., 1996, “Chapter 21 – Shales and Other Degradable Materials,”
Landslides: Investigation and Mitigation, A.K. Turner and R.L. Schuster, Eds., TRB Special Report, Transportation Research Board, National Research Council, Washington, D.C.
Wood, L.E., and Deo, P., 1975, “A suggested system for classifying shale materials for
embankments,” Bulletin of the Association of Engineering Geologists, Vol. 12, No. 1, pp. 39-55.
Young, S.Y., 2001, “Novel polymer chemistry increases shale stability,” Drilling Technology,
American Association of Drilling Engineers.
67

Appendices
Appendix A. Current MoDOT Drilling Fluid Specifications
Polymer Slurry. Rock sockets shall be excavated only by the Permanent Casing Construction Method. A polymer slurry shall be required prior to beginning rock socket drilling through completion of concreting the rock socket. The purpose of the polymer slurry is to reduce degradations of shales. Reverse circulation drilling methods are not allowed in drilled shafts where polymer slurry is used during rock socket excavation. Drilling slurry shall be at no additional cost and with no extension of contract time.
Polymer slurry is used to maintain stability of the drilled shaft excavation, to aid in the drilling process, or to maintain the quality of the rock socket The material used to make the slurry shall not be detrimental to concrete or surrounding ground strata. Polymer slurries shall have sufficient viscosity to transport excavated material to suitable screening systems or settling tanks. The slurry shall be pre-mixed thoroughly with clean fresh water and adequate time (as prescribed by the manufacturer) allotted for hydration prior to introduction into the shaft excavation. Water used for mixing shall not have characteristics that are detrimental to the slurry, drilled shaft excavation, or concrete. Slurry tanks of adequate capacity will be required for slurry mixing, circulation, storage, and treatment. No excavated slurry pits shall be allowed in lieu of slurry tanks. Only clean uncontaminated slurry should be pumped back into the slurry tanks. The concrete-slurry interface should be pumped off into a spoils tank separated and not part of the active slurry system.
Control tests using suitable apparatus shall be carried out by the contractor on the slurry to determine density, viscosity, sand content, and pH of freshly mixed slurry, recycled slurry, and slurry in the excavation. Tests shall be done in each shaft excavation during the excavation process to establish a consistent working pattern taking into account the mixing process and blending of freshly mixed slurry with previously used slurry. A minimum of 4 sets of tests shall be made during the first 8 hours of slurry use on the project. When the results show consistent behavior, the testing frequency may be decreased to 1 set every 4 hours of slurry use or as otherwise approved by the engineer. Reports of all tests, signed by an authorized representative of the contractor, shall be furnished to the engineer on completion of each drilled shaft. An acceptance range of values for these physical properties is shown in the following table. A minimum pH value of 9 is preferred and treatment of the makeup water with soda ash is required. The water should be treated with soda ash before addition of the polymer slurry. The limits shown may be adjusted when field conditions warrant as successfully demonstrated in a production shaft, or with other methods approved by the engineer. All changes shall be approved in writing by the engineer before continued use.
When any slurry samples are found to be unacceptable, the contractor shall bring the slurry in the shaft excavation within specification requirements. Concrete shall not be poured until resampling and testing results produce acceptable values. Actions and resampling necessary to bring the slurry within specification requirements shall be at no additional cost and with no extension of contract time. Prior to placing shaft concrete, the contractor shall use an approved slurry sampling tool to take slurry samples from the bottom and at mid-height of the shaft.
68
The slurry shall be within specification requirements immediately before shaft concrete placement. Any heavily contaminated slurry that has accumulated at the bottom of the shaft shall be eliminated. Disposal of all slurry shall be done off-site in approved areas at no additional cost and with no extension of contract time. Suspended Solids For Polymer Slurries - The requirement for less than 1% “Sand Content” in Table 1 of the Special Note for Drilled Shafts applies to all suspended solids in the slurry mix larger than a 0.075mm mesh. Sample slurry within 1m of the shaft bottom to check for suspended solids. Settling time after the completion of drilling may be necessary to meet this requirement. Perform final shaft bottom cleaning after suspended solids have settled from the slurry mix. During construction the level of slurry shall be maintained at a height sufficient to prevent caving of the excavation. In the event of a sudden drop of slurry head in the excavation, the construction of that shaft shall be stopped until either methods to stop slurry loss or an alternate construction procedure has been approved by the engineer. The level of slurry in the shaft excavation shall be maintained at a level not less than 4 feet above the highest expected piezometric pressure head. Levels of slurry greater than 4 feet above the highest expected piezometric pressure head may be required to maintain stability of the excavation. If at any time, the slurry construction method fails, in the opinion of the engineer, to produce the desired final results, the contractor shall both discontinue this method and propose an alternate method for approval of the engineer. Submittals. No later than 4 weeks prior to the beginning of drilled shaft construction, submit a sample of the slurry and any additives to be used. Also submit a Proposed Method of Slurry Use, prepared by the slurry manufacturer including the following:
1. a detailed slurry mix design, specific slurry properties, and a discussion of its suitability to the anticipated subsurface conditions;
2. methods to mix, circulate, desand, and recycle(if applicable) the proposed slurry; 3. details of the proposed testing, test methods, sampling methods, and test
equipment; 4. the name and current phone number of the manufacturer’s representative for the
project; and 5. any other information the slurry manufacturer deems necessary
Slurry Manufacturer’s Representative. Provide the services of a representative of the Slurry Manufacturer to provide technical assistance, including:
1. training project inspectors and contractor personnel regarding the slurry properties and proper testing procedures;
2. being at the site prior to introduction of the slurry into the first shaft where slurry use is required, and during drilling and completion of a minimum of one shaft to adjust the slurry mix to the specific site conditions; and
3. being available to provide technical assistance during the construction of shafts in which slurry will be used.
69

Table 1. Acceptance range of values for mineral and polymer slurries (API Standard 13B) in fresh water without additives
Property
Bentonite
Emulsified Polymer
Dry Polymer
Units
Test Method
Density (Unit Weight) (API Standard Specification 13B, Section 1) At Introduction – Prior to Concreting -
1017-1070 (63.5-66.8)
1017-1129 (63.5-70.5)
< 1009 (63)
< 1009 (63)
< 1009 (63)
< 1009 (63)
kg/m3
(lb/ft3)
Density Balance
Marsh Funnel Viscosity (API Standard Specification 13B, Section 2) At Introduction – Prior to Concreting -
(32 – 60)
(32 – 60)
(33 – 43)**
(33 – 43)**
(50 – 80)**
(50 – 80)**
(sec/qt)
Marsh Funnel
PH (API Standard Specification 13B, Section 6) At Introduction – Prior to Concreting -
8 – 10
8 – 10
8 – 11
8 – 11
8 – 11
8 – 11
--
--
pH Paper
or pH
Meter
Sand Content (API Standard Specification 13B, Section 4) At Introduction – Prior to Concreting -
< 4
< 4
< 1
< 1
< 1
< 1
% by Volume
API Sand
Content Kit
**Higher viscosities may be required to maintain excavation stability in loose or gravelly sand deposits.
70
Appendix B. Scanned copy of original boring logs for Macon County cores.
71
72 72

Appendix C. Scanned copy of original boring log for McDonald County core.
73