
Engineering Design of Rock Slope Reinforcement Based on ...
9
Missouri University of Science and Technology Missouri University of Science and Technology Scholars' Mine Scholars' Mine International Conference on Case Histories in Geotechnical Engineering (1988) - Second International Conference on Case Histories in Geotechnical Engineering 02 Jun 1988, 10:30 am - 3:00 pm Engineering Design of Rock Slope Reinforcement Based on Non- Engineering Design of Rock Slope Reinforcement Based on Non- Linear Joint Strength Model Linear Joint Strength Model Stavros C. Bandis Aristotelian University, Thessaloniki, Greece Follow this and additional works at: https://scholarsmine.mst.edu/icchge Part of the Geotechnical Engineering Commons Recommended Citation Recommended Citation Bandis, Stavros C., "Engineering Design of Rock Slope Reinforcement Based on Non-Linear Joint Strength Model" (1988). International Conference on Case Histories in Geotechnical Engineering. 11. https://scholarsmine.mst.edu/icchge/2icchge/2icchge-session2/11 This work is licensed under a Creative Commons Attribution-Noncommercial-No Derivative Works 4.0 License. This Article - Conference proceedings is brought to you for free and open access by Scholars' Mine. It has been accepted for inclusion in International Conference on Case Histories in Geotechnical Engineering by an authorized administrator of Scholars' Mine. This work is protected by U. S. Copyright Law. Unauthorized use including reproduction for redistribution requires the permission of the copyright holder. For more information, please contact [email protected].
Transcript of Engineering Design of Rock Slope Reinforcement Based on ...
Missouri University of Science and Technology Missouri University of Science and Technology
Scholars' Mine Scholars' Mine
International Conference on Case Histories in Geotechnical Engineering
(1988) - Second International Conference on Case Histories in Geotechnical Engineering
02 Jun 1988, 10:30 am - 3:00 pm
Engineering Design of Rock Slope Reinforcement Based on Non-Engineering Design of Rock Slope Reinforcement Based on Non-
Linear Joint Strength Model Linear Joint Strength Model
Stavros C. Bandis Aristotelian University, Thessaloniki, Greece
Follow this and additional works at: https://scholarsmine.mst.edu/icchge
Part of the Geotechnical Engineering Commons
Recommended Citation Recommended Citation Bandis, Stavros C., "Engineering Design of Rock Slope Reinforcement Based on Non-Linear Joint Strength Model" (1988). International Conference on Case Histories in Geotechnical Engineering. 11. https://scholarsmine.mst.edu/icchge/2icchge/2icchge-session2/11
This work is licensed under a Creative Commons Attribution-Noncommercial-No Derivative Works 4.0 License.
This Article - Conference proceedings is brought to you for free and open access by Scholars' Mine. It has been accepted for inclusion in International Conference on Case Histories in Geotechnical Engineering by an authorized administrator of Scholars' Mine. This work is protected by U. S. Copyright Law. Unauthorized use including reproduction for redistribution requires the permission of the copyright holder. For more information, please contact [email protected].
Proceedings: Second International Conference on c..e Hlltorlelln Geotechnical Engineering, June 1-5, 1988, St. Louis, Mo., Paper No. 2.03
Engineering Design of Rock Slope Reinforcement Based on Non-Linear Joint Strength Model Stavros C. Bandls Lecturer of Geotechnical Engineering, Dept. of Clvl Engineering, Faculty of Engineering, Arlltotellan University, Thelalonlk~ Greece
SYNOPSIS: Optimum dimensioning of bolts or anchors for the reinforcement of slopes in jointed rock masses. requires compatible strength-deformation data. for both the ·rock joints and the reiforcing elements. Most types of rock joints behave in non- linear fashion and. thus. realistic modelling can have serious implications in the design. both from the economical and the technical standpoints . This paper will present. briefly. the principles of a constitutive model of joint shear behaviour and a method for optimum bolt or anchor design . The implications of non-linear joint behaviour will be demostrated with numerical examples. Finally. a case study of slope stabilization. in which the method was adopted. will be reported.
INTRODUCTION
Statics show. that the minimum tensioning force for the support of a rock mass resting . on an inclined plane. requires. if moments are neglected. an optimum angle of installation ca> w.r.t. the failure plane. given by:
tana - (1/F) * tan• (1)
where 9 is the friction angle along the contact interface and F is the safety factor. Depending upon the desired stiffness of the reinforcing system to be installed. the choice of the design value of 9. must be made in accord with the amount of shear deformation. which the reinforcing element would be capable of tolerating.
In some rock slope engineering problems. it may prove advantageous to allow a certain amount of deformation. thus dissipating a portion of the excavation induced shear stress. In addition. shearing may also initiate an efficient self-draining process within the rock mass.effected by the openning of dilating joints. By implication. the designer should be able .. to quantifY the changes in shear behaviour at corresponding stages of joint deformation.
The non-linear constitutive model for the shear behaviour of joints reported by Bandis et al. (1981). Barton & Bandis (1982). Barton et al. (1985). and Barton and Bandis (198?). offers the basis for a convenient method for bolt design . The method has been described by Barton and Bakhtar (1983) and Bandis et al. (1985) and is based on a concept of "mobilized" friction. by which the shear strength available at various stages of shear deformation. can be quantified.
NON-LINEAR MODEL OF JOINT SHEAR BEHAVIOUR
The shear behaviour of a singly jointed rock block is largely determined by the effective
107
normal stress (on') and the length of the ·joint (Ln). The variations observed in the shear
·properties of different joint types are attributed to differences in the geometric and strength properties of the joint surfaces. i.e. roughness. aperture. wall strength and basic friction.
Four key-indices are required. to fullY model the shear behaviour of an unfilled joint:
(i) the Joint Roughness Coefficient (JRCo). a dimensionless number ranging from 0 for Planar-smooth to 20 for undulating - rough joints:
(ii) the Joint Compressive Strength (JCSo). which 1s the uniaxial compressive strength of the rock material at the joint wall:
(iii) the Angle of Residual Friction (tr) or Basic Friction Ctb) - if the joint is completely fresh. and.
(iv) the Mechanical Aperture (Eo) .
Simple index · tests have been devised to measure JRCo (tilt. pull or push tests). JCSo (Schmidt hammer tests). tr or tb (combination of tilt and S.H. testing) and Eo (flow tests in the field or the lab). The subscript (o) is used to denote the joint length (Lo). which was index tested. Details of the measuring techpiques appear elsewhere (Barton and Choubey. 19??. Barton et. al.. 1985) • Extrapolation of the measured indices to field scale (length Ln). require appropriate scaling conversions:
JR~n ~ JRCo (Ln/LO) -o· 02*~"c• •.•••.• (2)
JCSn~ JCSo (Ln/Lo) -o.o~*~"c• •••••.• (3)
The peak shear strength (Tpeak) of a joint can be predicted from Barton's (19?3) criterion:
Second International Conference on Case Histories in Geotechnical Engineering Missouri University of Science and Technology http://ICCHGE1984-2013.mst.edu
The latter is attained displacement, Ah {peak):
at a peak shear
Ln [ JRCn J -o • :s:s Ah{peak) - '"""50'0 ---r;n ...... (5)
The shear strength mobilized at any displacement, !h can be expressed bY:
given
or IP(mob) • JRC(mob) * log~o{ J~~) + IPr ... (7)
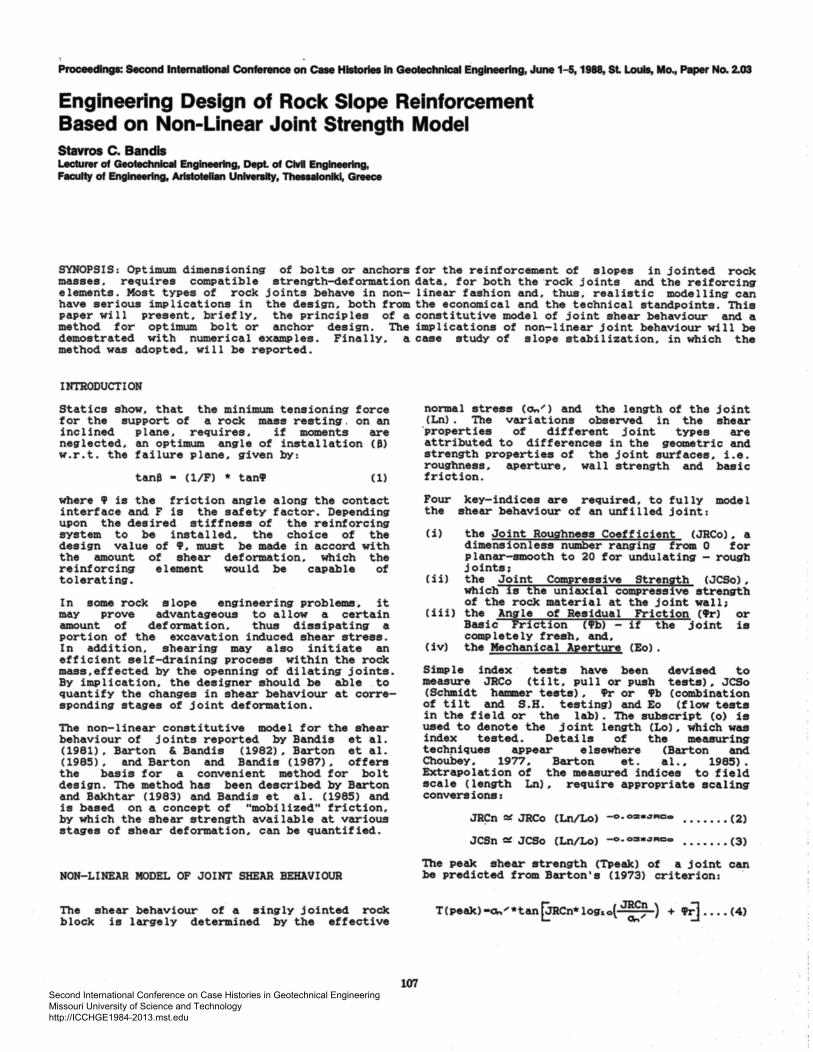
The model following behaviour:
illustrated in Fig. 1 simulates the fundamental features of joint shear
(i} mobilization of the basic: frictional resistance, upon initiation of shear
(ii) the amount of initial shear for roughness mobilization is scale dependent (~0.3* Ahpeak).
(iii) dilation begins when roughness is mobilized.
(iv) peak shear strength is reached at JRC(mob)/ JRC(peak)•1.0 and Ah/ll.h(peak)•1.0.The peak shear displacement,Ah(peak),corresponds to 1% of the joint length. A value of !h/Ah (peak)•2 has been adopted for relatively smooth and planar joints {JRC<5).
(v) the. contribution of roughness declines in the post - peak region, owing to surface mismatch and wear.
{vi) the residual state (JRC mob•O) is reached after large shear displacements {ll.h/!hpeak •100}.
i
1.0
0.8
0.6
0.4 .. .2- 0.2 :i!
' 0 :;:; .! -0.2 ..... IX -. -0.4 I
.. . 0
.-.1 • . · ,
5.0
Fig. 1. Dimensionless model of joint shear behaviour (from Barton & Bandis, 1987) .
Dilation can be modelled utilizing an expression quite similar to {4):
d~{mob) • 1/2 JRC(mob) * log~o( ~S ) .•... (8)
The increase of associated with from:
the mechanical aperture (Eo) dilation can be calculated
6Eo • 6(ll.h) *tan dn° (mod) ....... {9)
Numerical examples of model application are given in Fig.2
BOLT DESIGN BASED ON NON-LINEAR JOINT MODEL
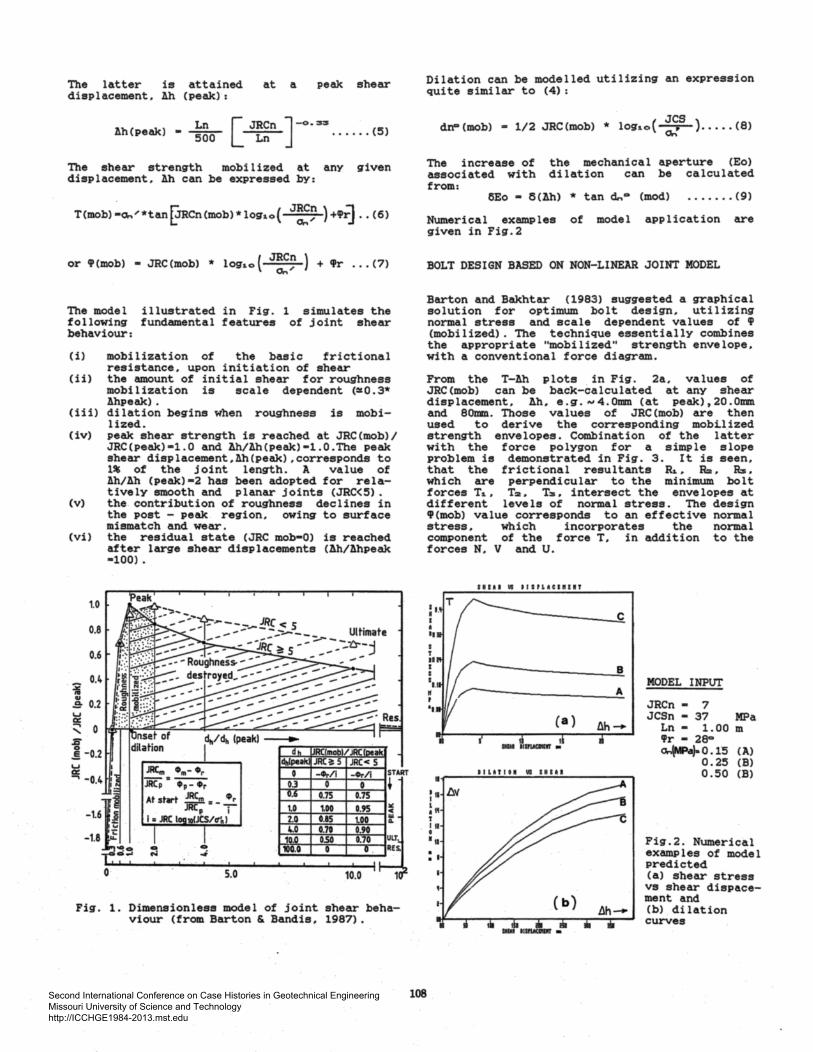
Barton and Bakhtar (1983) suggested a graphical solution for optimum bolt design, utilizing normal stress and scale dependent values of 9 (mobilized). The technique essentially combines the appropriate "mobilized" strength envelope, with a conventional force diagram.
From the T-Ah plots in Fig. 2a, values of JRC{mob) can be back-calculated at any shear displacement, Ah, e.g ..... 4.0um {at peak),20.0um and 80mm. Those values of JRC(mob) are then used to derive the corresponding mobi.lized strength envelopes. Combination of the latter with the force polygon for a simple slope problem is demonstrated in Fig. 3. It is seen, that the frictional resultants ~, Ra. R:s. which are perpendicular to the minimum bolt forces T~. T2, T:s, intersect the envelopes at different levels of normal stress. The design IP(mob) value corresponds to an effective normal stress, which incorporates the normal component of the force T. in addition to the forces N, V and U.
108
I T. Jl J I .... I(
• ••
II
:•• ~ .. T Ill • •• . ••
IILlTIU VI lUll
.o.v
c
8
A MODEL INPUT
JRCn • 7 JCSn • 37 MPa
Ln • 1.00 m IPr • 28° a...lf.Fa)a 0.15 (A)
0.25 {B) 0.50 (B)
Fig.2. Numerical examples of model predicted {a) shear stress vs shear dispacement and (b) dilation curves
Second International Conference on Case Histories in Geotechnical Engineering Missouri University of Science and Technology http://ICCHGE1984-2013.mst.edu
10m 1--.J
L0 •tO m
Tr• 0.025 HH/m3 W• 22.0 HN/., v •1.5 HN/m U • 6.0 HN/m
fR, 1i
Fig. 3. Example of graphical solution for optimum bolt design using normal stress and scale dependent values of ' (mobilized) (from Bandis et. al. 1985) .
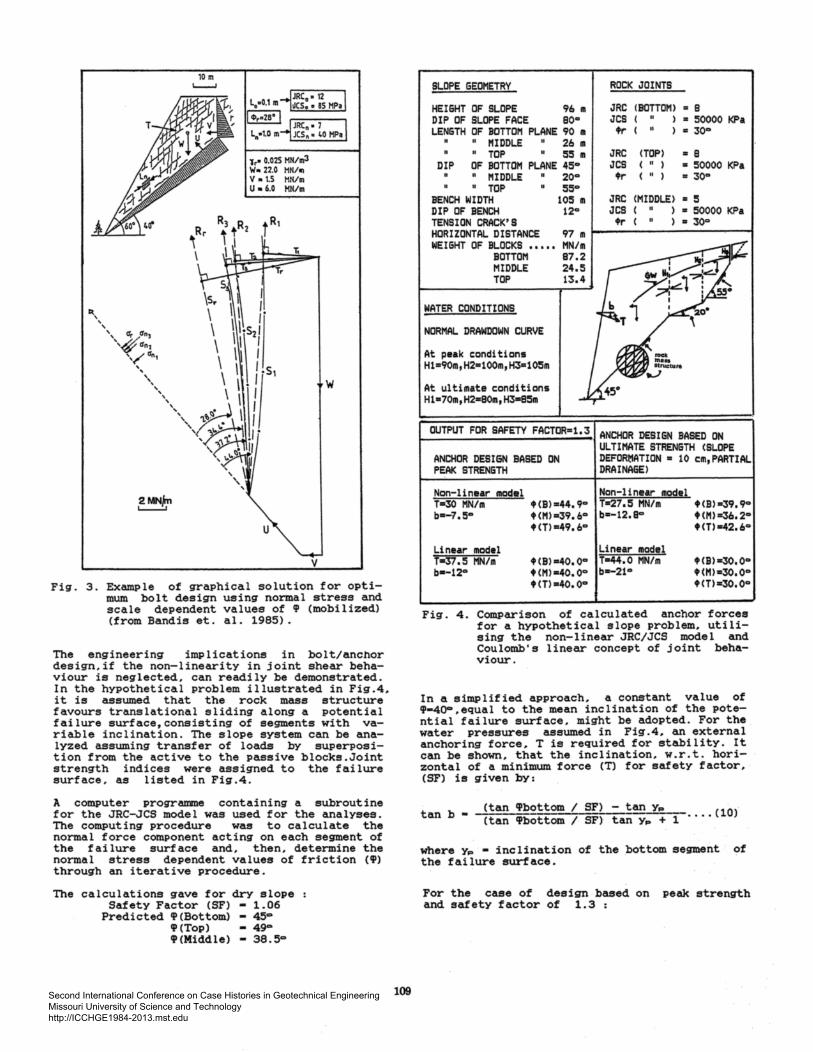
The engineering implications i n bolt/anchor design, i f the non-linearity in joint shear behaviour is neglected, can readi ly be demonstrated. In the hypothetical problem illustrated in Fig.4, it is assumed that the rock mass structure favours translational sliding along a potential failure surface,consisting of segments with variable inclination . The slope system can be analyzed assuming transfer of loads by superposition from the active to the passive blocks.Joint strength indi ces were assigned to the failure surface . as listed in Fig .4 .
A computer programme containing a subrouti ne for the JRC- JCS model was used for the analyses. The computing procedure was to calculate the normal force component acting on each segment of the failure surface and, then. determine the normal stress dependent values of friction (') through an iterative procedure.
The calculations gave for dry slope Safety Factor (SF) - 1 . 06
Predicted '<Bottom) 45° '<Top) - 49'" '(Middle) • 38.5°
109
SLOPE GEOMETRY
HEIGHT OF SLOPE 96 • DIP OF SLOPE FACE 80° LENGTH OF BOTTOM PLANE 90 a
" MIDDLE 26 II
" TOP :s:s Ill DIP OF BOTTOM PLANE 4:5 ..
" MIDDLE 20° " TOP :s:so
BENCH WIDTH 10:5 II DIP OF BENCH TENSION CRACK'S HORIZONTAL DISTANCE WEIGHT OF BLOCKS,,,,,
BOTTOM MIDDLE TOP
WATER CONDITIONS
NORMAL DRAWDOWN CURVE
At peak conditions H1•90m1 H2•100m,H3•10:Sm
At ultimate conditions H1•70m1H2•80.,H3-8:Sm
12°
97 m MN/m 87.2 24.:5 13.4
OUTPUT FOR SAFETY FACTOR•1. 3
ANCHOR DESIGN BASED ON PEAK STRENGTH
ROCK JOINTS
JRC <BOTTOM> • 8 JCS ( ) • :soooo KPa tl-( ) • 30°
JRC !TOP> • B JCS ( " ) • :50000 KPa tr ( " ) • 30°
JRC <MIDDLE> • :s JCS ( " ) • 50000 KPa tr ( " ) • 30°
ANCHOR I>ESIGN BASED ON ULTIMATE STRENGTH <SLOPE DEFOR~ATION • 10 cm,PARTIAL DRAINAGE)
Non-linear 110d•l T•30 MN/m b•-1.:S·
Non-linear model t<BI•44.9 .. T-27.:5 MN/111 t(M)•39.6 .. b•-12.8'" t<T>-49.6•
t<Bl•39,9'" t(l1)•36.2° t<T>-42.6°
Linear model T•37. :S MN/111 b•-12°
Linear 111odel t(Bl-40.0.. T•44.0 MN/m t<H>-40.0 .. b•-21 .. t<T>•40.0 ..
t<B>•30.0 .. t<M>•3o.o• t<T>•30.0•
Fig. 4. Comparison of calculated anchor forces for a hypothetical slope problem, utilising the non-linear JRC/JCS model and Coulomb's linear concept of joint behaviour.
In a simplified approach, a constant value of t•400,equal to the mean inclination of the potential failure surface, might be adopted. For the water pressures assumed in Fig.4, an external anchori ng force. T is required for stability. It can be shown, that the inclination, w.r . t . horizontal of a minimum force (T) for safety factor, (SF) is given bY:
tan b • (tan lpbottom I SF) - tan y,. · (tan lpbottom 1 SF) tan y,. + 1 ····<10>
where y,. • inclination of the bottom segment of the failure surface.
For the case of design based on peak strength and safety factor of 1.3 :
Second International Conference on Case Histories in Geotechnical Engineering Missouri University of Science and Technology http://ICCHGE1984-2013.mst.edu
T - 30.0 MN/m I b - -7 .5"' •...... non-linear model
and T - 37. 5 MN/m J b - -12° ....... linear model
For the case of design based on ultimate strength, the following were assumed:
~h - 100 mm (slope deformation) Ln • 1.0 metre (in-situ block length)
JRC(mob) BOTT - 5.5 } JRC(mob) TOP - 5.5 non-linear model in JRC(mob) MIDD - 3.5 Fig. 1.
The calculated anchor force for SF•1.3 and water conditions as originally
T • 37.0 MN)'m b - -12"'
If we assumed that the normal drawdown GW curve was lowered by 20% due to self-draining, then :
T • 27.5 MN/m b - -21 ..
Finally, if conservative then
the deformed slope was assigned a residual friction angle ~-300,
T • 44.0 MN/m b- -21°
The above examples indicate a conservative overestimation of T between 25 and 40%, depending on the mode of joint behaviour and the conditions assumed.
CASE STUDY OF ROCK SLOPE REINFORCEMENT
Background information.
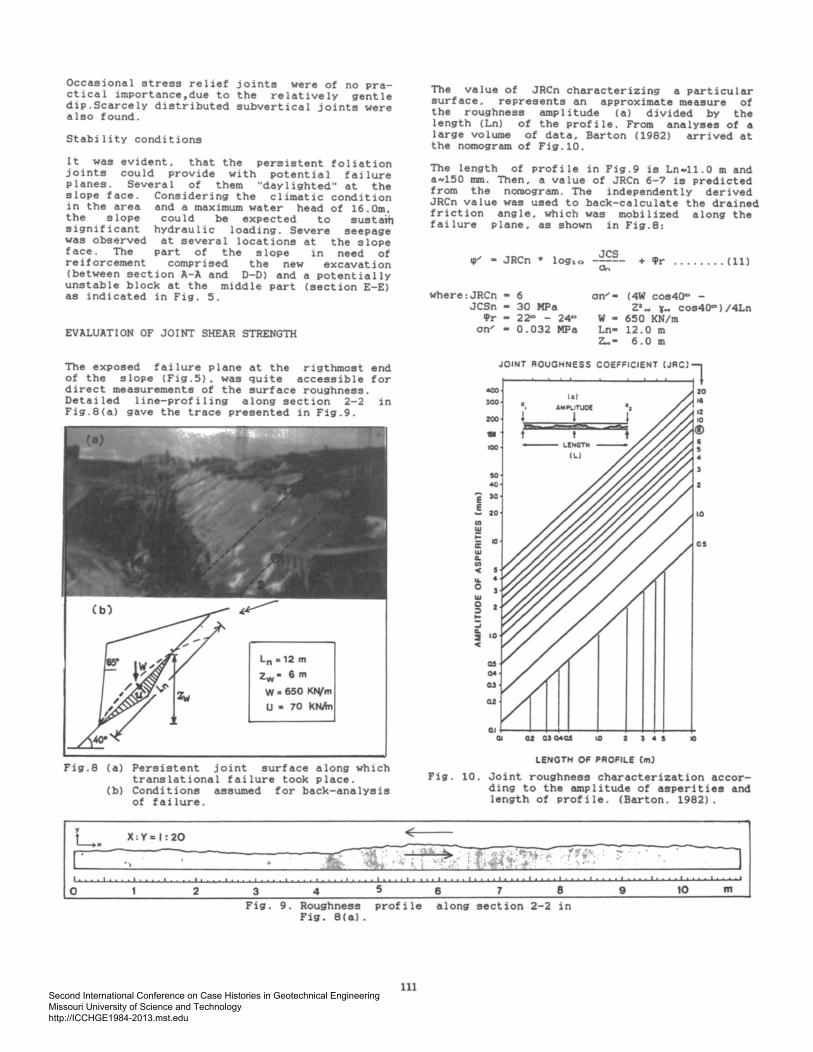
In November 1985 and during the excavation of a new slope face in a drydock at Stavanger, Norway, problems of instability were · encountered in the form of translational sliding failures (Figure 5). The slope (0 . 0-12.0 in height and•50.0 in length) had a major functional role, bearing the foundation loads of a back-filled sheet-pile wall, which acted as sea-water barrier. Figure 6 presents a vertical section along the final slope line, as appeared in the "good for construction" plans.
Fig. 5. General view of preexisting slope and new excavation (R. H. half).
110
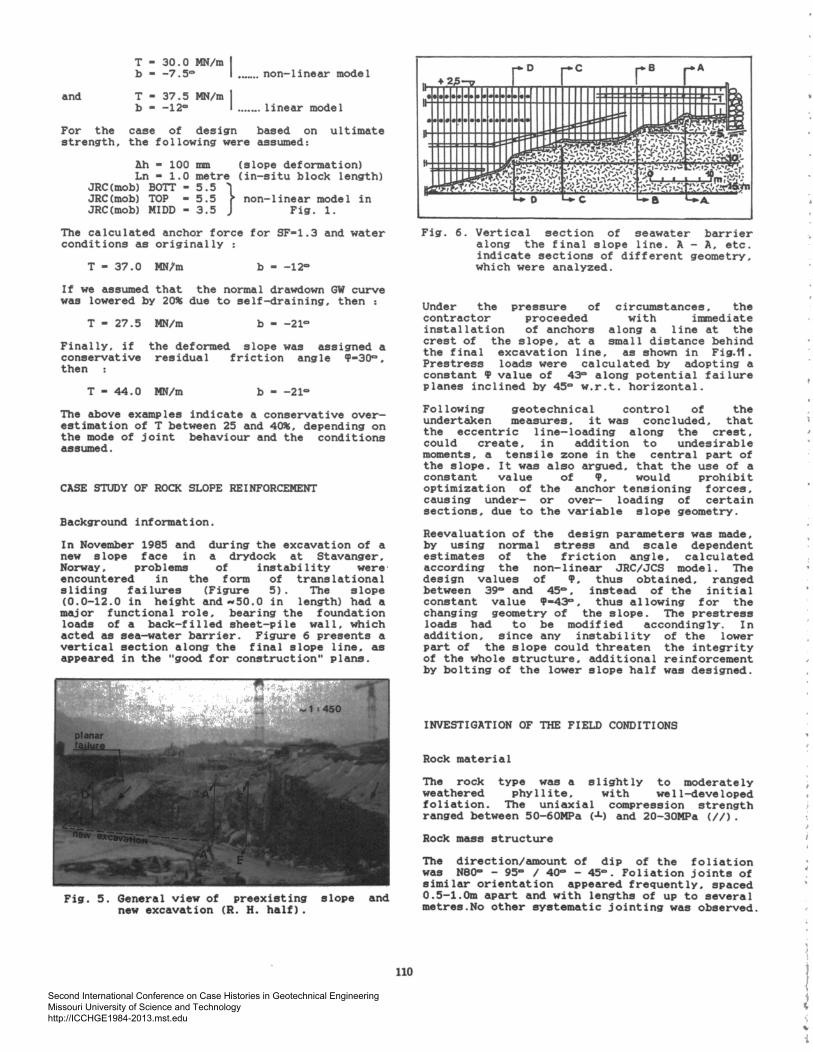
Fig. 6 . Vertical section of seawater barrier along the final slope line. A - A, etc. indicate sections of different geometry, which were analyzed .
Under the pressure of circumstances, the contractor proceeded with immediate installation of anchors along a line at the crest of the slope, at a small distance behind the final excavation line, as shown in Fig.11. Prestress loads were calculated by adopting a constant ~value of 43<> along potential failure planes inclined by 45"' w.r.t. horizontal.
Following geotechnical control of the undertaken measures, it was concluded, that the eccentric line-loading along the crest, could create, in addition to undesirable moments, a tensile zone in the central part of the slope. It was also argued, that the use of a constant value of ~. would prohibit optimization of the anchor tensioning forces, causing under- or over- loading of certain sections, due to the variable slope geometry.
Reevaluation of the design parameters was made, by using normal stress and scale dependent estimates of the friction angle, calculated according the non-linear JRC/JCS model. The design values of ~. thus obtained, ranged between 39 .. and 45 .. , instead of the initial constant value ~-43<>, thus allowing for the changing geometry of the slope. The prestress loads had to be modified accondingly. In addition, since any instability of the lower part of the slope could threaten the integrity of the whole structure, additional reinforcement by bolting of the lower slope half was designed.
INVESTIGATION OF THE FIELD CONDITIONS
Rock material
The rock type was a slightly to moderately weathered phyllite, with well-developed foliation. The uniaxial compression strength ranged between 50-oOMPa (~) and 20-30MPa (//).
Rock mass structure
The direction/amount of dip of the foliation was NSOCO - 95"' I 40"' - 45"'. Foliation joints of similar orientation appeared frequently, spaced 0.5-l.Om apart and with lengths of up to several metres.No other systematic jointing was observed.
Second International Conference on Case Histories in Geotechnical Engineering Missouri University of Science and Technology http://ICCHGE1984-2013.mst.edu
Occasional stress relief joints were of no practical importance,due to the relatively gentle dip .Scarcely distributed subvertical joints were also found.
Stability conditions
It was evident. that the persistent foliation joints could provide with potential failure planes . Several of them "daylighted" at the slope face. Considering the climatic condition in the area and a maximum water head of 16.0m. the s 1 ope cou 1 d be expected to sust a1n significant hydraulic loading. Severe seepage was observed at several locations at the slope face. The part of the slope in need of reiforcement comprised the new excavation (between section A-A and D-Ol and a potentially unstable block at the middle part (section E-El as indicated in Fig. 5.
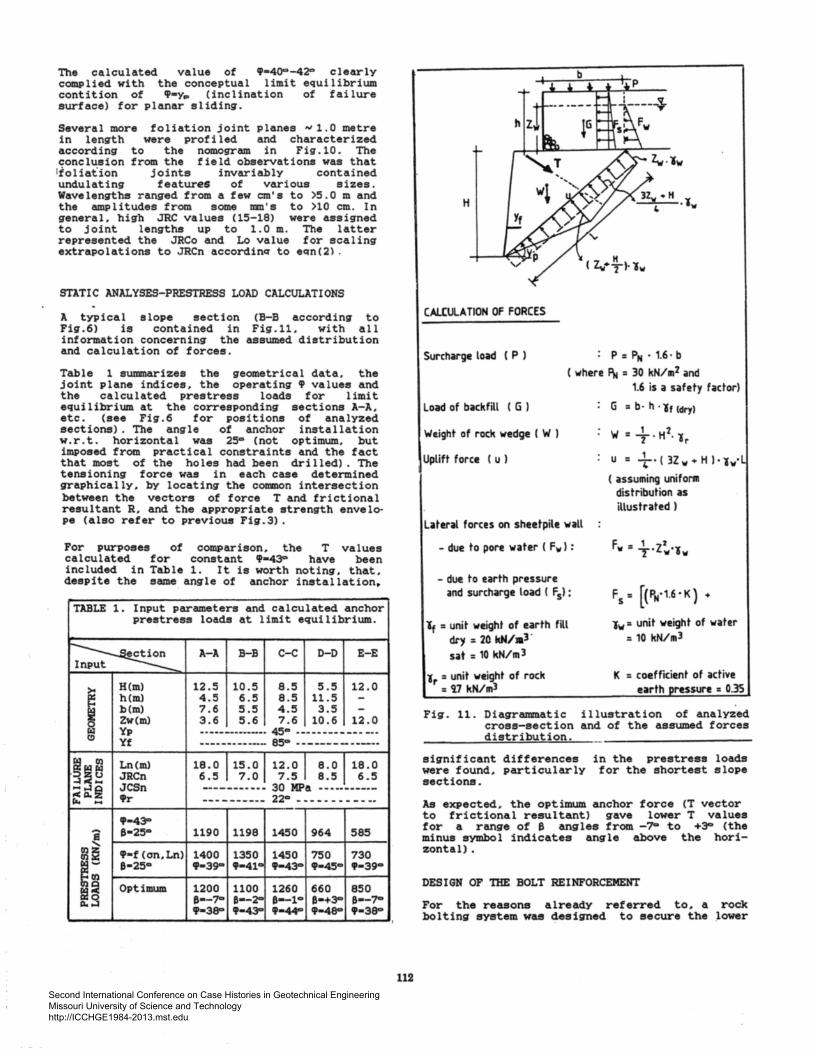
EVALUATION OF JOINT SHEAR STRENGTH
The exposed failure plane at the rigthmost end of the slope CFig.5) . was quite accessible for direct measurements of the surface roughness. Detailed line-profiling along section 2-2 in Fig . 8(a) gave the trace presented in Fig.9.
Fig.8 (a)
(b)
y
L ..
L 0 •12 m
Zw• 6m
Wz650 KI\Vm
u- 70 kHAn
Persistent joint surface along which translational failure took place. Conditions assumed for back-analysis of failure.
X:Y= I :20
• '·I . I •• I I, I,' 0 ,,
1 J e e e J tee
The value of JRCn characterizing a particular surface. represents an approximate measure of the roughness amplitude (a) divided by the length (Ln) of the profile. From analyses of a large volume of data. Barton (1982) arrived at the nomogram of Fig.10.
The length of profile in Fig.9 is LnNll.O m and aN150 mm. Then, a value of JRCn 6-7 is predicted from the nomogram. The independently derived JRCn value was used to back-calculate the drained friction angle, which was mobilized along the failure plane, as shown in Fig.8:
~/ - JRCn * log•o
where:JRCn - 6 JCSn - 30 MPa
'Pr - 22<> - 24<> on/ - 0.032 MPa
JCS 0,.,
wLnz...-
+ lpr •••••••• ( 11)
( 4W cos4Q<> -Z2 w ¥w cos4Q<>)/4Ln
650 KN/m 12.0 m 6.0 m
JOINT ROUGHNESS COEFFICIENT (JRC) ~
.000 Ia)
300 •. AMFI.tTUOE •• 200 s ' I -.. s; • t t
I 100 -LENGTH
5 (\.) •
3 ~ .&(1 2
e 30
.§ 20 lO (I) w ;:::
10 0.5 ir w II. (I)
< 5 ... 0 w 0 2 :l ... ~ II. 2 <
LO a 3 4 5 10
LENGTH OF PROFILE (m)
Fig. 10. Joint roughness characterization according to the amplitude of asperities and length of profile. (Barton. 1982).
fp 1 •' I I t I le
0 2 3 4 5 6 7 8 9 10 m Fig. 9. Roughness profile along section 2-2 in
Fig. 8(a).
111 Second International Conference on Case Histories in Geotechnical Engineering Missouri University of Science and Technology http://ICCHGE1984-2013.mst.edu
The calculated value of t-4~-420 clearly complied with the conceptual limit equilibrium contition of 'P•yp (inclination of failure surface) for planar sliding.
Several more fo 1 iation joint planes "' 1. 0 metre in length were profiled and characterized according to the nomogram in Fig.10. The conclusion from the field observations was that !foliation joints invariably contained undulating features of various sizes. Wavelengths ranged from a few em's to >5.0 m and the amplitudes from some mm's to >10 em. In general, high JRC values (15-18} were assigned to joint lengths up to 1.0 m. The latter represented the JRCo and Lo value for scaling extrapolations to JRCn accordin~ to eqn(2l .
STATIC ANALYSES-PRESTRESS LOAD CALCULATIONS
A typical slope section Fig.6) is contained in information concerning the and calculation of forces.
(B-B according to Fig.11, with all
assumed distribution
Table 1 summarizes the geometrical data, the joint plane indices. the operating 'P values and the calculated prestress loads for limit equilibrium at the corresponding sections A-A. etc. (see Fig.6 for positions of analyzed sections}. The angle of anchor installation w.r.t. horizontal was 25• (not optimum. but imposed from practical constraints and the fact that most of the holes had been drilled) . The tensioning force was in each case determined graphically, by locating the common intersection between the vectors of force T and frictional resultant R. and the appropriate strength envelope (also refer to previous Fig.3).
For purposes of comparison. the T values calculated for constant 'P•43P have been included in Table 1. It is worth noting. that, despite the same angle of anchor installation.
TABLE 1. Input parameters and calculated anchor prestress loads at limit equilibrium.
~ A-A B-B c-c D-D E-E t
I H(m) 12.5 10.5 8.5 5.5 12.0 h(m) 4.5 6.5 8.5 11.5 -b(m} 7.6 5.5 4 .5 3.5 -Zw(m) 3.6 5.6 7.6 10.6 12.0
{g Yp ------------·-· 45• ---------------Yf ------------- 85• --------------
~s~ Ln<ml 1~~~_1_~?:~.1 :~:L~ ;~~--'-~-~:~ JRCn ... ..:I@ JCSn ~ca. 'Pr 22° - - - - - - - - - - --ra. ... ----------
'P•43"'
~ 8•25° 1190 1198 1450 964 585
m~ 'P•f (on,Ln) 1400 1350 1450 750 730
m: 8•25° cp-39• 9•41" cp-43• t•45° cp-39•
!~ Optimum 1200 1100 1260 660 850 8•-7- 8•-20 8--1 .. 8•+30 8•-7-cp-38"" 9•43"' ,_~ t•4SO 'P•3SO
I
112
H
H ( Z.,tTI·lw
CALCULATION OF FORCES
Surcharge load ( P l : P = PN • 1.6 • b ( where P)j = 30 kN/1112 and
1.6 is a safety factor)
Load of backfill ( G I G = b· h · lr !dryl
Weight of rock wedge ( W l W = +. H2• lr
Uplift force ( u l u = +· ( 3Zw + H l·tw•L
Lateral forces on sheetpile wall
- due to pore water ( F., l :
- due to earth pressure and surcharge load ( Fsl :
lt = unit weight of earth fill dry = 20 kN/al · sat = 10 kN/m3
lr = unit weight of rock = '17 kN/ml
( assuming uniform distribution as illustrated l
F _ 1 2z ., • T' v'lw
Fs = [(PN·1.6·K) +
lw = unit weight of water = 10 kN/ml
K = coefficient of active earth ressure = 0.35
Fig. 11. Diagr~atic illustration of analyz~d cross-section and of the assumed forces distribution.
significant differences in the prestress loads were found. particularly for the shortest slope sections.
As expected. the optimum anchor force (T vector to frictional resultant) gave lower T values for a range of 8 angles from -?- to +3- (the minus symbol indicates angle above the horizontal}.
DESIGN OF THE BOLT REINFORCEMENT
For the reasons already referred to. a rock bolting system was ~esigned to secure the ~ower
Second International Conference on Case Histories in Geotechnical Engineering Missouri University of Science and Technology http://ICCHGE1984-2013.mst.edu

art of the slope. at the final excavation ine. Limiting equilibrium analyses t.•~re ~nducted for the slope sections A-A to ~-D. f assuming a tension crack at the zone of ~tential relaxaion and perpendicular to the silure plane. as illustrated in Fig.12(a).
!pending upon the geometry of the slope !Ction. the calculated minimum bolting forces
equilibrium ranged between 510 KN/m (A-Al ld 64 KN/m (0-D) . The corresponding design f 1lues were between 45° and 54° and the optimum :~f~llation angles 8 were oo-go (see Fig.
Illy-grouted. untensioned bolts of 250 kN •Pacity (f24mml were recommended for instal.tion in a pattern with similar lateral .d vertical spacing (2x2 m ) . A total of > 50 lt units were installed (Fig. 13). Drainage l~s were also drilled during bolt installation. r1zontally spaced at 5-6 metres and drilled at ·o different levels.
nally. the photograph in Fig.14 shows the chor reinforced unstable block in the middle the slope ( section E-E in Fig. 5). Since
mpletion of the reinforcing measures. the ope has presented with no further problems.
(a)
lr = 27 kN/ml
w :...L·l· z "l l " r 1 1
V =T··Z,.·t.,
ll =+·Z,·l·lw
Calculated total bolting force at equilibrium.
A-A
B-8
_c-c D-D
J. 12.
8•510 KN/m 5• 00 8•330 KN/m 5• 2"> 8•190 KN/m 5• 4° 8• 64 KN/m 5- 9°
Illustration of (a) assumed slope geometry forces for bolt design ( active pressure from upper slope-half considered equal to zero):(b) recommended bolt direction and position of drainage holes
118
Fig. 13. Rock slope face at the final excavation line reinforced with bolts.
Fig. 14. Anchor reinforced unstable block in section E-E.
CONCLUDING REMARKS
1. The choice of linear or non-linear model for the shear behaviour of joints. has significant implications upon the design of reinforcing systems for unstable rock slopes.
2. A constitutive non-linear model based on simple indices ( JRC. JCS.fr l. can be used to calculate the optimum angle of installation for a minimum prestress load.
Second International Conference on Case Histories in Geotechnical Engineering Missouri University of Science and Technology http://ICCHGE1984-2013.mst.edu
3. The model predicted value for ~ depends upon the normal stress, the scale of joints and the amount of shear deformation. The effects of all applied forces can be allowed for, by using either a graphical solution or an iterative numerical technique for relatively complex failure surface geometry.
4. The reported case study of slope reinforcement revealed good agreement between model predicted and back-calculated friction values of a failed slope section. Comparisons between conventional anchor design and the suggested method, indicate potential over- or under-loading, if non-linearity is ignored.
ACKNOWLEDGMENTS
The case history included in this paper was part of NGI Coutract Project No. 85060-1/1986. Permission to publish the material is acknowledged with appreciation.
REFERENCES
Bandis, S.C .• Lumsden, A.C. and N. Barton (1981) : Experimental studies of scale effects on the shear behaviour of rock joints. Int.J. Rock Mechs. Min. Sci. & Geom. Abstr., 18: 1-21.
Bandis, S.C., Barton, n. and M. Christianson (1985) :Application of a new numerical model of rock joint behaviour to rock mechanics problems Proc. Intern. Symp. on Fundamentals of Rock Joints, Bjorkliden, Sweden : 345-355.
Barton, N. R. 1973. "Review of a new shear strength criterion for rock joints",Engineering Geology 7 :287-332.
Barton, N. and V. Choubey (1977): The shear strength of rock joints in theory and practice. Rock Mechanics, 10 : 1-54.
Barton, N. and Bandis S.C. (1982): Effects of block size on the shear behaviour of jointed rock. Keynote Lecture. 23rd U.S. Symposium on Rock Mechanics, Berkeley, California.
Barton, N. and K. Bakhtar (1983): Bolt design based on shear strength. Proc. Intern.Symp, on Rock Bolting. Abisko, Sweden : 367-376.
Barton, N. Bandis, S.C. & K. Bakhtar (1985): Strength, deformation and conductivity coupling of rock joints. Int.J. Rock Mechs. Min. Sci & Geom. Abstr., 22(3) :121-140.
Barton, N. and S.C. Bandis (1987): Rock joint model for analyses of geological discontinua. 2nd Int. Conf. on Constitutive Laws for Engineering Materials: Theory and Applications Tuscon, Arizona.
114
Second International Conference on Case Histories in Geotechnical Engineering Missouri University of Science and Technology http://ICCHGE1984-2013.mst.edu