Engineering application of thrust block T analysis in ... · cut can also play important roles in...
19
T r a n s a c t i o n P a p e r Introduction Every rock or soil slope cut in open pit mining is susceptible to instability and eventual collapse. Open pit coal mines in South Africa are rarely deeper than 50–60 m, while examples of massive porphyry deposits such as Palaborwa and the copper-gold deposits in the Chilean Andes may be mined from pits deeper than 500 m. The pit sides in such instances are composed of a series of staggered highwalls or slopes stacked upon each other, much like a staircase, with the flat portions intervening between slopes known as benches. In many cases, each highwall or slope is vertical for economic and technical reasons. The overall pit slope angle is defined by a straight line that joins the crests of successive highwalls or slopes up the sides of the pit. Highwall failure is an occurrence where rock or soil composing the highwall collapses, topples, slumps, or slides out. Not only is this dangerous, it forces a mine to perform some out-of-schedule clearing up, which can in some instances affect production plans, and therefore revenues, severely. Unlike other engineers, mining engineers cannot choose their materials, that is, they must design and cut their slopes in the rocks and soils that are present to access the mineral resource they wish to extract. Economically, it is obvious that the slope angles must be as steep as possible in order to remove as little overlying soil and rock as possible, while at the same time the slope angles must be flat enough to reduce the possibility of failure to an acceptable minimum. Designing a pit slope in order to strike the correct balance between economics and safety in open pit mines is called pit slope engineering. The more general term rock slope engineering includes not only mining applications but also civil engineering applications, such as road cuttings in hillsides. The factors that reduce pit slope stability, and therefore increase the probability of failure, are mining-induced, geological, and hydrological in origin. Most pit slopes are inhomogeneous structures comprising anisotropic layers of soil and rock charac- terized by different material properties. In addition to the variability of the properties of the natural materials, they are in various states of decomposition from weathering and Engineering application of thrust block analysis in slope stability problems in open pit mines by K.N. Karparov* and M.F. Handley † Synopsis The classical limit equilibrium methods are suspected to be ineffective in predicting the potential for highwall failure in many instances in coal mines around the world. Slope engineers have for many years recognized a block thrust failure mechanism for slope failures, but little work had been done before 2000 to explain the actual mechanisms which must be responsible for the failure. The main reason for this is that limit equilibrium methods implicitly assume rigid blocks, and the resulting force equations must be satisfied everywhere simultaneously for them to have any meaning. This paper will show that the material involved in the slope failure is not rigid; indeed it undergoes considerable permanent deformation during failure. This observation allows the authors to treat the block boundaries independently, because they need not maintain a constant spatial relationship with one another, as is assumed in other methods. To enable analysis of this type the authors assume that the weight of the blocks is evenly distributed. This is reasonable, because the slope material is not strong enough to be self-supporting without some sort of constraint, or strong enough to be able to apply point loads to the surrounding material. The purpose of this paper is to extend the practical application of the analytical method developed from mechanism studies to provide an objective assessment of the risk of slope failure, and therefore guidelines for more stable slope designs. This work is based on studies carried out on two failures in an open pit coal mine in South Africa, and provides a methodology to assess the potential for failure more objectively than is possible with currently accepted methods, while at the same time remaining sufficiently simple to allow a ‘back of the cigarette box’ assessment by geotechnical engineers on site. * Agricultural Engineering Services, National Department of Agriculture. † Department of Mining Engineering, University of Pretoria. © The Southern African Institute of Mining and Metallurgy, 2009. SA ISSN 0038–223X/3.00 + 0.00. Paper received Oct. 2008; revised paper received Feb. 2008. 309 The Journal of The Southern African Institute of Mining and Metallurgy VOLUME 109 REFEREED PAPER MAY 2009 ▲ 67-85:Template Journal 6/5/09 11:06 AM Page 309
-
Upload
nguyencong -
Category
Documents
-
view
213 -
download
0
Transcript of Engineering application of thrust block T analysis in ... · cut can also play important roles in...

Transaction
Paper
Introduction
Every rock or soil slope cut in open pit miningis susceptible to instability and eventualcollapse. Open pit coal mines in South Africaare rarely deeper than 50–60 m, whileexamples of massive porphyry deposits suchas Palaborwa and the copper-gold deposits inthe Chilean Andes may be mined from pitsdeeper than 500 m. The pit sides in suchinstances are composed of a series ofstaggered highwalls or slopes stacked uponeach other, much like a staircase, with the flatportions intervening between slopes known asbenches. In many cases, each highwall or slope
is vertical for economic and technical reasons.The overall pit slope angle is defined by astraight line that joins the crests of successivehighwalls or slopes up the sides of the pit.
Highwall failure is an occurrence whererock or soil composing the highwall collapses,topples, slumps, or slides out. Not only is thisdangerous, it forces a mine to perform someout-of-schedule clearing up, which can insome instances affect production plans, andtherefore revenues, severely. Unlike otherengineers, mining engineers cannot choosetheir materials, that is, they must design andcut their slopes in the rocks and soils that arepresent to access the mineral resource theywish to extract.
Economically, it is obvious that the slopeangles must be as steep as possible in order toremove as little overlying soil and rock aspossible, while at the same time the slopeangles must be flat enough to reduce thepossibility of failure to an acceptableminimum. Designing a pit slope in order tostrike the correct balance between economicsand safety in open pit mines is called pit slopeengineering. The more general term rock slopeengineering includes not only miningapplications but also civil engineeringapplications, such as road cuttings in hillsides.
The factors that reduce pit slope stability,and therefore increase the probability offailure, are mining-induced, geological, andhydrological in origin. Most pit slopes areinhomogeneous structures comprisinganisotropic layers of soil and rock charac-terized by different material properties. Inaddition to the variability of the properties ofthe natural materials, they are in variousstates of decomposition from weathering and
Engineering application of thrust blockanalysis in slope stability problems inopen pit minesby K.N. Karparov* and M.F. Handley†
Synopsis
The classical limit equilibrium methods are suspected to beineffective in predicting the potential for highwall failure in manyinstances in coal mines around the world. Slope engineers have formany years recognized a block thrust failure mechanism for slopefailures, but little work had been done before 2000 to explain theactual mechanisms which must be responsible for the failure. Themain reason for this is that limit equilibrium methods implicitlyassume rigid blocks, and the resulting force equations must besatisfied everywhere simultaneously for them to have any meaning.This paper will show that the material involved in the slope failureis not rigid; indeed it undergoes considerable permanentdeformation during failure. This observation allows the authors totreat the block boundaries independently, because they need notmaintain a constant spatial relationship with one another, as isassumed in other methods. To enable analysis of this type theauthors assume that the weight of the blocks is evenly distributed.This is reasonable, because the slope material is not strong enoughto be self-supporting without some sort of constraint, or strongenough to be able to apply point loads to the surrounding material.The purpose of this paper is to extend the practical application ofthe analytical method developed from mechanism studies to providean objective assessment of the risk of slope failure, and thereforeguidelines for more stable slope designs. This work is based onstudies carried out on two failures in an open pit coal mine in SouthAfrica, and provides a methodology to assess the potential forfailure more objectively than is possible with currently acceptedmethods, while at the same time remaining sufficiently simple toallow a ‘back of the cigarette box’ assessment by geotechnicalengineers on site.
* Agricultural Engineering Services, NationalDepartment of Agriculture.
† Department of Mining Engineering, University ofPretoria.
© The Southern African Institute of Mining andMetallurgy, 2009. SA ISSN 0038–223X/3.00 +0.00. Paper received Oct. 2008; revised paperreceived Feb. 2008.
309The Journal of The Southern African Institute of Mining and Metallurgy VOLUME 109 REFEREED PAPER MAY 2009 ▲
67-85:Template Journal 6/5/09 11:06 AM Page 309

Engineering application of thrust block analysis in slope stability problems
groundwater, and they are discontinuous because of jointing,bedding or layering, and other large-scale geologicalstructures such as igneous intrusions, faults, and folds.These composite structures often present unpredictablebehaviour, raising questions about internal processes thattake place once the slope has been cut, and their effect onstresses and deformations within the slope. Changes ingroundwater and weathering processes initiated by the slopecut can also play important roles in slope failure.
Hoek and Bray’s book1 on rock slope engineering is oneof the most recognized in the field of rock slope design, andwas first published 33 years ago. The means for predictingthe potential and size of structurally controlled failures inrock slopes (wedge, plane shear, and step-wedge models) arealso well developed in the CANMET Pit Slope Manual2. Someslope failures observed in South African and Australian coalfields3, involve a layer of weak rock in the slope withthickness approximately ¼ of the slope height. The weaklayer is commonly shale, and is usually exposed at the toe(foot) of the slope, and usually dips toward the pit. Thisfailure mode is characterized by significant downwardmovement of the ground surface behind the slope crest,accompanied by the horizontal thrust of the rock in front of itout into the pit, see Figure 1. The horizontal thrust is usuallyfacilitated by the weak layer dipping toward the pit. Thisfailure mechanism is known as the block thrust mechanism.Similar slope failures to the block thrust mechanism havealso been reported elsewhere4–7.
Skempton and Hutchinson8 defined three major classes ofslope movement, namely falls, slides, and flows. They havedefined a number of schemes of classification, but none caninclude the block thrust mechanism satisfactorily. Stead andScoble9 analysed 226 slope failures that took place in Britishcoal mines, where they found that in about 66% of thefailures, the sliding occurs along a single-, double- or multi-planar surface angled toward the pit (see Figure 2). Becauseof the chaotic nature of a rock slope failure, it is not easy torecognize the mechanism of failure except in the first sixcases shown in Figure 2, which account for only 34% of thefailures studied. The remaining 66% could easily haveincluded block thrust failures of one sort or another.
There are many methods to assess the stability of a rockslope. All these methods can be classified into two groups10:
➤ Limit equilibrium methods➤ Methods based on the upper and lower bound theorems
of plasticity.
This paper considers only the former, namely limitequilibrium methods, but applies them to non-rigid bodies.Generally, limit equilibrium methods analyse the disturbingforces acting on an assumed rigid body defined by imaginaryboundaries within a volume of rock or soil, and comparesthese with the constraining forces. The disturbing forceswould cause the body to move, while the constraining forceswill keep the body in place. In rock, disturbing forces areusually groundwater pressure, the weight of the body underconsideration, and moments in the case of toppling failure.
The constraining forces are friction, rock strength, andstabilizing moments. In limiting equilibrium, the constrainingforces are the maximum they can be, e.g. the rock is loadedto its full strength, and/or the frictional forces are fullymobilized. If the disturbing forces are exactly equal to the
maximum possible constraining forces, the body or mass willbe in equilibrium, but in this case, limiting equilibrium. Limitequilibrium methods therefore evaluate the maximumpossible restraining forces, and then compare these with thedisturbing forces—if the latter are computed to be larger, theanalysis predicts slope failure. If the prediction is wrong, itcould be because of initial assumptions, such as rockproperties, block rigidity, or projected or inferred geologicalstructure in the slope.
The limit equilibrium methods can be divided on two sub-groups: linear and non-linear methods, but the proceduresare broadly similar in concept11. The linear methods ofanalysis, which are most amenable to hand calculation, arethe two-dimensional slope analysis technique adoptingundrained shear strength, the method of slices, and wedgefailure. These methods are simple to use since there is alinear equation for the factor of safety; for this reason theyare extremely useful in practice. The nonlinear limitequilibrium methods apply effective stress analysis of a slope,where the effective stress is to be determined around anassumed failure surface or set of failure surfaces inside theslope. In practice, this is also achievable by dividing thematerial composing the slope into a number of imaginaryslices.
The block thrust mechanism is also a limit equilibriumtechnique, but is more complex than the toppling, sliding, orcollapse mechanisms already mentioned. In this case, awedge-like block with the sharp end down forms in the rock
▲
310 MAY 2009 VOLUME 109 REFEREED PAPER The Journal of The Southern African Institute of Mining and Metallurgy
Figure 2—Typical failure modes, given in percentages, based on 226study cases in coal mines in the United Kingdom (after Stead andScoble9)
Figure 1—Slope and spoil failures reported by Boyd7
67-85:Template Journal 6/5/09 11:06 AM Page 310

mass behind the highwall, by fracture processes that occur asa result of gravity loading and horizontal stresses present inthe highwall. The wedge, by its formation, forms a secondseparate block of rock between the highwall side of thewedge, and the highwall face itself. If the wedge then thrustsdownwards under its own weight, it thrusts the second blockoutwards (i.e. the highwall face) into the pit (see Figure 1).This mechanism is possible only if both blocks aredeformable.
Wright et al.12 undertook a survey in which they listedthe characteristics of all accepted limit equilibrium methods,including the ordinary method of slices13, Bishop’s ModifiedMethod14, force equilibrium methods15, Janbu’s procedure forslices16, the Morgenstern and Price method17, andSpencer’s18 method. There seems to be some consensus thatthe Morgenstern-Price17 method is one of the most reliable ofthese methods. The slices in all these methods are assumedto be rigid, and the normal force acting on the base of anyslice is determined by resolving forces normal to the base ofthe slice. To make the problem determinate, the assumptionis made that the resultant of the interslice forces acting onany slice is parallel to its base.
Unfortunately, the assumptions about the interslice forcesdo not satisfy static conditions and this may lead to anunderestimate of the factor of safety by as much as 60%19,20.Basically, the assumption made about side forces is the mainfactor that distinguishes one limit equilibrium method fromanother, and yet is itself an entirely artificial distinction11.Since all the methods involve simplifying assumptions for acomplex geotechnical environment, the chances of obtainingthe ‘correct’ value of factor of safety will be reduced10. Theseweak points make simple limit equilibrium methodsinapplicable in the back analysis of the above observed slopefailures.
This paper first reviews two slope failures in a SouthAfrican coal mine, and then describes the geological settingand history in which the coal seams formed. The geologicalhistory provides a basis for estimating the expected stressstate in the mine before mining, because stress measurementdata are difficult and expensive to obtain, and are thereforevery scarce. The paper then introduces the thrust failureanalysis Technique as a new approach to slope stabilityprediction in mines, and applies it to the two failuresreviewed earlier.
The thrust failure analysis technique takes geotechnicalconditions into account, including the effects of groundwater,in a simple Newtonian analysis of deformable blocks, whichhave formed in the slope as a result of fracture formationwithin the slope. The second implicit assumption made inthese analyses is that because the blocks are deformable, theforces they exert on their mutual boundaries will be uniformon each boundary segment, and independent of those onother boundary segments. This allows independent forcecalculations for each boundary segment, and henceindependent factor of safety calculations for each segment,that can be weighted by the segment lengths to find anoverall factor of safety for the slope. We conclude that themethod appears to provide more credible results than any ofthe available slope stability methods currently in use, butfurther work into fracture growth in rock within the slope isindicated, because this will elucidate block formationmechanisms, enabling better failure predictions.
Slope failures in a South African colliery
Opencast colliery ‘A’ strip mines three coal seams with anaverage total thickness of approximately 16 m. Figure 3presents the colliery stratigraphic column21, while a mineplan (not reproduced here) shows that underground miningby a previous colliery had left pillars in the middle coal seamin some areas, the bottom coal seam in other areas, with theresult that sometimes there were coal pillars superimposedupon one another in the lower and middle seams. Thesemined seams daylight in the strip mine, and could contributeto slope instability. The upper coal seam was never mined bythe old underground colliery. Two slope failures took placeduring different seasons and in different pits but in bothcases the strata dipped towards the pit, and in both cases,none of the coal seams had been mined previously. Bothfailures took place after the middle coal seam had beenexposed in the pit floor, but before the coal had been mined.
The first case of slope failure took place in Pit A-1 on thecontact between shale and the middle coal seam, both ofwhich dipped at 10° to 12° towards the pit. The top coal seamin the area was very thin (about 1 m thick). The failure tookplace in two stages: the initial failure (involving only thesandy overburden) and the major collapse, which slippedalong the bottom contact of the shale layer above the middlecoal seam. The slope profiles22 before and after failure appearin Figure 4. The initial failure was probably circular becauseapplied limit equilibrium methods for circular failure yielded afactor of safety of 0.72 for the slope.
The major collapse followed the cleaning operations afterthe circular failure, when the slope profile had a flatter slopeangle than it had prior to the circular failure (see Figure 4).None of the rigid-block limit equilibrium methods namedabove predicted failure in the slope after the minor circularfailure had occurred. The major failure indicates a multi-planar or blocky type of failure, but an applied block-
Engineering application of thrust block analysis in slope stability problemsTransaction
Paper
311The Journal of The Southern African Institute of Mining and Metallurgy VOLUME 109 REFEREED PAPER MAY 2009 ▲
Figure 3—Representative stratigraphic column of the strip mine (afterMattushek23)
67-85:Template Journal 6/5/09 11:06 AM Page 311

Engineering application of thrust block analysis in slope stability problems
specified technique used for the slope factor of safetycalculation was not successful because it was higher thanunity, indicating a stable slope. Mine plans from the oldunderground mine did not show any underground miningactivities in the area underneath the failure, hence the twocoal seams below the slope were intact.
Figure 4 shows the slope profile before the major failure,and the profile after failure in red. This is a clear indicationthat the theoretical blocks, marked in grey and labelled A andP for the active and passive blocks respectively, must haveundergone deformation during failure. There must have beendeformations in the slope before the failure, but these werenot sufficiently noticeable to have warned mine personnel,because the failure was very unexpected. The volume of rockin the slope bulked from 1702 m3 per m of slope to 2 444 m3
per m of slope, indicating a bulking factor of 43.6% duringfailure. The conjectured boundary between the active andpassive blocks after failure is given by assuming that boththe active and passive blocks would bulk the same amountduring failure, and then finding the boundary for theequivalent volume in the failed profile. It was also assumedthat there was no mixing of the material from the two blocksduring failure. The outer tensile boundary of the active blockremains more or less in the same place after failure (shownby dark green dashed line to the right), if it is assumed thatthe active block bulks to the same degree as the passiveblock.
What is clear from Figure 4 is that the active block haslost gravitational potential energy, which would haveprovided the thrust of the passive block into the pit. Theoverall loss of gravitational potential energy for the wholeslope is estimated by noting that the centre of gravity of theunfailed slope is 33 m above datum (right-hand red crossedcircle in Figure 4), while the failed slope centre of gravity lies24 m above datum (left-hand red crossed circle). Using theunfailed slope volume given above and assuming a unitweight of 25 kN/m3, the potential energy change duringfailure is estimated at 383 MJ per m of slope.
If the whole slope moved 25 m to the left during failure(this is a crude estimate, because the centre of gravity of thefailed slope is 25 m to the left, but the width of the failedmaterial has increased, while its height has diminished), thenenergy consumption due to friction loss using a friction angleof 10° for the shale-middle coal seam contact is about 187 MJper m of slope. This leaves nearly 200 MJ per m of slope for
breaking the rock up and comminuting it. These calculationsare rather crude estimates, but they indicate that a thrustmechanism is possible, at least from an energy balancecalculation.
The second slope failure took place in Pit A-2 of the samecolliery. Figure 5 presents the slope profile22 before and afterthe failure. Mine spoils in piles between 20 m and 25 m highhad been dumped at a distance of approximately 20 m behindthe slope crest. Any joints that might have been responsiblefor wedge failure were not observed in the area. Without anyvisible indications or warnings of impending failure, the slopecollapsed, and this failure involved the spoils, overburden,top coal seam, and the interburden between the top coal seamand the middle coal seam. This failure also took place aboveunmined ground, after the middle coal seam was exposed inthe pit bottom, but before it was mined.
After the cleaning operations, the failure surface, againon the contact between the shale and the middle coal seam,was clearly visible in the pit. At the site of this failure, thestrata dipped at an average angle of 16° towards the pit. Theestimated factor of safety for circular failure of this slopevaried between 2.4 and 2.6 depending on the method ofcalculation (Fellenius’ Ordinary Method13, Bishop’s ModifiedMethod14, Janbu’s Procedure for Slices16, Morgenstern-Price17, and Spencer18). Clearly, this failure could not havetaken place by a circular mechanism. Using the abovemethods to analyse a block-type of failure mechanism gavevery low safety factor values (0.11 to 0.14 for theMorgenstern-Price17 method). The other methods, such asthe Janbu16 and Bishop14 indicated slightly higher safetyfactors around 0.15, which suggest that the slope would havecollapsed immediately, even while it was being cut. Fellenius’Ordinary Method13 yielded a factor of safety of 1.2, whichcould be considered to be the ‘best’ result, even though it didnot predict failure.
Assessing this slope using the volume-energy approachabove is not so simple, because there is an approximate 1 178 m3 per m of slope missing, if we assume that the spoilpile retains a constant volume during the failure process. Itcould have become compacted during collapse, but this wouldnot account for the discrepancy. It is not clear from communi-cation with the mine22 whether any spoil and sandyoverburden had been removed or not before the failed slopeprofile was measured, and there is no evidence that the spoilpiles became compacted during failure.
▲
312 MAY 2009 VOLUME 109 REFEREED PAPER The Journal of The Southern African Institute of Mining and Metallurgy
Figure 4—Slope profiles in Pit A-1 before and after circular failure, andafter major collapse (after SRK21)
Figure 5—Slope profiles in Pit A-2 before and after major collapse (afterCanady22)
67-85:Template Journal 6/5/09 11:06 AM Page 312
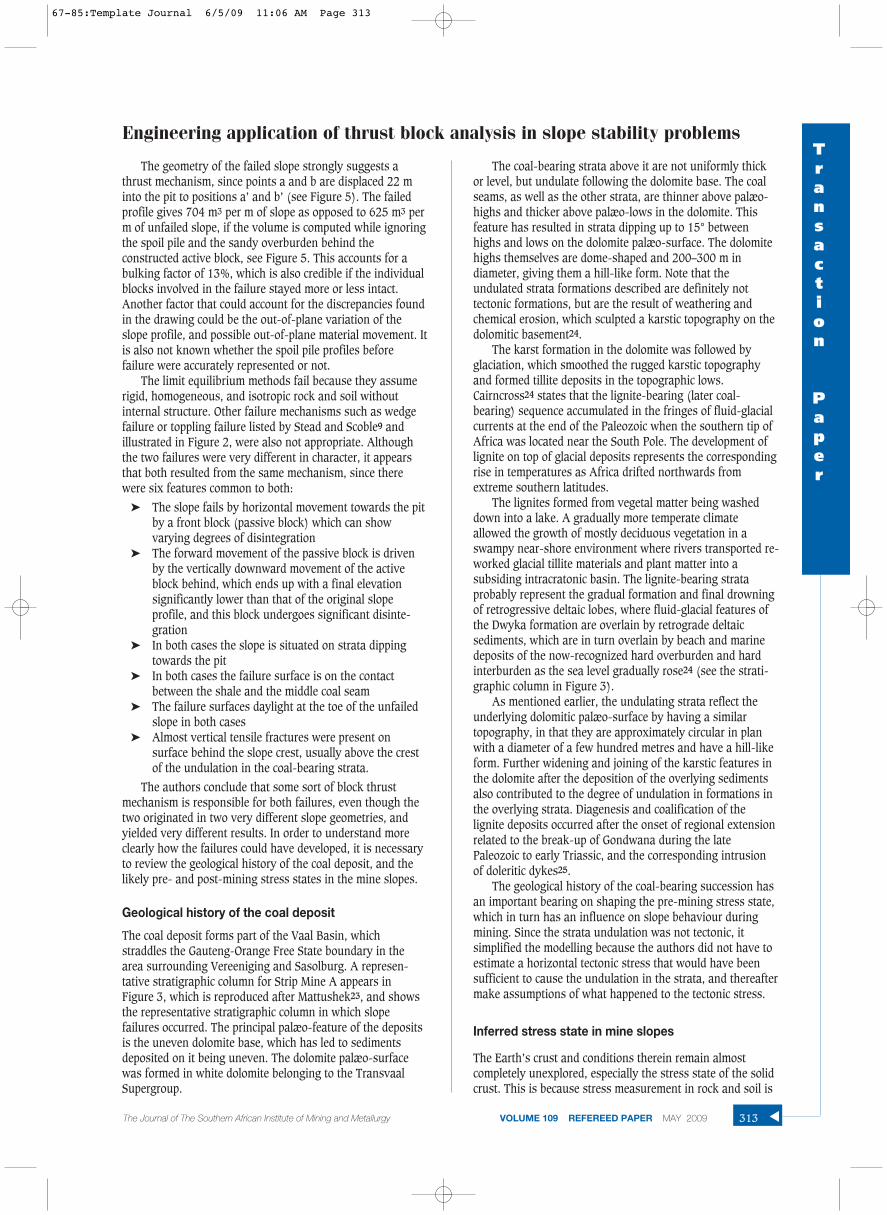
The geometry of the failed slope strongly suggests athrust mechanism, since points a and b are displaced 22 minto the pit to positions a’ and b’ (see Figure 5). The failedprofile gives 704 m3 per m of slope as opposed to 625 m3 perm of unfailed slope, if the volume is computed while ignoringthe spoil pile and the sandy overburden behind theconstructed active block, see Figure 5. This accounts for abulking factor of 13%, which is also credible if the individualblocks involved in the failure stayed more or less intact.Another factor that could account for the discrepancies foundin the drawing could be the out-of-plane variation of theslope profile, and possible out-of-plane material movement. Itis also not known whether the spoil pile profiles beforefailure were accurately represented or not.
The limit equilibrium methods fail because they assumerigid, homogeneous, and isotropic rock and soil withoutinternal structure. Other failure mechanisms such as wedgefailure or toppling failure listed by Stead and Scoble9 andillustrated in Figure 2, were also not appropriate. Althoughthe two failures were very different in character, it appearsthat both resulted from the same mechanism, since therewere six features common to both:
➤ The slope fails by horizontal movement towards the pitby a front block (passive block) which can showvarying degrees of disintegration
➤ The forward movement of the passive block is drivenby the vertically downward movement of the activeblock behind, which ends up with a final elevationsignificantly lower than that of the original slopeprofile, and this block undergoes significant disinte-gration
➤ In both cases the slope is situated on strata dippingtowards the pit
➤ In both cases the failure surface is on the contactbetween the shale and the middle coal seam
➤ The failure surfaces daylight at the toe of the unfailedslope in both cases
➤ Almost vertical tensile fractures were present onsurface behind the slope crest, usually above the crestof the undulation in the coal-bearing strata.
The authors conclude that some sort of block thrustmechanism is responsible for both failures, even though thetwo originated in two very different slope geometries, andyielded very different results. In order to understand moreclearly how the failures could have developed, it is necessaryto review the geological history of the coal deposit, and thelikely pre- and post-mining stress states in the mine slopes.
Geological history of the coal deposit
The coal deposit forms part of the Vaal Basin, whichstraddles the Gauteng-Orange Free State boundary in thearea surrounding Vereeniging and Sasolburg. A represen-tative stratigraphic column for Strip Mine A appears in Figure 3, which is reproduced after Mattushek23, and showsthe representative stratigraphic column in which slopefailures occurred. The principal palæo-feature of the depositsis the uneven dolomite base, which has led to sedimentsdeposited on it being uneven. The dolomite palæo-surfacewas formed in white dolomite belonging to the TransvaalSupergroup.
The coal-bearing strata above it are not uniformly thickor level, but undulate following the dolomite base. The coalseams, as well as the other strata, are thinner above palæo-highs and thicker above palæo-lows in the dolomite. Thisfeature has resulted in strata dipping up to 15° betweenhighs and lows on the dolomite palæo-surface. The dolomitehighs themselves are dome-shaped and 200–300 m indiameter, giving them a hill-like form. Note that theundulated strata formations described are definitely nottectonic formations, but are the result of weathering andchemical erosion, which sculpted a karstic topography on thedolomitic basement24.
The karst formation in the dolomite was followed byglaciation, which smoothed the rugged karstic topographyand formed tillite deposits in the topographic lows.Cairncross24 states that the lignite-bearing (later coal-bearing) sequence accumulated in the fringes of fluid-glacialcurrents at the end of the Paleozoic when the southern tip ofAfrica was located near the South Pole. The development oflignite on top of glacial deposits represents the correspondingrise in temperatures as Africa drifted northwards fromextreme southern latitudes.
The lignites formed from vegetal matter being washeddown into a lake. A gradually more temperate climateallowed the growth of mostly deciduous vegetation in aswampy near-shore environment where rivers transported re-worked glacial tillite materials and plant matter into asubsiding intracratonic basin. The lignite-bearing strataprobably represent the gradual formation and final drowningof retrogressive deltaic lobes, where fluid-glacial features ofthe Dwyka formation are overlain by retrograde deltaicsediments, which are in turn overlain by beach and marinedeposits of the now-recognized hard overburden and hardinterburden as the sea level gradually rose24 (see the strati-graphic column in Figure 3).
As mentioned earlier, the undulating strata reflect theunderlying dolomitic palæo-surface by having a similartopography, in that they are approximately circular in planwith a diameter of a few hundred metres and have a hill-likeform. Further widening and joining of the karstic features inthe dolomite after the deposition of the overlying sedimentsalso contributed to the degree of undulation in formations inthe overlying strata. Diagenesis and coalification of thelignite deposits occurred after the onset of regional extensionrelated to the break-up of Gondwana during the latePaleozoic to early Triassic, and the corresponding intrusionof doleritic dykes25.
The geological history of the coal-bearing succession hasan important bearing on shaping the pre-mining stress state,which in turn has an influence on slope behaviour duringmining. Since the strata undulation was not tectonic, itsimplified the modelling because the authors did not have toestimate a horizontal tectonic stress that would have beensufficient to cause the undulation in the strata, and thereaftermake assumptions of what happened to the tectonic stress.
Inferred stress state in mine slopes
The Earth’s crust and conditions therein remain almostcompletely unexplored, especially the stress state of the solidcrust. This is because stress measurement in rock and soil is
Engineering application of thrust block analysis in slope stability problemsTransaction
Paper
The Journal of The Southern African Institute of Mining and Metallurgy VOLUME 109 REFEREED PAPER MAY 2009 313 ▲
67-85:Template Journal 6/5/09 11:06 AM Page 313

Engineering application of thrust block analysis in slope stability problems
a notoriously difficult and expensive process, and thereforestress data remain rare (see for example Voight26, Gay27,28,Stacey and Wesseloo29, and Sellers et al.30). Rock stressestimates are therefore usually based on fundamental theory,a small number of measurements, and a large amount ofdeduction and inference. In the case of the slope stabilitystudy, slope stress estimation was no different.
In the only references relevant to the coal mine inquestion, Van der Merwe31,32 mentions that horizontal stressnear the surface in coal mines is of the order of twice thevertical stress. The vertical stress in turn, must be equal tothe overburden weight from equilibrium considerations. Inthe absence of any other convincing data, the authors assumethat the horizontal stresses in the slope before it wasexcavated were of the order of twice the vertical stress for thefollowing reasons:
➤ Van der Merwe’s31,32 comments➤ Hoek and Brown33 indicate that horizontal stresses are
between one and three times larger than verticalstresses at shallow depth
➤ The undulations in the coal-bearing strata were theresult of ‘draping’ the strata over a previously uneventerrain rather than folding due to horizontalcompressive stresses.
From the above, the authors assumed a vertical stressequivalent to the overburden weight, and a directionallyisotropic horizontal stress exactly double the vertical stress.In addition to the above, the authors assumed that theunderground coal mine would not have resulted in significantchanges to the original stress state before mining—this isconfirmed by numerical modelling34, but not shown here.Slope failure took place after the slope was cut; hence it wasnecessary to compute the stress state in the slope after it wascut. This was done using the two-dimensional finitedifference scheme FLAC35. The FLAC (Fast LagrangianAnalysis of Continua) model developed contains theundulating geological structure described above, and alsotakes into account the anisotropic properties of the shaleabove the middle coal seam. The other strata in the model areeach assumed to be isotropic, homogeneous, and intact, eventhough they do not all have the same mechanicalproperties34. The slope as a whole is therefore heterogeneous,because it consists of several layers, each with its own set ofproperties.
The mine slope models were developed using the pre-failure profiles shown in Figures 4 and 5 in order to estimatethe stress in the slopes using FLAC35. The stress statesestimated from the model are therefore a result of theundulating geologic structure, excluding the effect of discon-tinuities, tectonic history, and weathering, all of which cannotbe taken into account in the model. The effects ofgroundwater will be detailed and dealt with in the thrustfailure analysis later.
The results of the stress state after mining appear inFigure 6. Figure 6 is a ‘zoom’ into the model of the slope, sothat the stress distribution can be seen more clearly. The‘zoom window’ is shown by a white square in Figure 5, and itcentres on conditions at the base of the wedge. The finitedifference zones appear as green parallelograms, and theprincipal stress tensor in each zone is represented by a crosswhose limb lengths are proportional to the magnitudes of the
stress components, and whose directions represent theprincipal stress directions. The stress state at the base of thewedge in Figure 4 is not significantly different, and is notshown here. The stress state shown is that for a continuumand therefore represents the stress state that would haveexisted in the slope before the blocks had formed. The mostimportant features of the stress distribution are:
➤ The formation of a tensile horizontal stress near thesurface behind the slope (not shown, because a plot ofthe whole slope would be too cluttered to see anydetail)
➤ The rotation of the stress tensor to lie parallel with theinclined strata
➤ The discontinuous change (at this level of approxi-mation) in magnitude of the minor principal stress—parallel to the strata—between the shale and thesandstone
➤ The continuity of the stress tensor across the shale-coalcontact
➤ The uniformity of the stress state in each stratumbecause of the rock material deformability.
These features are critical to the development of thefailure model for the slope, and they support our assumptionthat the stresses on the block boundaries will be uniform,and independent of each other.
Block formation in mine slope
Unexpected slope failures occurred in two instances, in bothof which it is probable that active and passive blocks werefirst formed by the growth of failure surfaces within the slopeafter it had been cut. These failure surfaces combined to formindependent deformable blocks, which were sufficientlyunstable to result in the collapse of the slope into the minepit. Although underground mining had taken place on themiddle and bottom coal seams before the strip minecommenced operations, neither of the slope collapses tookplace over mined ground. Therefore the effect of minedground on slope stability will no longer be considered in thispaper, but interested readers can consult Karparov34 forfurther details.
▲
314 MAY 2009 VOLUME 109 REFEREED PAPER The Journal of The Southern African Institute of Mining and Metallurgy
Figure 6—Principal stress distribution in slope before slope collapse
67-85:Template Journal 6/5/09 11:06 AM Page 314

Vertical fractures
Vertical tensile fractures commonly develop in the groundbehind a mine slope crest, and the coal mine in question wasno exception. The stress modelling confirms that tensilecracks should develop, as shown in Figure 7, which presentsa plot of the horizontal stress component along a verticalprofile line above the crest of the undulating formation. Thereis a significant increase in the tensile stress componenttogether with an increase in depth of the tensile zone when aslope has been cut. The significance of these results is thatconditions conducive to surface tensile cracking aregenerated by a combination of mining and the subsurfacegeological structure.
In a series of very detailed model studies on slopefailures, Barton36 found that the tension crack behind theslope crest was generated by small movements within therock mass, and that it appeared after slope excavation.Although these individual movements were very small, theircumulative effect was a significant displacement of the slopesurface—sufficient to cause separation of material behind theslope crest and to form tension cracks. The vertical activeblock boundaries are defined by vertical tensile cracks. Wetherefore assume the existence of these fractures beforefailure, because they are favoured in the model, and havebeen observed in the coal mine in question, both at the slopefailures, and elsewhere.
Failure surface on shale–middle coal seam contact
Failure in rock is still poorly understood because of thevariety and complexity of processes that lead to it. State-of-the-art finite difference schemes such as FLAC35 are not ableto produce credible failure results for rock because the rockmass material in the model is assumed to be continuous,even if heterogeneity and anisotropy have been taken intoaccount. The modelled rock material remains continuousthroughout, even after modelled failure. In contrast, rockmaterial in reality would shear and fracture, therebybecoming more discontinuous during the process of failure.Hence model results diverge from reality once the materialstarts to break up. Since the models on their own are unableto confirm slope failure in the geotechnical conditionsdescribed above, investigation into the mechanisms throughwhich failure can eventually result along the shale-middlecoal seam contact are indicated, and are briefly discussedbelow.
Although it is not a central theme to the study,Karparov34 investigated how a failure surface could developon the shale-middle coal seam contact by recourse to thestudy of thin sections of the shale under the microscope,fracture mechanics theory, and the modelled stress state inthe slope after mining, and before slope collapse. This workdid not produce incontestable results, but it does point topossible mechanisms by which a failure surface could slowlydevelop along the shale-middle coal seam contact. Thissurface is clearly central to the slope collapse (see Figures 4and 5), and because the collapsing rock mass slid on it, anydelicate features that may have pointed to the mechanism ofits formation have been obliterated. Even though themechanism of its formation remains unconfirmed, this failuresurface is accepted as being critical in the slope collapses,since it was found on the shale-middle coal seam contact inboth cases.
Inclined shear surfaces to form block wedge andfailure
The authors conjecture that sometime after the formation ofthe tensile fractures, shear fractures must have starteddeveloping in the slope to define the block wedge. Whether ornot this took place before or after the formation of the failuresurface on the shale-middle coal seam contact is debatable,and should form the subject of further research. Even in solidrock material (where jointing and other structures areinsignificant), shear failure remains a complex processresulting in complex fracture structures37–42. A synthesizedshear fracture containing all the features, and based on thework of Riedel37, Vermeer and De Borst40, and Ortlepp41,appears in Figure 8. A photograph of a shear fracture in hardrock appears in Figure 9.
The purpose of presenting all this detail is to recognizethat the formation of shear zones in the slope will becomplex, just as they are in any geological material.Although the structure of a shear fracture zone is complex,its overall orientation is simple, i.e. it can be assumed to lieparallel with the direction of the maximum shear stress in theslope. Shear bands or fractures, however, need not occur atonly one specific angle, but could occur over a range ofangles in relation to the maximum principal stress direction
Engineering application of thrust block analysis in slope stability problemsTransaction
Paper
The Journal of The Southern African Institute of Mining and Metallurgy VOLUME 109 REFEREED PAPER MAY 2009 315 ▲
Figure 7—Horizontal stress in slope behind slope crest, on vertical lineabove formation crest
Figure 8—Riedel structures in brittle material (after Riedel37)
67-85:Template Journal 6/5/09 11:06 AM Page 315

Engineering application of thrust block analysis in slope stability problems
together with the effects of anisotropy in the shale (e.g.Jaeger and Cook43). Note that only one possible Riedel ShearStructure is drawn in green in Figure 8, in which theconjectured Vermeer and De Borst35 dilation solution hasbeen applied. The other possible Mohr-Coulomb alternative isnot shown for purposes of keeping the drawing clear.
With reference to the FLAC solution before blockformation given in Figure 6, the authors conjecture that theshear zones are inclined at 45° to the horizontal, and thatthey are approximated by straight lines, although this neednot be the case in reality. We conjecture that as the activeblock starts becoming separated from the surrounding rockmass by small movements. Shear fractures can now form at45° to the horizontal. The authors deduce from the model,and information available that they are more likely to developdownwards from the bottom of the tensile fractures, since thestress state in the slope is more favourable for shear zonedevelopment at the base of the tensile cracks because thehorizontal stresses there are effectively zero.
Constructing the active-passive block geometry forthe above case studies
When the artificial cut is made, fracture propagation startsbecause of rock relaxation. At this time, the vertical tensilefractures develop at ground surface behind the slope crest,and the possible tensile fracture at the toe of the slope alongthe shale-middle coal seam contact surface forms for a shortdistance into the toe.
Karparov34 presents a criterion for estimating the depth itpenetrates, but further research will be necessary to confirmthis. The shear zones develop at approximately 45° to thehorizontal through the unbroken rock between the tensilefractures and the shale-middle coal seam contact. During theshear process to form the apex of the wedge, the rock in theshear zones will start to dilate (expand). This will generate ahorizontal force on the passive block, which will acceleratethe development of the purely frictional surface on the shale-middle coal seam contact.
At some point (probably before the two shear zonesconverge), the material between the shear zones will begin tocrush under the weight of the overlying material comprisingthe active block. This will accelerate horizontal rock dilation,both in the shear zones and in the crushed rock at the base ofthe wedge. These dilationary forces may be sufficient tothrust the passive block into the pit, and as this happens theactive block will continue to slump downwards under its ownweight, forcing the passive block further out into the pit. Thewhole process ends when the active block ceases to slumpdownwards, thereby dissipating the dilationary forces thatare driving the passive block into the pit. During this processboth blocks become comminuted, and the active blockperhaps more so than the passive block. Figures 10 to 17give a sequence of events the authors have deduced musttake place during the slope failure. Based on this mechanism,the conjectured active and passive blocks appear in Figures 4and 5 for the two mine slope failures.
Once these fractures have formed, continued slopestability is seen to be only a consequence of the balance offorces existing between the blocks in the profile, and that this
▲
316 MAY 2009 VOLUME 109 REFEREED PAPER The Journal of The Southern African Institute of Mining and Metallurgy
Figure 9—Example of a shear fracture in brittle rock in a deep level goldmine showing Riedel Structures (after Ortlepp41)
Figure 10—Middle Coal Seam before mining, with virgin horizontalstress profile
Figure 11—Slope cut to expose seam, with resultant horizontal stressprofile
67-85:Template Journal 6/5/09 11:06 AM Page 316

provides an important clue for a simple in-pit calculation thatwill be introduced later. It is important to recognize that thisanalysis considers only force equilibrium and assumes thatall forces pass through the block centroids. In other words,moment equilibrium is not considered in this model becauseobservations of the failures at the mine did not reveal anysignificant rotational motion in the failures.
Karparov34 provides a very detailed account of how allthe forces, including those derived from groundwater, arecomputed, and these appear in Appendix A. Thecomputations are based on Newton’s Laws of Motion, whilethe block stability is estimated assuming deformable activeand passive blocks and a factor of safety approach to thepotential of slip failure on the block sides and on the shale-middle coal seam contact in the observed failure casesdiscussed above. This methodology should not be confined tothe cases discussed above only; it can be adapted to thegeotechnical conditions in any open pit.
Since the blocks are deformable, the authors assume thatthe stresses along the block boundaries are approximatelyconstant, and independent of each other. This makes itpossible to calculate factors of safety for each boundary, andthen finding a weighted average using the lengths of therespective fracture surfaces that define the active block andpassive blocks. The details are too lengthly to include here,all the information necessary to perform the analysis as itwas described in Karparov34 appears in Appendix Afollowing this paper. Only the resultant formulæ necessaryfor the factor of safety calculations are presented below.
The inner surface factor of safety for failure is given by(see Appendix A for definition of variables and all thecalculations necessary to compute the FoS):
Engineering application of thrust block analysis in slope stability problemsTransaction
Paper
The Journal of The Southern African Institute of Mining and Metallurgy VOLUME 109 REFEREED PAPER MAY 2009 317 ▲
Figure 12—Development of tensile cracks behind slope crest
Figure 13—Commencement of shear fracture growth
Figure 14—Continued shear fracture growth with attendant dilation,and degradation of any cohesion along top coal contact
Figure 15—Active and passive blocks now fully defined by fracturegrowth in the slope
Figure 16—Minor slumping of active block behind slope crest as itcontinues to crush at the wedge tip below
Figure 17—Final slope collapse leaving evidence of a bi-planar or multi-planar failure surface described by Stead and Scoble9, and Kovari andFritz44
67-85:Template Journal 6/18/09 2:58 PM Page 317

Engineering application of thrust block analysis in slope stability problems
The outer surface factor of safety is given by:
The safety factor for the basal surface (shale-middle coalseam contact) is:
Finally, the factor of safety combined as a weightedaverage for the slope is given by:
The authors called the failure mechanism the thrustfailure mechanism, because slope collapse occurs when theactive block subsides under its own weight, thrusting thepassive block into the pit. The mechanism is illustrated inFigure 1, while the contrast between the unfailed slope profileand failed slope profile shown in Figures 4, and 5 stronglysuggest the mechanism.
The ultimate objective of Karparov’s34 thesis was toprovide a simple calculation that could be used in pit toassess the stability of slopes such as those described above.This never materialized because of the geotechnicalcomplexity at the two failure sites, and the complexity of theconjectured failure mechanism. The second author hasconsidered possibilities of simplifying the requiredcalculations sufficiently to make in-pit assessments possible,but these are probably fraught with error and inaccuracybecause of the assumptions that have to be made. Thefollowing section gives a brief description of such a method,but this must be widely tested and shown to be reliablebefore it can be used with confidence.
Quick collapse potential calculation in pit using theblock thrust model
The first part of this section contains a simple fieldcalculation that can be performed from measurements oftensile fracture positions behind the slope crest, knowing theslope height, and the overall slope angle. This very simpleguideline can be refined only by widespread testing. Thesecond part of this section discusses the results of thedetailed computations as they are outlined in Appendix A.
Simple criterion for FOS estimation whilst in the pit
Based on the above conjectures and assumptions, it ispossible to sketch an approximate picture of the blockformation and the subsequent slope failure. For this simplein-pit criterion calculation, general conditions are assumed asfollows:
➤ The pit bottom is formed on a horizontal discontinuitythat daylights at the toe of the slope
➤ Fracture toughness and rock strength are ignored, andtherefore the active and passive blocks are assumed tohave formed
➤ All the natural as well as the block boundary disconti-nuities have a friction angle of 37°.
These assumptions are far reaching (mainly to preservesimplicity here), and should be reviewed in as manygeotechnical conditions as possible in order to evaluate theirvalidity.
In order to make a quick assessment, the geotechnicalengineer should measure the position of the closest tensilefracture behind the slope crest, and then measure the positionof the tensile fracture furthest from the slope crest. Thedifference between these is the active block width (seeFigure 10). Then, knowing the height of the slope, one mustask the question: is h > w / 2? (See Figure 18 for a definitionof these variables). If so, then it is worth going ahead withthe simple assessment. The active and passive block volumesper metre of slope are given by (see Figure 18 for themeaning of the variables):
for the active block, and
for the passive block, when assuming the slope geometrygiven in Figure 18.
In assessing the potential for failure using thesevolumetric equations, let h = aw, and c = bw.
Then
and
and the stabilizing force is:
while the upsetting force is:
▲
318 MAY 2009 VOLUME 109 REFEREED PAPER The Journal of The Southern African Institute of Mining and Metallurgy
Figure 18—generalized active and passive block geometry for simplifiedfield analysis
67-85:Template Journal 6/5/09 11:06 AM Page 318

Defining the slope stability in terms of a factor of safety:
after simplification and rearrangement. This boils down tothe fact that if the volume of the active block exceeds that ofthe passive block, then the factor of safety is less than unity.Hence, if Va ≥ Vp, the slope is considered unstable, and thegeotechnical engineer should perform the full analysis as amatter of urgency.
It is a simple matter to draw up a series of tables using aspreadsheet to determine factors of safety for variations in h,c, and θ. This simplified methodology reveals factors ofsafety of 1.28 for a slope angle θ of 30°, a = 1.1, and c = 0 inthe case of the first slope collapse. This suggests that thegeotechnical engineer should review the slope stability usingthe block thrust mechanism because any factor of safety lessthan 1.3 is considered marginal. In the case of the secondfailure, θ = 60°, a = 1.3, and c = 0, which gives a factor ofsafety of 0.59, which suggests that the slope needs urgentattention.
Detailed FOS estimation using the thrust blockmethodology
Based on the conjectures and assumptions described earlier,it is possible to sketch an approximate picture of the blockformation and the subsequent slope failure. The Appendixcontains the full analytical procedure presented byKarparov34, which should be used to predict the slope factorof safety more accurately.
The failure models, which were applied to the minecollapses, appear in Figures 4 and 5. The results from thesecomputations, together with comparable results fromaccepted slope stability analyses appear in Table I, using rockparameters contained in Table II. It is apparent from thesafety factor computations that circular failure is unlikelyexcept in the case of the initial failure in the overburden inPit A-1. Observations at the mine confirm this in both cases.Blocky failure results for Pit A-2 were essentiallymeaningless except for the result obtained from the ordinarymethod, while the initial circular failure in Pit A-1 wasequally likely to manifest as blocky failure according to theBishop14, Janbu16 and Ordinary Methods13, while the
Engineering application of thrust block analysis in slope stability problemsTransaction
Paper
The Journal of The Southern African Institute of Mining and Metallurgy VOLUME 109 REFEREED PAPER MAY 2009 319 ▲
Table I
Slope collapse safety factors, calculated for the failures presented in Figures 4 and 5 (after Karparov34)
Analytical technique Thrust failure mechanism Ordinary Bishop Janbu Morgenstern-Price
Moment Force
Pit A-2
Circular failure - 2.434 2.649 2.354 2.572 2.569
Blocky failure - 1.198 0.157 0.152 0.113 0.144
Upper contact (spoil) 1.375 - - - - -
Lower contact (spoil) 0.777 - - - - -
Upper con. (no spoil) 1.287 - - - - -
Lower con. (no spoil) 0.794 - - - - -
Pit A-1 Initial failure
Circular failure - 0.709 0.729 0.708 0.722 0.716
Blocky failure - 0.738 0.733 0.715 0.103 0.104
Pit A-1 major collapse
Circular failure - 1.506 1.516 1.507 1.513 1.509
Blocky failure - 4.718 4.619 4.329 4.870 4.870
Upper contact 1.224 - - - - -
Bottom contact 0.908 - - - - -
Table II
Rock parameters used in the factor of safety calculations (after Karparov34)
Rock properties Sandy overburden Sandstone Shale (normal to bedding) Shale (parallel to bedding)
1 2 3 4 5
Density, kg/m3 1900 2600 2700 -Shear modulus, GPa 1.6 5.2 2.3 -Bulk modulus, GPa 2.6 5.9 4.5 -Tensile strength, MPa 1 5.5 3.5 1Cohesion, kPa 40 700 400 100Friction angle, deg. 32 22 14 8Layer thickness*, m 20 12 8 -
*Average layer thickness
67-85:Template Journal 6/5/09 11:06 AM Page 319

Engineering application of thrust block analysis in slope stability problems
Morgenstern-Price17 method produced meaningless results.As far as the major collapse was concerned in Pit A-1, allaccepted methods indicated that circular failure was unlikely,and that blocky failure was extremely unlikely. Table 1shows that in both cases, the thrust failure mechanism has areasonable chance of occurring, while all the other methodsyielded less consistent results.
Discussion and conclusions
The thrust mechanism failure potential was applied to the twomajor collapses assuming a slip surface on the upper shalecontact, and a second failure surface on the lower shalecontact with the middle coal seam. The purpose of this was totest the potential of the mechanism to differentiate betweenpotential collapse on one failure surface and another. In bothcases, no failure was predicted for the upper shale contact,while collapse was predicted for the lower shale contact. Thisis in line with the observations at the mine. Interestingly, thespoil pile in Pit A-2 had a slight stabilizing effect, althoughthis was insufficient to prevent collapse.
The thrust failure mechanism appears to be promising asa new slope stability analysis technique because it canpotentially be applied to a wide variety of geotechnicalconditions. It has been tested in two well-documented cases,and has been shown to be successful, in contrast to the otherinappropriately applied methods. This does not mean that themethod is infallible—proof of success is acceptable only if theproposed technique can be shown to work in nearly everypossible case where the block thrust mechanism is suspected,and where all failures to work can be shown to be the resultof inappropriate application of the method.
The authors have not been able to publish more failurecases than have been analysed using this method, but havedecided to publish this paper in order to make this methodknown in the hope that other workers in the field will bewilling to help test its potential on pit failures they haveobserved, and which conventional methods have failed topredict. The biggest stumbling block to obtaining data onslope failure cases resides with the mines: usually a slopefailure is an expensive and embarrassing phenomenon thatmine management prefers to hide from public view. Thisexplains the anonymity of the two cases discussed above.However, the literature review clearly shows that many slopefailures are unpredictable using conventional methods, andthis, not the incompetence of geotechnical engineers or minemanagement, has probably led to the design of potentiallyunstable slopes. The authors therefore appeal to the industryfor access to unexplained slope failures as soon as they haveoccurred, so that this methodology has a chance of beingtested more widely.
The proposed thrust failure analysis is a versatile methodfor slope stability assessment in complex geotechnicalconditions in cases where the block thrust mechanism issuspected. The complexity of the analysis should looselyreflect the complexity of the geotechnical conditions in whichpotential failure may take place. It will not be infallible as anapproach because of subjectivity on the part of the engineerinvolved. Successful application will depend on a careful
balance between simplicity, in which the block thrust modelis analytically tractable, and complexity, where the essentialfeatures of the geotechnical conditions that affect potentialfailure potential are included.
Typically, mines are situated in more or less uniformmining environments, which are the result of a combinationof the palæo-geological conditions that existed at the time ofthe formation of the orebody, and the subsequent geologicalhistory of the area up to the time of mining. The geologicalhistory refers to the changing geological conditions that theorebody may be subjected to after its formation, for example,periods of crustal stress intensification and stress relaxation;erosion of overlying rock and deposition of new sediments;fault, fold, and joint formation; chemical alteration byweathering or regional metamorphism; and intrusion bydykes and sills. All orebodies will be subjected to acombination of some or all of the above processes once ormore during their geological history and these will result in amining environment unique to the orebody.
Within the mining environment there will be one or moregeotechnical areas, for example faulted ground and unfaultedground. The block thrust failure mechanism may then only bepossible in faulted ground for example, while other slopestability problems may be extant in the unfaulted ground. Itwill be the duty of the engineer and geologist to identifythese conditions, determine the potential for slope collapse,and then propose appropriate precautions where necessary.
The following conclusions can be drawn:
➤ The analysis technique takes into account the mostlikely virgin and resultant stress state of the slopeprofile, and their potential effect on slope collapse
➤ With the aid of this method a more realistic slopestability safety factor and appropriate general slopeangle design are possible
➤ The methodology includes the effect of pore-waterpressure on potential collapse
➤ The method deserves further attention, but the authorshave not been able to obtain data on more that theabove-described failures
➤ A simple quick assessment method generalizes a slopeand block geometry, and then applies a simple criterionto make a preliminary in-pit slope stability assessment
➤ This paper is published in the hope that the blockthrust mechanism will receive wider attention andapplication in the mining industry, both in South Africaand abroad.
The authors consider this paper a contribution as itprovides engineers with another tool to assess slope stabilityin circumstances where the accepted methods are known tofail. The authors recommend that this method should beapplied to as many case studies from the worldwide miningindustry as possible, where sufficient detail of eachindividual failure and the geological conditions are available.Secondly, fracture development in rock will receive a boostfrom an investigation into Riedel’s work37, and this shouldbe applied to predicting the potential for the growth of shearfractures, and the resulting potential instability, in allgeotechnical conditions.
▲
320 MAY 2009 VOLUME 109 REFEREED PAPER The Journal of The Southern African Institute of Mining and Metallurgy
67-85:Template Journal 6/5/09 11:06 AM Page 320

References
1. HOEK, E. and BRAY, J.W. Rock slope Engineering. The Institute of Miningand Metallurgy, London, 1981.
2. CANMET. Pit Slope Manual, Mining research Laboratories, CANMET,Canada 1997.
3. HARRIES, N. Personal communication at the International Symposium onSlope Stability, Cape Town, 4–7 March 2006.
4. STURMAN, J.M. Influence of slope stability on economics of opencast coalmining in the east and north midlands of England. Second InternationalSurface Mining and Quarrying Symposium, 4–6 Oct. 1983, Bristol, UK,1984. pp. 217–224.
5. SINGH, T.N. and SINGH, D.P. Assessing stability of voids in multi seamopencast mining. Colliery Guardian, July 1992, pp. 159–164.
6. MALGOT, J., BALIAK, F., and MAHR ,T. Prediction of the influence ofunderground coal mining on slope stability in the Vtacnik mountains.Bulletin of the International Association of Engineering Geology, vol. 33,1986. pp. 57–65.
7. BOYD, G.L. Geomechanics research applied to open strip coal mining inAustralia. Second International Surface Mining and QuarryingSymposium, 4–6 Oct. 1983, Bristol, UK, 1983. pp. 193–204.
8. SKEMPTON, A.W. and HUTCHINSON, J.N. Stability of natural slopes andembankment foundations, State-of-the-art report, Proc 7th Int ConfSMFE, Mexico City, 2, 1969. pp. 294–335.
9. STEAD, D. and SCOBLE, M.J. Rock slope stability assessment in Britishsurface coal mines. Second International Surface Mining and QuarryingSymposium, 4–6 Oct. 1983, Bristol, UK, 1983. pp. 205–216.
10. ANDERSON, M.G. and RICHARDS, K.S. Slope stability—geotechnicalengineering and geomorphology. Reprinted, John Wiley & Sons. 1992.
11. BROMHEAD, E.N. The Stability of Slopes. Surrey University Press, Chapmanand Hall, New York, 1992. pp. 109–165.
12. WRIGHT, S.K., KULHAWY, F.H., and DUNCAN, J.M. Accuracy of equilibriumslope stability analysis. J. of the Soil Mech. and Found. Div., ASCE, vol. 99, no. SM10, 1973. pp. 783–791.
13. FELLENIUS, W. Calculation of the stability of earth dams. Trans. 2nd Congr.on Large Dams, Washington, vol. 4, 1936. pp. 445–459.
14. BISHOP, A.W. The use of the clip circle in the stability analysis of earthslopes. Geotechnique, vol. 5, 1955. pp. 7–17.
15. LOWE J. and KARAFIATH L. Stability of earth dams upon draw down. Proc.1st Pan-Am. Conf. Soil Mech. Found. Eng., Mexico, vol. 2, 1960. pp. 537–560.
16. JANBU, N. Stability analysis of slopes with dimensionless parameters.Harvard University Soil Mech. Series, no. 46. 1957.
17. MORGENSTERN, N.R. and PRICE, V.A. The analysis of the stability of generalslip surfaces. Geotechnique, vol. 15, 1967. pp. 79–93.
18. SPENCER, E.E. A method of the analysis of the stability of embankmentsassuming parallel inter-slice forces. Geotechnique, vol. 17, 1967. pp. 11–26.
19. TURNBULL, W.J. and HVORSLEV, M.L. Special problems in slope stability,ASCE, J. Soil Mech. Fdnt. Div., 93, (SM4), 1967. pp. 499–528.
20. WHITMAN, R.V. and BAILEY, W.A. Use of computers for slope stabilityanalysis, ASCE, J. Soil Mech. Fdnt. Div., 93, (SM4), 1967. pp. 475–498.
21. SRK. Failure analysis of the North Pit Failure, Colliery A-1. unpublishedinternal mine report. 1995.
22. CANADY, I.I. Personal communication. Head of failure slope profiling team,1999. 2006.
23. MATTUSHEK, M. Personal Communication. Divisional Geologist, New VaalColliery, South Africa. 2005.
24. CAIRNCROSS, B. Paleodepositional environments and tectono-sedimentarycontrols of the postglacial Permian coals, Karoo Basin, South Africa.International Journal of Coal Geology, vol. 12, 1989. pp. 365–380.
25. SNYMAN C.P., and BARCLAY J. The coalification of South African Coal.International Journal of Coal Geology, vol. 13, 1989. pp. 375–390.
26. VOIGHT, B. Beziehung zwischen grossen horizontalen Spannungen imGebirge und der Tektonik und der Abtragung. 1st Congress Int. Soc. RockMech., Lisbon, 1966, vol. 2, pp. 51–56.
27. GAY, N.C. In situ stress measurements in Southern Africa, Tectonophysics,vol. 29 1975. pp. 447–459.
28. GAY, N.C. The state of stress in a large dyke on E.R.P.M., Boksburg, SouthAfrica. Int. J. Rock Mech. Min. Sci. & Geomech. Abstr., vol. 16, 1979. pp. 179–185.
29. STACEY, T.R. and WESSELOO, J. In situ stresses in mining areas in SouthAfrica. Jour. S. Afr. Inst. Min. and Metall. vol. 98, no. 7, 1998.pp. 365–368.
30. SELLERS, E.J., COETZER, S.J., and KAMSTRA, R. Understanding andDetermining the Variability of the Primitive Stress Environment. SIMRACResearch Project GAP707, Department of Minerals and Energy, Pretoria,March 2002.
31. VAN DER MERWE, J.N. Personal communication, Department of MiningEngineering, University of Pretoria. 2002a.
32. VAN DER MERWE, J.N. Horizontal stress: The root of all evil?, Proc. 19thConf. on Ground Control in Mining, Teheran, Iran. 2002b.
33. HOEK, E. and BROWN, E.T. Underground Excavations in Rock. TheInstitution of Mining and Metallurgy, London, 1980. p. 100.
34. KARPAROV, KN. Slope Stability Analysis in Complex GeotechnicalConditions—Thrust Failure Mechanism. PhD Thesis submitted forexamination to the University of Pretoria, Pretoria, South Africa, August2006.
35. ITASCA CONSULTING GROUP. FLAC2D: Fast Lagrangian Analysis of Continua.Minneapolis, Minnesota, USA. 1999.
36. BARTON, N.R. A Model Study of the Behavior of Excavated Slopes. Ph.D.Thesis, University of London, Imperial College of Science and Technology.1971.
37. RIEDEL, W. Zur mechanik geologisher brucherscheinungen. Zentralblatt furMineralogie, Geologie und Paleontologie B, (Abhandlung). 1929. p. 354–368.
38. LADE, P.V., COLE, D.A., and CUMMINGS, D. Multiple failure surfaces over dip-slip faults. Journal of Geotechnical Engineering, vol. 110, no. 5, May1984, 1984. pp. 616–627.
39. SYLVESTER, A.G. Strike-slip faults. Bulletin of the Geological Society ofAmerica, vol. 100, 1988. pp. 1666–1703.
40. VERMEER, P.A. and DE BORST, R. Non-associated Plasticity for Soil, Concreteand Rock, Heron, vol. 29, no. 3, Delft University of Technology, Delft, TheNetherlands. 1984.
41. ORTLEPP, W.D. Rock Fracture and Rockbursts: an illustrative study.Monograph Series M9, South African Institute of Mining and Metallurgy,Johannesburg. 1997.
42. GAMMOND, J.F. Displacement features associated with fault zones: acomparison between observed examples and experimental models. Journalof Structural Geology, vol. 5, 1983. pp. 33–45.
43. JAEGER, J.C. and COOK, N.G.W. Fundamentals of Rock Mechanics, 3rd Ed.New York, Chapman and Hall. 1979.
44. KOVARI, K. AND FRITZ, P. Special contribution: Slope stability with plane,wedge and polygonal sliding surfaces. Symposium on Rock MechanicsRelated to Dam Foundations, Rio de Janeiro. 1978.
45. BAER, G. Mechanisms of dike propagation in layered rocks and in massiveporous sedimentary rocks. Journal of Geophysical Research 96, vol. 11,1991. 911–11, 929.
46. NARR, W. and SUPPE, J. Joint spacing in sedimentary rocks. Journal ofStructural Geology, vol. 13, 1991. pp. 1037–1048.
47. GROSS, M., FISCHER, M., ENGELDER, T., and GREENFIELD, R. Factors controllingjoint spacing in interbedded sedimentary rocks; integrating numericalmodels with field observations from the Monterey Formation, USA.Ameen, M.S. (ed.). Fractography. Geological Society Special Publication,Geological Society, London, 1995. pp. 215–233.
48. BECKER, A. and GROSS, M. About the Dugdale crack under mixed modeloading. Int J Fracture, 37. 1988.
49. JI, S. and SARUWATARI, K. A revised model for the relationship betweenjoint spacing and layer thickness. Journal of Structural Geology, vol. 20,1998. pp. 1495–1508.
50. HELGESON, D.E. and AYDIN, A. Characteristics of joint propagation acrosslayer interfaces in sedimentary rocks. Journal of Structural Geology, vol.13, 1991. pp. 897–991.
51. TSANG, Y.W. The effect of tortuosity on fluid flow through a singlefracture. Water Resources Research, vol. 20, 1984. pp. 1209–1215.
52. ITASCA CONSULTING GROUP. FLAC2D. Fast Lagrangian Analysis of Continua,1999.
53. HOEK, E. Slope stability analysis. Lecture at Santiago Technical University,Chapter 7—A: Slope stability problems in Hong Kong, 1986. pp. 92–104.
Engineering application of thrust block analysis in slope stability problemsTransaction
Paper
The Journal of The Southern African Institute of Mining and Metallurgy VOLUME 109 REFEREED PAPER MAY 2009 321 ▲
67-85:Template Journal 6/5/09 11:06 AM Page 321

Engineering application of thrust block analysis in slope stability problems
Appendix A
Method of thrust failure mechanism analysis forslope stability in complex geotechnical conditions
Introduction
The proposed failure mechanism is related to the polygonalfailure surfaces theory by Kovari and Fritz44, Boyd’s7
observations (see Figure 1), and the work of Stead andScoble9. Accepted literature shows that sliding usually takesplace on surfaces that can be modelled by concave-uppolygonally shaped surfaces. For such cases, Janbu16, andMorgenstern and Price17 have suggested practical methods ofcomputation, according to which the unstable earth- or rock-mass is divided up into vertical strips or slices.
The Kovari and Fritz44 polygonal failure surfaces theoryis based on certain assumptions about the distribution andinclination of the internal contact forces, as well as thehypothesis of limit equilibrium. Their method is based uponthe physical requirement that sliding on a polygonal surfaceis only possible kinematically if a sufficient number ofinternal shear surfaces can develop. For the sake of simplifi-cation, only continuous shear surfaces starting from theintersection lines of the polygon-sliding surface are assumed.Thus, as shown in Figure A.1, the slide of a mass on threesurfaces must be accompanied by at least two internal shearsurfaces. For n external sliding surfaces (n-1) such interfacesare required.
This approach complicates the theory and makes itkinematically more difficult to justify. The thrust blockmechanism resolves this dilemma by retaining themultiplanar failure surface, and substituting the two rear-most blocks in Figure A.1 with a single active block. Thepassive block is equivalent to the front block in Figure A.1,albeit with a different geometry.
The Kovari and Fritz44 method rests upon the followingbasic assumptions:
➤ The blocks comprising the rock mass are eachconsidered to be rigid
➤ The directions of the internal shear surfaces are known➤ On the internal and external sliding surfaces (at the
condition of limit equilibrium), the Mohr-Coulombfailure criterion applies, and no tensile strength ispermitted. The strength parameters may be allocateddifferent values on each sliding surface.
The directions of the internal shear surfaces are chosenfrom case to case based on a careful investigation of thestructure of the potentially sliding mass. However, for highlyjointed rock, the directions of the internal slip surfaces arefound by the condition of a minimum safety factor for thesystem. The Kovari and Fritz44 method does not take intoaccount the existence of complex geotechnical structurewithin the slope. It also ignores the formation of a tensilefracture behind the slope crest, which is a common feature incompetent rock slopes. In their method, the internal failuresurfaces are determined by careful field observation, whichhas an element of subjectivity introduced by observerexperience, but it appears that the multi-planar nature of theshear surface is well established.
The proposed thrust failure mechanism thereforesimplifies Kovari and Fritz’s44 method by using only threefailure surfaces because the investigated slope profile isdivided into two blocks, namely passive and active blocks(see Figure 10 in main text). The proposed method also takesinto account the tensile fracture behind the slope crest.
Formation of tensile fractures
Tensile crack formation behind the slope crest is widelyobserved and reasonably well understood. In a series of verydetailed model studies on slope failures, Barton (1971) foundthat the tension crack behind the slope crest was generatedby small movements within the rock mass, and that itappeared after slope excavation. Although these individualmovements were very small, their cumulative effect was asignificant displacement of the slope surface towards thepit—sufficient to cause separation of material behind theslope crest and to form tension cracks. Using a FLAC52
model, Karparov34 estimated the position of the tensile zonein the slope, shown in Figure A.2. This line then defines thevertical extent of the tension fractures, which are shown inblue in Figure A.2.
Formation of shear fractures at base of active block
Fracture development in rock is complex and remains poorlyunderstood. In layered sedimentary rocks, opening-modefractures have been observed to abut against beddingcontacts (Baer45, Narr and Suppe46, Gross et al.47, Becker andGross48, and Ji and Saruwatari49), cross through contacts
▲
322 MAY 2009 VOLUME 109 REFEREED PAPER The Journal of The Southern African Institute of Mining and Metallurgy
Figure A.2—Formation of active block bounded by tensile and shearfractures
Figure A.1—Kinematics of a slope failure for a polygonal sliding surface(after Kovari and Fritz44)
67-85:Template Journal 6/18/09 2:58 PM Page 322

(Becker and Gross48), and jog or step-over at beddingcontacts (Helgeson and Aydin50). Fracture termination atfrequent bedding contacts can produce highly tortuousfracture paths in sediments (Tsang51). By contrast, fracturesthat propagate straight through bedding provide well-connected pathways. A potential intermediate case is afracture that jogs or steps over a few centimetres at beddingcontacts (Helgeson and Aydin50). Although these three typesof fracture intersection with bedding are easily recognized inthe field, the mechanisms that control the degree of fractureoffsetting across bedding surfaces are not yet wellunderstood. Insight into controlling mechanisms andparameters could aid the prediction of subsurface fracturepropagation.
In solid rock material where jointing and other structuresare insignificant, shear failure is a complex process resultingin complex fracture structures. In broken rock massesopportunistic shear may take place along pre-existingfractures, with the result that the shear fractures are likely tobe simpler. A common terminology for brittle shear fracturesin rock is introduced below (adapted from Riedel37,Sylvester39, and Vermeer and de Borst40) and shown inFigures 8 and 9 in the main text. Riedel’s37 paper is notavailable, and his work is completely unknown in solidmechanics, while it is widely referenced in structural geology.The reproductions of his interpretations in Sylvester39 andMcKinnon and De la Barra52 are probably misleading becausethere is no mechanistic description of how the variousfractures develop. Riedel’s work should be revisited from asolid mechanics point of view, because it provides a goodstarting point for the interpretation, from a stress anddeformation point of view, of small and large faults in rockmasses.
The best location in the slope for shear fracture formationis just below the modelled horizontal tensile zone, where thehorizontal stresses will be small. There is a mechanisticreason for this because this point has the maximum isolatedblock weight above it (the block is assumed to be defined bytwo or more tensile fractures behind the slope crest) and thisshould be a favourable point for the origin of shearing, wherethe horizontal stresses are low. The shearing fractures arealso assumed to have the complexity of shearing seen in allgeological materials, i.e. along faults, in mines, and in thelaboratory. Since Riedel37 presented his shearing model, ithas been widely accepted and has repeatedly beendemonstrated to be a reliable guide for the interpretation ofshear along all types of geological features. Karparov’s34
work contains more detail on Riedel Fractures.The purpose of presenting all this detail is to recognize
that the formation of shear zones in the slope is likely to becomplex, just as they are in any geological material.However, Riedel’s37 observation that the shear fracturestructure is complex, contrasts with the simple observationthat the shear zone orientation is most likely to lie parallelwith the direction of the largest shear stress in the slope,which is approximately 45° from the horizontal, given theFLAC model results34.
Linking the active block to pit slope
Karparov34 presents a more complex picture, but it can beassumed that the surface AFE linking the slope toe and the
active block base in Figure A.2 is frictional. The surface mayhave been cohesive, and Karparov34 undertook microscopicstudies to demonstrate how the cohesive bonds on thissurface could have been broken. It was concluded that thisstudy did not produce indisputable results, and that moreresearch was needed. Anyway, the surface must eventuallybecome frictional, because both failures investigated showedthis to be the case. Once all the tensile and shear fractureshave linked together to form the block geometry shown inFigure A.2, slope failure is inevitable, if the active block issufficiently large to thrust the passive block into the pit.
Analysis of trust failure mechanism
It is also important to recognize that this analysis considersforce equilibrium, but in deformable block structures. Ittherefore assumes that all forces should pass through theblock centroids, because this is necessary to explain theirrotational nature of the failures. In other words, momentequilibrium is not considered in this model becauseobservations of the failures at the mine did not reveal anysignificant rotational motion in the failures.
Figure A.2 indicates the failure types and lengths usedfor the purpose of the slope stability calculations. Symbolsused in the analysis are as follows:
PA, PF, PC are the load of the active block and thefrictional and cohesive zones of the passiveblock respectively
c–I, c–
O are the cohesions of the inner and outer sideof the active block respectively
lI, lO are the shear failure lengths of the inner andouter side of the active block respectively
lF, lC are the lengths of the frictional strength zonesand the cohesive strength zones of thepassive block failure surface respectively
lB is the length of the passive block failuresurface and is equal to the sum of the lengthsof frictional strength and cohesive strengthzones (lB = lF + lC)
βI, βO are the shear failure surface angles at theinner and outer sides of the active blockrespectively (assumed to be 45°)
RP is the reaction of the passive block applied tothe active block
favI, favO are the average internal friction angles alongthe shear failure surfaces at the inner andouter side of the active block respectively
w is the dip angle of the strata.
The average friction angle along each surface in a multi-layered medium can be expressed as the weighted average:
[A.2]
where mi is the layer thickness of the ith layer and fi is thefrictional angle of the ith layer.
Like the friction above, the average cohesion is alsocalculated along the shear failure surfaces of the active blocksides as the weighted average:
Engineering application of thrust block analysis in slope stability problemsTransaction
Paper
The Journal of The Southern African Institute of Mining and Metallurgy VOLUME 109 REFEREED PAPER MAY 2009 323 ▲
67-85:Template Journal 6/5/09 11:06 AM Page 323

Engineering application of thrust block analysis in slope stability problems
[A.3]
where mi is the failure surface length in the ith layer and Ci isthe cohesion of the layer intersected by the active block shearfailure surface.
The active block weight for unit thickness is calculated as:
[A.4]
where Ai is the layer volume in the active block profile, ρi isthe layer density, and g is the acceleration due to gravity.
The active block is constructed in the following way,using the tensile fracture positions measured on the slopecrest:
➤ Draw two tensile fractures vertically downwards fromsurface at the positions they were seen on surface
➤ Find the midpoint of a horizontal line joining the twofractures, and project this vertically downward tointersect the frictional surface line (the surface thepassive block will slide on)
➤ Project two shear failure surfaces up at angles of 45° tothe horizontal from the intersection point on thefrictional surface until each intersects their respectivevertical tensile fractures.
The active block is now defined (see Figure A.2, or Figure 10 in the main text). This construction is not intendedto represent the sequence of development of these fracturesas there is still insufficient evidence to determine exactly howthe failure surfaces do grow within the slope, or even if thegrow sufficiently to link up. Once all these fractures aredeveloped and connected, the formation of the active block iscomplete.
As was mentioned earlier, we may have two zones alongth failure surface at the passive block base, namely thefrictional and cohesive zones. These two zones have differentshear strengths, which have to be taken into account whenthe resistance force developed by the passive block iscomputed. The passive block weight calculation is the sameas for the active block.
Resisting forces at the base of the passive block areformed by the frictional strength along the failure surface dueto the block weight and the cohesive and frictional strengthof that portion of the contact surface that has not yet yieldedin shear. Driving forces are formed by the tangentialcomponent of the weight along the same surface. Hence,these forces can be expressed as:
[A.5a]
[A.5b]
where ϖ is an average inclination angle of the failure surface,PF is the passive block load above frictional zone, PF
N and PFT
are the normal and tangential components respectively. Theresisting force along the frictional zone will have the form:
[A.6]
where φE is the frictional angle along the bedding.
Similar to the frictional zone, normal and tangential loadcomponents in the cohesive zone of the passive block can becalculated with Equation [A.7]. Then the resisting andtangential forces to the failure surface will have the form:
[A.7a]
and
[A.7b]
respectively.Figure A.2 shows that the rock mass rests on two
potential failure surfaces: the frictional surface AFE, and theactive block inner shear failure surface ED. This is verysimilar to the Kovari and Fritz44 geometry discussed earlier.Thrust block failure is possible only if slip surface EG inFigure A.2 is developed. This has forces acting on it asshown in Figure A.3.
From Figure A.3 we can write
[A.8]
If we take into account the definition for safety factor
[A.9]
Then we can write
[A.10]
From Figure A.3 and Equation [A.10] we have
[A.11]
and
[A.12]
If we combine Equations [A.11] and [A.12] and acceptFOS = 1, which means that the internal slip surface is at thepoint of slipping, then we will have
[A.13]▲
324 MAY 2009 VOLUME 109 REFEREED PAPER The Journal of The Southern African Institute of Mining and Metallurgy
Figure A.3—Detail of internal 45° shear surface
67-85:Template Journal 6/5/09 11:06 AM Page 324

The angle of internal friction in Equation [A.13] has tosatisfy the condition in Equation [A.14] if it is to have a realsolution:
[A.14]
From Equation [A.14] we can see that under worst-case
conditions, φ = 0° if Rcl = ∞, which is possible only if R = 0,
and both c ≠ 0 and l ≠ 0. In the case of l = 0, we should have
a tensile fracture from the surface to the failure surface.
Kovari and Fritz44 accepted the worst-case scenario in their
polygonal model, which gives the angle of reaction forces as
equal to the angle of internal friction (δ = φ).The following equations can be applied for the active
block load distribution along the two shear failure surfacesthat form the wedge structure:
[A.15]
and
[A.16]
for the outer and inner shear failure surfaces respectively(see Figure A.2 for a definition of ‘outer’ and ‘inner’), wherePA is the weight of the active block and ϖA is the layerinclination angle at the block wedge.
Figure A.4 shows the same slope profile as shown inFigure A.2, with points defining the block boundaries. Let usfirst calculate the pore-water pressure along the line CD inFigure A.4. The earlier calculated induced vertical tensilefracture depth (z) and a phreatic surface, (zWT), above thetensile fracture depth are indicated.
Therefore, the pore-water pressure at point D in FigureA.4 is equal to:
[A.17]
where γw is the unit weight of water and zWT is the surfacetensile fracture depth below the phreatic surface. The totalforce acting along the surface vertical tensile fracture at theactive block outer side is equal to
[A.18]
Let us calculate the pore-water pressure along the lineDE. As a first step, let us define pore-water pressure alongthe line DA. For this purpose, we assume zero pore-waterpressure at point D. We also have zero pressure at point A atthe slope toe position, if there is no water flowing out of theslope. Hence, we assume that, in the middle of the spanbetween these two points (point I), we will have the highestpore-water pressure value that will be equal to:
[A.19]
where zwDA is the difference between depths of points D and
A. Now we cam draw a stress diagram (ADJ) between thepoints A and D.
From Equation [A.17], we have pore-water pressure atpoint D. So let us draw the line DP, equal to the pore-waterpressure at point D normal to the line AD and add the samestress magnitude at point I as adding stress JK. Now ourstress diagram takes a new form (AJKPD), which isunrealistic because of the step AJK. As the point I is in themiddle of AD, then half of the stress JK can be added to theportion AI and the other half to the portion ID. Hence, wehave a new stress equal to
[A.20]
which is equal to the line MN in our stress diagram. Then letus move our stress magnitude MN toward point D until itintersects the stress line KP. This position is shown in FigureA.4. Now we have a new stress diagram (ANPD), whichpresents pore-water pressure distribution along the line AD.
Let us now calculate the pore-water pressure at point E.For this reason, let us make its orthogonal projection to theline AD, which is point L, which has pressure with themagnitude LR. Therefore, the pore pressure at point E willhave the magnitude
[A.21]
where zωLE is the depth difference between the points L and E.
This pressure is realistic because point E is slightly deeperthan point L.
To find the point where we have maximum pore-waterpressure along the outer shear failure surface we define pointO, whose orthogonal projection to the line AD is point M.With a high degree of approximation, we can say that thepore-water pressure at point O is equal to
[A.22]
It is now easy to construct a pore-water pressure diagramalong the line of the inner shear failure surface (HE) becausewe have calculated the pore-water pressure at point E(Equation [A.21]) and have assumed zero water pressure atpoint H. This assumption is based on the close point positionto the two free surfaces AB and BC.
Pore-water pressure at point F follows the same order asfor point E (Equations [A.21] and [A.22]):
[A.23]
where σwQ is the pore-water pressure magnitude at point Q
and zwQF is the depth difference between the points Q and F.
Engineering application of thrust block analysis in slope stability problemsTransaction
Paper
The Journal of The Southern African Institute of Mining and Metallurgy VOLUME 109 REFEREED PAPER MAY 2009 325 ▲
Figure A.4—Plot of pore-water pressures in the slope
67-85:Template Journal 6/5/09 11:06 AM Page 325
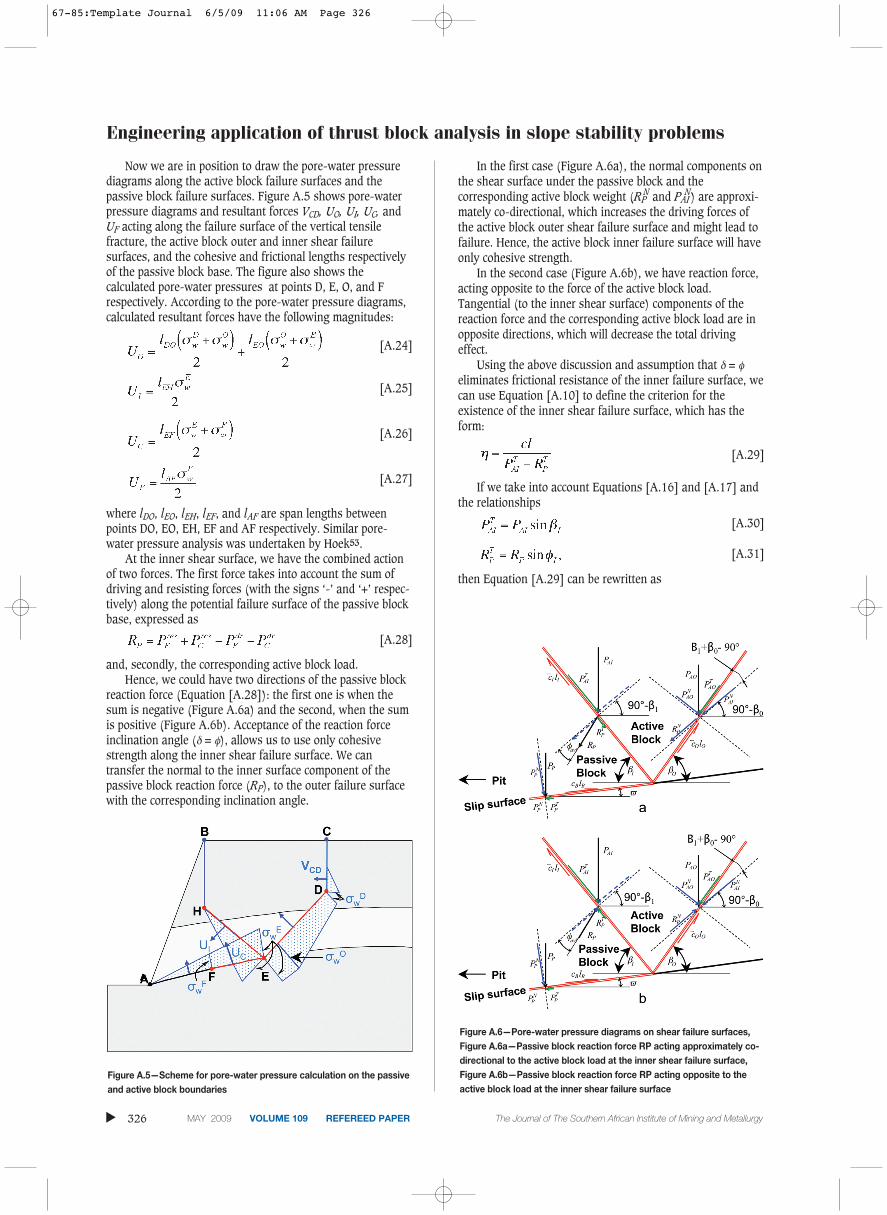
Engineering application of thrust block analysis in slope stability problems
Now we are in position to draw the pore-water pressurediagrams along the active block failure surfaces and thepassive block failure surfaces. Figure A.5 shows pore-waterpressure diagrams and resultant forces VCD, UO, UI, UC, andUF acting along the failure surface of the vertical tensilefracture, the active block outer and inner shear failuresurfaces, and the cohesive and frictional lengths respectivelyof the passive block base. The figure also shows thecalculated pore-water pressures at points D, E, O, and Frespectively. According to the pore-water pressure diagrams,calculated resultant forces have the following magnitudes:
[A.24]
[A.25]
[A.26]
[A.27]
where lDO, lEO, lEH, lEF, and lAF are span lengths betweenpoints DO, EO, EH, EF and AF respectively. Similar pore-water pressure analysis was undertaken by Hoek53.
At the inner shear surface, we have the combined actionof two forces. The first force takes into account the sum ofdriving and resisting forces (with the signs ‘-’ and ‘+’ respec-tively) along the potential failure surface of the passive blockbase, expressed as
[A.28]
and, secondly, the corresponding active block load.Hence, we could have two directions of the passive block
reaction force (Equation [A.28]): the first one is when thesum is negative (Figure A.6a) and the second, when the sumis positive (Figure A.6b). Acceptance of the reaction forceinclination angle (δ = φ), allows us to use only cohesivestrength along the inner shear failure surface. We cantransfer the normal to the inner surface component of thepassive block reaction force (RP), to the outer failure surfacewith the corresponding inclination angle.
In the first case (Figure A.6a), the normal components onthe shear surface under the passive block and thecorresponding active block weight (RP
N and PAIN) are approxi-
mately co-directional, which increases the driving forces ofthe active block outer shear failure surface and might lead tofailure. Hence, the active block inner failure surface will haveonly cohesive strength.
In the second case (Figure A.6b), we have reaction force,acting opposite to the force of the active block load.Tangential (to the inner shear surface) components of thereaction force and the corresponding active block load are inopposite directions, which will decrease the total drivingeffect.
Using the above discussion and assumption that δ = φeliminates frictional resistance of the inner failure surface, wecan use Equation [A.10] to define the criterion for theexistence of the inner shear failure surface, which has theform:
[A.29]
If we take into account Equations [A.16] and [A.17] andthe relationships
[A.30]
[A.31]
then Equation [A.29] can be rewritten as
▲
326 MAY 2009 VOLUME 109 REFEREED PAPER The Journal of The Southern African Institute of Mining and Metallurgy
Figure A.6—Pore-water pressure diagrams on shear failure surfaces,Figure A.6a—Passive block reaction force RP acting approximately co-directional to the active block load at the inner shear failure surface,Figure A.6b—Passive block reaction force RP acting opposite to theactive block load at the inner shear failure surface
Figure A.5—Scheme for pore-water pressure calculation on the passiveand active block boundaries
67-85:Template Journal 6/5/09 11:06 AM Page 326

[A.32]
which is a criterion for the existence of the inner shear failuresurface and the surface’s factor of safety.
If the shear fracture criterion (η) from Equation [A.32] ishigher than 1.3, the inner shear failure surface will not form.Therefore, we will have conditions for other failure types(such as multi planar or polygonal) but not for thrust failure.If the criterion is lower than 1.3, we have to anticipate shearfailure at the inner surface and, from there, blocky-typefailure.
As was discussed earlier, the components normal to theinner failure surface of the corresponding active block loadand the passive block reaction force are transferred to theouter shear surface. Then their combined action along theouter surface can be expressed as:
[A.33]
Therefore, the outer shear failure surface will have afactor of safety equal to:
[A.34]
Equation [A.34] can be further simplified as:
[A.35]
The basal surface safety factor presents the balance ofalready calculated driving and resisting forces along thecontact surface in the passive block base (see Figure A.12),and has the form:
[A.36]
where φB is the friction angle along the failure surface and vFand vC are the dip angles along the frictional zone andcohesive zone of the passive block base see Figure A.2).
The failure surface lengths (lI, lO, and lB, Figure A.2)vary, and depend on slope angle, layer inclination, layerthickness, and rock properties. To avoid overestimating theinfluence of the shortest failure surface on the entire slopestability, a weighted function of calculated safety factorsshould be used. Hence, we have the following weightedaverage equation for calculation of the entire slope stabilityfactor of safety from the individual failure surface factors ofsafety and their respective lengths: ◆
[A.37]
Engineering application of thrust block analysis in slope stability problemsTransaction
Paper
The Journal of The Southern African Institute of Mining and Metallurgy VOLUME 109 REFEREED PAPER MAY 2009 327 ▲
67-85:Template Journal 6/5/09 11:06 AM Page 327