ENGIE Brasil Energia S.A. Results Presentation 1Q18
47
ENGIE Brasil Energia S.A. Results Presentation 1Q18 April 19, 2018
Transcript of ENGIE Brasil Energia S.A. Results Presentation 1Q18

ENGIE Brasil Energia S.A.
Results Presentation
1Q18April 19, 2018

DISCLAIMER
04/19/2018 ENGIE BRASIL ENERGIA S.A. RESULTS PRESENTATION 1Q182
This publication may include forward-looking statements
on events or results pursuant to Brazilian and international
securities’ regulations. These forward-looking statements
are based on certain assumptions and analyzes made by
ENGIE Brasil Energia S.A. (“ENGIE Brasil Energia”,
“Company” or “EBE”), - previously denominated Tractebel
Energia S.A. -, in accordance with its experience and the
economic scenario, market conditions and expected
events, many of which are outside the control of ENGIE
Brasil Energia. Important factors which can lead to
significant differences between effective results and the
forward-looking statements with respect to events or
results, include the business strategy of ENGIE Brasil
Energia, economic and international conditions,
technology, financial strategy, development of the
government services industry, hydrological conditions,
conditions in the financial markets, uncertainty surrounding
the results of its future operations, plans, objectives,
expectations and intentions and other factors. In the light
of these factors, the effective results of ENGIE Brasil
Energia may differ significantly from those indicated or
implicit in the forward-looking statements with respect to
events or results.
The information and opinions contained herein should not
be understood as a recommendation to potential investors
and no investment decision should be based on the
veracity, topicality or completeness of this information or
these opinions. None of the advisors to ENGIE Brasil
Energia or the parties related thereto or their
representatives shall accept responsibility for any losses,
which may occur as a result of the use or the content in
this presentation.
This material includes forward-looking statements as to
events subject to risks and uncertainties, which based on
existing expectations and forecasts on future events and
tendencies, may affect the businesses of ENGIE Brasil
Energia. These forward-looking statements include
forecasts of economic growth and energy supply and
demand as well as information on competitive position, the
regulatory environment, growth potential opportunities and
other matters. Innumerous factors can affect adversely the
estimates and assumptions on which these statements are
based.

304/19/2018 ENGIE BRASIL ENERGIA S.A. RESULTS PRESENTATION 1Q18
Chapter 1 Highlights, Shareholding Structure, Assets, Market
Share and Sales
Chapter 2 Energy Market in Brazil
Chapter 3 Sales Strategy
Chapter 4 Expansion
CONTENT
Chapter 5 Financial Performance
Supporting DataChapter 6

Highlights, Shareholding
Structure, Assets, Market
Share and Sales

HIGHLIGHTS
04/19/2018 ENGIE BRASIL ENERGIA S.A. RESULTS PRESENTATION 1Q185
Main financial and operational indexes:
Notes:1 Ebitda represents: net income + income tax and social contribution + financial result + depreciation and amortization.2 ROE: net income for the past 4 quarters/shareholders’ equity.3 ROIC: effective tax rate x EBIT / invested capital (invested capital: debt – cash and cash equivalents – deposits earmarked for debt servicing + SE). 4 Adjusted amount, net of gains from hedge operations.5 Total gross electricity output from the plants operated by ENGIE Brasil Energia.6 Disregarding sales for quotas regime (Jaguara and Miranda HPPs).7 Net of taxes and exports.
(in R$ million) 1Q18 1Q17 Chg.
Net Operating Revenue (NOR) 1,868.9 1,605.9 16.4%
Results from Operations (EBIT) 875.6 734.7 19.2%
Ebitda (1) 1,046.6 885.5 18.2%
Ebitda / NRS - (%) (1) 56.0 55.1 0.9 p.p.
Net Income 489.3 450.7 8.6%
Return On Equity (ROE) (2) 27.9 23.4 4.5 p.p.
Return On Invested Capital (ROIC) (3) 21.1 23.0 -1.9 p.p.
Net Debt (4) 5,800.3 1,220.1 375.4%
Power Production (avg MW) (5) 4,630 4,762 -2.8%
Energy Sold (avg MW) (6) 4,174 4,025 3.7%
Average Net Sales Price (R$/MWh) (7) 177.76 179.69 -1.1%
Number of Employees - Total 1,166 1,127 3.5%
EBE Employees 1,117 1,086 2.9%
Employees on Under Construction Plants 49 41 19.5%

04/19/2018 ENGIE BRASIL ENERGIA S.A. RESULTS PRESENTATION 1Q186
HIGHLIGHTS(cont’d)
In the light of the downgrading of
Brazil sovereign rating to ‘BB-’ in
February, Fitch Ratings lowered the
Company’s Long Term International
Rating in foreign currency to ‘BB’
with stable outlook, still therefore one
notch above sovereign rating. In
March, the rating was reaffirmed
together with the Long Term National
Rating at ‘AAA(bra)’ with a stable
outlook.
The contract for the concession of
the lot successfully bid at the
Transmission Auction 02/2017 was
signed.
EBE assured the sale under the
Free Contracting Environment of
volumes of approximately 300
average MW for delivery in each
one of the years from 2020 to 2022,
this in line with the gradual medium
and long term energy contracting
strategy.
The Jaguara and Miranda HPP, for the
first time, contributed in full to
Company revenues in 1Q18. The
revenue from the ACR of both plants
totaled R$ 112.6 million, having also
benefited from the allocation of 30% of
the assured energy under the ACL.

HIGHLIGHTS(cont’d)
04/19/2018 ENGIE BRASIL ENERGIA S.A. RESULTS PRESENTATION 1Q187
The Company announced that
negotiations for the sale of the Jorge
Lacerda Thermoelectric Complex and
the Pampa Sul Thermoelectric Plant
with ContourGlobal had not transpired
satisfactorily. EBE will seek
alternatives in order to continue the
decarbonization of its portfolio.
Approved at the Annual General
Meeting the distribution of
complementary dividends in the
amount of R$ 636.8 million (R$
0.9755 per share). The shares will
trade ex-dividends as from April 24
and payout will take place on June
28, 2018.
The Board of Directors authorized the
Company to submit a proposal for the
acquisition of the 50% remaining shares
of ENGIE Geração Solar Distribuída. The
acquisition is expected to be concluded
during 2018.

04/19/2018 ENGIE BRASIL ENERGIA S.A. RESULTS PRESENTATION 1Q188
SHAREHOLDING STRUCTURE
Simplified version
93.32%
100.00%
100.00%
40.00%
CompanhiaEnergética
Estreito
Energy Brasil
99.12%
Energy International
ENGIE S.A.
99.99%48.75% 100.00% 100.00%
Lages Bioenergética
40.07%
100.00%
Energias Eólicas do Nordeste
Tupan
100.00%
Hidropower
100.00%
IbitiúvaBioenergética
95.00%
100.00%
Energias Eólicas do Ceará
100.00%
Pampa Sul –
Miroel Wolowski
100.00%
Campo Largo
100.00%
Brasil Participações Ltda.
Assú V
100.00%
Brasil Energia Comercializadora
Brasil Energias Complementares
EGIEY
ADR NÍVEL I
Geração SolarDistribuída
Ferrari
50.00%
Brasil Energia S.A.
Geramamoré Part. e Comerc. de Energia Ltda
100.00% 68.71%
Companhia Energética
Miranda
Companhia Energética
Jaguara
100.00% 100.00%

3,719 3,719
4,846
5,036
5,890
6,094 6,188
6,431 6,472
6,908 6,909 6,965 7,027 7,044 7,010
7,678 7,678
199819992000200120022003200420052006200720082009201020112012201320142015201620171Q18
5,918
04/19/2018 ENGIE BRASIL ENERGIA S.A. RESULTS PRESENTATION 1Q189
Own installed capacity of
7,678 MWfrom 30 plants
operated by the
Company
Hydro
Thermal
Complementary
83%11%
6%
Proprietary Operating Installed Capacity
CONSISTENT EXPANSIONin a diversified portfolio of assets
Note: 1 The transfer of the 40% stake of ENGIE Brasil Part. in Jirau HPP to EBE should be examined shortly.
Thermal
Complementary
Expansion
Hydro
Key
30 plants
Transmission
1

ENGIE Brasil Energia is part of the largest independent power producer group in the country and is
positioned to capture business opportunities.
04/19/2018 ENGIE BRASIL ENERGIA S.A. RESULTS PRESENTATION 1Q1810
Source: Aneel, Companies’ websites and in-house studies.
Notes: ¹ Apparent sum-related errors are a result from rounding of addends.2 Amount corresponding to National Interlinked System (SIN), considering the Operation Monthly Program (PMO) as of January, 2018. 3 Includes only the Brazilian part of Itaipu.4 Considering the consolidated installed capacity of the group, of the 9.2GW in operation from ENGIE Group in Brazil, EBE accounts for 7.7GW.5 Based on information from Aneel, ONS and internal study.
Private Sector – Installed Capacity1 (GW) Brazil – Existing Installed Capacity2,3
RELEVANT POSITIONamong the private power producers
Current installed capacity Installed capacity under expansion5
2.7
Enel
4.1
2.0
1.0
3.2
CTG
8.2
2.1
EDP
3.2
Neoenergia
3.9
3.1 2.7
0.5
AES
Tietê
1.9
1.9
8.1
0.1
ENGIE4
10.2
9.20.8
CPFL
3.2
SPIC
2.71.7
Eneva
1.7
Other
40.2%
Eletrobras
27.8%
ENGIE4
6.2%
CTG
5.5%
Itaipu
4.7%
Petrobras
4.5%
Cemig
3.9%
Copel
3.3%
CPFL
2.1%
AES
1.8%
04/19/2018 ENGIE BRASIL ENERGIA S.A. RESULTS PRESENTATION 1Q1811
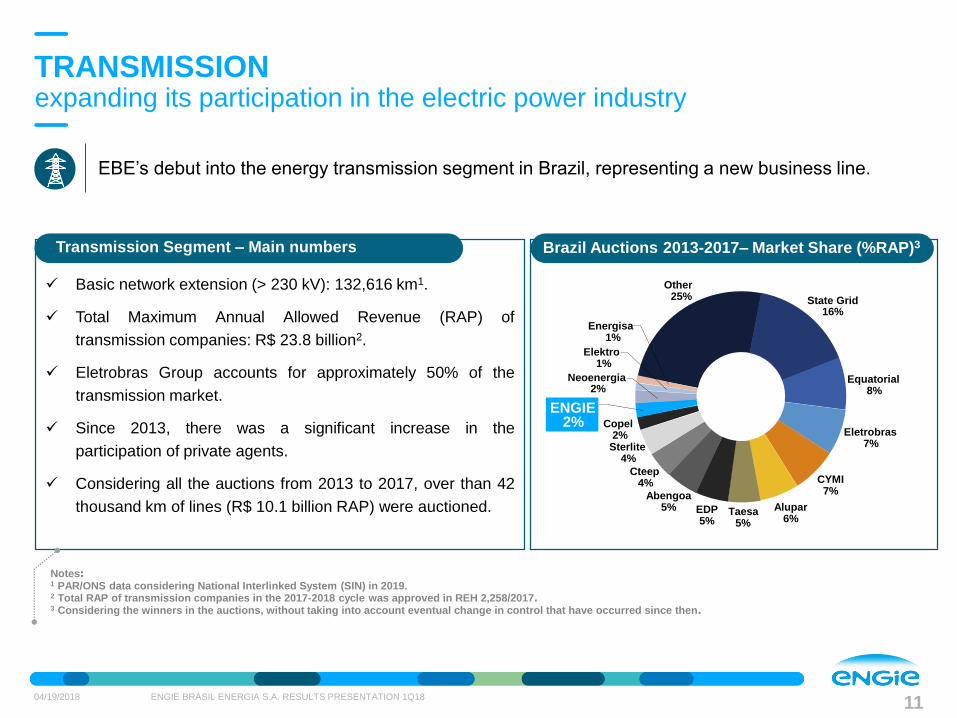
Basic network extension (> 230 kV): 132,616 km1.
Total Maximum Annual Allowed Revenue (RAP) of
transmission companies: R$ 23.8 billion2.
Eletrobras Group accounts for approximately 50% of the
transmission market.
Since 2013, there was a significant increase in the
participation of private agents.
Considering all the auctions from 2013 to 2017, over than 42
thousand km of lines (R$ 10.1 billion RAP) were auctioned.
EBE’s debut into the energy transmission segment in Brazil, representing a new business line.
Notes: 1 PAR/ONS data considering National Interlinked System (SIN) in 2019.2 Total RAP of transmission companies in the 2017-2018 cycle was approved in REH 2,258/2017. 3 Considering the winners in the auctions, without taking into account eventual change in control that have occurred since then.
Transmission Segment – Main numbers Brazil Auctions 2013-2017– Market Share (%RAP)3
TRANSMISSIONexpanding its participation in the electric power industry
Other25% State Grid
16%
Equatorial8%
Eletrobras7%
CYMI7%
Alupar6%
Taesa5%
EDP5%
Abengoa5%
Cteep4%
Sterlite4%
Copel2%
Neoenergia2%
Elektro1%
Energisa1%
ENGIE2%

DIVERSIFIED PORTFOLIOamong distribution, free customers and trading companies
04/19/2018 ENGIE BRASIL ENERGIA S.A. RESULTS PRESENTATION 1Q1812
Client Breakdown
(based on contracted energy)
Distribution Companies Trading Companies
Free Customers
Product assembly
Long-term cash flow predictability
• Largest consumer market
• Regulated and unregulated contracts (signed until 2004)
• Opportunistic contracts (purchase/sale)
First to consistently serve the free
market…
…to minimize risks and to maximize
portfolio`s efficiency.
• Flexibility (prices, terms and conditions)
Maximizes portfolio’s efficiency
The portfolio of free customers rose from 280 in 1Q17 to 326 in 1Q18, an increase of 16.4%.
47% 44%34% 37% 44%
3% 7%10% 12%
8%
50% 49%56% 51% 48%
2015 2016 2017 2018E 2019E

DIVERSIFICATIONalso within the free customers portfolio
04/19/2018 ENGIE BRASIL ENERGIA S.A. RESULTS PRESENTATION 1Q1813
Free customer industry diversification and a strict credit assessment policy allow for a zero
default reality in the Free Contracting Environment (ACL).
Source: Internal study based on IBGE’s classification.
Free customers total sales volume for 2018: 2,273 average MW
10.8% 10.4%
8.7%8.2%
7.3% 7.1%6.2%
5.2%4.3% 4.0% 3.7% 3.6% 3.3% 2.9% 2.8% 2.8%
8.7%

Energy Market
in Brazil
ENERGY MARKET
04/19/2018 ENGIE BRASIL ENERGIA S.A. RESULTS PRESENTATION 1Q1815
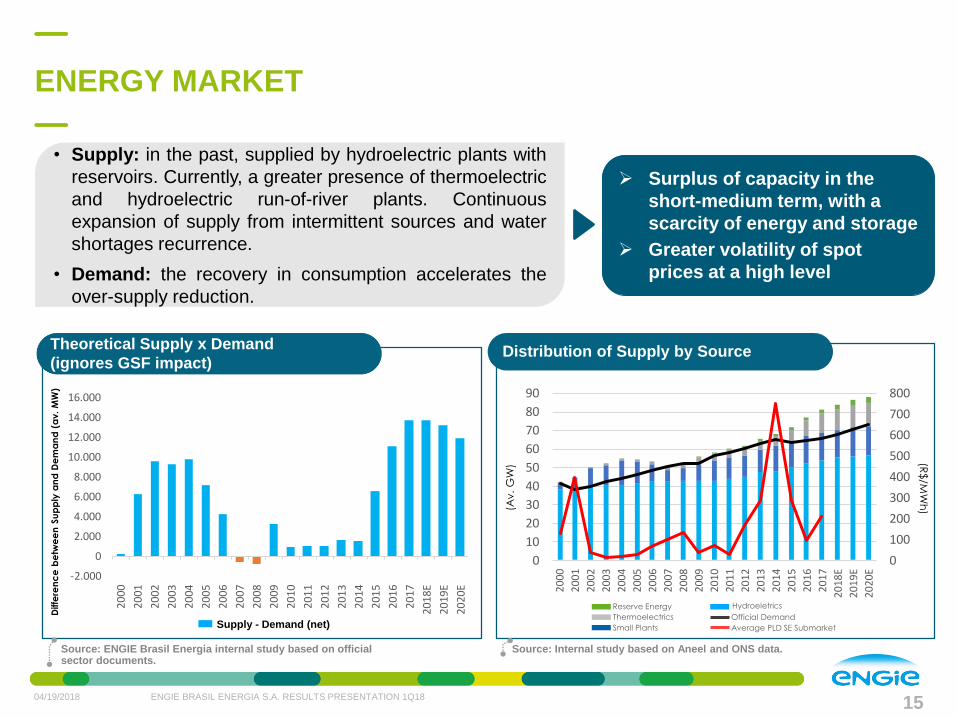
Source: Internal study based on Aneel and ONS data.Source: ENGIE Brasil Energia internal study based on official sector documents.
Diffe
ren
ce
be
twe
en
Su
pp
ly a
nd
De
ma
nd
(a
v.
MW
)
Supply - Demand (net)
(R$
/MW
h)
Average PLD SE Submarket
Reserve Energy
Thermoelectrics
Small Plants
Hydroeletrics
Official Demand
(Av
. G
W)
• Supply: in the past, supplied by hydroelectric plants with
reservoirs. Currently, a greater presence of thermoelectric
and hydroelectric run-of-river plants. Continuous
expansion of supply from intermittent sources and water
shortages recurrence.
• Demand: the recovery in consumption accelerates the
over-supply reduction.
Theoretical Supply x Demand
(ignores GSF impact)
Surplus of capacity in the
short-medium term, with a
scarcity of energy and storage
Greater volatility of spot
prices at a high level
Distribution of Supply by Source
0
100
200
300
400
500
600
700
800
0
10
20
30
40
50
60
70
80
90
2000
2001
2002
2003
2004
2005
2006
2007
2008
2009
2010
2011
2012
2013
2014
2015
2016
2017
2018E
2019E
2020E-2.000
0
2.000
4.000
6.000
8.000
10.000
12.000
14.000
16.000
2000
2001
2002
2003
2004
2005
2006
2007
2008
2009
2010
2011
2012
2013
2014
2015
2016
2017
2018E
2019E
2020E

Sales
Strategy

COMMERCIAL STRATEGYconsiders the gradual sale of future availability
04/19/2018 ENGIE BRASIL ENERGIA S.A. RESULTS PRESENTATION 1Q1817
Note: ¹ Percentage of total resources.
(average MW)
ENGIE Brasil Energia
uncontracted energy1
ENGIE Brasil Energia: uncontracted energy compared to the availability of a given year
26
% 31
%
42
%
50
%
51
%
14
%
22
%
34
%
45
% 48
%
9%
15
%
29
%
41
%
36
%
12
%
13
% 17
%
26
%
36
%
2018 2019 2020 2021 2022
12/31/2014
12/31/2015
12/31/2016
12/31/2017
609676
529
1,001
1,539
2,022
11.4%
12.3%
10.2%
19.7%
30.2%
40.3%
2018 2019 2020 2021 2022 2023

ENERGY BALANCE AS OF MARCH 31, 2018
04/19/2018 ENGIE BRASIL ENERGIA S.A. RESULTS PRESENTATION 1Q1818
2 Sales price is net of ICMS and taxes over revenue (PIS/Cofins, R&D), i.e. future inflation is not considered.3 Disregarding sales for quotas regime (Jaguara and Miranda HPPs).4 Purchase net price, considering benefits from PIS/Cofins credits, i.e. future inflation is not considered.
Notes: - The balance refers to the settlement point (net of losses and internal consumption of the plants).- The average prices are considered simply estimates and are based on financial planning revisions, not capturing volume changes, which are updated quarterly.
1 XXXX-YY-WWWW-ZZ, where:XXXX -> year of auctionYY -> EE = existing energy or NE = new energyWWWW -> year of delivery startZZ -> supply contract duration (in years)
(in average MW) 2018 2019 2020 2021 2022 2023
Own Resources 4,092 4,628 4,716 4,725 4,738 4,736 Auction Reference Gross Price
+ Purchases for Resale 1,244 868 492 367 356 283 Gross Price Date Adjusted
= Total Resources (A) 5,336 5,496 5,208 5,092 5,094 5,019 (R$/MWh) (R$/MWh)
Government Auction Sales1
1,638 1,997 2,013 2,013 2,013 2,013
2005-NE-2010-30 200 200 200 200 200 200 115.1 Dec-05 219.8
2006-NE-2009-30 493 493 493 493 493 493 128.4 Jun-06 241.2
2006-NE-2011-30 148 148 148 148 148 148 135.0 Nov-06 252.0
2007-NE-2012-30 256 256 256 256 256 256 126.6 Oct-07 226.8
2014-EE-2014-06 103 103 - - - - 270.7 May-14 333.0
Proinfa 19 19 19 19 19 19 147.8 Jun-04 255.4
1st Reserve Energy Auction 14 14 14 14 14 14 158.1 Aug-08 274.0
Auction Mix (New Energy / Reserve / DG) 18 17 14 14 14 14 - - 253.8
2014-NE-2019-25 - 173 295 295 295 295 183.5 Mar-14 235.7
2014-NE-2019-25 - 10 10 10 10 10 206.2 Nov-14 255.3
2014-NE-2019-20 - 83 83 83 83 83 139.3 Nov-14 172.5
2015-NE-2018-20 - 46 46 46 46 46 188.5 Aug-15 215.6
8th Reserve Energy Auction 9 9 9 9 9 9 303.0 Nov-15 341.3
2017-EN-2019-20 - 48 48 48 48 48 136.4 Nov-14 168.1
Government Auction - Quotas regime
2018 - Quotas (UHJA) - 2018-30 239 239 239 239 239 239 - Jul-17 134.7
2018 - Quotas (UHMI) - 2018-30 139 139 139 139 139 139 - Jul-17 151.2
+ Bilateral Sales 3,089 2,823 2,666 2,078 1,542 984
= Total Sales (B) 4,727 4,820 4,679 4,091 3,555 2,997
Balance (A - B) 609 676 529 1,001 1,539 2,022
Sales Average Price (R$/MWh) (Net)2,3: 180.8 184.2 185.9
Purchases Average Price (R$/MWh) (Net)4: 182.0 184.7 166.8

Expansion

EXPANSION:Jirau | update
04/19/2018 ENGIE BRASIL ENERGIA S.A. RESULTS PRESENTATION 1Q1820
MW
2,205
PHYSICAL
GUARANTEE
75
MW
EACH
50
GENERATING
UNITS
MW
3,750
INSTALLED
CAPACITY
ESBR shareholders
40%
20%
20%
20%
CAPEX: approximately R$ 20 billion (Dec/2016)
Financing conditions
• R$ 9.5 billion (initial R$ 7.2 billion + R$ 2.3 billion)
with amortization in 20 years: 100% financed by
BNDES
• interested rate: TJLP + spread from 2.25% to 2.65%
Majeure lawsuit - recognition of 535 days in the
First Instance. Analysis processing in the Second
Instance

EXPANSION:Jirau | update
04/19/2018 ENGIE BRASIL ENERGIA S.A. RESULTS PRESENTATION 1Q1821
Options to create additional value
• Constant reservoir level
• Recalculation of transmission tariff
• Sale of carbon credits
• Additional long-term tax breaks
• Recalculation of GFOM/Renegotiation of GSF
• Rebalancing of the agreement
ESBR PPA’s portfolio(MW average)
1,141 1,526 1,578 1,578
539
539 539 330
82 14
14
195 58 74
613
April to Dec/17 2018 2019-2034 2035-2043
Regulated Partners
Bilateral Uncontracted/Losses
2,205 2,2052,2052,205
Note: 1 Subject to final CCEE booking.
Production (MW average)1
1Q17
2,468
+16.0%
1Q18
2,863
• Uptime operating factor in
1Q18: 99.5%1

EXPANSION:ENGIE Geração Solar Distribuída
04/19/2018 ENGIE BRASIL ENERGIA S.A. RESULTS PRESENTATION 1Q1822
Acting in the segment of decentralized solar energy generation
In 1Q18, was announced the launch of the second phase of the Solar Industry Program, in
partnership with Fiesc and WEG S.A.
Presence in 16 states Installed capacity (kWp) Photovoltaic systems installed
56
260
1Q17 1Q18
9681,219
26%
Total of 1,788 installed systems, with 9,744 kWp of capacity.

Section 5
Section 4
Section 3
Section 2
Section 1
EXPANSION:Gralha Azul Transmission System – Aneel Auction 02/2017
04/19/2018 ENGIE BRASIL ENERGIA S.A. RESULTS PRESENTATION 1Q1823
• Composition: 13 transmission lines totaling around 1,050 km and five substations
• Access to finance at competitive rates
• Location offers synergies with Salto Santiago and Salto Osório HPPs
Expected anticipation of COD with investment below Aneel projections
Transmission Line – Lot 1
Paraná (PR)
Contracted Annual Allowed Revenue (R$ mm): 231.7
Aneel Capex: R$ 2.0 billion
Deadline to start operations: March, 2023
Concession period: 30 years
Line Tension: 525 kV (around 540 km)
230 kV (around 510 km)
Substation capacity:
- 1 substation from 525 to 230 kV – 2,016 MVA
- 4 substations from 230 to 138 kV – 1,350 MVA
9.8%
RAP by section (%)
68.5%
6.3%
10.1%
5.3%
Section 1 Section 2
Section 3 Section 4
Section 5
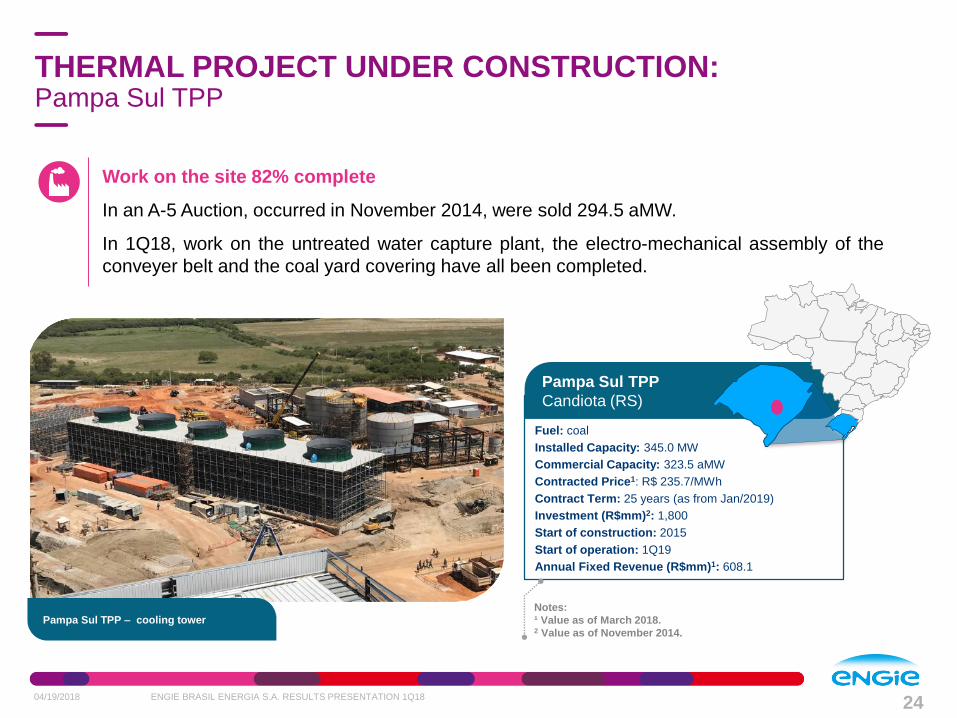
THERMAL PROJECT UNDER CONSTRUCTION:Pampa Sul TPP
04/19/2018 ENGIE BRASIL ENERGIA S.A. RESULTS PRESENTATION 1Q1824
Pampa Sul TPP
Candiota (RS)
Fuel: coal
Installed Capacity: 345.0 MW
Commercial Capacity: 323.5 aMW
Contracted Price1: R$ 235.7/MWh
Contract Term: 25 years (as from Jan/2019)
Investment (R$mm)2: 1,800
Start of construction: 2015
Start of operation: 1Q19
Annual Fixed Revenue (R$mm)1: 608.1
Notes:
¹ Value as of March 2018.2 Value as of November 2014.
Work on the site 82% complete
In an A-5 Auction, occurred in November 2014, were sold 294.5 aMW.
In 1Q18, work on the untreated water capture plant, the electro-mechanical assembly of the
conveyer belt and the coal yard covering have all been completed.
Pampa Sul TPP – cooling tower
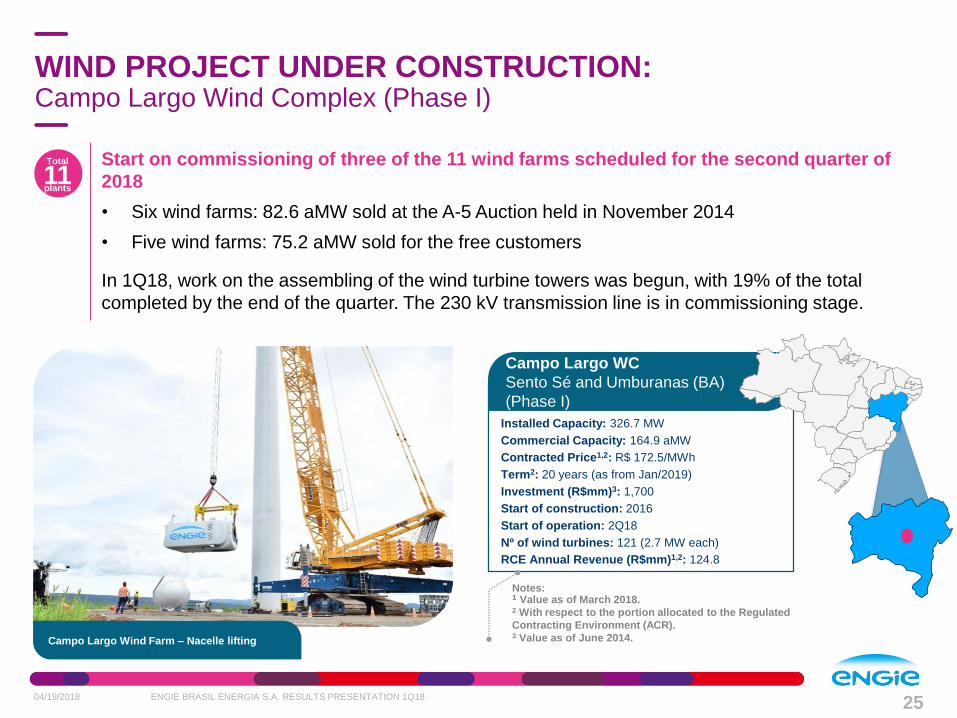
WIND PROJECT UNDER CONSTRUCTION:Campo Largo Wind Complex (Phase I)
04/19/2018 ENGIE BRASIL ENERGIA S.A. RESULTS PRESENTATION 1Q1825
Total
11plants
Campo Largo WC
Sento Sé and Umburanas (BA)
(Phase I)
Installed Capacity: 326.7 MW
Commercial Capacity: 164.9 aMW
Contracted Price1,2: R$ 172.5/MWh
Term2: 20 years (as from Jan/2019)
Investment (R$mm)3: 1,700
Start of construction: 2016
Start of operation: 2Q18
Nº of wind turbines: 121 (2.7 MW each)
RCE Annual Revenue (R$mm)1,2: 124.8
Notes: 1 Value as of March 2018.2 With respect to the portion allocated to the Regulated
Contracting Environment (ACR).3 Value as of June 2014.
Start on commissioning of three of the 11 wind farms scheduled for the second quarter of
2018
• Six wind farms: 82.6 aMW sold at the A-5 Auction held in November 2014
• Five wind farms: 75.2 aMW sold for the free customers
In 1Q18, work on the assembling of the wind turbine towers was begun, with 19% of the total
completed by the end of the quarter. The 230 kV transmission line is in commissioning stage.
Campo Largo Wind Farm – Nacelle lifting

WIND PROJECT UNDER CONSTRUCTION:Umburanas Wind Complex (Phase I)
04/19/2018 ENGIE BRASIL ENERGIA S.A. RESULTS PRESENTATION 1Q1826
Acquisition of the Umburanas WC reinforces the Bahia wind generation cluster with the
capture of synergies
Of the 360 MW, 257.5 MW will be allocated to the free market with high contracting level in the
medium and long terms and 102.5 MW was sold at the A-5/2014 Auction.
In 1Q18, 13 of the 144 wind turbines foundations have been concreted.
Umburanas WC
Umburanas (BA)
Installed Capacity: 360.0 MW
Commercial Capacity: 207.5 aMW
Contracted Price1,2: R$ 168.1/MWh
Term1: 20 years (as from 2019)
Investment (R$mm)3: 1,800
Start of construction: November 2017
Start of operation: as from January 2019
RCE Annual Revenue (R$mm)1,2: 70.8
Notes: 1 With respect to the portion allocated to the Regulated Contracting Environment (ACR).2 Value as of March 2018.3 Value as of September 2017.Umburanas Wind Farm – concreting of the first foundation

PROJECTS UNDER DEVELOPMENT
04/19/2018 ENGIE BRASIL ENERGIA S.A. RESULTS PRESENTATION 1Q1827
ENGIE Brasil Energia has also a portfolio of assets under development.
Some of them are presented below.
Note:
¹ Approximated values.
Installed Capacity: 600 MW
Commercial Capacity1: 400 aMW
Fuel: natural gas
Norte Catarinense TPP - SC
Installed Capacity: 600 MW
Commercial Capacity1: 300 aMW
Sto. Agostinho WC - RN
Installed Capacity1: 90 MWp
Alvorada Photovoltaic Complex - BA
Installed Capacity1: 146.8 MWp
Assú I, II, III and IV Photovoltaic Centrals - RN
Installed Capacity1: 330.0 MW
Commercial Capacity: ~ 160.0 aMW
Campo Largo WC - BA (Phase II)
Installed Capacity: 245 MW
Umburanas WC – BA (Phase II)

Financial
Performance

04/19/2018 ENGIE BRASIL ENERGIA S.A. RESULTS PRESENTATION 1Q1829
SOLID FINANCIAL PERFORMANCE
Efficiency in the management of the portfolio and the focus on contracting strategies has enabled
the Company to report stability in the levels of revenue generation, Ebitda and net income despite
recent instability that affected the electricity sector and the Brazilian economy as a whole.
Net Operating Revenue
(R$ million)Ebitda
(R$ million)
Net Income
(R$ million)
+16.4%
2016
6,442
1Q172015
6,5127,010
1,606
+3.8% p.y.
1Q18
1,869
2017
+18.2%
1Q18
+6.3% p.y.
1Q17
3,115
1,047
3,520
3,176
20172015
886
2016
+8.6%
2017
2,005
1Q17
451
+15.6% p.y.
1Q18
489
2016
1,5481,501
2015

NET OPERATING REVENUE CHANGE
04/19/2018 ENGIE BRASIL ENERGIA S.A. RESULTS PRESENTATION 1Q1830
Net operating revenue change (R$ million)
% of the net
operating revenue
4th Quarter
3rd Quarter
2nd Quarter
1st Quarter
100%
1,869
25%
2013
5,569
27%
25%
23%
25%
7,010
2017
29%
24%
24%
23%
2016 2018
26%
25%
24%
25%
2015
6,512
26%
25%
24%
25%
2014
6,472
27%
27%
21%
6,442
1,606
1,869110
Jaguara and
Miranda HPPs
113
NOR 1Q17 ST trading/
CCEE
40
Average volume
and sales price
NOR 1Q18

EBITDA CHANGE
04/19/2018 ENGIE BRASIL ENERGIA S.A. RESULTS PRESENTATION 1Q1831
Ebitda change (R$ million)
% of the accumulated annual Ebitda
4th Quarter
3rd Quarter
2nd Quarter
1st Quarter
2016
25%
24%
20%
2018
1,047
31%
2017
3,520
31%
2,895
21%
35%
2014
19%
3,176
28%
24%
27%25%
25%
2015
3,115
25%
10%
31%
3,043
2013
25%24%
26%
24%
100%
Notes: 1 Considers the combined effect of changes in revenue and expenses.2 GAG: Generation Assets Management
1,0474078
85886
Ebitda
1Q17
(8)
Jaguara
and Miranda
HPPs
(9)
GAG2
Jaguara and
Miranda
HPPS
Fuel
6
ST trading/
CCEE1
28
OtherCharges for
use of the
electricity
grid
(8)
Sales price
and volume
(51)
Third party
materials
and services
Purchases
for
resale
Ebitda
1Q18

NET INCOME CHANGE
04/19/2018 ENGIE BRASIL ENERGIA S.A. RESULTS PRESENTATION 1Q1832
Net income change (R$ million)
% of the
accumulated
annual net income
4th Quarter
3rd Quarter
2nd Quarter
1st Quarter
2018
489
2017
2,005
22%
2016
18%
25%
35%
31%
1,548
22%
22%
40%
1,383
23%
21%14%
26%
1,501
23%
2015
35%
2014
100%
39%
5%21%
2013
1,437
20%
28%
30%
(19)
451
161
4891
(85)
Net income
1Q18
Net income
1Q17
Financial
result
Equity
income
Income
taxes
(17)
Depreciation
and amortization
Ebitda
(1)
Note:1 Apparent sum-related errors are a result from rounding of addends.

Creation of shareholder value: high levels of ROE and ROIC.
CONSISTENT FINANCIAL INDICATORS
04/19/2018 ENGIE BRASIL ENERGIA S.A. RESULTS PRESENTATION 1Q1833
ROE1 – Return on Equity (%) ROIC2 – Return Over Invested Capital (%)
Notes:1 ROE: net income for the past 4 quarters / shareholders’ equity. 2 ROIC: effective tax rate x EBIT / invested capital (invested capital: debt – cash and cash equivalents – deposits earmarked for debt servicing + SE).
Source: ENGIE Brasil Energia internal study based on the Company’s Financial Statements.
1Q172017
29.3
2016
23.4
2015
22.6
1Q18
23.4
27.9
2017
22.8
2016
22.6
2015
22.7
1Q17 1Q18
23.021.1

LIMITED DEBTwith no currency exposure
04/19/2018 ENGIE BRASIL ENERGIA S.A. RESULTS PRESENTATION 1Q1834
Adjustment in leverage, with competitive cost, facilitates the growth opportunities that were
captured
Notes:1 Debt net of hedge operations.2 Funds from Operations. 3 Ebitda in the past 12 months.
Tota
l Debt / E
bitd
a3
Debt Overview (R$ million)
Local Currency Debt FFO2 / Total Debt% Net Debt / LTM Ebitda3Total Debt / LTM Ebitda3
5,800
3,7581
3,0891
6,7381 6,7541 716
237
2015 2016 2017 1Q18 Cash and
equivalents
Escrow
deposits
Net debt
1Q18
100%
100%
100%
0.780.92
0.46
0.68
0.4x 0.3x
1.3x
1.6x
1.2x
1.0x
1.9x 1.8x
(R$ m
illio
n)

NET DEBT CHANGE
04/19/2018 ENGIE BRASIL ENERGIA S.A. RESULTS PRESENTATION 1Q1835
Notes:1 Does not impact the Company’s cash position.2 The interests and FX change refer only to the Company’s financial debt (loans, financing and debentures).
Net debt change (R$ million)
5,800
(981)13460
1,357
4,582
Net debt
12/31/2017
57 5562
Working
capital
change
Income
taxes
Other
3
Operational
activities
Fx
change1,2
8167
Operations
with
derivatives
Dividends
and IoSE
Other
investments
Net debt
03/31/2018
17
Capitalized
interestsAccrued
interest1,2
Concessions
paid

DEBT PROFILE AND COMPOSITIONlow costs and defensive indexes
04/19/2018 ENGIE BRASIL ENERGIA S.A. RESULTS PRESENTATION 1Q1836
First line rating and robust cash generation translate into competitive costs of debt for financing
growth.
Maturity debt schedule (R$ million) Composition of debt
The process of rolling over short term debt has begun.
Nominal cost of debt: 7.9%
(10.1% in 1Q17)
TJLP29%
IPCA25%
CDI46%
3,065
257 559
267
1,004
305
1,120
177
2018 2019 2020 2021 2022 2023 from 2024to 2028
from 2029to 2033

04/19/2018 ENGIE BRASIL ENERGIA S.A. RESULTS PRESENTATION 1Q1837
CAPEX
The expansion plan and maintenance CAPEX are supported by a strong cash flow generation and
prudent funding strategy.
Note:1 Does not consider interests incurred during the construction.
EbitdaNet income
Accomplished/expected CAPEX and corresponding financing sources (R$ million)
Shareholders` equity founded,
including acquisitions
Debt funded, including acquisitions
liabilities1
276 779 554
909 1,158 343 138 636
2,721
1,511
433
619 917
1.190
5,538
3,630
938 1,591
2014 2015 2016 2017 2018E
2019E
2020E
1,3831,501 1,548
2,0052,895
3,115 3,1763,520
1,6
74
3,8
64
(573)

Notes:1 Considers the annual payable net income.2 Based on volume-weighted closing price of ON shares in the period.
DIVIDEND POLICY
04/19/2018 ENGIE BRASIL ENERGIA S.A. RESULTS PRESENTATION 1Q1838
• By-law minimum payout: 30% of payable net income
• Management commitment: minimum payout of 55% of payable net income
• 2 dividends per year
Dividend per Share (R$) Payout1 Dividend Yield2
Dividends (based on distributable net income)
1.34 1.43 1.52
1.16 0.96 1.02
2.19 2.37
2.26
1.19 1.28
2.28
3.06
100% 100% 100%
72%58% 55%
100% 100% 100%
55% 55%
100% 100%
2005 2006 2007 2008 2009 2010 2011 2012 2013 2014 2015 2016 2017
12.4%8.6%
6.8% 5.7% 5.0% 4.5%8.2% 7.1% 6.3%
3.5% 3.7%6.1%
8.6%

COMPETITIVE ADVANTAGES
04/19/2018 ENGIE BRASIL ENERGIA S.A. RESULTS PRESENTATION 1Q1839
STRATEGIC INDUSTRY
Defensive profile in times of crisis
Projects with high bankability INDUSTRY LEADERSHIP
Largest independent power producer
group in Brazil
Market cap: R$ 25.6 billion in
03/31/2018
Controlled by ENGIE S.A., world
leader in energyHIGH-CALIBER CORPORATE
GOVERNANCE AND SUSTAINABILITY
Diversified and qualified team
Discipline track record in investment
decisions, based on triple bottom line concepts
First class controlling shareholder
B3’s Novo Mercado
Component of B3 ISE’s since its inception in
2005.
CLEAR COMMERCIAL STRATEGY
Heavily contracted in the next years
Diversified portfolio between free
customers (over different industries) and
regulated ones (distribution companies)
Benefits from windows of opportunities
HIGH OPERATIONAL PERFORMANCE
Benchmark indexes of availability
ISO 9001 (quality management), 14001 (environment
management) and OHSAS 18001 (occupational health and
safety) certified plants
STABLE FINANCIAL PERFORMANCE
Strong cash flow
High average Ebitda margin
Consistent net income
No FX exposure
Active financial management
CASH FLOW PREDICTABILITY
Inflation-indexed contracts
Hydro based, with diversification on
complementary sources and active
portfolio management
Long-term contracting strategy
PREMIUM RATING
Fitch Ratings rated the Company`s Local
Long Term Rating as ‘AAA(bra)’ and in global
scale “BB”, one notch above the Brazilian
sovereign rating.

Supporting
Data

Complementary P. PlantsInstalled
Capacity (MW)
Commercial
Capacity (MWa)
13 Trairi Complex (Wind)3 115.4 63.9
14 Santa Mônica Complex (Wind)3 97.2 47.4
15 Ferrari (Biomass) 80.5 35.6
16 Assú V (Solar) 30.0 9.2
17 Lages (Biomass) 28.0 11.1
18 Rondonópolis (SHP) 26.6 10.1
19 José G. da Rocha (SHP) 23.7 9.2
20 Ibitiúva (Biomass) 22.91 13.91
21 Cidade Azul (Solar) 3.0 n/a
22 Tubarão P&D (Wind) 2.1 n/a
Total 429.4 200.4
Notes:1 Portion owned by ENGIE Brasil Energia.2 Complex comprised by three power plants.3 Complex comprised by four wind farms.4 The transfer of the 40% stake of ENGIE Brasil Part. in Jirau HPP
to EBE should be examined shortly.5 Considers the revision of the physical guarantee in effect from January 1,
2018, pursuant to Ministry of Mines and Energy Ordinance 178/2017.
GenerationInstalled
Capacity (MW)
Commercial
Capacity (MWa)
23 Jirau (Hydro)4 1,500.0 882.0
24 Umburanas Complex (Wind) 360.0 207.5
25 Pampa Sul (Thermal) 345.0 323.5
26 Campo Largo Complex (Wind) 326.7 164.9
Total 2,531.7 1,577.9
DIVERSIFIED PORTFOLIO OF ASSETS
04/19/2018 ENGIE BRASIL ENERGIA S.A. RESULTS PRESENTATION 1Q1841
Installed capacity of 7,678.1 MW (4,268.0 MWa) from 30 plants operated by
ENGIE Brasil Energia: 83% hydro, 11% thermal and 6% complementary.
Hydro Power PlantsInstalled
Capacity (MW)
Commercial
Capacity (MWa)5
1 Salto Santiago 1,420.0 733.3
2 Itá 1,126.91 564.71
3 Salto Osório 1,078.0 502.6
4 Cana Brava 450.0 260.8
5 Estreito 435.61 256.91
6 Jaguara 424.0 341.0
7 Miranda 408.0 198.2
8 Machadinho 403.91 165.31
9 São Salvador 243.2 148.2
10 Passo Fundo 226.0 113.1
11 Ponte de Pedra 176.1 133.6
Total 6,391.7 3,417.7
Thermal Power PlantsInstalled
Capacity (MW)
Commercial
Capacity (MWa)
12 Jorge Lacerda Complex2 857.0 649.9
Total 857.0 649.0
Legenda
Termelétrica
Hidrelétrica
Complementar
Em Construção1
2
3
4
810
1217
9
5
11
1918
20
23
13
21
15
25
22
Key
Thermal
Hydro
Complementary
Expansion
16
14
Transmission
2624
76
Expansion
Transmission Size Substations
27 Lot 1 1,050 Km 5

* Extension term as from January 1, 2016 for payment of the premium for reimbursement to 2015 results.
RENEGOTIATIONof the hydrological risk
04/19/2018 ENGIE BRASIL ENERGIA S.A. RESULTS PRESENTATION 1Q1842
On December 31, 2015, Aneel approved the renegotiation of ENGIE Brasil Energia´s hydrological
risk as shown in the following table:
Signing up to the renegotiation is limited to agreements negotiated within the scope of the
Regulated Contracting Environment (ACR), with effects as from January 01, 2015.
Plant Product
Amount
Renegotiated
average MW
Amount
Renegotiated
MWh
Net unit
reimbursement
(R$)
Total
reimbursement
(R$ million)
Term*
(years)
Cana Brava HPP SP92 261.66 2,292,177 18.26 41.9 13.25
I tá HPP SP92 336.00 2,943,360 18.26 53.7 13.25
Machadinho HPP SP92 84.04 736,190 18.26 13.4 13.25
Ponte de Pedra HPP SP95 123.55 1,082,315 23.80 25.8 7.17
Salto Santiago HPP P97 150.00 1,314,000 24.36 32.0 2.92
São Salvador HPP SP91 142.13 1,245,048 16.52 20.6 17.25
Estreito HPP SP91 247.13 2,164,859 16.52 35.8 17.25
TOTAL 1,344.51 11,777,950 223.1

IMPACTS FROM energy allotment net result
04/19/2018 ENGIE BRASIL ENERGIA S.A. RESULTS PRESENTATION 1Q1843
Resultado líquido considerando a estratégia de sazonalização (R$ milhões)PLD finalPLD (R$)
- -
178.6
484.4
(48.3)
158.7
(10.9)
218.5
(46.7)
(276.7)
98.2
20.2
(900)
(800)
(700)
(600)
(500)
(400)
(300)
(200)
(100)
-
100
200
300
400
500
600
700
800
900
1,000
2005 2006 2007 2008 2009 2010 2011 2012 2013 2014 2015 2016 2017 2018
MB
RL
CNPE 03
(delta PLD)
CNPE 03 (CVAR)
73.4
Net result considering the allotment strategy (R$ million)
Final PLD
PLD (R$)
Disruption of
supply and
demand
balance due
to a gas
crisis and the
interruption
of power
import from
Argentina.
Safety level
for the
reservoirs is
broken.
World
economic
crisis
associated
to the 2nd
all-time
largest
water
availability in
the 2nd half
of the year
bring the
Spot Price
to the floor
as from
August
2009.
The system’s
reservoirs
reach the
lowest level
in recent
years.
2014
presented the
4th worst wet
season in 84
years.

CORRELATIONbetween reservoir levels and spot prices
04/19/2018 ENGIE BRASIL ENERGIA S.A. RESULTS PRESENTATION 1Q1844
Southern Submarket
Southeast/Central-Western Submarket
Monthly spot price (R$/MWh)
Level of reservoirs (% of max.)
Le
vel
of
Reserv
oir
s (
%) S
po
t Pric
e (R
$/M
Wh
)
Le
vel
of
Reserv
oir
s (
%)
Sp
ot P
rice (R
$/M
Wh
)
0
100
200
300
400
500
600
700
800
900
0
10
20
30
40
50
60
70
80
90
100
0
100
200
300
400
500
600
700
800
900
0
10
20
30
40
50
60
70
80
90
100

04/19/2018 ENGIE BRASIL ENERGIA S.A. RESULTS PRESENTATION 1Q1845
HEADCOUNT1
Number of employees
33.5%
29.3%
37.2%
1,086
27.2%
1,117
34.7%
38.1%
1Q17 1Q18
+2.9% p.y.
Administrative
Thermal
Renewables
34%
4%
31%
7%
24%25 to 34
35 to 44
Less than 25
45 to 54
More than 55
By gender
81%
19%
Male
Female
By age group By academic qualifications
16%10%
32%42%Technical High School
Post-Graduate
University-educated
High School Diploma
774
PlantsHeadquarter
42%
9%
91%
58%
343
Note:1 Does not consider employees posted to projects under construction.

SUSTAINABILITY INDICATORS1
04/19/2018 ENGIE BRASIL ENERGIA S.A. RESULTS PRESENTATION 1Q1846
Notes: 1 Additional indices available from ITR (ENGIE Brasil Energia website / Investors / Financial Information/ CVM Reports).2 Reference: ENGIE Sustainable Management Policy.3 GRI: Global Reporting Initiative, Standards version and sector supplement G4 version.4 TF = number of occupational accidents for every million hours of exposure to hazards.5 TG = number of days lost due to occupational accidents for every one thousand hours of exposure to hazards.6 Amounts in thousand of reais (R$).
Item Dimension2 Index Material themes GRI disclosure3 1Q18 1Q17 Change
1 Operating plants 102-7, EU1 30 30 0
2 Installed capacity 102-7, EU1 9,399 8,761 7.3%
3 Proprietary capacity 102-7, EU1 7,678 7,040 9.1%
4 Number of certified plants 102-16, EU6 12 12 0
5 Certified installed capacity (MW) 102-16, EU6 8,127 8,127 0.0%
6 Certified installed capacity in relation to the total 102-16, EU6 86.5% 92.8% -6.3 p.p.
7 Installed capacity from renewable sources 102-7, EU1 8,542 7,714 10.7%
8 Installed capacity from renewable sources in relation to the total 102-7, EU1 90.9% 88.0% 2.83 p.p.
9 Energy generation (GWh) EU2 10,001 10,287 -2.8%
10 Certified energy generation 102-16, EU6 9,056 10,036 -9.8%
11 Certified energy generation in relation to the total 102-16, EU6 90.6% 97.6% -7.0 p.p.
12 Energy generation from renewable sources (GWh) EU2 9,097 9,315 -2.3%
13 Energy generation from renewable sources in relation to the total EU2 91.0% 90.6% 0.4 p.p.
14 Uptime ratio, excluding scheduled stoppages EU30 98.2% 95.2% 3.0 p.p.
15 Uptime ratio, including scheduled stoppages EU30 94.0% 87.2% 6.8 p.p.
16 Saplings donated and planted (sum-total of planted and donated saplings) 304-2, 413-1 153,723 30,320 407.0%
17 Number of visitors at the plants 413-1 2,177 3,205 -32.1%
18 CO2 Emissions (fossil fuel plants) (t/MWh) D305-1, D305-2, D305-3 0.9370 0.988 -5.2%
19 CO2 Emissions from Tractebel Energia's generation complex(t/MWh) D305-1, D305-2, D305-3 0.085 0.093 -9.4%
20 Frequency Rate ("Taxa de Frequência" - TF) own employees4 403-2 0.000 0.000 -
21 Severity Rate ("Taxa de Gravidade" - TG) own employees5 403-2 0.000 0.000 -
22 Frequency Rate ("Taxa de Frequência" - TF) own employees + long term service providers4 403-2 0.000 0.000 -
23 Frequency Rate ("Taxa de Frequência" - TF) short term service providers + ongoing constructions4 403-2 3.100 0.000
24 Non-incentivized investments 203-2, 413-1 649.4 464.0 40.0%
25 Investments through the Infancy and Adolescence Fund (FIA) 203-2, 413-1 383.9 201.1 90.9%
26 Investments through the Culture Incentive Law (Rouanet) 203-2, 413-1 3,385.8 4,737.0 -28.5%
27 Investments through the Sport Incentive Law 203-2, 413-1 320.0 0.0 100.0%
28 Investments through National Program of Support to Oncology Care (Pronon) 203-2, 413-1 0.0 0.0 -
29 Investments through the National Care Support Program for People with Special Needs (Pronas/PCD) 203-2, 413-1 0.0 0.0 -
30 Investments through the Municipal Fund for the Elderly 203-2, 413-1 492.4 22.1 100.0%
Quality
Environ-
ment
Occupatio-
nal Heath
and Safety
(OH&S)
Social
Responsibi-
lity6
- Energy and Climate
Change
- Energy and climate
change
- Engajament with
local comunities and
stakeholders
- Biodiversity - Health and safety,
development and
equality
- Management of
impacts in the
productive chain
- Engajament with
local comunities and
stakeholderss

CONTACTS
04/19/2018 ENGIE BRASIL ENERGIA S.A. RESULTS PRESENTATION 1Q1847
Carlos Freitas
Chief Finance and Investor Relations Officer
Rafael Bósio
Investor Relations Manager
+55 48 3221 7225
www.engieenergia.com.br