Shifting Perspectives in Healthcare: Becoming Partners with Patients
Engaging patients in their healthcare
HOW IS THE UK DOING RELATIVE TO OTHER COUNTRIES? ANGELA COULTER PICKER INSTITUTE EUROPE APRIL 2006
Picker Institute Europe The Picker Institute works with patients, professionals and policy makers to promote understanding of the patient’s perspective at all levels of healthcare policy and practice. We undertake a unique combination of research, development and policy activities which together work to make patients’ views count. There are three key strands to our work:
• Measurement - researching and evaluating patients’ experience • Improvement - leading initiatives that make improvements happen • Policy - building evidence to inform health policy.
ISBN 1 905945 06 X and 978 1 905945 06 1 © Picker Institute Europe 2006 Items may be reproduced free of charge in any format or medium provided that they are not for commercial resale. This consent is subject to the material being reproduced accurately and provided it is not used in a derogatory manner or misleading context. Published by and available from: Picker Institute Europe King’s Mead House Oxpens Road Oxford OX1 1RX Tel: 01865 208100 Fax: 01865 208101 Email: [email protected] Website: www.pickereurope.org Registered charity no 1081688 Company limited by registered guarantee no 3908160

Contents
Acknowledgements...............................................................................................1
1 Executive summary .........................................................................................2
2 Introduction ....................................................................................................4 2.1 Patient engagement – a policy priority........................................................4 2.2 Why engage patients?.................................................................................5 2.3 Some methodological caveats ....................................................................6 2.4 Health policy in the six countries ...............................................................7 2.5 Health policy in the four UK nations ...........................................................8
3 The surveys ...................................................................................................10
4 Results ..........................................................................................................12 4.1 Quality of doctor-patient communication.................................................12 4.2 Access to alternative sources of information and advice...........................12 4.3 Provision of preventive care and advice ....................................................16 4.4 Informed choice of provider .....................................................................18 4.5 Risk communication and involvement in treatment decisions ...................20 4.6 Support for self-care and self-management.............................................22
5 Conclusions...................................................................................................27 5.1 How are we doing? ...................................................................................27 5.2 What’s going wrong?................................................................................28 5.3 What needs to be done? ...........................................................................29
6 Appendix: tables ...........................................................................................32 6.1 Demographic characteristics of respondents (international, 2004) ...........32 6.2 Demographic characteristics of respondents (international, 2005) ...........33 6.3 Demographic characteristics of respondents (UK, 2004) ..........................34 6.4 Demographic characteristics of respondents (UK, 2005) ..........................35 6.5 Doctor-patient communication (international, 2004) ...............................36 6.6 Doctor-patient communication (UK, 2004)...............................................36 6.7 Access to information and advice (international, 2004) ............................37 6.8 Use of telephone helplines (international, 2005) ......................................37 6.9 Access to information and advice (UK, 2004) ...........................................38
6.10 Use of telephone helplines (UK, 2005)......................................................38 6.11 Preventive advice and support for self-care (international, 2004) .............39 6.12 Preventive advice and support for self-care (international, 2005) .............39 6.13 Preventive advice and support for self-care (UK, 2004) ............................40 6.14 Preventive advice and support for self-care (UK, 2005) ............................40 6.15 Choice (international, 2004).....................................................................41 6.16 Choice (international, 2005).....................................................................42 6.17 Choice (UK, 2004) ....................................................................................43 6.18 Choice (UK, 2005) ....................................................................................44 6.19 Shared decision-making (international, 2004)..........................................45 6.20 Shared decision-making (international, 2005)..........................................45 6.21 Shared decision-making (UK, 2004) .........................................................46 6.22 Shared decision-making (UK, 2005) .........................................................46 6.23 Self-management (international, 2004)....................................................47 6.24 Self-management (international, 2005)....................................................48 6.25 Self-management (UK, 2004) ...................................................................49 6.26 Self-management (UK, 2005) ...................................................................50
References..........................................................................................................51

Copyright 2006 Picker Institute Europe. All rights reserved. Page 1
Acknowledgements
I am very grateful to The Health Foundation for funding the study and to the following people who provided helpful comments on an earlier draft of this report: Janet Askham, Liz Cairncross, Sarah Claridge, Sir Donald Irvine, Vin McLoughlin, Caroline Powell and Stephen Thornton.

Copyright 2006 Picker Institute Europe. All rights reserved. Page 2
1 Executive summary
Most patients want to play an active role in their own healthcare. They want to know how to protect and improve their health when they are well; when they are ill they want information about the treatment options and likely outcomes; and, in addition to seeking fast effective health advice and care when they need it, most people also want to know what they can do to help themselves. Engaging patients in their healthcare and encouraging people to take responsibility for protecting their health are seen as the best way to ensure the sustainability of health systems. We analysed data from the Commonwealth Fund’s international health policy surveys carried out in 2004 and 2005 to examine the extent to which health professionals support patients to play an active role in their healthcare. Data from surveys carried out in the UK, Australia, Canada, New Zealand, Germany and the USA; and from England, Scotland, Wales and Northern Ireland; were used to compare performance in each country in relation to six indicators of patient engagement:
• quality of doctor-patient communication; • access to alternative sources of information and advice; • provision of preventive care and advice; • informed choice of provider; • risk communication and involvement in treatment decisions; • support for self-care and self-management.
Despite a strong policy commitment to patient-centred care, the UK results were less positive than those from the other countries for many of the six indicators of patient engagement:
• Quality of doctor-patient communication Patients in all the countries tended to give positive reports of their experience of communicating with doctors, but American patients were markedly less positive than those in the other countries. British patients gave more positive reports of doctors’ communication skills than American patients, but less positive than those from Australia and New Zealand.
• Access to alternative sources of information and advice British patients reported the lowest rate of access to medical records and next to lowest for email access to the doctor, coming after New Zealand, Australia and the USA in the ranking. Only Canadians reported a lower rate of use of email communications. However, the UK had the highest rate of use of telephone helplines (except in Northern Ireland), with nearly a third saying they had used them.
• Provision of preventive care and advice British patients were less likely than those in the other countries to say they had received opportunistic advice from doctors on disease prevention and lifestyle modification, for example weight, diet, exercise or stress reduction. However,

Copyright 2006 Picker Institute Europe. All rights reserved. Page 3
more respondents from the UK and the USA had received reminders for organised preventive care programmes, for example cancer screening, than those in Australia, Canada and New Zealand.
• Informed choice of provider British patients who had undergone surgery were less likely to have had access to information about the surgeon who carried out their operation and less satisfied with the choice of surgeons than those in the other countries.
• Risk communication and involvement in treatment decisions Fewer British patients said their doctors usually involved them in treatment decisions and they were less likely to have participated in a medication review. Their doctors were also less likely to have given them information about medicine side-effects than those in the other countries.
• Support for self-care and self-management Respondents from the UK were less likely to say that their regular doctor gives clear instructions on what to do about monitoring and managing their treatment than those in all the other countries except the USA. Among people with recent health problems, those from the UK were least likely to have been given a clear explanation of treatment goals and the treatment plan and less likely to have been given help with self-management than those in all the other countries apart from Germany. Fewer than one in five British people with chronic conditions had been given a self-management plan.
The results from the four UK nations were strikingly similar, suggesting that policy and resource differences have had little impact on clinicians’ relationships with their patients. None of the countries in the study excels in promoting patient engagement, but British patients receive less support from health professionals for engagement with their healthcare than those elsewhere. This points to shortcomings in professional education, a low level of expectation from the professional bodies and regulators, and a failure to offer appropriate incentives to encourage clinicians to treat patients as healthcare partners. Despite many efforts to promote patient and public involvement, there has been a failure to tackle the most important issue, namely the quality of interactions between patients and clinicians. Patients’ role as active partners in their healthcare is insufficiently recognised and supported by health professionals. What is needed is a major change in the way professionals work with patients in the UK. In particular, doctors, nurses and other health professionals need training in how to promote health literacy, support self-care and self-management and involve patients in treatment decisions, and their effectiveness in this regard should be monitored in regular patient surveys. Patient engagement is a key component of the strategy to keep future healthcare spending within manageable limits. The sustainability of the NHS will depend on the effectiveness of efforts to eliminate the unhealthy paternalism that still characterises patient-professional relationships in the UK.
Copyright 2006 Picker Institute Europe. All rights reserved. Page 4
2 Introduction
2.1 Patient engagement – a policy priority
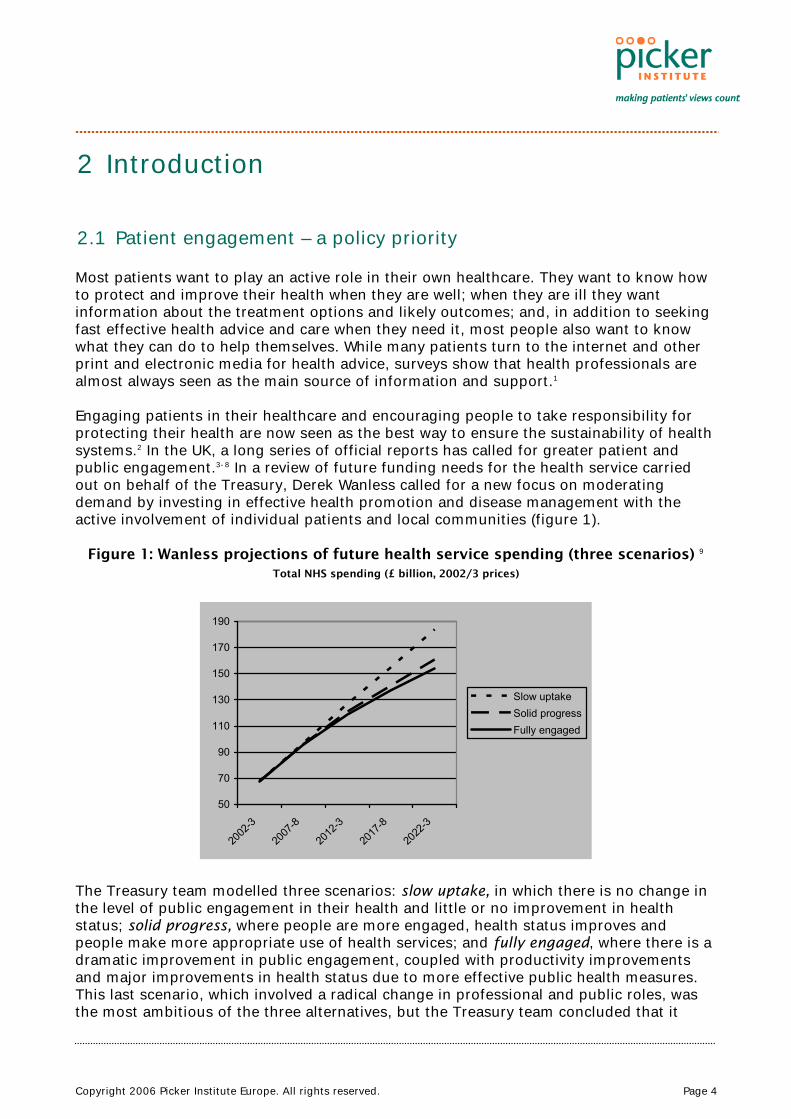
Most patients want to play an active role in their own healthcare. They want to know how to protect and improve their health when they are well; when they are ill they want information about the treatment options and likely outcomes; and, in addition to seeking fast effective health advice and care when they need it, most people also want to know what they can do to help themselves. While many patients turn to the internet and other print and electronic media for health advice, surveys show that health professionals are almost always seen as the main source of information and support.1 Engaging patients in their healthcare and encouraging people to take responsibility for protecting their health are now seen as the best way to ensure the sustainability of health systems.2 In the UK, a long series of official reports has called for greater patient and public engagement.3-8 In a review of future funding needs for the health service carried out on behalf of the Treasury, Derek Wanless called for a new focus on moderating demand by investing in effective health promotion and disease management with the active involvement of individual patients and local communities (figure 1).
Figure 1: Wanless projections of future health service spending (three scenarios) 9 Total NHS spending (£ billion, 2002/3 prices)
50
70
90
110
130
150
170
190
2002
-3
2007
-8
2012
-3
2017
-8
2022
-3
Slow uptakeSolid progressFully engaged
The Treasury team modelled three scenarios: slow uptake, in which there is no change in the level of public engagement in their health and little or no improvement in health status; solid progress, where people are more engaged, health status improves and people make more appropriate use of health services; and fully engaged, where there is a dramatic improvement in public engagement, coupled with productivity improvements and major improvements in health status due to more effective public health measures. This last scenario, which involved a radical change in professional and public roles, was the most ambitious of the three alternatives, but the Treasury team concluded that it
Copyright 2006 Picker Institute Europe. All rights reserved. Page 5
offered the best and most cost-effective means of matching demand to supply of healthcare in the longer term. By providing information to ensure that patients make appropriate use of primary care services and by encouraging effective self-care, Wanless hoped that a shift away from reliance on expensive secondary care resources could be effected, leading eventually to slower growth in health service spending. By 2022/3 they predicted the gap between slow uptake and the fully engaged scenario would be very large: around £30 billion, almost half of today’s NHS budget. The issue is now firmly at the top of the health policy agenda. If the quantity of official rhetoric was a reliable indicator of what is happening on the ground, one would expect to see evidence of a fundamental shift in the way health professionals relate to patients in support of greater involvement in their healthcare. Indeed, it might be reasonable to hope that the UK is leading the world in this respect, especially in England where the official commitment to patient and public involvement has been longest and strongest. This report examines results from two major international surveys to compare progress in six countries and the four UK nations in respect of patient engagement. We look at how each country is doing in relation to six indicators of the extent to which health professionals are supporting patients to become more engaged in their healthcare:
• quality of doctor-patient communication • access to alternative sources of information and advice • provision of preventive care and advice • informed choice of provider • risk communication and involvement in treatment decisions • support for self-care and self-management.
The data source for this analysis is the series of international health policy surveys conducted by the Commonwealth Fund of New York, specifically the surveys carried out in 2004 and 2005 which sought the views of patients and members of the public on the quality of their healthcare.10 In 2004 the sample consisted of random populations in each of five countries who participated in telephone interviews carried out by Harris Interactive and its associates. In 2005 a screening question was used to identify ‘sicker adults’, i.e. those who had experienced serious health problems in the past two years. These people were then questioned over the ‘phone about their experiences of healthcare. The countries involved were Australia, Canada, New Zealand, USA, UK and Germany (which participated in 2005 but not 2004). For these two surveys, the Health Foundation, a UK-based health charity, funded an extension of the UK sample to enable a comparison of results from the four UK nations: England, Wales, Scotland and Northern Ireland. 2.2 Why engage patients?
Patients can play a distinct role in their own care by diagnosing and treating minor, self-limiting conditions and by preventing occurrence or recurrence of disease or harm, by selecting the most appropriate form of treatment for acute conditions in partnership with health professionals, and by actively managing chronic diseases. Recognising these roles and seeking to strengthen them is fundamental to securing a more patient-centred approach to healthcare delivery, the central aim of the NHS Plan for England.4 A growing body of evidence demonstrates that patient engagement in treatment
Copyright 2006 Picker Institute Europe. All rights reserved. Page 6
decisions and in managing their own healthcare can lead to more appropriate and cost-effective utilisation of health services and better health outcomes.11 The key to greater patient engagement lies in building health literacy and ensuring that clinicians help patients to help themselves. This means clinicians and patients need to change the way they think about their roles. Patients should no longer be seen simply as hapless victims of ill-health with a duty to follow doctors’ orders. Instead their right to make autonomous choices must be understood and facilitated by clinicians. Meanwhile patients need to understand the limits of medical care and the uncertainties surrounding the effectiveness and outcomes of most interventions. They must be actively encouraged to use health services appropriately and responsibly. In addition to the potential for achieving greater efficiencies in resource use, encouraging patients to take more control when they are ill may also prove to be an effective tool for improving public health. Promoting involvement, empowerment and a sense of ownership of their healthcare might be the best way to ensure that people adopt healthier lifestyles and endorse policy initiatives designed to promote public health. Traditional paternalistic practice styles undermine people’s confidence in their ability to look after themselves, so replacing paternalism with a partnership approach could help to enhance a sense of self-efficacy. Helping patients to help themselves when they are ill and boosting their ability to deal with the effects of disease could have the effect of encouraging them to take more responsibility for reducing risk factors and preventing ill-health. So it seems likely that encouraging greater engagement might help to meet health and behavioural targets, as well as ensuring that the demand for health care resources is manageable. 2.3 Some methodological caveats
International comparisons are fraught with difficulty because it is hard to be sure that you are comparing like with like. Most comparisons draw on official statistics which are notoriously problematic due to subtle differences in definitions of organisational processes and resources. Indeed, even comparing health data produced in the four UK nations is remarkably problematic. The authors of a recent study professed themselves “astonished at the difficulty, and in some cases impossibility, of obtaining valid comparable basic statistics on the NHS in the four countries.”12 Using survey data to make comparisons is not unproblematic either. Translation into different languages has to be carefully done and there can be cultural differences in interpretation of questions and response categories even when English is the common language, as it was for five of our six countries. Nevertheless, we can be reasonably confident that the same questions were posed in the same way to all participants in the surveys, wherever they were resident. The fact that these reports of patient engagement come directly from patients themselves, rather than from official statistics, should also encourage us to place more reliance in the results. Furthermore, in this report we have drawn on two data sources to make our comparisons (a random sample of adults and a sample of people with health problems), making it less likely that any systematic differences observed will have occurred purely by chance.
Copyright 2006 Picker Institute Europe. All rights reserved. Page 7
2.4 Health policy in the six countries
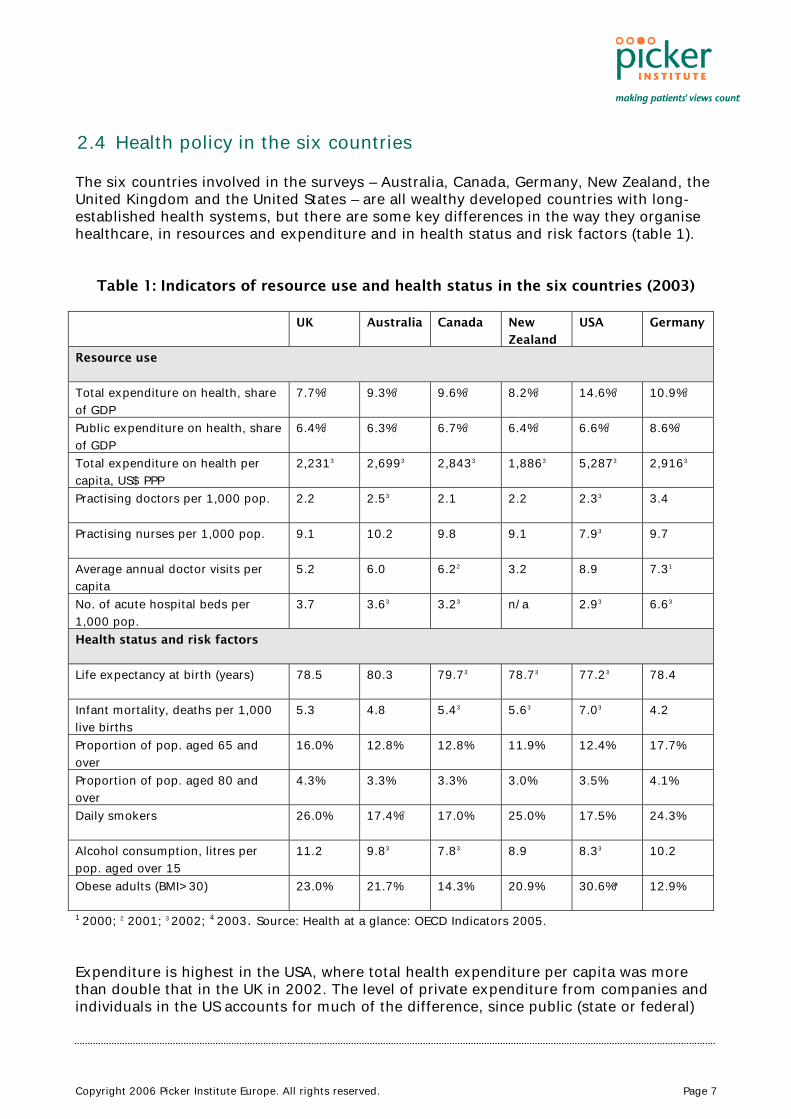
The six countries involved in the surveys – Australia, Canada, Germany, New Zealand, the United Kingdom and the United States – are all wealthy developed countries with long-established health systems, but there are some key differences in the way they organise healthcare, in resources and expenditure and in health status and risk factors (table 1).
Table 1: Indicators of resource use and health status in the six countries (2003)
UK Australia Canada New
Zealand
USA Germany
Resource use
Total expenditure on health, share of GDP
7.7%3 9.3%3 9.6%3 8.2%3 14.6%3 10.9%3
Public expenditure on health, share of GDP
6.4%3 6.3%3 6.7%3 6.4%3 6.6%3 8.6%3
Total expenditure on health per capita, US$ PPP
2,2313 2,6993 2,8433 1,8863 5,2873 2,9163
Practising doctors per 1,000 pop. 2.2 2.53 2.1 2.2 2.33 3.4
Practising nurses per 1,000 pop. 9.1 10.2 9.8 9.1 7.93 9.7
Average annual doctor visits per capita
5.2 6.0 6.22 3.2 8.9 7.31
No. of acute hospital beds per 1,000 pop.
3.7 3.63 3.23 n/a 2.93 6.63
Health status and risk factors
Life expectancy at birth (years) 78.5 80.3 79.73 78.73 77.23 78.4
Infant mortality, deaths per 1,000 live births
5.3 4.8 5.43 5.63 7.03 4.2
Proportion of pop. aged 65 and over
16.0% 12.8% 12.8% 11.9% 12.4% 17.7%
Proportion of pop. aged 80 and over
4.3% 3.3% 3.3% 3.0% 3.5% 4.1%
Daily smokers 26.0% 17.4%2 17.0% 25.0% 17.5% 24.3%
Alcohol consumption, litres per pop. aged over 15
11.2 9.83 7.83 8.9 8.33 10.2
Obese adults (BMI>30) 23.0% 21.7% 14.3% 20.9% 30.6%* 12.9%
1 2000; 2 2001; 3 2002; 4 2003. Source: Health at a glance: OECD Indicators 2005. Expenditure is highest in the USA, where total health expenditure per capita was more than double that in the UK in 2002. The level of private expenditure from companies and individuals in the US accounts for much of the difference, since public (state or federal)
Copyright 2006 Picker Institute Europe. All rights reserved. Page 8
expenditure accounts for similar a proportion of GDP in the US as in the UK. The US is an outlier in several other respects too: it is the only one of the six countries that does not guarantee universal coverage (45.8 million Americans were uninsured in 2004) and 68% of the population has private health insurance cover, in addition to the government-funded Medicare and Medicaid programmes which cater for elderly and disabled people and some of those on low incomes. The US had the lowest number of hospital beds and practising nurses per head of population out of the six countries, but the highest rate of annual doctor visits (table 1). Australia’s public health insurance system, also called Medicare, provides universal healthcare coverage for all Australian residents, giving free or subsidised access to most medical services. The government funds about 70% of health services out of taxation, with additional funds coming from fees paid by patients. Patients have a free choice of general practitioner, who act as gatekeepers to specialist services. Canada also provides universal coverage through provincial health insurance plans and public funding accounts for approximately 70% of total health expenditures. Many Canadians have supplementary private insurance to cover services such as optical and dental care, prescription medicines, rehabilitation and private nursing care. The health system in New Zealand is funded out of taxation primarily, accounting for nearly 80% of healthcare expenditure. Patients are charged co-payments for GP consultations, medicines and dental care. Around a third of the population has private health insurance. GPs act as gatekeepers to secondary care services. In Germany people enrol with sickness insurance funds that offer comprehensive cover for the statutory package that includes preventive services, hospital care, primary care, mental health, dental care, medicines, rehabilitation and sick pay. People above a certain income level have the right to opt for private health insurance instead. Germans have a free choice of primary care physician and open access to specialists. They have considerably more practising doctors than the other five countries and the second highest doctor consultation rates after the US (table 1). Compared to the other five countries, the UK spent the lowest proportion of GDP on healthcare in 2002, although expenditure has been rising fast since 2000. All UK residents have a right to NHS care which covers almost all medical services, although fees are charged to some people for prescription medicines, dental and optician services. About 12% of the population has private medical insurance, which accounts for only 4% of total healthcare expenditures. There is a free choice of GP, and GPs act as gatekeepers to specialist services. In terms of health needs and health risk factors, the UK has the highest proportion of the population aged over 80, the highest proportion of smokers, the heaviest drinkers, and the second highest proportion of people classified as obese after the US (table 1). 2.5 Health policy in the four UK nations
Political devolution has led to divergence in the governance and accountability of the national health service in England, Scotland, Wales and Northern Ireland.13 Some differences, particularly in funding levels, have been a longstanding feature, but the policy gap has widened since devolution in 1999. While commitment to the principles and
Copyright 2006 Picker Institute Europe. All rights reserved. Page 9
values of the NHS remains strong in all four countries, a subtle difference of emphasis has emerged in relation to system reform and quality improvement. Greer has characterised this in the following ways: England has tended to favour a market approach, emphasizing choice and regulation; Scotland has focused on professionalism by devolving responsibility to clinical networks; Wales has put greater emphasis on localism, aiming for integration of health and local government and a stronger focus on the determinants of health; while Northern Ireland, where administrative integration of health and social care has a longer history, has tried to maintain stability in a difficult political context by relying on permissive managerialism.14 Needs for healthcare differ between and within the four countries, so historically healthcare funding has been allocated according to specific formulae that aim to take account of different levels of need. Scotland and Northern Ireland spend greater amounts per capita than England and Wales. In 2002/3 per capita expenditure on health was £1,085 in England, £1,186 in Wales, £1,214 in Northern Ireland, and £1,262 in Scotland.15 In primary care the higher level of spending in Scotland is reflected in greater numbers of GPs than in the other three countries: 84 principals, assistants and trainees per 100,000 pop. compared to 63 in England and Northern Ireland and 66 in Wales; and smaller average list sizes: 1,392 in Scotland, 1,651 in Northern Ireland, 1,704 in Wales and 1,838 in England.16 These differences allow us to view the UK as a natural experiment in health policy, providing an opportunity to compare the impact and outcomes of different funding levels and policy priorities. There has been a focus on improving responsiveness and promoting patient-centred care in policy documents produced in all four countries. For example, the Scottish Health Council was established to develop and spread good practice in improving patient and public involvement;17 and the people of Wales have been promised active participation in service development.18 However, it is probably true to say that these initiatives came later than those in England, perhaps because the new administrations have had less time to shape their policies following devolution. Northern Ireland is a special case because of the suspension of the Northern Ireland Assembly, making it difficult to get any new policy initiatives off the ground. They have had a strong emphasis on public consultation, but structural change and attempts at service reform have proceeded at a much slower pace than in England.

Copyright 2006 Picker Institute Europe. All rights reserved. Page 10
3 The surveys
In 2004 samples of the population in each of five English-speaking countries (Australia, Canada, New Zealand, United States and United Kingdom) were approached by telephone to answer questions about their experience of healthcare. Telephone interviews were carried out with random, representative samples of adults aged 18 and over. Interviews, which took place in April and May 2004, lasted an average of seventeen minutes and focused mainly on patients’ experience of primary care.19 In 2005 the same method was used to survey ‘sicker’ adults, i.e. those who had recently been hospitalized, had surgery, or reported health problems. The 2005 survey included patients from Germany in addition to the five English-speaking countries.20 The survey was conducted in German in Germany and English in the five other countries, with the option of French in Canada and Spanish in the United States. The survey screened initial random samples of adults aged 18 and over to identify those who met at least one of four criteria: rated their health as fair or poor; reported that they had a serious illness, injury, or disability that required intensive medical care in the past two years; or reported that in the past two years they had had major surgery or had been hospitalized for something other than a normal pregnancy. Between a third to a quarter of those approached in each country met at least one eligibility criterion. In the UK 1,770 people out of 4,733 initially screened (37.4%), met the criteria and completed the survey. The questionnaires and methodology were designed by researchers at the Commonwealth Fund and Harris Interactive, a US-based market research company, with input from others including the author of this report. The surveys covered a wide range of topics, including general views of the health system, access and costs of care, quality of emergency care, coordination of care, hospital discharge, and patient safety. Previous publications of the survey results have focused on a broader set of issues.19;20, 21 In these analyses, no country stood out as doing systematically better or worse than the others across the board. The UK ranked first among the six countries for performance in relation to equity and patient safety, third for efficiency, fourth for patient-centredness, and fifth for effectiveness and timeliness.21 The UK performed particularly well in relation to the low level of financial barriers to accessing care, with patients in the USA facing the highest out-of-pocket costs and the greatest financial barriers to access. British patients were also more likely to express confidence in their health system than those in the other countries. However, the results from the UK were less impressive in respect of patient engagement, an issue that encompasses indicators of patient-centredness, clinical effectiveness and patient safety. This report draws together the results from the two surveys to examine performance in respect of patient engagement in much more detail and to compare results within the UK as well as internationally. Indicator questions were selected for detailed analysis on the basis that they related to specific aspects of patients’ involvement in their own care. Each indicator was comprised of three questions or question sets, as follows:

Copyright 2006 Picker Institute Europe. All rights reserved. Page 11
• Quality of doctor-patient communication Time with the doctor Doctor’s listening skills Clarity of doctor’s explanations
• Access to alternative sources of information and advice Use of telephone helplines Access to medical records Email communication with doctor
• Provision of preventive care and advice Reminders sent for screening and preventive care Advice received on weight, diet or exercise Enquiry about stress and emotional issues
• Informed choice of provider Information about doctors Availability of choice of doctors Ability to choose surgeon for operative procedure
• Risk communication and involvement in treatment decisions Explanation of medication side-effects Patient involvement in medication review Patient involvement in treatment decisions
• Support for self-care and self-management Instructions on what to do and symptoms to watch for Clear goals and treatment plan Plan for self-managing chronic condition at home
In the sections that follow, relevant results for each indicator are outlined and illustrated in bar charts, focusing on statistically significant differences between the countries and the UK nations. Where the same question was used in both surveys, results from the 2004 and 2005 surveys are compared. However, some questions were not repeated, so in these cases only one survey year has been included. There were no results for Germany in 2004 because the survey was only conducted there in 2005. Full results for each of the questions are given in the appendix. Post-stratification weights were applied in each country to adjust for variations between sample demographics and known population parameters. In the case of the 2005 survey the weights were based on the initial screening demographics. The margin of sample error for country averages are approximately ± 4% for Australia, Canada and New Zealand; ± 3% for Germany and the United States; and ± 2% for the United Kingdom at the 95% confidence level. Responses were compared between or within countries using t-tests and chi-square tests to check for statistically significant differences at the 0.05 level.
Copyright 2006 Picker Institute Europe. All rights reserved. Page 12
4 Results
4.1 Quality of doctor-patient communication
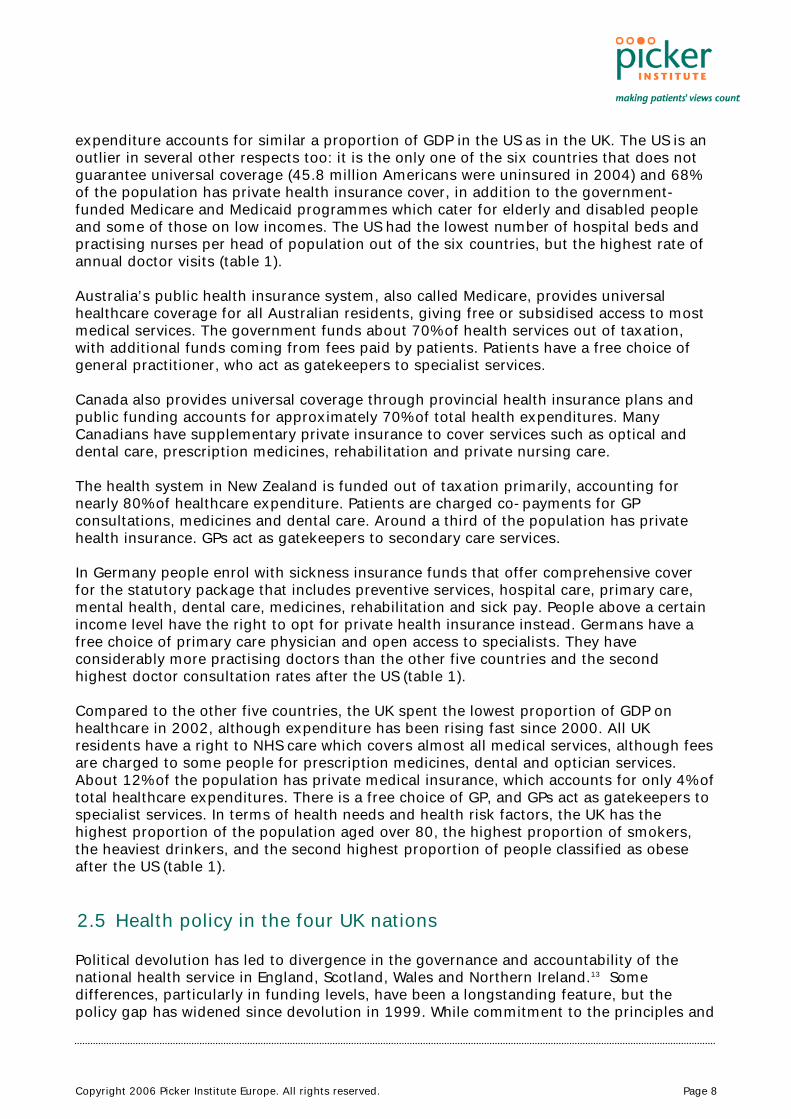
Good communication involves giving patients sufficient time to discuss their concerns, listening carefully, and giving clear, understandable answers to questions. Most patients gave positive reports of doctors’ communication skills, but patients in the USA were significantly more critical than those in the other countries. British patients were more positive about their experience of doctor-patient communication than American ones, but less positive than those from Australia and New Zealand (figure 2).
Figure 2: Doctor-patient communication (international: 2004)
0102030405060708090
100
UK
Austra
lia
Canad
a
New Zea
land
USA
Doctor always/usuallygives sufficient timeDoctor always/usuallylistens carefullyDoctor always/usuallygives clear explanations
In both surveys older people tended to give significantly more positive reports of doctor-patient communication than younger people. We found no significant differences in the quality of communication experienced by patients in the four UK nations. 4.2 Access to alternative sources of information and advice
The way in which patients can access information and advice from health professionals differs from country to country. Patients in the UK are generally expected to consult a general practitioner in the first instance, with the primary care doctor acting as a gatekeeper to specialist advice via the referral system. In some countries patients can go directly to a specialist if they wish to, but it is commonly believed that the GP gatekeeping system is a key factor in promoting efficient use of health services.22 In an attempt to empower patients and encourage further efficiency, alternative modes of access to health information and advice have been established in recent years, including provision of telephone helplines staffed by nurses, direct email access to health professionals, officially-sponsored websites providing health information, and encouragement to

Copyright 2006 Picker Institute Europe. All rights reserved. Page 13
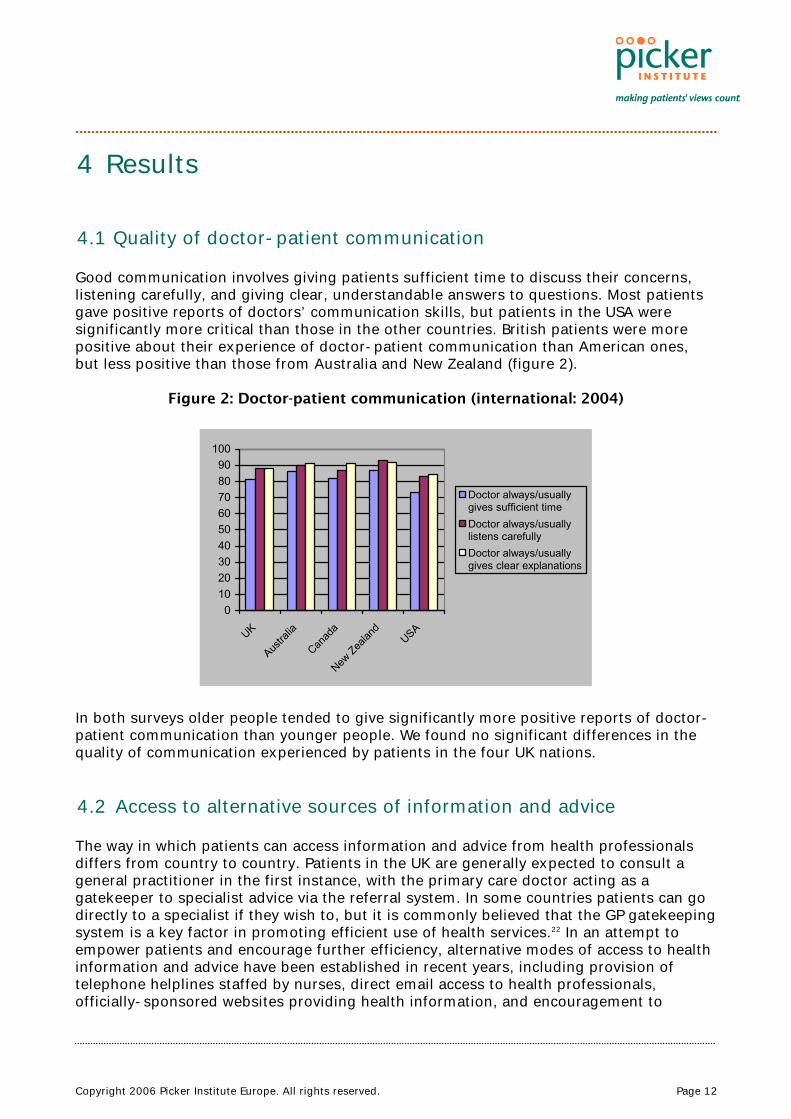
patients to review their medical records, to receive copies of referral letters, and in some cases, for example antenatal care and child health, to hold the records themselves. The UK has pioneered the use of nurse-led telephone helplines. NHS Direct, a nurse-led telephone service which gives patients direct access to advice and information about health and self-care 24 hours a day, was set up on a pilot basis in 1998 and its reach was extended to cover the whole of England and Wales in 2004. A Scottish equivalent, NHS 24, was established in 2002. Uptake has grown and by 2003 NHS Direct was handling around half-a-million calls each month across its 22 sites.23 NHS 24 handles an average of 31,000 calls each week through its three call centres.24 The 2004 survey found that 28% of the UK population had used a helpline to seek health advice, a significantly higher proportion than in any of the other countries, although Canada was not far behind (figure 3). In 2005, nearly a third (32%) of the sicker adults said they had used a helpline, again a higher rate of use than was seen in the other countries. Use by sicker adults was higher than the general population in all countries except the USA.
Figure 3: Used helpline in previous two years (international: 2004, 2005)
0
10
20
30
40
UK
Austra
lia
Canad
a
New Zea
land
USA
German
y
Gen. pop.Sicker adults
The majority of users in all countries said they received useful advice from the helpline, for example 88% of sicker adults in the UK were positive about the advice they received. There were significant differences in general population usage between the four UK nations, with the highest use by people living in England and much lower use in Northern Ireland, where no government-sponsored service exists (29% in England compared to 6% in Northern Ireland, see figure 4).
Copyright 2006 Picker Institute Europe. All rights reserved. Page 14
Figure 4: Used helpline in previous two years (UK: 2004, 2005)
0
10
20
30
40
Englan
dW
ales
Scotla
nd
N. Irela
nd
Gen. pop.Sicker adults
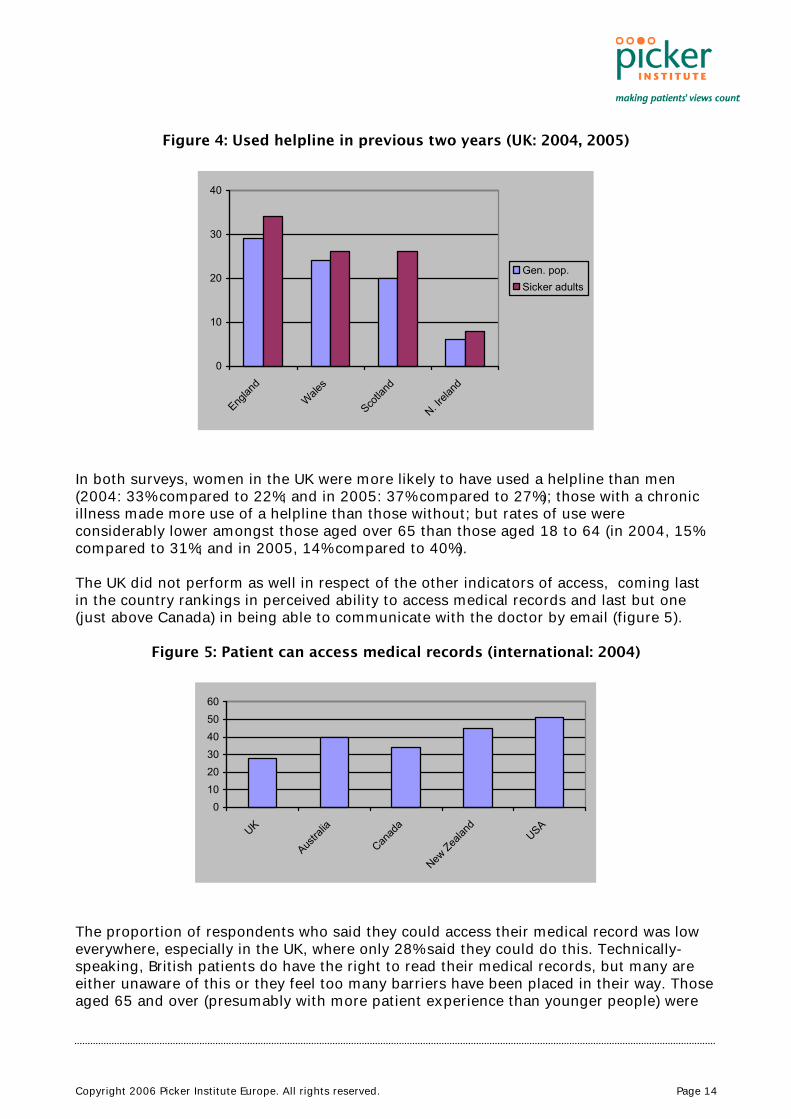
In both surveys, women in the UK were more likely to have used a helpline than men (2004: 33% compared to 22%; and in 2005: 37% compared to 27%); those with a chronic illness made more use of a helpline than those without; but rates of use were considerably lower amongst those aged over 65 than those aged 18 to 64 (in 2004, 15% compared to 31%; and in 2005, 14% compared to 40%). The UK did not perform as well in respect of the other indicators of access, coming last in the country rankings in perceived ability to access medical records and last but one (just above Canada) in being able to communicate with the doctor by email (figure 5).
Figure 5: Patient can access medical records (international: 2004)
The proportion of respondents who said they could access their medical record was low everywhere, especially in the UK, where only 28% said they could do this. Technically-speaking, British patients do have the right to read their medical records, but many are either unaware of this or they feel too many barriers have been placed in their way. Those aged 65 and over (presumably with more patient experience than younger people) were
0102030405060
UK
Austra
lia
Canad
a
New Zea
land
USA
Copyright 2006 Picker Institute Europe. All rights reserved. Page 15
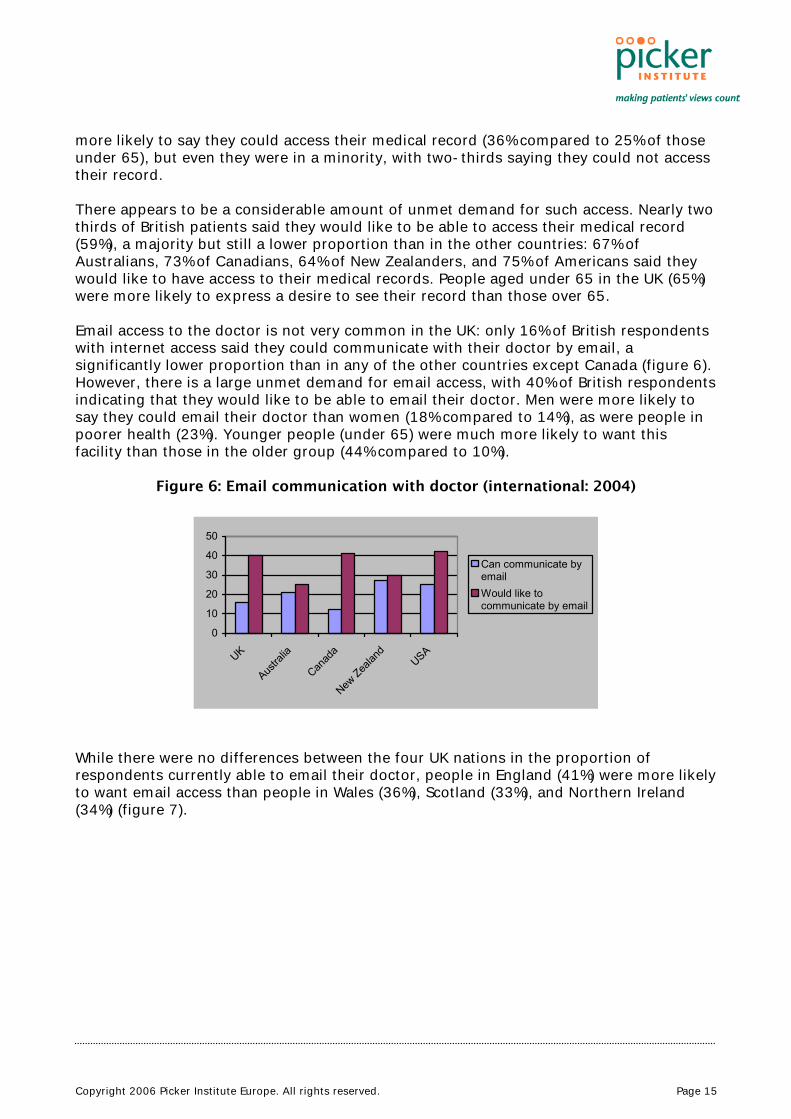
more likely to say they could access their medical record (36% compared to 25% of those under 65), but even they were in a minority, with two-thirds saying they could not access their record. There appears to be a considerable amount of unmet demand for such access. Nearly two thirds of British patients said they would like to be able to access their medical record (59%), a majority but still a lower proportion than in the other countries: 67% of Australians, 73% of Canadians, 64% of New Zealanders, and 75% of Americans said they would like to have access to their medical records. People aged under 65 in the UK (65%) were more likely to express a desire to see their record than those over 65. Email access to the doctor is not very common in the UK: only 16% of British respondents with internet access said they could communicate with their doctor by email, a significantly lower proportion than in any of the other countries except Canada (figure 6). However, there is a large unmet demand for email access, with 40% of British respondents indicating that they would like to be able to email their doctor. Men were more likely to say they could email their doctor than women (18% compared to 14%), as were people in poorer health (23%). Younger people (under 65) were much more likely to want this facility than those in the older group (44% compared to 10%).
Figure 6: Email communication with doctor (international: 2004)
0
10
20
30
40
50
UK
Austra
lia
Canad
a
New Zea
land
USA
Can communicate byemailWould like tocommunicate by email
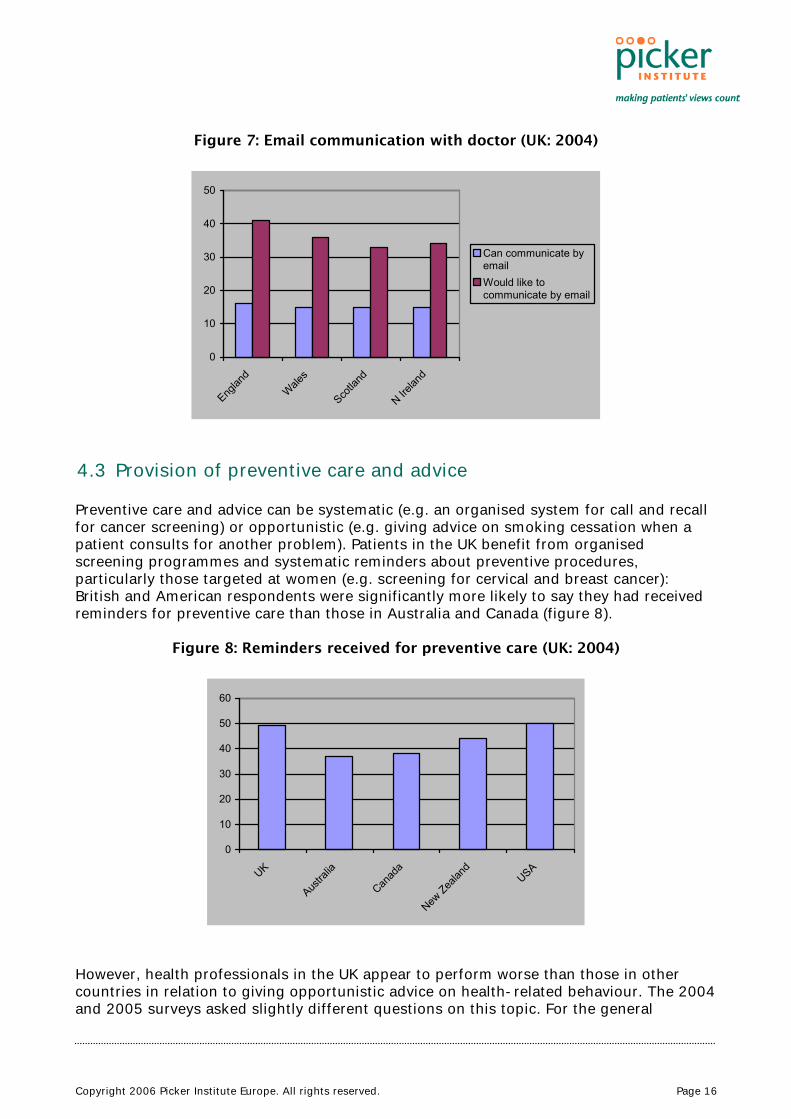
While there were no differences between the four UK nations in the proportion of respondents currently able to email their doctor, people in England (41%) were more likely to want email access than people in Wales (36%), Scotland (33%), and Northern Ireland (34%) (figure 7).
Copyright 2006 Picker Institute Europe. All rights reserved. Page 16
Figure 7: Email communication with doctor (UK: 2004)
0
10
20
30
40
50
Englan
dWale
s
Scotla
nd
N Irelan
d
Can communicate byemailWould like tocommunicate by email
4.3 Provision of preventive care and advice
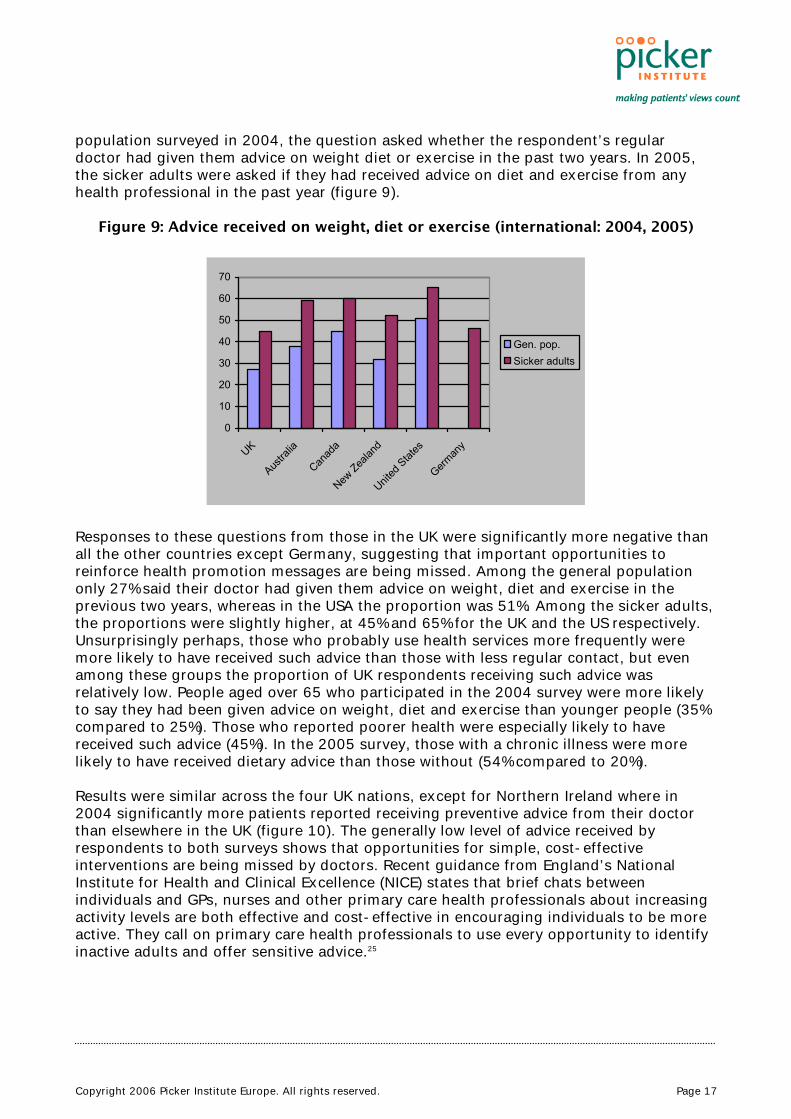
Preventive care and advice can be systematic (e.g. an organised system for call and recall for cancer screening) or opportunistic (e.g. giving advice on smoking cessation when a patient consults for another problem). Patients in the UK benefit from organised screening programmes and systematic reminders about preventive procedures, particularly those targeted at women (e.g. screening for cervical and breast cancer): British and American respondents were significantly more likely to say they had received reminders for preventive care than those in Australia and Canada (figure 8).
Figure 8: Reminders received for preventive care (UK: 2004)
0
10
20
30
40
50
60
UK
Austra
lia
Canad
a
New Zea
land
USA
However, health professionals in the UK appear to perform worse than those in other countries in relation to giving opportunistic advice on health-related behaviour. The 2004 and 2005 surveys asked slightly different questions on this topic. For the general
Copyright 2006 Picker Institute Europe. All rights reserved. Page 17
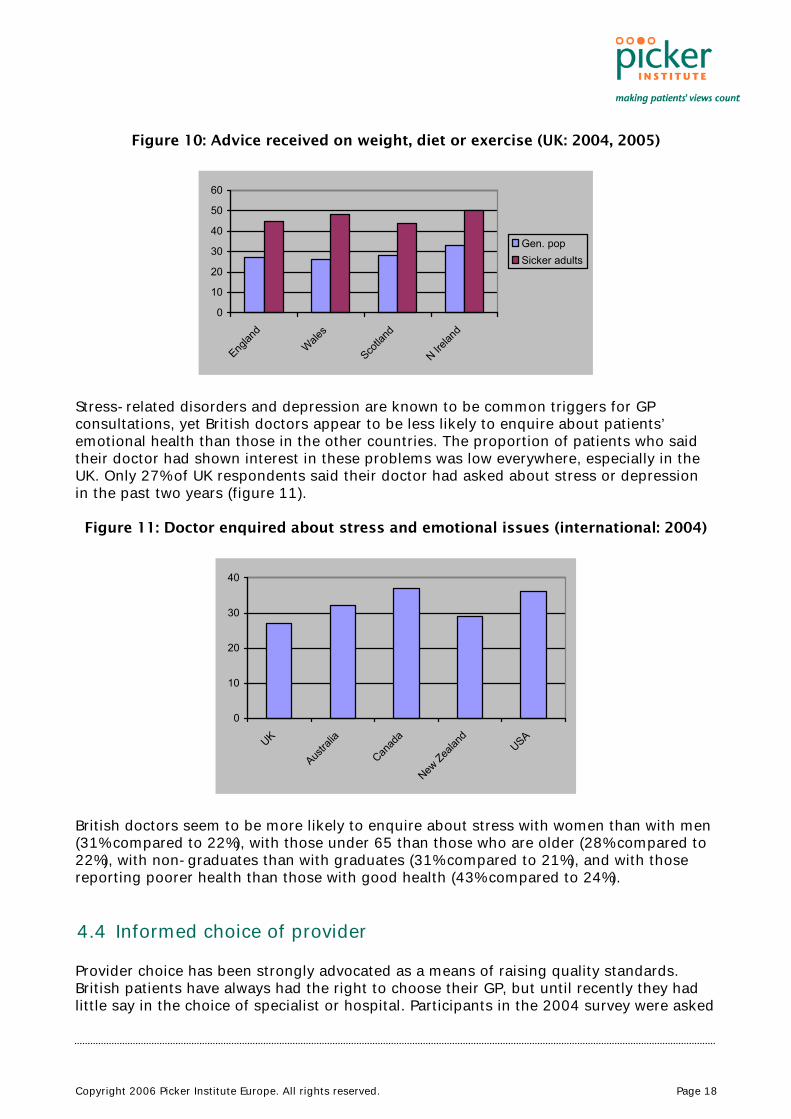
population surveyed in 2004, the question asked whether the respondent’s regular doctor had given them advice on weight diet or exercise in the past two years. In 2005, the sicker adults were asked if they had received advice on diet and exercise from any health professional in the past year (figure 9).
Figure 9: Advice received on weight, diet or exercise (international: 2004, 2005)
0
10
20
30
40
50
60
70
UK
Austra
lia
Canad
a
New Zea
land
United
Stat
es
German
y
Gen. pop.Sicker adults
Responses to these questions from those in the UK were significantly more negative than all the other countries except Germany, suggesting that important opportunities to reinforce health promotion messages are being missed. Among the general population only 27% said their doctor had given them advice on weight, diet and exercise in the previous two years, whereas in the USA the proportion was 51%. Among the sicker adults, the proportions were slightly higher, at 45% and 65% for the UK and the US respectively. Unsurprisingly perhaps, those who probably use health services more frequently were more likely to have received such advice than those with less regular contact, but even among these groups the proportion of UK respondents receiving such advice was relatively low. People aged over 65 who participated in the 2004 survey were more likely to say they had been given advice on weight, diet and exercise than younger people (35% compared to 25%). Those who reported poorer health were especially likely to have received such advice (45%). In the 2005 survey, those with a chronic illness were more likely to have received dietary advice than those without (54% compared to 20%). Results were similar across the four UK nations, except for Northern Ireland where in 2004 significantly more patients reported receiving preventive advice from their doctor than elsewhere in the UK (figure 10). The generally low level of advice received by respondents to both surveys shows that opportunities for simple, cost-effective interventions are being missed by doctors. Recent guidance from England’s National Institute for Health and Clinical Excellence (NICE) states that brief chats between individuals and GPs, nurses and other primary care health professionals about increasing activity levels are both effective and cost-effective in encouraging individuals to be more active. They call on primary care health professionals to use every opportunity to identify inactive adults and offer sensitive advice.25
Copyright 2006 Picker Institute Europe. All rights reserved. Page 18
Figure 10: Advice received on weight, diet or exercise (UK: 2004, 2005)
0
10
20
30
40
50
60
Englan
dWale
s
Scotla
nd
N Irelan
d
Gen. popSicker adults
Stress-related disorders and depression are known to be common triggers for GP consultations, yet British doctors appear to be less likely to enquire about patients’ emotional health than those in the other countries. The proportion of patients who said their doctor had shown interest in these problems was low everywhere, especially in the UK. Only 27% of UK respondents said their doctor had asked about stress or depression in the past two years (figure 11).
Figure 11: Doctor enquired about stress and emotional issues (international: 2004)
0
10
20
30
40
UK
Austra
lia
Canad
a
New Zea
land
USA
British doctors seem to be more likely to enquire about stress with women than with men (31% compared to 22%), with those under 65 than those who are older (28% compared to 22%), with non-graduates than with graduates (31% compared to 21%), and with those reporting poorer health than those with good health (43% compared to 24%). 4.4 Informed choice of provider
Provider choice has been strongly advocated as a means of raising quality standards. British patients have always had the right to choose their GP, but until recently they had little say in the choice of specialist or hospital. Participants in the 2004 survey were asked

Copyright 2006 Picker Institute Europe. All rights reserved. Page 19
if they wanted information about the quality of care provided by doctors, how satisfied they were with available information about doctors, and their views on the choice of doctor available to them (figure 12).
Figure 12: Choice of doctors (2004: international)
0102030405060708090
100
UK
Austra
lia
Canad
a
New Zea
land
USA
Wanted informationabout doctors
Satisfied withinformation aboutdoctorsSatisfied with choice ofdoctors
The UK respondents had significantly lower expectations of receiving information on the quality of care than those in the other countries, but they were also less satisfied with the available information than American patients. Nevertheless, a majority (80%) were satisfied with the choice of doctors. Respondents in Scotland were less likely to want information about the quality of care provided by doctors than those in the other three UK nations, and men were less likely to want such information than women (16% compared to 21%). People aged over 65 tended to be more satisfied with the choice of doctors than younger people (88% compared to 78%). In the 2005 survey more specific questions about choice and information were asked of all those who had undergone major surgery in the previous two years. They were asked to indicate how satisfied they were with the amount of choice they had in choosing the surgeon and whether they had had access to relevant information, such as patient satisfaction ratings, doctors’ experience of treating patients with similar medical conditions, their success rate for the relevant procedure, and their training (figure 13).
Copyright 2006 Picker Institute Europe. All rights reserved. Page 20
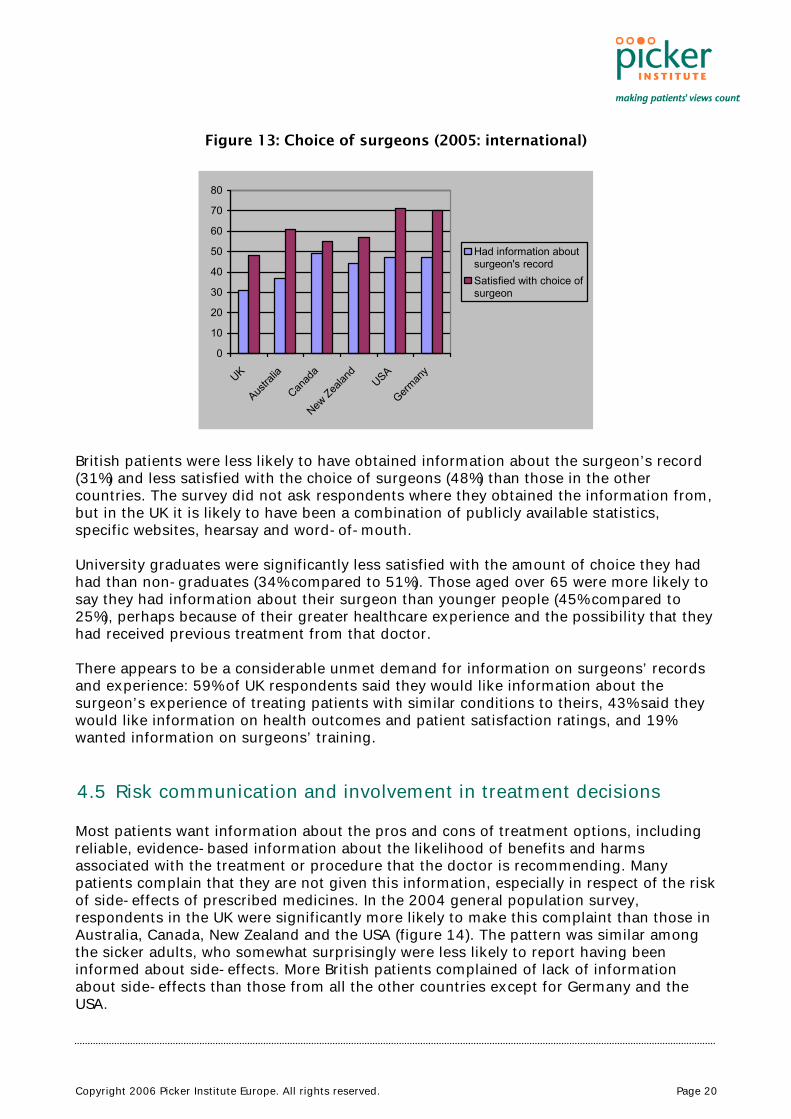
Figure 13: Choice of surgeons (2005: international)
0
10
20
30
40
50
60
70
80
UK
Austra
lia
Canad
a
New Zea
land
USA
German
y
Had information aboutsurgeon's recordSatisfied with choice ofsurgeon
British patients were less likely to have obtained information about the surgeon’s record (31%) and less satisfied with the choice of surgeons (48%) than those in the other countries. The survey did not ask respondents where they obtained the information from, but in the UK it is likely to have been a combination of publicly available statistics, specific websites, hearsay and word-of-mouth. University graduates were significantly less satisfied with the amount of choice they had had than non-graduates (34% compared to 51%). Those aged over 65 were more likely to say they had information about their surgeon than younger people (45% compared to 25%), perhaps because of their greater healthcare experience and the possibility that they had received previous treatment from that doctor. There appears to be a considerable unmet demand for information on surgeons’ records and experience: 59% of UK respondents said they would like information about the surgeon’s experience of treating patients with similar conditions to theirs, 43% said they would like information on health outcomes and patient satisfaction ratings, and 19% wanted information on surgeons’ training. 4.5 Risk communication and involvement in treatment decisions
Most patients want information about the pros and cons of treatment options, including reliable, evidence-based information about the likelihood of benefits and harms associated with the treatment or procedure that the doctor is recommending. Many patients complain that they are not given this information, especially in respect of the risk of side-effects of prescribed medicines. In the 2004 general population survey, respondents in the UK were significantly more likely to make this complaint than those in Australia, Canada, New Zealand and the USA (figure 14). The pattern was similar among the sicker adults, who somewhat surprisingly were less likely to report having been informed about side-effects. More British patients complained of lack of information about side-effects than those from all the other countries except for Germany and the USA.

Copyright 2006 Picker Institute Europe. All rights reserved. Page 21
Figure 14: Doctor explained medication side-effects (international: 2004, 2005)
01020304050607080
UK
Austra
lia
Canad
a
New Zea
land
USA
German
y
Gen. pop.Sicker adults
Many patients, especially those with chronic conditions, take regular medication on a long-term basis, sometimes several at once. Sometimes these are prescribed by different doctors, occasionally with insufficient regard to the cumulative effect of multiple medication. It is therefore very important that patients have a regular medicines review with a health professional to discuss how they are getting on and to identify and sort out any problems they are facing. Participants in the survey who were taking prescription medicines were asked if their regular doctor had undertaken a review of all their medicines, including those prescribed by other doctors, and involved the patient in this (figure 15).
Figure 15: Doctor reviewed and discussed all medications (international: 2004, 2005)
0
10
20
30
40
50
60
70
80
UK
Austra
lia
Canad
a
New Zea
land
USA
German
y
Gen. pop.Sicker adults
Once again, it is surprising that sicker adults were less likely to say they had been involved in a review of their medicines than the general population. British respondents to the 2004 survey were less likely to report having been involved in a medication review than those from the other countries. Just over half of respondents to the 2005 survey of
Copyright 2006 Picker Institute Europe. All rights reserved. Page 22
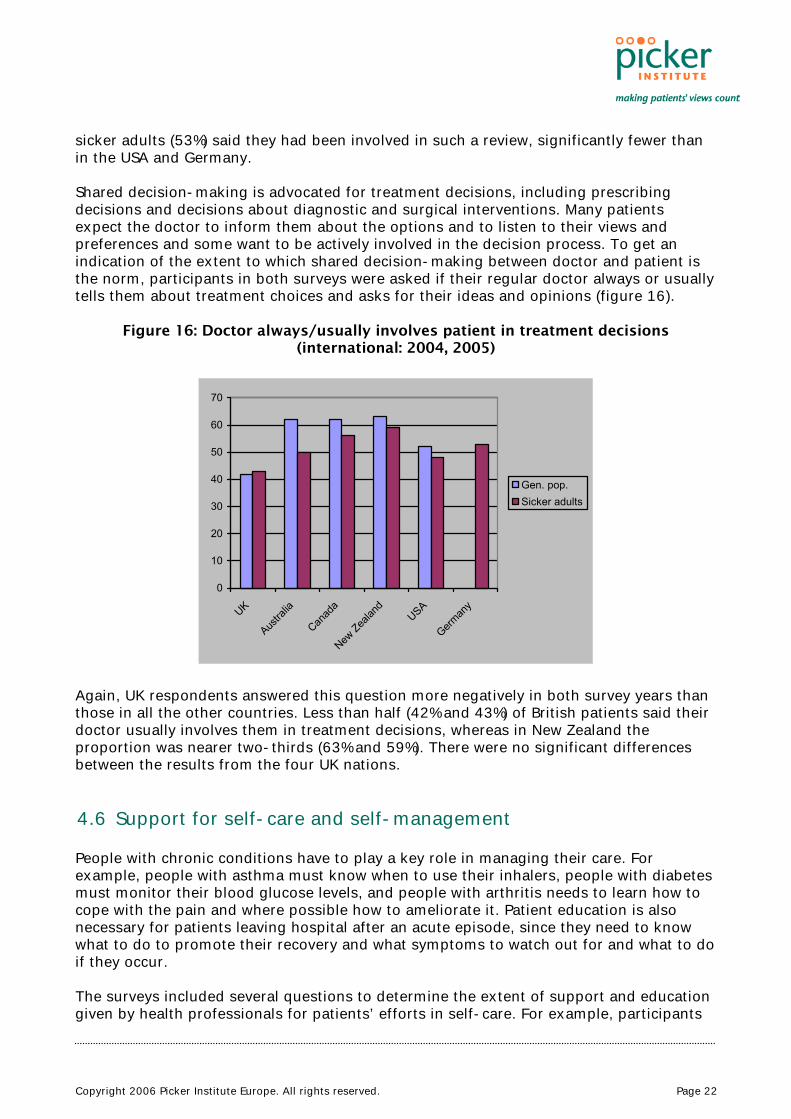
sicker adults (53%) said they had been involved in such a review, significantly fewer than in the USA and Germany. Shared decision-making is advocated for treatment decisions, including prescribing decisions and decisions about diagnostic and surgical interventions. Many patients expect the doctor to inform them about the options and to listen to their views and preferences and some want to be actively involved in the decision process. To get an indication of the extent to which shared decision-making between doctor and patient is the norm, participants in both surveys were asked if their regular doctor always or usually tells them about treatment choices and asks for their ideas and opinions (figure 16).
Figure 16: Doctor always/usually involves patient in treatment decisions (international: 2004, 2005)
0
10
20
30
40
50
60
70
UK
Austra
lia
Canad
a
New Zea
land
USA
German
y
Gen. pop.Sicker adults
Again, UK respondents answered this question more negatively in both survey years than those in all the other countries. Less than half (42% and 43%) of British patients said their doctor usually involves them in treatment decisions, whereas in New Zealand the proportion was nearer two-thirds (63% and 59%). There were no significant differences between the results from the four UK nations. 4.6 Support for self-care and self-management
People with chronic conditions have to play a key role in managing their care. For example, people with asthma must know when to use their inhalers, people with diabetes must monitor their blood glucose levels, and people with arthritis needs to learn how to cope with the pain and where possible how to ameliorate it. Patient education is also necessary for patients leaving hospital after an acute episode, since they need to know what to do to promote their recovery and what symptoms to watch out for and what to do if they occur. The surveys included several questions to determine the extent of support and education given by health professionals for patients’ efforts in self-care. For example, participants
Copyright 2006 Picker Institute Europe. All rights reserved. Page 23
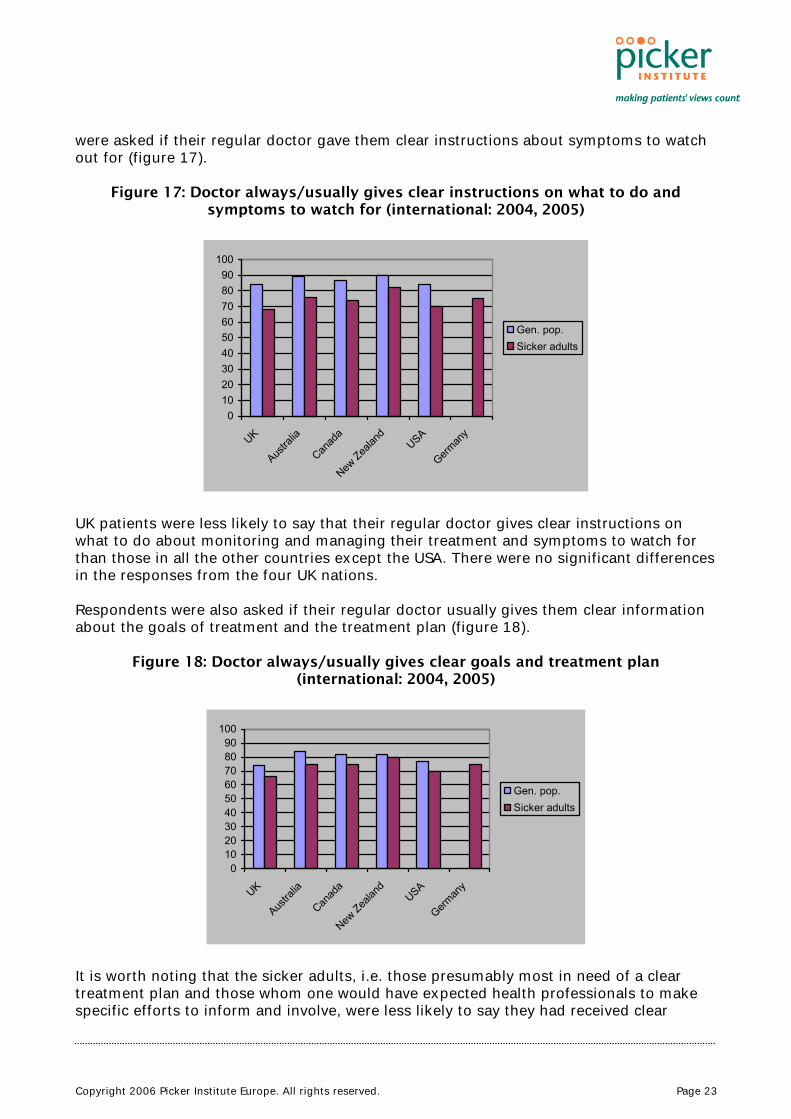
were asked if their regular doctor gave them clear instructions about symptoms to watch out for (figure 17).
Figure 17: Doctor always/usually gives clear instructions on what to do and symptoms to watch for (international: 2004, 2005)
0102030405060708090
100
UK
Austra
lia
Canad
a
New Zea
land
USA
German
y
Gen. pop.Sicker adults
UK patients were less likely to say that their regular doctor gives clear instructions on what to do about monitoring and managing their treatment and symptoms to watch for than those in all the other countries except the USA. There were no significant differences in the responses from the four UK nations. Respondents were also asked if their regular doctor usually gives them clear information about the goals of treatment and the treatment plan (figure 18).
Figure 18: Doctor always/usually gives clear goals and treatment plan (international: 2004, 2005)
0102030405060708090
100
UK
Austra
lia
Canad
a
New Zea
land
USA
German
y
Gen. pop.Sicker adults
It is worth noting that the sicker adults, i.e. those presumably most in need of a clear treatment plan and those whom one would have expected health professionals to make specific efforts to inform and involve, were less likely to say they had received clear
Copyright 2006 Picker Institute Europe. All rights reserved. Page 24
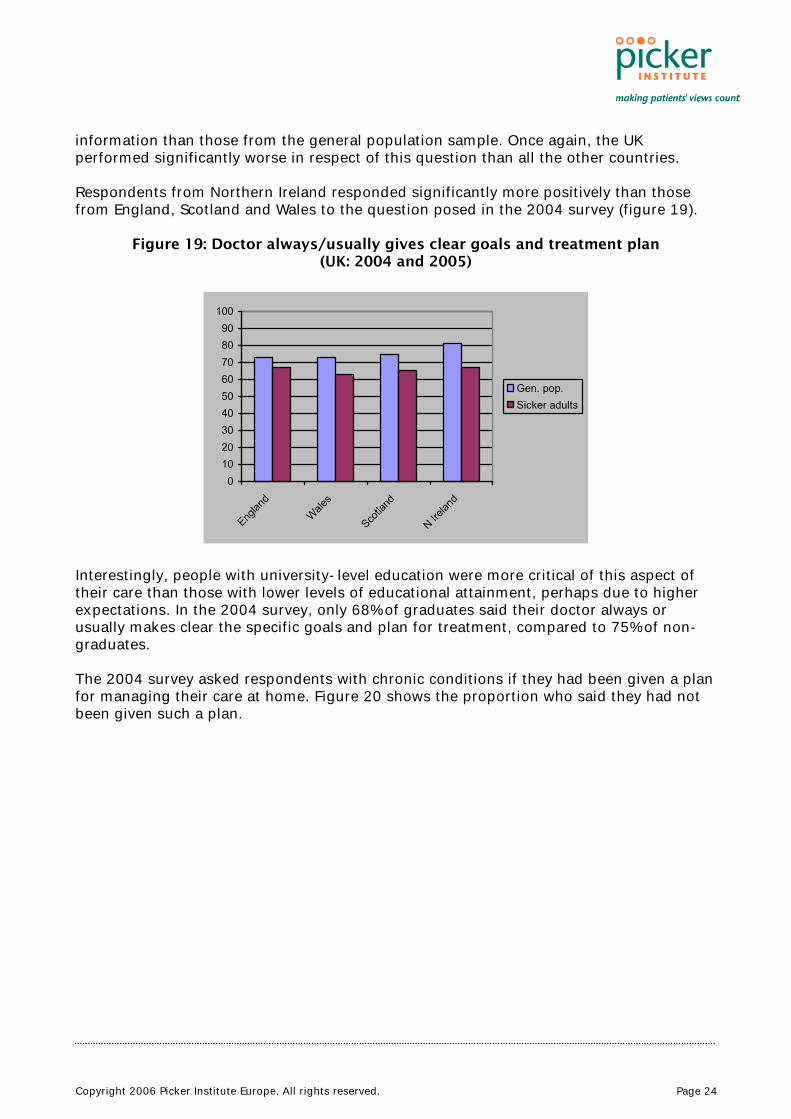
information than those from the general population sample. Once again, the UK performed significantly worse in respect of this question than all the other countries. Respondents from Northern Ireland responded significantly more positively than those from England, Scotland and Wales to the question posed in the 2004 survey (figure 19).
Figure 19: Doctor always/usually gives clear goals and treatment plan (UK: 2004 and 2005)
0102030405060708090
100
Englan
dWale
s
Scotla
nd
N Irelan
d
Gen. pop.Sicker adults
Interestingly, people with university-level education were more critical of this aspect of their care than those with lower levels of educational attainment, perhaps due to higher expectations. In the 2004 survey, only 68% of graduates said their doctor always or usually makes clear the specific goals and plan for treatment, compared to 75% of non-graduates. The 2004 survey asked respondents with chronic conditions if they had been given a plan for managing their care at home. Figure 20 shows the proportion who said they had not been given such a plan.
Copyright 2006 Picker Institute Europe. All rights reserved. Page 25
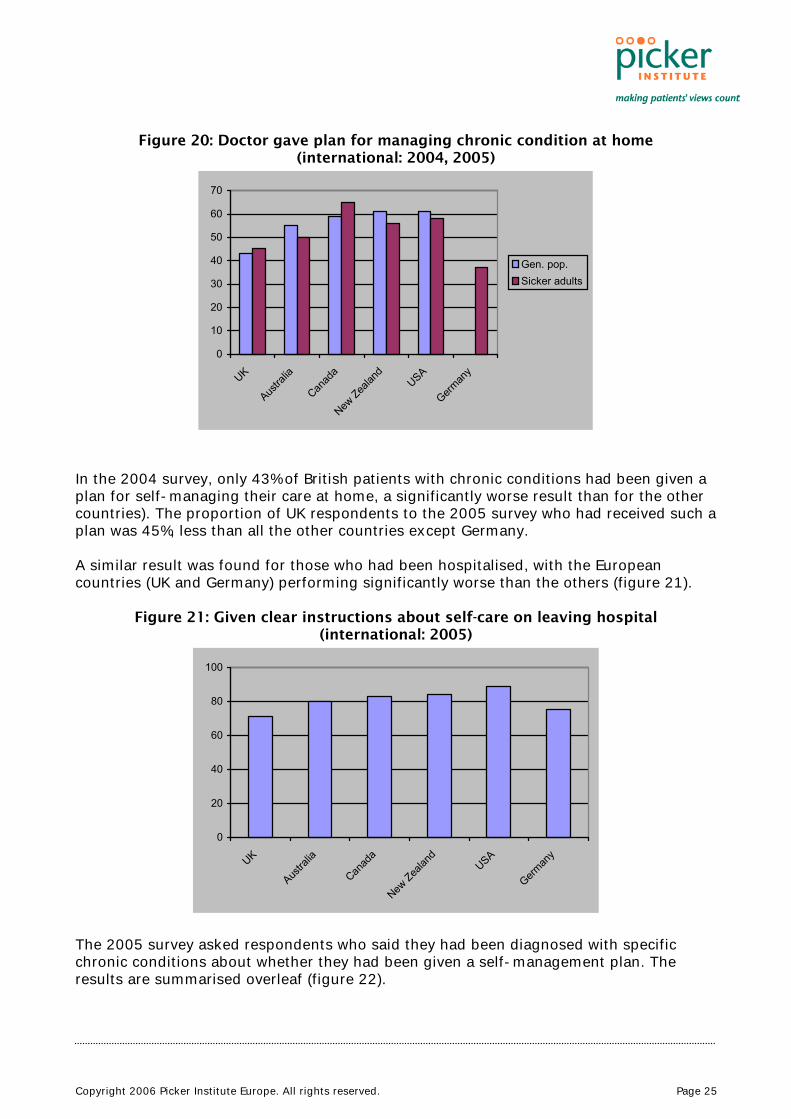
Figure 20: Doctor gave plan for managing chronic condition at home (international: 2004, 2005)
In the 2004 survey, only 43% of British patients with chronic conditions had been given a plan for self-managing their care at home, a significantly worse result than for the other countries). The proportion of UK respondents to the 2005 survey who had received such a plan was 45%, less than all the other countries except Germany. A similar result was found for those who had been hospitalised, with the European countries (UK and Germany) performing significantly worse than the others (figure 21).
Figure 21: Given clear instructions about self-care on leaving hospital (international: 2005)
0
20
40
60
80
100
UK
Austra
lia
Canad
a
New Zea
land
USA
German
y
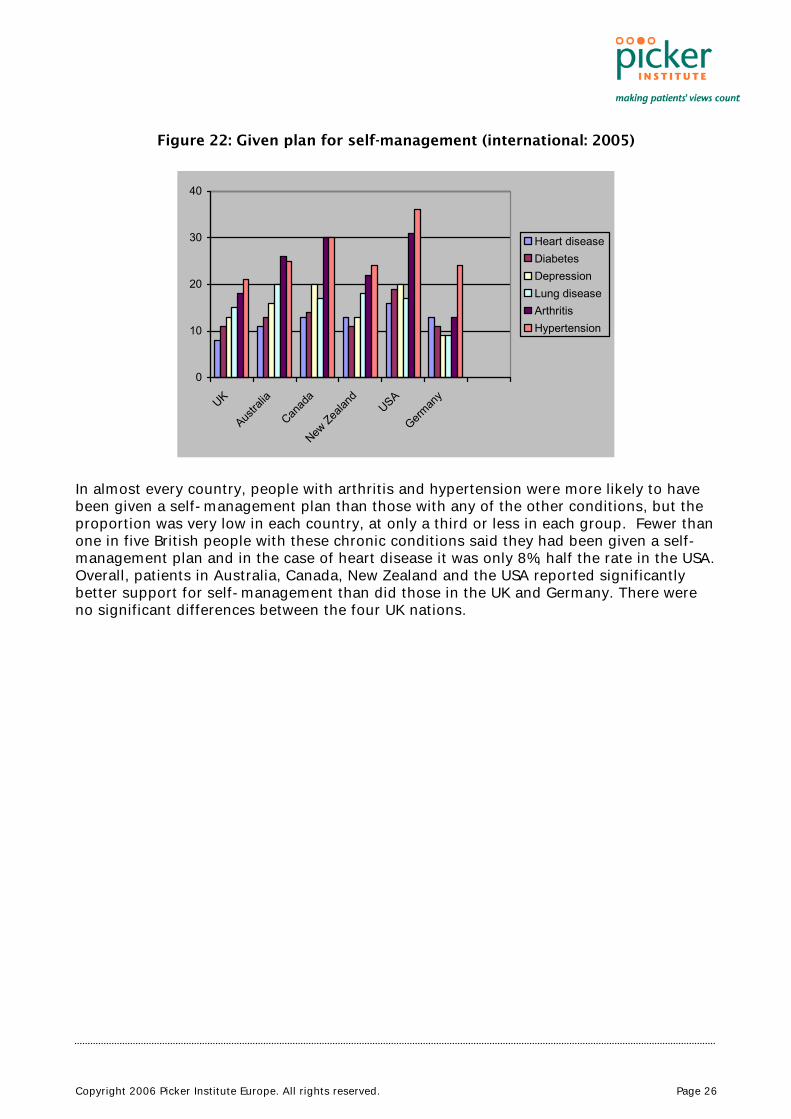
The 2005 survey asked respondents who said they had been diagnosed with specific chronic conditions about whether they had been given a self-management plan. The results are summarised overleaf (figure 22).
0
10
20
30
40
50
60
70
UK
Austra
lia
Canad
a
New Zea
land
USA
German
y
Gen. pop.Sicker adults
Copyright 2006 Picker Institute Europe. All rights reserved. Page 26
Figure 22: Given plan for self-management (international: 2005)
0
10
20
30
40
UK
Austra
lia
Canad
a
New Zea
land
USA
German
y
Heart diseaseDiabetesDepressionLung diseaseArthritisHypertension
In almost every country, people with arthritis and hypertension were more likely to have been given a self-management plan than those with any of the other conditions, but the proportion was very low in each country, at only a third or less in each group. Fewer than one in five British people with these chronic conditions said they had been given a self-management plan and in the case of heart disease it was only 8%, half the rate in the USA. Overall, patients in Australia, Canada, New Zealand and the USA reported significantly better support for self-management than did those in the UK and Germany. There were no significant differences between the four UK nations.
Copyright 2006 Picker Institute Europe. All rights reserved. Page 27
5 Conclusions
5.1 How are we doing?
Despite the strong official commitment to developing a patient-led service, our results suggest the UK is not performing well when it comes to involving patients in their care. The UK results were worse than those from the other countries for many if not most of the six indicators of patient engagement that we examined.
• Quality of doctor-patient communication: British patients gave more positive reports of doctors’ communication skills than American patients, but less positive than those from Australia and New Zealand.
• Access to alternative sources of information and advice: the UK (except Northern Ireland) had the highest rate of use of telephone helplines, but the worst access to medical records and next to worst for email access to the doctor.
• Provision of preventive care and advice: British patients were less likely than those in the other countries to say they had received opportunistic advice from doctors about weight, diet, exercise, or stress reduction. However British patients were more likely to have received reminders to participate in organised screening programmes than those in Australia, Canada and New Zealand.
• Informed choice of provider: British patients who had undergone surgery were less likely to have had access to information about the surgeon who carried out their operation and less satisfied with the choice of surgeons than those in the other countries.
• Risk communication and involvement in treatment decisions: Fewer British patients said they were usually involved in treatment decisions than those in all the other countries and they were less likely to have participated in a medication review. Their doctors were also less likely to have given them information about medicine side-effects than those in the other countries.
• Support for self-care and self-management: Respondents from the UK were less likely to say that their regular doctor gives clear instructions on what to do about monitoring and managing their treatment than those in all the other countries except the USA. Among people with recent health problems, those from the UK were least likely to have been given a clear explanation of treatment goals and the treatment plan and less likely to have been given help with self-management than those in all the other countries apart from Germany. Fewer than one in five British people with specific chronic conditions had been given a self-management plan.
British patients appear to receive less support from health professionals for engagement with their healthcare than those elsewhere. It is hard to avoid the conclusion that healthcare is delivered in a more paternalistic fashion in the UK than in the other
Copyright 2006 Picker Institute Europe. All rights reserved. Page 28
countries we studied. The dramatic change in professional and patient roles that Wanless said was necessary to ensure the long-term sustainability of the NHS does not seem to have begun, or at best it is proceeding at a very slow pace. Despite the suggestion that England was leading the way in patient-centred developments in the UK, we observed very few differences between the four UK nations. Patients in Northern Ireland tended to give more positive reports of their experience in respect of communication and preventive care, but this may be due to greater continuity experienced by a less mobile population rather than to any specific policy initiatives. The similarity in standards across the four nations was much more striking than the differences. Indeed, these results give no indication of a direct relationship between funding levels and the quality of care in the four nations. More GPs with smaller list sizes in Scotland and Northern Ireland does not appear to have conferred significant advantages over England and Wales in respect of most of our indicators of patient engagement. The apparent policy differences may be more rhetorical than real. 5.2 What’s going wrong?
These results will be disappointing to those who have worked hard to promote patient and public involvement in the NHS. Why is there so little evidence that their efforts are bearing fruit? One possible explanation worthy of consideration is that NHS staff in the UK are working under such pressure that they simply do not have time to engage patients more actively. It is certainly true that in many areas staff are very hard pressed, but when one compares resource indicators between, say, New Zealand and the UK, there is little difference (table 1), yet New Zealand appears to perform better than the UK on many of our indicators of patient engagement. On the face of it, variations in funding levels or in the number of doctors and nurses per capita, would not appear to explain the international differences in support for engagement. The government hopes that promoting greater market competition by giving patients a choice of provider will encourage healthcare organisations and staff to respond better to their needs. However, our survey results are discouraging in this respect, since American patients, who had more choice of doctors than those in the other countries, gave the most critical reports on their experience of communicating with doctors. And the model of choice that is being promoted, i.e. encouraging patients to act like consumers in shopping around for healthcare providers, will do little to help those with long-term conditions who want better coordinated healthcare provided by professionals who know them well. The types of choices they are more likely to be interested in include having more say in designing a management plan for their long-term care, or being able to select from a greater variety of support options. Other factors that may be important in explaining the disappointing performance in the UK include shortcomings in professional education, including perhaps a failure to build in patient engagement as a core part of the curricula in medical and nursing education and training; a low level of expectation from the Royal Colleges or the regulatory bodies such as the Healthcare Commission, the General Medical Council and the Nursing and Midwifery Council, who may not have given sufficient priority to the topic; and a failure on the government’s part to offer incentives to clinicians to engage their patients, for

Copyright 2006 Picker Institute Europe. All rights reserved. Page 29
example in the Quality and Outcomes Framework for general practice, which currently gives GPs no reward for promoting patient engagement. A key to the conundrum may lie in the fact that most NHS organisations have seen promoting patient and public involvement as synonymous with the requirement to consult the public and obtain direct involvement of lay people in planning and service development. Great efforts have been made to include patients’ organisations in consultation processes and to recruit lay volunteers to sit on a host of committees. These efforts have met with some success, but as yet they appear to have done little to tackle the heart of the problem, namely improving the quality of the interactions between individual patients’ and the clinicians (GPs, nurses, specialists, therapists) who form the front line of the service. It is this face-to-face contact with individual clinical staff that is what most patients care most about. This is the nub of the issue when patients talk about the quality of care. Most people who use health services are seeking help for a specific health problem. They want advice from professionals who are good communicators and have sound up-to-date clinical knowledge and skills; they expect their views and preferences to be taken into account; and they want to be given reliable information about their condition and the treatment options and the help they need to help themselves. This is the type of engagement with health services that most people want. Only a small and unrepresentative minority want to sit on policy committees or be consulted about complex service developments that don’t affect them directly. Many of those people most actively promoting the patient and public involvement strategy are concerned to tackle the ‘democratic deficit’ in the NHS and beyond. They hope that encouraging people to get involved in collective activity to reshape the NHS and promote improvements in public health will help to reduce alienation and promote a new type of community engagement. This is a worthy aim, but they have chosen the wrong starting point. It makes no sense to exhort people to get involved in collective action, while at the same time treating them merely as passive recipients of healthcare when they are ill. If people are disengaged and disempowered when they are patients, they are unlikely to feel encouraged to participate as active healthy citizens. Most will just want to forget about their experiences of the NHS and get on with their everyday lives. As these survey results demonstrate, healthcare delivery in the UK is still much too paternalistic and the patient’s role in protecting and promoting their own health is still too widely ignored. The survey results from the other countries were by no means perfect – there is a long way to go to engage and empower patients everywhere – but they do demonstrate that it should be possible to do better than we are currently doing. 5.3 What needs to be done?
Moving forward must involve engaging clinicians as well as patients, encouraging them to see patients as their partners in the process of treatment and care, not simply as passive victims of ill health. In other words, a change in the culture of care is what’s required. The problem is not confined to the UK. As we have seen, in all six countries many patients are not being given the opportunity to have a say in treatment decisions, and they are not receiving proper help to monitor their medicines, cope with recovery and
Copyright 2006 Picker Institute Europe. All rights reserved. Page 30
rehabilitation, or manage their long-term conditions. Outdated professional attitudes are preventing patients from playing the active role that most want, and that could greatly increase the efficiency and effectiveness of healthcare. While the problem appears to be common to all these countries, it is at its most acute in the UK. Any strategy to raise levels of engagement should target both formal and informal education for professional staff. Patients should also be encouraged to raise their expectations of involvement and to express their preferences more vocally. Clinicians need specific training in how to engage patients, to inform and involve them, and support their efforts at self-care. Communication skills need to be improved; opportunities to promote healthy behaviour must be more eagerly seized; patients’ groups should encourage their members to take more responsibility for their health; and professionals, patients and policy makers need a better grounding in the evidence base that supports an engagement strategy. A patient engagement strategy should encourage all health professionals to recognise their responsibility to promote health literacy, support self-care and self-management, and involve patients in treatment decisions. The best way to judge their effectiveness in this regard is to obtain feedback from their patients. As this study has demonstrated, it is relatively easy to include appropriate questions in regular patient surveys to monitor progress in patient engagement. Currently this is addressed, as least partially, in the national patient survey programme for England led by the Healthcare Commission. However, these surveys are carried out at the organisational level and do not produce results that are specific at the level of clinical teams or individuals. They are also carried out relatively infrequently. There is an opportunity to remedy this gap by redesigning the patient questionnaires used in primary care for the purposes of the General Medical Services contract, and by requiring patient feedback as part of planned revisions to professional appraisal and revalidation systems. A systematic approach to gaining regular feedback on patient engagement could be designed to produce robust results at institutional, departmental, team and even individual levels, giving all health professionals an opportunity to measure their progress and set targets for improvement. The strategy should encompass professional leadership and training, information systems and e-health, management support and resources, board involvement, performance measurement, safety and quality assurance. It should become more ambitious and better led than currently and it should not be allowed to be seen as peripheral to the main business of clinical care, as now. Instead it must force itself to centre stage, an essential component of a modern health service rather than an optional extra. Wanless believed that patient engagement should be a key component of the strategy to keep future healthcare spending within manageable limits. In other words, the sustainability of the NHS will depend on the effectiveness of efforts to eliminate the unhealthy paternalism that still characterises patient-professional relationships in the British health system. This theme was echoed in the recent White Paper, Our health, our care, our say: a new direction for community services, which promised to help patients to take responsibility for their health, support their independence, put them in control and focus on the prevention of health and well-being.8 The direction of policy is clear, but to date implementation has been weak, partly due to a reluctance to confront the health professions. If it is to succeed in this goal, the government must be bolder about challenging the professional organisations to
Copyright 2006 Picker Institute Europe. All rights reserved. Page 31
modernise their attitudes and approach to training. The regulatory bodies, the British Medical Association, the medical and nursing Royal Colleges and their specialist societies should be urged to re-focus their attention on patients’ role as active partners in their healthcare. Engaging patients more actively in the decisions that affect them directly, and ensuring that their efforts at self-care are well-supported by health professionals are the basic building blocks without which the strategy will fail.
Copyright 2006 Picker Institute Europe. All rights reserved. Page 32
6 Appendix: tables
6.1 Demographic characteristics of respondents (international, 2004)
Demographic
characteristics
United Kingdom
(n=3,061)
Australia
(1,400)
Canada
(n=1,410)
New Zealand
(n=1,400)
United States
(n=1,401)
Mean age 47.7 44.7* 45.9* 44.4* 45.7*
% female 53 50 52 52 52
% married/living with partner
54 58 57 60* 63*
Mean no of adults in household
1.9 2.1* 2.0* 2.1* 2.2*
% reporting above average income
38 40 44* 56* 39
% with university education
24 14* 27* 23 24
* Significantly different from UK (p<0.05)

Copyright 2006 Picker Institute Europe. All rights reserved. Page 33
6.2 Demographic characteristics of respondents (international, 2005)
Demographic
characteristics
United Kingdom
(n=1,770)
%
Australia
(702)
%
Canada
(n=751)
%
New Zealand
(n=704)
%
United States
(n=1,527)
%
Germany
(n=1,503)
%
% aged over 65 29 28 28 27 21* 27
% reporting health “fair” or “poor”
56 50* 46* 33* 59 58
% hospitalized in previous 2 years
40 48* 44 54* 41 50*
Mean no of adults in household
1.9 1.9 1.8 2.0 2.2* 2.0
% reporting above average income
31 29 31 31 27* 40*
% with university education
21 9* 18 24 18 8*
* Significantly different from UK (p<0.05)

Copyright 2006 Picker Institute Europe. All rights reserved. Page 34
6.3 Demographic characteristics of respondents (UK, 2004)
Demographic
characteristics
England
(n=1,559)
Wales
(n=499)
Scotland
(n=503)
Northern Ireland
(n=499)
Mean age 47.7 48.5 47.5 46.1
% female 53 52 51 51
% married/living with partner
54 60*
58 53
Mean no of adults in household
1.9 2.0
1.8 2.1*
% reporting above average income
38 34 39 31
% in professional / managerial occupations
23 23 24 23
% living in rural area 24 43*
24 32*
% with university education
24 24 24 23
% born in UK 89 95*
94*
95*
% white ethnic origin 90 97*
97*
99*
* Significantly different from England (p<0.05)
Copyright 2006 Picker Institute Europe. All rights reserved. Page 35
6.4 Demographic characteristics of respondents (UK, 2005)
Demographic
characteristics
England
(n=870)
%
Wales
(n=300)
%
Scotland
(n=300)
%
Northern Ireland
(n=300)
%
% female 54 54 50 52
% aged over 65 29 33 32 30
% reporting health “fair” or “poor”
55 59 56 61
% hospitalized in previous 2 years
40 45 38 38
% reporting above average income
31 27 28 24*
% with university education
21 16 19 20
% born in UK 91 94 93 94
* Significantly different from England (p<0.05)
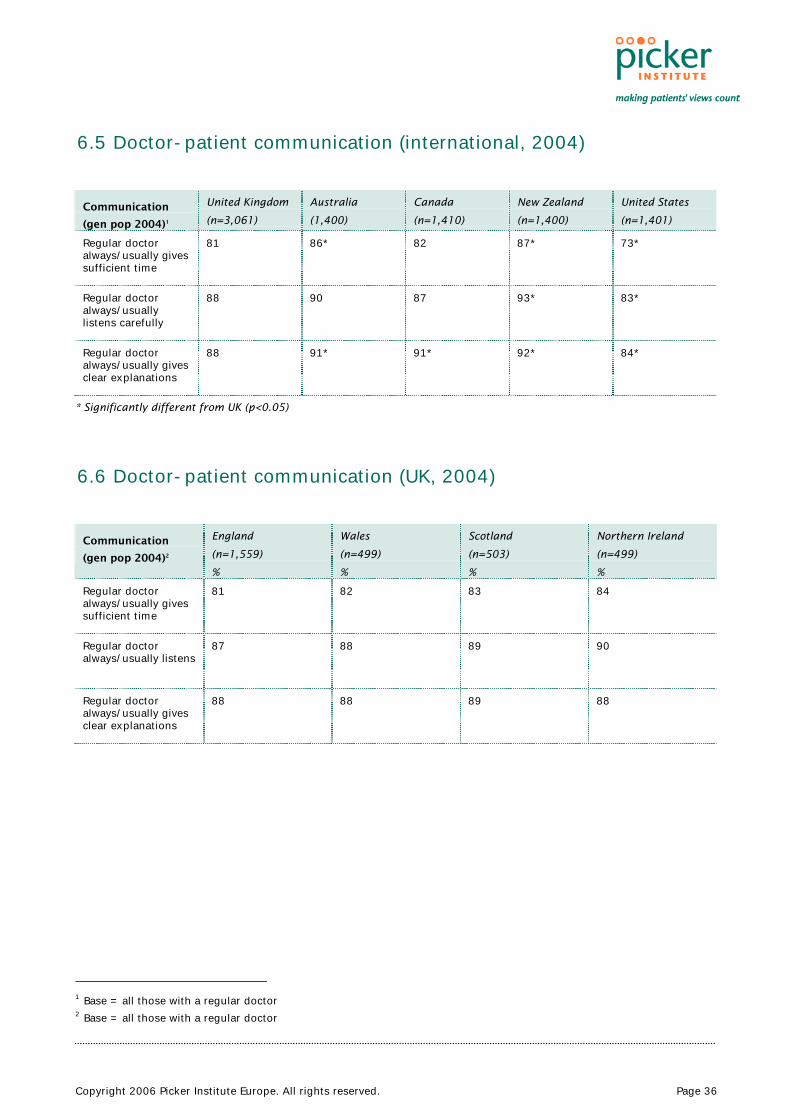
Copyright 2006 Picker Institute Europe. All rights reserved. Page 36
6.5 Doctor-patient communication (international, 2004)
Communication
(gen pop 2004)1
United Kingdom
(n=3,061)
Australia
(1,400)
Canada
(n=1,410)
New Zealand
(n=1,400)
United States
(n=1,401)
Regular doctor always/usually gives sufficient time
81 86* 82 87* 73*
Regular doctor always/usually listens carefully
88 90 87 93* 83*
Regular doctor always/usually gives clear explanations
88 91* 91* 92* 84*
* Significantly different from UK (p<0.05)
6.6 Doctor-patient communication (UK, 2004)
Communication
(gen pop 2004)2
England
(n=1,559)
%
Wales
(n=499)
%
Scotland
(n=503)
%
Northern Ireland
(n=499)
%
Regular doctor always/usually gives sufficient time
81 82 83 84
Regular doctor always/usually listens
87 88 89 90
Regular doctor always/usually gives clear explanations
88 88 89 88
1 Base = all those with a regular doctor 2 Base = all those with a regular doctor
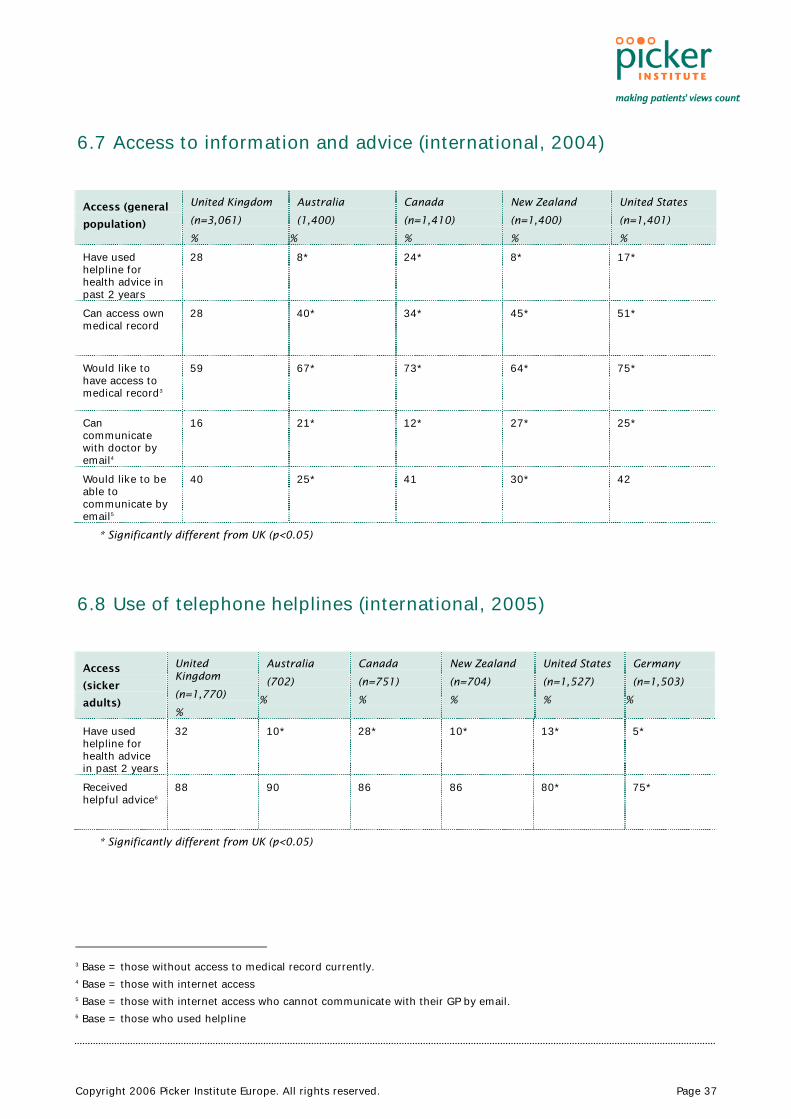
Copyright 2006 Picker Institute Europe. All rights reserved. Page 37
6.7 Access to information and advice (international, 2004)
Access (general
population)
United Kingdom
(n=3,061)
%
Australia
(1,400)
%
Canada
(n=1,410)
%
New Zealand
(n=1,400)
%
United States
(n=1,401)
%
Have used helpline for health advice in past 2 years
28 8* 24* 8* 17*
Can access own medical record
28 40* 34* 45* 51*
Would like to have access to medical record3
59 67* 73* 64* 75*
Can communicate with doctor by email4
16 21* 12* 27* 25*
Would like to be able to communicate by email5
40 25* 41 30* 42
* Significantly different from UK (p<0.05)
6.8 Use of telephone helplines (international, 2005)
Access
(sicker
adults)
United Kingdom
(n=1,770)
%
Australia
(702)
%
Canada
(n=751)
%
New Zealand
(n=704)
%
United States
(n=1,527)
%
Germany
(n=1,503)
%
Have used helpline for health advice in past 2 years
32 10* 28* 10* 13* 5*
Received helpful advice6
88 90 86 86 80* 75*
* Significantly different from UK (p<0.05)
3 Base = those without access to medical record currently. 4 Base = those with internet access 5 Base = those with internet access who cannot communicate with their GP by email. 6 Base = those who used helpline

Copyright 2006 Picker Institute Europe. All rights reserved. Page 38
6.9 Access to information and advice (UK, 2004)
Access (general
population)
England
(n=1,559)
%
Wales
(n=499)
%
Scotland
(n=503)
%
Northern Ireland
(n=499)
%
Have used helpline for health advice in past 2 years
29 24*
20*
6*
Can access medical record
27 31 31 27
Would like to have access to medical record7
58 64 59 58
Can communicate with doctor by email8
16 15 15 15
Would like to be able to communicate by email9
41 36 33* 34*
* Significantly different from England (p<0.05)
6.10 Use of telephone helplines (UK, 2005)
Access (sicker
adults)
England
(n=870)
%
Wales
(n=300)
%
Scotland
(n=300)
%
Northern Ireland
(n=300)
%
Have used helpline for health advice in past 2 years
34 26* 26* 8*
Received helpful advice10
89 81 81 83
* Significantly different from England (p<0.05)
7 Base = those without access to medical record currently. 8 Base = those with internet access 9 Base = those with internet access who cannot communicate with their GP by email. 10 Base = those who used helpline
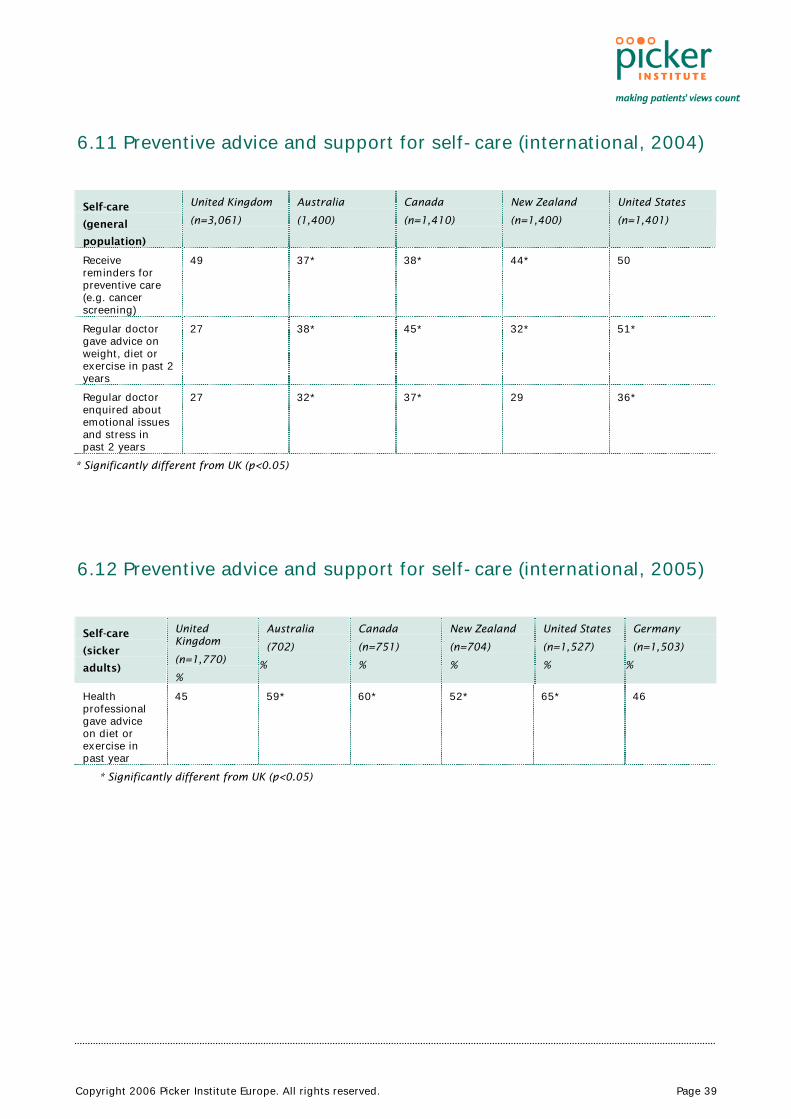
Copyright 2006 Picker Institute Europe. All rights reserved. Page 39
6.11 Preventive advice and support for self-care (international, 2004)
Self-care
(general
population)
United Kingdom
(n=3,061)
Australia
(1,400)
Canada
(n=1,410)
New Zealand
(n=1,400)
United States
(n=1,401)
Receive reminders for preventive care (e.g. cancer screening)
49 37* 38* 44* 50
Regular doctor gave advice on weight, diet or exercise in past 2 years
27 38* 45* 32* 51*
Regular doctor enquired about emotional issues and stress in past 2 years
27 32* 37* 29 36*
* Significantly different from UK (p<0.05)
6.12 Preventive advice and support for self-care (international, 2005)
Self-care
(sicker
adults)
United Kingdom
(n=1,770)
%
Australia
(702)
%
Canada
(n=751)
%
New Zealand
(n=704)
%
United States
(n=1,527)
%
Germany
(n=1,503)
%
Health professional gave advice on diet or exercise in past year
45 59* 60* 52* 65* 46
* Significantly different from UK (p<0.05)
Copyright 2006 Picker Institute Europe. All rights reserved. Page 40
6.13 Preventive advice and support for self-care (UK, 2004)
Self-care (general
population)
England
(n=1,559)
%
Wales
(n=499)
%
Scotland
(n=503)
%
Northern Ireland
(n=499)
%
Receive reminders for preventive health checks (e.g. cancer screening)
49 44 51 50
Doctor gave advice on weight, diet or exercise in past 2 years
27 26 28 33*
Doctor enquired about emotional issues and stress in past 2 years
26 28 30 32*
* Significantly different from England (p<0.05)
6.14 Preventive advice and support for self-care (UK, 2005)
Self-care (sicker
adults)
England
(n=870)
%
Wales
(n=300)
%
Scotland
(n=300)
%
Northern Ireland
(n=300)
%
Health professional gave advice on diet or exercise in past year
45 48 44 50
* Significantly different from England (p<0.05)
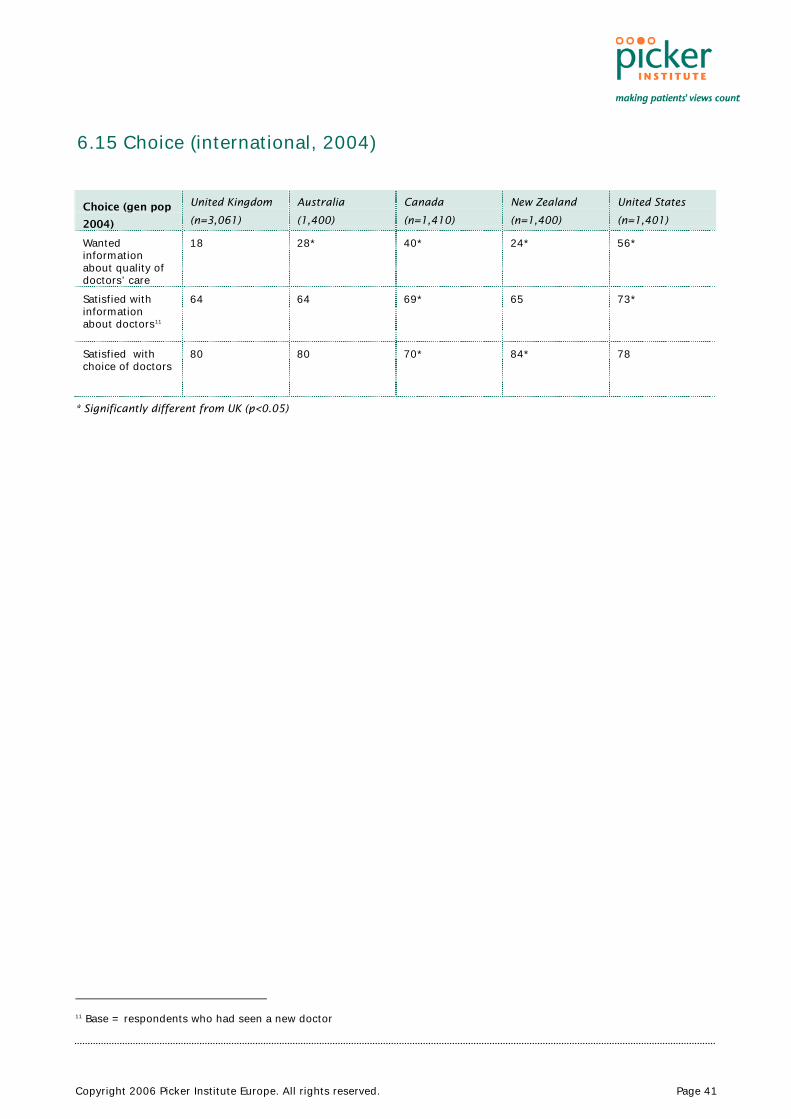
Copyright 2006 Picker Institute Europe. All rights reserved. Page 41
6.15 Choice (international, 2004)
Choice (gen pop
2004)
United Kingdom
(n=3,061)
Australia
(1,400)
Canada
(n=1,410)
New Zealand
(n=1,400)
United States
(n=1,401)
Wanted information about quality of doctors’ care
18 28* 40* 24* 56*
Satisfied with information about doctors11
64 64 69* 65 73*
Satisfied with choice of doctors
80 80 70* 84* 78
* Significantly different from UK (p<0.05)
11 Base = respondents who had seen a new doctor
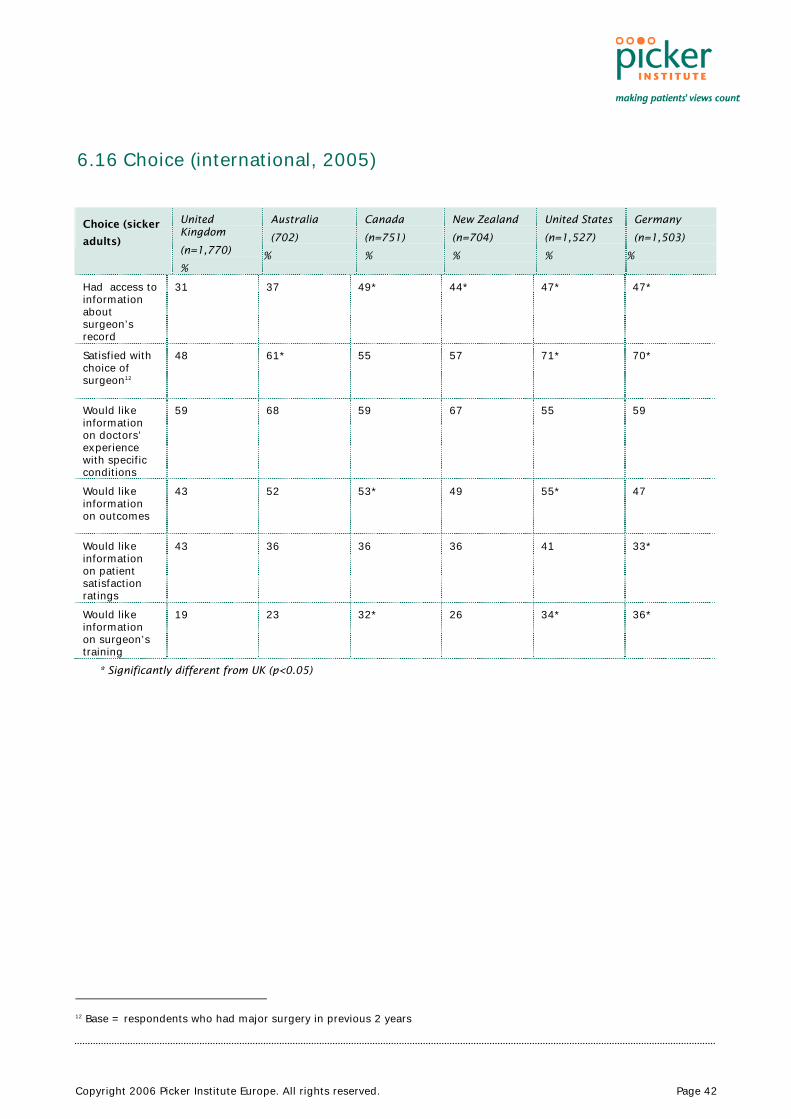
Copyright 2006 Picker Institute Europe. All rights reserved. Page 42
6.16 Choice (international, 2005)
Choice (sicker
adults)
United Kingdom
(n=1,770)
%
Australia
(702)
%
Canada
(n=751)
%
New Zealand
(n=704)
%
United States
(n=1,527)
%
Germany
(n=1,503)
%
Had access to information about surgeon’s record
31 37 49* 44* 47* 47*
Satisfied with choice of surgeon12
48 61* 55 57 71* 70*
Would like information on doctors’ experience with specific conditions
59 68 59 67 55 59
Would like information on outcomes
43 52 53* 49 55* 47
Would like information on patient satisfaction ratings
43 36 36 36 41 33*
Would like information on surgeon’s training
19 23 32* 26 34* 36*
* Significantly different from UK (p<0.05)
12 Base = respondents who had major surgery in previous 2 years
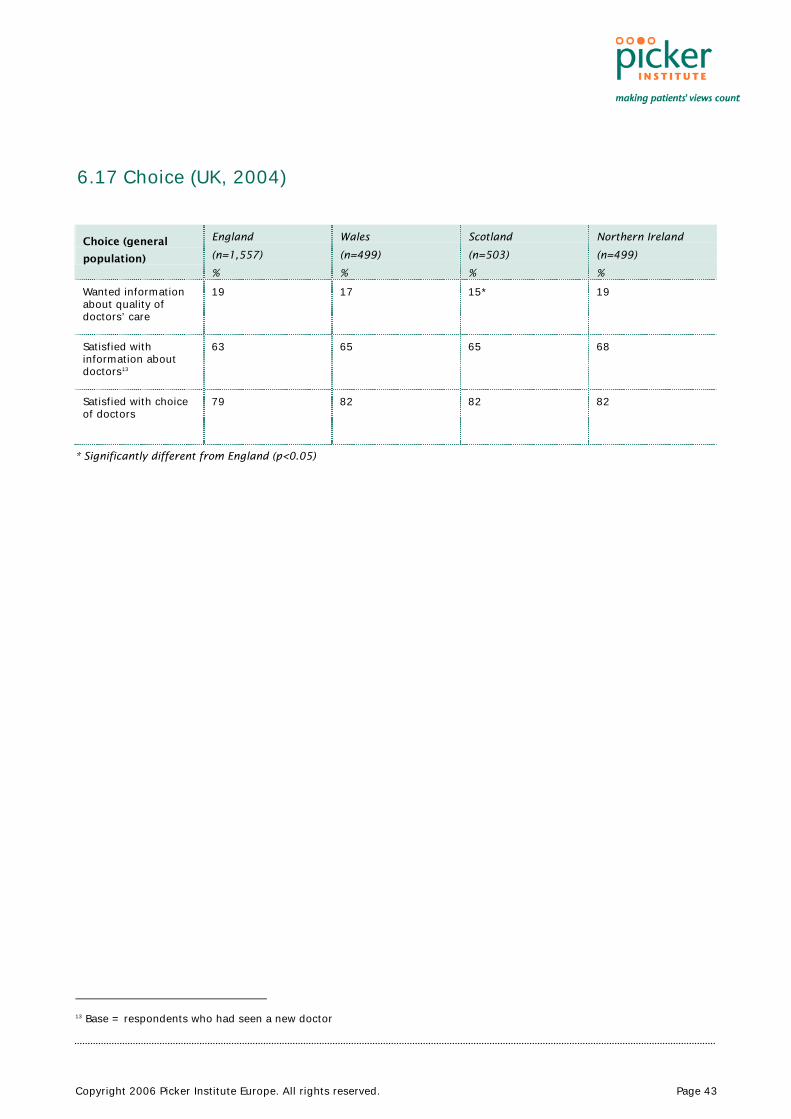
Copyright 2006 Picker Institute Europe. All rights reserved. Page 43
6.17 Choice (UK, 2004)
Choice (general
population)
England
(n=1,557)
%
Wales
(n=499)
%
Scotland
(n=503)
%
Northern Ireland
(n=499)
%
Wanted information about quality of doctors’ care
19 17 15* 19
Satisfied with information about doctors13
63 65 65 68
Satisfied with choice of doctors
79 82 82 82
* Significantly different from England (p<0.05)
13 Base = respondents who had seen a new doctor
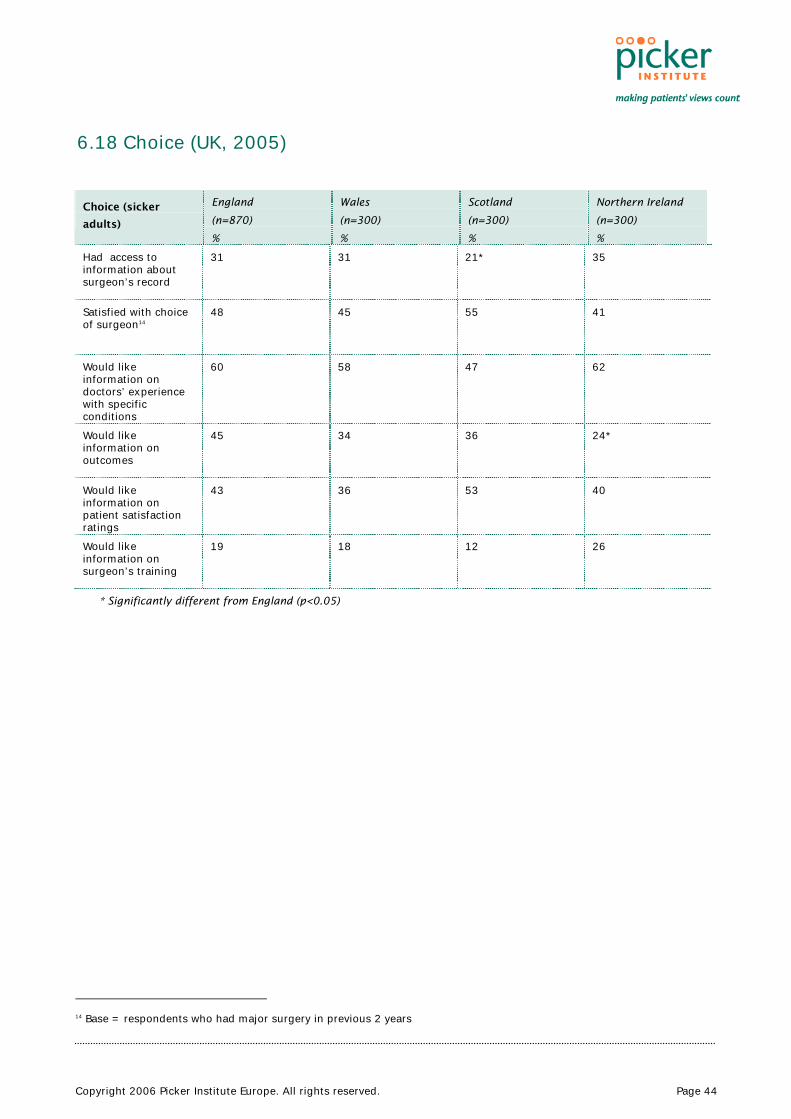
Copyright 2006 Picker Institute Europe. All rights reserved. Page 44
6.18 Choice (UK, 2005)
Choice (sicker
adults)
England
(n=870)
%
Wales
(n=300)
%
Scotland
(n=300)
%
Northern Ireland
(n=300)
%
Had access to information about surgeon’s record
31 31 21* 35
Satisfied with choice of surgeon14
48 45 55 41
Would like information on doctors’ experience with specific conditions
60 58 47 62
Would like information on outcomes
45 34 36 24*
Would like information on patient satisfaction ratings
43 36 53 40
Would like information on surgeon’s training
19 18 12 26
* Significantly different from England (p<0.05)
14 Base = respondents who had major surgery in previous 2 years

Copyright 2006 Picker Institute Europe. All rights reserved. Page 45
6.19 Shared decision-making (international, 2004)
Shared decision-
making (general
population)
United Kingdom
(n=3,061)
Australia
(1,400)
Canada
(n=1,410)
New Zealand
(n=1,400)
United States
(n=1,401)
Doctor explained medication side effects15
58 73* 71* 70* 68*
Doctor reviewed and discussed medications16
62 67 73* 66 73*
Regular doctor involves patient in treatment choices
42 62* 62* 63* 52*
* Significantly different from UK (p<0.05)
6.20 Shared decision-making (international, 2005)
Shared
decision-
making
(sicker
adults)
United Kingdom
(n=1,770)
%
Australia
(702)
%
Canada
(n=751)
%
New Zealand
(n=704)
%
United States
(n=1,527)
%
Germany
(n=1,503)
%
Doctor explained medication side effects17
51 62* 57 65* 52 49
Doctor reviewed and discussed medications
53 51 57 50 59* 59*
Regular doctor involves patient in treatment choices
43 50* 56* 59* 48* 53*
Hospital staff involved patient in treatment choices18
75 76 70 79 83* 77
Treatment risks were explained clearly19
62 65 57 61 66 65
* Significantly different from UK (p<0.05)
15 Base = all respondents taking prescription drugs 16 Base = all respondents taking prescription drugs 17 Base = all respondents taking prescription drugs 18 Base = all respondents who were hospitalized 19 Base = all respondents who were hospitalized
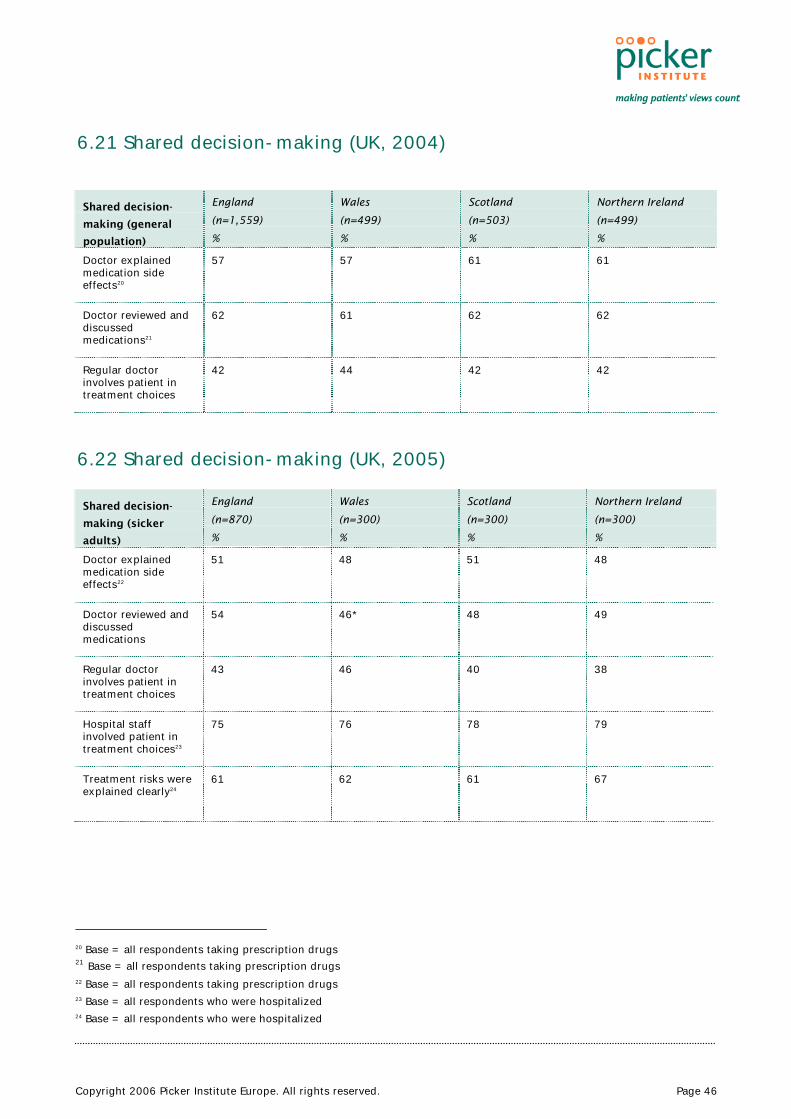
Copyright 2006 Picker Institute Europe. All rights reserved. Page 46
6.21 Shared decision-making (UK, 2004)
Shared decision-
making (general
population)
England
(n=1,559)
%
Wales
(n=499)
%
Scotland
(n=503)
%
Northern Ireland
(n=499)
%
Doctor explained medication side effects20
57 57 61 61
Doctor reviewed and discussed medications21
62 61 62 62
Regular doctor involves patient in treatment choices
42 44 42 42
6.22 Shared decision-making (UK, 2005)
Shared decision-
making (sicker
adults)
England
(n=870)
%
Wales
(n=300)
%
Scotland
(n=300)
%
Northern Ireland
(n=300)
%
Doctor explained medication side effects22
51 48 51 48
Doctor reviewed and discussed medications
54 46* 48 49
Regular doctor involves patient in treatment choices
43 46 40 38
Hospital staff involved patient in treatment choices23
75 76 78 79
Treatment risks were explained clearly24
61 62 61 67
20 Base = all respondents taking prescription drugs 21 Base = all respondents taking prescription drugs 22 Base = all respondents taking prescription drugs 23 Base = all respondents who were hospitalized 24 Base = all respondents who were hospitalized

Copyright 2006 Picker Institute Europe. All rights reserved. Page 47
6.23 Self-management (international, 2004)
Self-
management
(general
population)
United Kingdom
(n=3,059)
Australia
(1,400)
Canada
(n=1,410)
New Zealand
(n=1,400)
United States
(n=1,401)
Regular doctor gives clear instructions on what to do and what symptoms to watch for
84 89* 87* 90* 84
Regular doctor gives clear goals and treatment plan
74 84* 82* 82* 77
Doctor gave plan for managing care at home25
43 55* 59* 61* 61*
* Significantly different from UK (p<0.05)
25 Base = all those with chronic conditions

Copyright 2006 Picker Institute Europe. All rights reserved. Page 48
6.24 Self-management (international, 2005)
Self-
management
(sicker adults)
United Kingdom
(n=1,770)
%
Australia
(702)
%
Canada
(n=751)
%
New Zealand
(n=704)
%
United States
(n=1,527)
%
Germany
(n=1,503)
%
Regular doctor gives clear goals and treatment plan
66 75* 75* 80* 70* 75*
Regular doctor gives clear instructions eg.on symptoms to watch out for
68 76* 74* 82* 70 75*
Health professional gave plan for managing care at home
45 50 65* 56* 58* 37
Given clear instructions about self-care on leaving hospital26
71 80* 83* 84* 89* 75
Given hypertension self-management plan 27
21 25 30* 24 36* 24
Given heart disease self-management plan 28
8 11 13* 13* 16* 13*
Given diabetes self-management plan 29
11 13 14 11 19* 11
Given arthritis self-management plan 30
18 26* 30* 22 31* 13
Given lung disease self-management plan 31
15 20* 17 18 17 9*
Given depression self-management plan
13 16 20* 13 20* 9*
26 Base = all those who were hospitalized 27 Base = all those with hypertension 28 Base= all those with heart disease 29 Base = all those with diabetes 30 Base = all those with arthritis 31 Base = all those with asthma, emphysema or other chronic lung problem
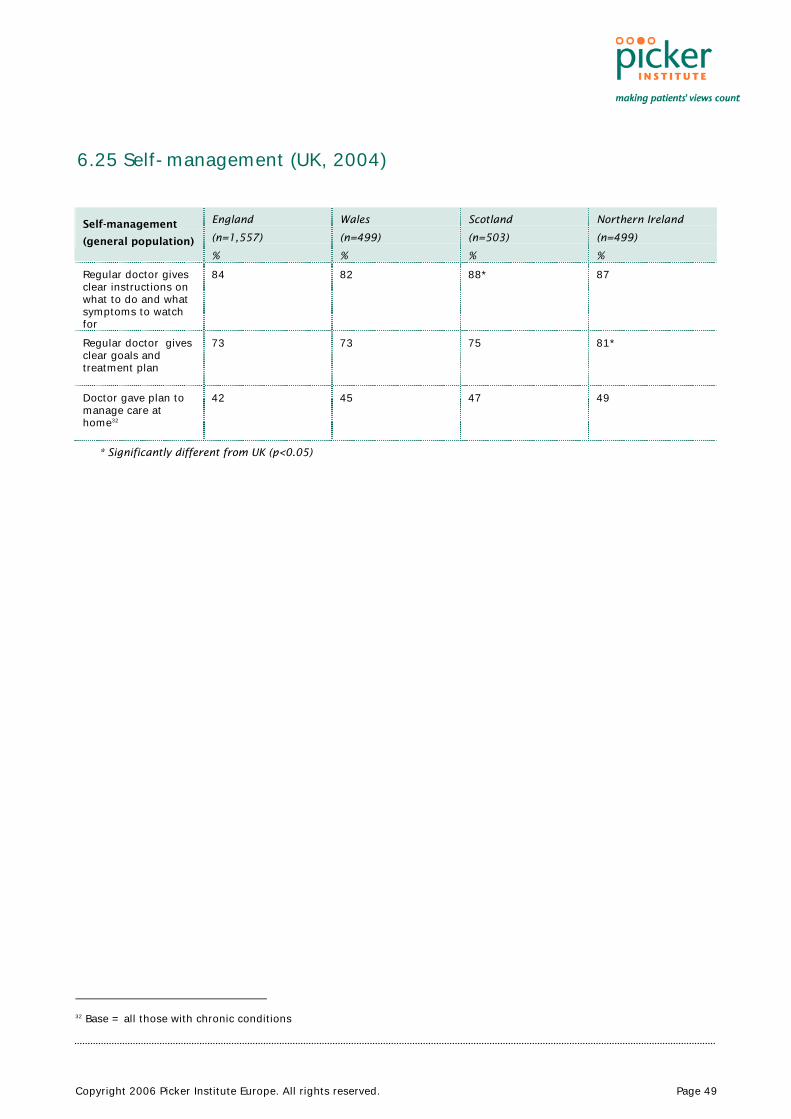
Copyright 2006 Picker Institute Europe. All rights reserved. Page 49
6.25 Self-management (UK, 2004)
Self-management
(general population)
England
(n=1,557)
%
Wales
(n=499)
%
Scotland
(n=503)
%
Northern Ireland
(n=499)
%
Regular doctor gives clear instructions on what to do and what symptoms to watch for
84 82 88*
87
Regular doctor gives clear goals and treatment plan
73 73 75 81*
Doctor gave plan to manage care at home32
42 45 47 49
* Significantly different from UK (p<0.05)
32 Base = all those with chronic conditions
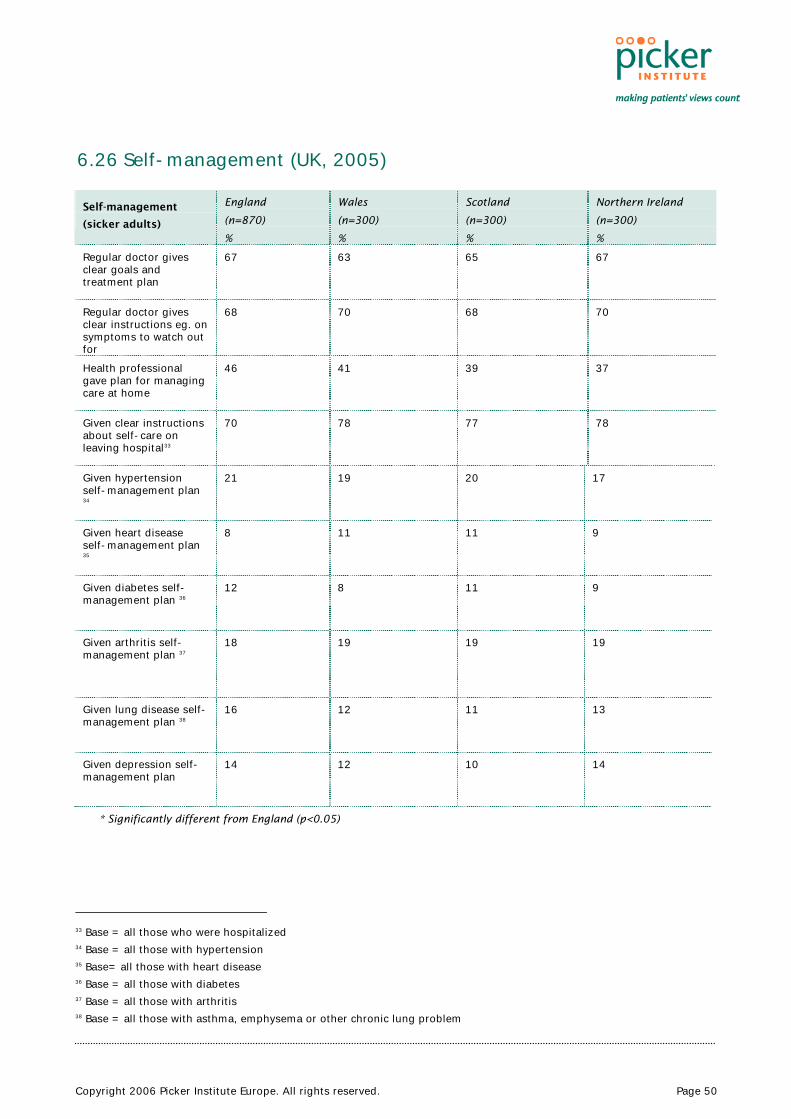
Copyright 2006 Picker Institute Europe. All rights reserved. Page 50
6.26 Self-management (UK, 2005)
Self-management
(sicker adults)
England
(n=870)
%
Wales
(n=300)
%
Scotland
(n=300)
%
Northern Ireland
(n=300)
%
Regular doctor gives clear goals and treatment plan
67 63 65 67
Regular doctor gives clear instructions eg. on symptoms to watch out for
68 70 68 70
Health professional gave plan for managing care at home
46 41 39 37
Given clear instructions about self-care on leaving hospital33
70 78 77 78
Given hypertension self-management plan 34
21 19 20 17
Given heart disease self-management plan 35
8 11 11 9
Given diabetes self-management plan 36
12 8 11 9
Given arthritis self-management plan 37
18 19 19 19
Given lung disease self-management plan 38
16 12 11 13
Given depression self-management plan
14 12 10 14
* Significantly different from England (p<0.05)
33 Base = all those who were hospitalized 34 Base = all those with hypertension 35 Base= all those with heart disease 36 Base = all those with diabetes 37 Base = all those with arthritis 38 Base = all those with asthma, emphysema or other chronic lung problem
Copyright 2006 Picker Institute Europe. All rights reserved. Page 51
References
1. Coulter A, Magee H. The European Patient of the Future. Maidenhead: Open University Press; 2003.
2. WHO. The world health report 2000: health systems - improving performance. 2000. Geneva, World Health Organization.
3. Secretary of State for Health. A first class service: quality in the new NHS. 1998. London, The Stationery Office.
4. Secretary of State for Health. The NHS Plan: a plan for investment, a plan for reform. 2000. London, Stationery Office.
5. Secretary of State for Health. Learning from Bristol: The report of the Public Inquiry into children's heart surgery at the Bristol Royal Infirmary 1984-95. CM5207(II). 2001. London, The Stationery Office.
6. Secretary of State for Health. Building on the best: choice, responsiveness and equity in the NHS. Cm 6079. 2003. London, Department of Health.
7. Secretary of State for Health. The NHS Improvement Plan - Putting people at the heart of public services. Cm 6268. 2004. London, Department of Health.
8. Secretary of State for Health. Our health, our care, our say. 2006. London, The Stationery Office.
9. Wanless D. Securing our future health: taking a long-term view (final report). 2002. London, HM Treasury.
10. Commonwealth Fund. International health policy surveys. Commonwealth Fund of New York [ 2005 [cited 6 A.D. Mar. 2]; Available from: URL:http://www.cmwf.org/surveys/surveys_list.htm?attrib_id=12009
11. Coulter A, Ellins J. The quality enhancing interventions project: patient-focused interventions. 2006. London, The Health Foundation.
12. Alvarez-Rosete A, Bevan G, Mays N, Dixon J. Effect of diverging policy across the NHS. BMJ 2005; 331(7522):946-950.
13. Jervis P, Plowden W. The impact of political devolution on the UK's health services. 2003. London, The Nuffield Trust.
14. Greer SL. Four way bet: how devolution has led to four different models for the NHS. 2004. London, The Constitution Unit, School of Public Policy, UCL.
Copyright 2006 Picker Institute Europe. All rights reserved. Page 52
15. Chancellor of the Exchequer. Public expenditure statistical analyses 2004. Cm 6201. 2004. London, HM Treasury.
16. Office of Health Economics. Compendium of Health Statistics. 2004. London, Office of Health Economics.
17. NHS Scotland. Fair to all, personal to each. 2004. Edinburgh, Scottish Executive.
18. Welsh Assembly Government. Designed for life: creating world class health and social care for Wales in the 21st century. 2006. Cardiff, Health and Social Care Department, Welsh Assembly Government.
19. Schoen C, Osborn R, Huynh PT, Doty M, Davis K, Zapert K et al. Primary care and health system performance: adults' experiences in five countries. Health Affairs 2004; W4(DOI 10.1377):487.
20. Schoen C, Osborn R, Huynh PT, Doty M, Zapert K, Peugh J et al. Taking the pulse of health care systems: experiences of patients with health problems in six countries. Health Affairs - web exclusive 2005; W5-509(DOI 10.1377).
21. Davis K, Schoen C, Schoenbaum S C, Audet A-M J, Doty M M, Holmgren A L, Kriss J L. Mirror, mirror on the wall: an update on the quality of American health care through the patient’s lens. 2006. New York: The Commonwealth Fund
22. Starfield B. Is primary care essential? Lancet 1994; 344:1129-1133.
23. Department of Health. Developing NHS Direct - a strategy document for the next three years. 2003. London, Department of Health.
24. NHS 24. NHS 24 annual report and accounts. 2005. Aberdeen, NHS 24.
25. National Institute for Health and Clinical Excellence. Four commonly used methods to increase physical activity: brief interventions in primary care, exercise referral schemes, pedometers and community-based exercise programmes for walking and cycling. 2006. London. NICE