Manual de proyectos de distribución, Chilectra - Lagolivconsultores.cl.pdf

PRESS RELEASE First Quarter 2008 – Market Information
Pg. 1
ENERSIS ANNOUNCES CONSOLIDATED RESULTS FOR
THE FIRST QUARTER ENDED MARCH 31, 2008
HIGHLIGHTS FOR THE PERIOD [All figures in Chilean Pesos]
ECONOMIC-FINANCIAL SUMMARY
The most important topics as of March 2008, as compared with March 2007, may be summarized as follows:
Net Income recorded 19.2%, reaching Ch$69,748 million.
Operating Revenues grew by 5.6%, reaching Ch$1,224,601 million, explained by 12.1% higher operating revenues arising from our generation and transmission businesses, and 1.1% arising from our distribution business.
Operating Income decreased by 11.2%, reaching Ch$339,657 million, due to a decrease in
Generation and Transmission 4.5% Distribution 18.4%
If we compare in homogeneous terms and isolate the appreciation of the Chilean peso effect,
which decreased Ch$101.5, from Ch$539.21 as of March 2007 to Ch$437.71 on March 2008, Operating Income would have increased a 1.6%.
SUMMARY OF DISTRIBUTION BUSINESS
Energy sales continue growing in the countries were we operate:
Chile 0.4% Argentina 2.5% Brazil 2.8% Colombia 4.9% Peru 8.0%
Consolidated physical sales grew a 3.0%. Higher increases were shown by Edelnor, Coelce
and Codensa.
Distribution clients continue growing, this time reaching 406 thousand new clients. Higher increasing were in Coelce, Codensa and Edelnor.
Energy losses –at the aggregate level- dropped from 11.1% to 10.4%. The largest such drop
occurred in Ampla, Coelce and Codensa.

PRESS RELEASE First Quarter 2008 – Market Information
Pg. 2
On March 11, 2008, the third bid of energy for distribution companies was made. It was done in two blocks, 1,800 GWh/year for years 2011 to 2021 and 1,500 GWh/year for years 2022 and 2023 and adjudged 1.8 TWh/ year at an average price of 65.8 US$/MWh.
Tariff Revisions;
• Codensa, programmed for 2008. • Edesur, programmed for 2008. • Chilectra, programmed for November 2008. • Coelce, programmed for April 2011. • Ampla, programmed for March 2009.
SUMMARY OF GENERATION BUSINESS
Energy demand in those countries that we operate continued to grow, as follows:
Chile 0.7% Argentina 3.8% Brazil 3.3% Colombia 1.6% Peru 9.4%
Our installed capacity expanded by 3.0%, from 13,726 to 14,182 MW; basically, because of the
incorporation of San Isidro II, Palmucho, Canela and the generation of Taltal.
Physical sales grew in Costanera, Edegel, Emgesa and Fortaleza.
Chile’s National Energy Commission (CNE) published the node price for the SIC corresponding to the price-fixing of April 2008, which were 118.28 US$/MWh and 52.4 Ch$/kWh monomic price for the Alto Jahuel node 220, representing a 13.7% increase in US dollars and a 2.6% drop in Chilean pesos.
Chile’s CNE published the node prices for the SING corresponding to the price fixing of April
2008, which were 115.9 US$/MWh and 51.3 Ch$/kWh monomic price for the Crucero 220 node, representing a 0% US dollar price hike and an 8% drop in Chilean pesos.
On April 1, 2008 was issued the Law 20,257 that stimulates the use of non-conventional
renewable energies (ERNC). The main objective of this law is to force generators that at least a 5% of their contracted energy must come from non-conventional renewable sources, between years 2010 and 2014, increasing progressively in annual 0,5% from the 2015 to year 2024, when it reaches a 10%.

PRESS RELEASE First Quarter 2008 – Market Information
Pg. 3
TABLE OF CONTENTS
HIGHLIGHTS FOR THE PERIOD .......................................................................................................................1
TABLE OF CONTENTS........................................................................................................................................3
GENERAL INFORMATION ..................................................................................................................................5 SIMPLIFIED ORGANIZATIONAL STRUCTURE............................................................................................................. 6
MARKET INFORMATION.....................................................................................................................................7 EQUITY MARKET.................................................................................................................................................... 7 MARKET PERCEPTION ......................................................................................................................................... 10 DEBT MARKET..................................................................................................................................................... 10
RISK RATING CLASSIFICATION.....................................................................................................................11
CONSOLIDATED INCOME STATEMENT.......................................................................................................12 UNDER CHILEAN GAAP, MILLION CH$.................................................................................................................. 12 UNDER CHILEAN GAAP, THOUSAND US$ ............................................................................................................ 13
CONSOLIDATED INCOME STATEMENT ANALYSIS..................................................................................14 NET INCOME ....................................................................................................................................................... 14 OPERATING INCOME............................................................................................................................................ 14 NON OPERATING INCOME.................................................................................................................................... 15 EVOLUTION OF KEY FINANCIAL RATIOS................................................................................................................ 16
CONSOLIDATED BALANCE SHEET ..............................................................................................................18 ASSETS UNDER CHILEAN GAAP, MILLION CH$ .................................................................................................... 18 ASSETS UNDER CHILEAN GAAP, THOUSAND US$ ............................................................................................... 19 LIABILITIES AND SHAREHOLDERS EQUITY UNDER CHILEAN GAAP, MILLION CH$................................................... 20 LIABILITIES AND SHAREHOLDERS EQUITY UNDER CHILEAN GAAP, THOUSAND US$.............................................. 21
CONSOLIDATED BALANCE SHEET ANALYSIS .........................................................................................22 DEBT MATURITY WITH THIRD PARTIES, MILLION CH$............................................................................................ 25 DEBT MATURITY WITH THIRD PARTIES, THOUSAND US$....................................................................................... 25
CONSOLIDATED CASH FLOW........................................................................................................................26 UNDER CHILEAN GAAP, MILLION CH$.................................................................................................................. 26 UNDER CHILEAN GAAP, THOUSAND US$............................................................................................................ 28
CONSOLIDATED CASH FLOW ANALYSIS...................................................................................................30 CASH FLOW RECEIVED FROM FOREIGN SUBSIDIARIES BY ENERSIS, CHILECTRA AND ENDESA CHILE..................... 31 CAPEX AND DEPRECIATION.................................................................................................................................. 32
ANALYSIS OF THE EXCHANGE RISK AND THE INTEREST RATE ........................................................33

PRESS RELEASE First Quarter 2008 – Market Information
Pg. 4
ARGENTINA.........................................................................................................................................................35 GENERATION....................................................................................................................................................... 35 Costanera ........................................................................................................................................................35 Chocón.............................................................................................................................................................36 DISTRIBUTION ..................................................................................................................................................... 37 Edesur ..............................................................................................................................................................37
BRAZIL..................................................................................................................................................................38 Endesa Brazil (*) .............................................................................................................................................38 GENERATION....................................................................................................................................................... 38 Cachoeira Dourada .......................................................................................................................................38 Fortaleza ..........................................................................................................................................................39 TRANSMISSION.................................................................................................................................................... 39 Cien...................................................................................................................................................................39 DISTRIBUTION ..................................................................................................................................................... 40 Ampla ...............................................................................................................................................................40 Coelce ..............................................................................................................................................................41
CHILE ....................................................................................................................................................................42 GENERATION....................................................................................................................................................... 42 ENDESA CHILE .................................................................................................................................................... 42 DISTRIBUTION ..................................................................................................................................................... 44 Chilectra ...........................................................................................................................................................44
COLOMBIA...........................................................................................................................................................45 GENERATION....................................................................................................................................................... 45 Emgesa ............................................................................................................................................................45 DISTRIBUTION ..................................................................................................................................................... 46 Codensa...........................................................................................................................................................46
PERU .....................................................................................................................................................................47 GENERATION....................................................................................................................................................... 47 Edegel ..............................................................................................................................................................47 DISTRIBUTION ..................................................................................................................................................... 48 Edelnor .............................................................................................................................................................48
PARTIALLY CONSOLIDATED INCOME STATEMENT................................................................................49 UNDER CHILEAN GAAP, MILLION CH$................................................................................................................. 49 UNDER CHILEAN GAAP, THOUSAND US$............................................................................................................ 50
CONFERENCE CALL INVITATION..................................................................................................................51 CONTACT INFORMATION ...................................................................................................................................... 52 DISCLAIMER ........................................................................................................................................................ 52

PRESS RELEASE First Quarter 2008 – Market Information
Pg. 5
GENERAL INFORMATION (Santiago, Chile, April 25, 2008) Enersis S.A. (NYSE: ENI), announced today its consolidated financial results for the first quarter ended on March 31, 2008. All figures are in both US$ and Ch$, under Chilean Generally Accepted Accounting Principles (Chilean GAAP), as seen in the standardized form required by Chilean authorities (FECU). Variations refer to the period between March 31, 2007 and March 31, 2008. Figures for 2008 have been adjusted by the accounting convention for CPI variation between both periods, accounting to 8.1%. Any figures in US$ are merely offered as a convenience translation, using the observado exchange rate of Ch$437.71 = US$1 for March 31, 2008. The Chilean pesos appreciated by 18.8% against the US$ between March 31, 2007 and the comparable date in 2008. The consolidation includes the following investment vehicles and companies, a) In Chile: Endesa Chile (NYSE: EOC)*, Chilectra, Synapsis, CAM and Inmobiliaria Manso de
Velasco. b) Outside Chile: Distrilima (Peru), Endesa Brasil (Brazil)**, Edesur (Argentina) and Codensa
(Colombia). In the following pages you will find a detailed analysis of financial statements, a brief explanation for most variations, and comments on main items in the Income and Cash Flow Statements compared to the information as of March 2007. * Includes its Chilean subsidiaries (Celta, Pangue, Pehuenche, San Isidro, Tunel El Melon) and
Costanera, El Chocón, Edegel. ** Includes Endesa Fortaleza, CIEN, Cachoeira Dourada, Ampla and Coelce.

PRESS RELEASE First Quarter 2008 – Market Information
Pg. 6
SIMPLIFIED ORGANIZATIONAL STRUCTURE
Business Ownership Business Ownership
Costanera Gx 41.8% Endesa Brazil Gx, Dx, Tx 53.6%
El Chocón Gx 39.2% Cachoeira Dourada Gx 53.4%
Edesur Dx 65.4% Fortaleza Gx 53.6%
CTM Tx 53.6% Ampla Dx 69.9%
TESA Tx 53.6% Coelce Dx 34.9%
CEMSA Tx 27.0% CIEN Tx 53.6%
Business Ownership Negocio Particip.
Endesa Chile Gx 60.0% Emgesa (**) Gx 16.1%
Celta Gx 60.0% Codensa Dx 21.7%
Pangue Gx 57.0%
Pehuenche Gx 55.6%
San Isidro Gx 60.0%
GasAtacama Gx 30.0%
Hidroaysén Gx 30.6%
Canela Gx 45.0% Negocio Particip.
Chilectra Dx 99.1%Edegel Gx 19.8%
GNL Quintero Ox 12.0%Edelnor Dx 33.5%
GNL Chile Ox 20.0%
Electrogas Ox 25.5%
Gx: Generation Dx: DistributionTx: Transmission /Trading Ox: Gas Pipelines, others
(**) Emgesa and Betania were merged under the name of Emgesa since financial statements as of September, 2007
BRAZILARGENTINA
ENERSISDirect and indirect economic interest
PERÚ
CHILE COLOMBIA

PRESS RELEASE First Quarter 2008 – Market Information
Pg. 7
MARKET INFORMATION EQUITY MARKET
New York Stock Exchange (NYSE)
During the period, the company’s ADS stock price raised 7.5%. The chart below presents the performance of Enersis’ ADS stock price listing in NYSE (“ENI”) against Dow Jones and the DJ Utilities Index:
Source: Bloomberg
Daily Average Transactions Volume(1 ADR = 50 local shares)
361514
382556 603
275 361
643 534
969
657770
0
400
800
April
May
June
July
Augu
st
Sept
embe
r
Octo
ber
Nove
mbe
r
Dece
mbe
r
Janu
ary
Febr
uary
March
Thou
sand
ADR
ADS price variation v/s Local Stock Index
76828894
100106112118124
Mar
/07
May
/07
Jul/0
7
Sep/
07
Nov/
07
Jan/
08
Mar
/08
(%)
Dow Jones ENI DJ Utilities
US$ 16.44
US$ 17.68
average
PRESS RELEASE First Quarter 2008 – Market Information
Pg. 8
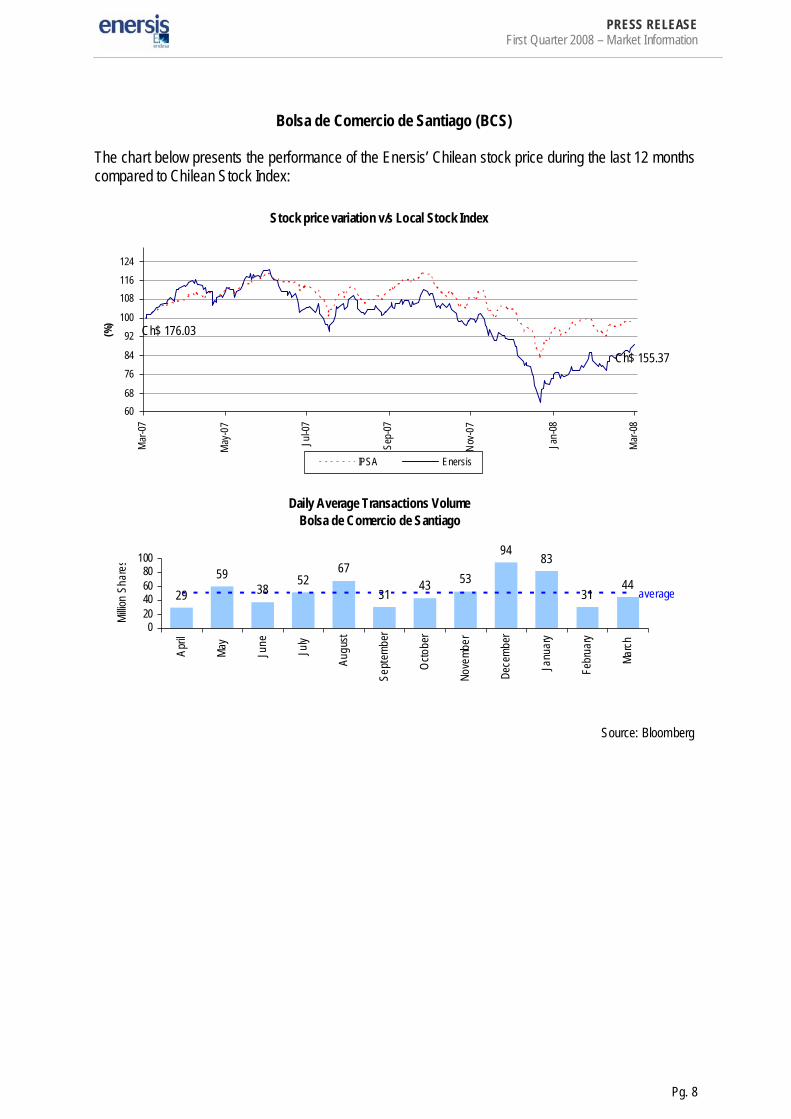
Bolsa de Comercio de Santiago (BCS) The chart below presents the performance of the Enersis’ Chilean stock price during the last 12 months compared to Chilean Stock Index:
Source: Bloomberg
Daily Average Transactions VolumeBolsa de Comercio de Santiago
2959
3852
67
3143 53
94 83
3144
020406080
100
April
May
June
July
Augu
st
Sept
embe
r
Octo
ber
Nove
mber
Dece
mber
Janu
ary
Febr
uary
March
Millio
n Sh
are s
Stock price variation v/s Local Stock Index
6068
76
84
92
100
108116
124
Mar
-07
May
-07
Jul-0
7
Sep-
07
Nov-0
7
Jan-
08
Mar
-08
(%)
IPSA Enersis
Ch$ 155.37
Ch$ 176.03
average

PRESS RELEASE First Quarter 2008 – Market Information
Pg. 9
Madrid Stock Exchange (Latibex) The chart below illustrates the Enersis’ share price at the Madrid Stock Exchange, (Latibex) over the last 12 months compared with the Local Stock Index:
Source: Bloomberg
Stock price variation v/s Local Stock Index
60
80
100
120
140
160
Mar
-07
May
-07
Jul-0
7
Sep-
07
Nov-
07
Ene-
08
Mar
-08
(%)
Latibex XENI
€ $ 12.12
€ $ 10.98
Daily Average Transactions Volume(1 unit = 50 local shares)
7 4 3 3 4 6 3 4
19
683
0
10
20
April
May
June
July
Augu
st
Sept
embe
r
Octo
ber
Nove
mber
Dece
mber
Janu
ary
Febr
uary
Marc
h
Thou
sand
Uni
t
average

PRESS RELEASE First Quarter 2008 – Market Information
Pg. 10
MARKET PERCEPTION The chart below summarizes the ADS´ target price released by analysts. Table 1
Publication Date Company Main Analyst Target Price RecommendationUS$
01/Oct/07 Penta Inversiones Jorge Palavecino 22.5 Neutral (3) 11/Oct/07 UBS Brian Chase 20.2 Neutral (4) 12/Oct/07 Banchile (1) Sergio Zapata 21.5 Buy26/Oct/07 Larrain Vial Jorge Donoso 24.4 Overweight30/Oct/07 Deutsche Bank Marcus Sequeira 23.0 Buy30/Oct/07 Bear Stearns Rowe Michels 19.0 Peer Perform (5)10/Dec/07 Alfa Corredores (2) Lorena Pizarro 23.4 Buy06/Feb/08 Merrill Lynch Frank McGann 22.0 Buy26/Feb/08 Raymond James Ricardo Cavanagh 20.8 Buy27/Mar/08 Santander Diego Celedón 23.5 BuyADR average target price (US$) 22.0
(1) The analyst used an exchange rate of Ch$535 forecasted by Banchile for the end of year 2008.(2) We used an exchange rate of Ch$497 as of report´s date(3) Target price differ between -8% & 8% from real price.(4) Target price differ between -6% & 6% from real price.(5) Stock is supposed to perform in line with estimation
Source: Bloomberg and market researches
DEBT MARKET The following chart shows the pricing of our Yankee Bonds during the last twelve months.
Enersis Yankee Bonds
103
105
107
109
111
113
Mar-0
7
Apr-0
7
May
-07
Jun-0
7
Jul-0
7
Aug-0
7
Sep-0
7
Oct-0
7
Nov-0
7
Dec-0
7
Jan-0
8
Feb-0
8
Mar-0
8
Par v
alue
7.375% Enersis Notes due.2014 7.4% Enersis Notes due 2016
110,56
109,51
Source: Bloomberg

PRESS RELEASE First Quarter 2008 – Consolidated Income Statement
Pg. 11
RISK RATING CLASSIFICATION Standard & Poor’s: BBB / Stable Rationale (July 03, 2007); “Standard & Poor's Ratings Services raised its ratings on Chile -based electricity provider Enersis S.A. by one notch, to 'BBB' from 'BBB'-, and removed them from Credit Watch with positive implications where they were placed on Dec. 15, 2006. The outlook is stable. The upgrade reflects the improvement of the company's financial risk profile mainly due to the very good performance of its Chilean operations, which represent about 50% of its consolidated EBITDA adjusted by ownership, combined with adequate debt service coverage ratios (DSCR) and very good liquidity and financial flexibility.” Fitch: BBB / Stable Rationale (July 5, 2007); “Fitch has affirmed both the Foreign Currency Issuer Default Rating (FC IDR) and the Local Currency IDR (LC IDR) for Enersis S.A. (Enersis) at 'BBB'. The unsecured debt rating is also 'BBB' and applies to the company's US$600.6 million of Yankee Bonds. The ratings affect approximately US$679 million of debt. All ratings have a Stable Outlook. The ratings reflect continued growth in electricity demand in all the countries where Enersis has a presence. In general, Enersis operates in countries with a stable regulatory framework, resulting in growing tariffs and electricity prices, and a manageable level of government interference.” Moody’s: Baa3 / Stable Rationale (December 14, 2006); “Moody’s upgraded its rating for Enersis and for its 60% owned subsidiary, Endesa Chile, from Ba1 to Baa3, both with Stable Outlook. With this rating action, both companies achieved “investment grade” category. Moody’s upgrade was mainly due to the companies’ higher financial flexibility and liquidity, and based also on the fact that the financial performance has raised markedly over the last two years as a result of improvements in the regulatory framework and higher demand for electricity in the countries in which the companies operate; namely, Chile, Colombia, Peru, Brazil and Argentina. The ratings were placed on Stable Outlook, reflecting the stable scenario in the region, with higher prices for electricity, better economic conditions, strong increase in electricity demand and a lower regulatory uncertainty.” Feller Rate: Bonds: AA- / Positive - Shares: 1st Class Level 1 Rationale (July 6, 2007); “Feller Rate improved the credit risk classification for the Company’s local bonds and bonds lines to the level “AA-” from “A+”, with stable outlook. These ratings had been under positive outlook since July, 2006. Feller Rate remarked, that it had raised the risk rating category based upon Enersis’ improved financial profile, derived from the better financial situation of the Chilean subsidiary Endesa Chile, as well as to the sustained positive results arising from the distribution business, mainly through the subsidiary Chilectra. At the same time, and due to a healthy financial flexibility, the agency expects that Enersis will continue facing refinancing of its consolidated debt maturity in better terms and conditions, to reduce its total debt.” Fitch Chile: Bonds: AA- / Stable - Shares: 1st Class Level 1 Rationale (July 20, 2007); “Fitch Ratings raised its domestic credit rating for Enersis S.A. (“Enersis” or “the Company”) to “AA-“ from “A+”, maintaining a “Stable Outlook.” This change affects the local bonds issuance No.264 (Series B1 and B2). The increase in the rating for Enersis reflects the culmination of a credit improvement plan to reduce debt and extend debt maturities, resulting in a stronger cash flow and greater financial flexibility.”

PRESS RELEASE First Quarter 2008 – Consolidated Income Statement
Pg. 12
CONSOLIDATED INCOME STATEMENT UNDER CHILEAN GAAP, MILLION CH$ Table 2 CONS. INCOME STATEMENT - (million Ch$) 03M 07 03M 08 Var 07-08 Chg %
Revenues from Generation & Transmission 485,229 543,854 58,625 12.1%Revenues from Distribution 760,919 769,016 8,097 1.1%Revenues from Engineering and Real Estate 9,892 9,954 62 0.6%Revenues from Other Businesses 42,457 42,215 (242) (0.6%)Consolidation Adjustments (138,791) (140,438) (1,647) (1.2%)
Operating Revenues 1,159,706 1,224,601 64,895 5.6%Costs from Generation (267,790) (338,652) (70,862) (26.5%)Costs from Distribution (534,822) (578,452) (43,630) (8.2%)Costs from Engineering and Real Estate (7,729) (7,753) (24) (0.3%)Costs from Other Businesses (36,017) (34,625) 1,392 3.9%Consolidation Adjustments 131,987 135,053 3,066 2.3%
Operating Costs (714,371) (824,429) (110,058) (15.4%)Operating Margin 445,335 400,172 (45,163) (10.1%)
SG&A from Generation (13,444) (10,341) 3,103 23.1%SG&A from Distribution (47,594) (44,999) 2,595 5.5%SG&A from Engineering and Real Estate (853) (1,011) (158) (18.5%)SG&A from Other Businesses (9,676) (11,150) (1,474) (15.2%)Consolidation Adjustments 8,644 6,986 (1,658) (19.2%)
Selling and Administrative Expenses (62,923) (60,515) 2,408 3.8%Operating Income 382,412 339,657 (42,755) (11.2%)
Interest Income 29,494 30,074 580 2.0%Interest Expense (115,519) (90,309) 25,210 21.8%
Net Interest (Expense) (86,025) (60,235) (25,790) 30.0%Equity Gains from Related Companies 715 4,202 3,487 487.8%Equity Losses from Related Companies (2,224) (419) 1,805 81.2%
Net Income from Related Companies (1,509) 3,783 5,292 N/AOther Non Operating Income 57,262 24,724 (32,538) (56.8%)Other Non Operating Expenses (103,126) (123,046) (19,920) (19.3%)
Net other Non Operating Income (Expense) (45,864) (98,322) (52,458) (114.4%)Price Level Restatement (144) (4,592) (4,448) N/AForeign Exchange Effect 200 (1,834) (2,034) (1017.0%)
Net of Monetary Exposure 56 (6,426) (6,482) N/APositive Goodwill Amortization (15,127) (15,062) 65 0.4%Non Operating Income (148,469) (176,262) (27,793) (18.7%)Net Inc b. Taxes, Min Int and Neg Goodwill Amort. 233,943 163,395 (70,548) (30.2%)
Extraordinary Items - - - -Income Tax (105,556) (55,936) 49,620 47.0%Minority Interest (71,080) (38,721) 32,359 45.5%Negative Goodwill Amortization 1,219 1,010 (209) 17.2%
NET INCOME 58,526 69,748 11,222 19.2%
EBITDA 501,615 442,294 (59,321) (11.8%)

PRESS RELEASE First Quarter 2008 – Consolidated Income Statement
Pg. 13
UNDER CHILEAN GAAP, THOUSAND US$ Table 2.1 CONS. INCOME STATEMENT - (thousand US$) 03M 07 03M 08 Var 07-08 Chg %
Revenues from Generation & Transmission 1,108,562 1,242,499 133,937 12.1%Revenues from Distribution 1,738,408 1,756,908 18,500 1.1%Revenues from Engineering and Real Estate 22,599 22,742 143 0.6%Revenues from Other Businesses 96,999 96,445 (554) (0.6%)Consolidation Adjustments (317,084) (320,846) (3,762) (1.2%)
Operating Revenues 2,649,485 2,797,745 148,260 5.6%Costs from Generation (611,798) (773,691) (161,893) (26.5%)Costs from Distribution (1,221,864) (1,321,542) (99,678) (8.2%)Costs from Engineering and Real Estate (17,658) (17,713) (55) (0.3%)Costs from Other Businesses (82,284) (79,104) 3,180 3.9%Consolidation Adjustments 301,539 308,545 7,006 2.3%
Operating Costs (1,632,065) (1,883,505) (251,440) (15.4%)Operating Margin 1,017,420 914,241 (103,179) (10.1%)
SG&A from Generation (30,715) (23,624) 7,091 23.1%SG&A from Distribution (108,734) (102,806) 5,928 5.5%SG&A from Engineering and Real Estate (1,949) (2,310) (361) (18.5%)SG&A from Other Businesses (22,107) (25,473) (3,366) (15.2%)Consolidation Adjustments 19,749 15,960 (3,789) (19.2%)
Selling and Administrative Expenses (143,755) (138,254) 5,501 3.8%Operating Income 873,665 775,987 (97,678) (11.2%)
Interest Income 67,382 68,707 1,325 2.0%Interest Expense (263,916) (206,322) 57,594 21.8%
Net Interest (Expense) (196,533) (137,615) 58,918 30.0%Equity Gains from Related Companies 1,633 9,600 7,967 487.8%Equity Losses from Related Companies (5,081) (958) 4,123 81.2%
Net Income from Related Companies (3,448) 8,643 12,091 N/AOther Non Operating Income 130,821 56,485 (74,336) (56.8%)Other Non Operating Expenses (235,604) (281,113) (45,509) (19.3%)
Net other Non Operating Income (Expense) (104,783) (224,628) (119,845) (114.4%)Price Level Restatement (330) (10,490) (10,160) N/AForeign Exchange Effect 457 (4,190) (4,647) (1017.0%)
Net of Monetary Exposure 127 (14,680) (14,807) N/APositive Goodwill Amortization (34,558) (34,410) 148 0.4%Non Operating Income (339,196) (402,691) (63,495) (18.7%)Net Inc b. Taxes, Min Int and Neg Goodwill Amort. 534,469 373,296 (161,173) (30.2%)
Extraordinary Items - - - -Income Tax (241,155) (127,792) 113,363 47.0%Minority Interest (162,391) (88,464) 73,927 45.5%Negative Goodwill Amortization 2,786 2,309 (477) 17.2%
NET INCOME 133,710 159,349 25,639 19.2%
EBITDA 1,145,998 1,010,472 (135,526) (11.8%)

PRESS RELEASE First Quarter 2008 – Consolidated Income Statement
Pg. 14
CONSOLIDATED INCOME STATEMENT ANALYSIS (Source in Ch$ FECU)
NET INCOME Enersis’ result for the first quarter of the year 2008 was Ch$69,748 million, which is 19.2% higher than that obtained during equal period of the previous year and whose result amounted to Ch$58,526 million. OPERATING INCOME The operating income as of March 31, 2008 dropped by Ch$42,755 million, from Ch$382,412 million as of March 31, 2007 to Ch$339,657 million in the current period showing a drop of 11.0%. It is important to mention that the comparison of the operating income between both years is heavily impacted by the greater appreciation of the Chilean peso against the US dollar and of the other currencies of those countries where we have investments, added to the steep updating of last year’s figures for comparative purposes; which was 8.1%. If we compare in homogeneous terms and isolate the appreciation of the Chilean peso effect, which decreased Ch$101.5, from Ch$539.21 as of March 2007 to Ch$437.71 on March 2008, Operating Income would have increased a 1.6%. Table 4
Million Ch$ Operating Revenues Operating Costs SG & A Operating Income Operating
Revenues Operating Costs SG& A Operating Income
Endesa Chile 426,372 (231,065) (10,910) 184,397 480,560 (317,050) (8,464) 155,046 Cachoeira (*) 20,617 (8,318) (812) 11,487 54,192 (9,801) (583) 43,808 Fortaleza (**) 27,038 (14,715) (350) 11,973 40,157 (38,441) (399) 1,317 Cien (**) 28,331 (29,354) (1,469) (2,492) 1,535 (4,469) (942) (3,876) Chilectra 194,950 (149,914) (11,272) 33,764 253,656 (215,670) (10,558) 27,428 Edesur 84,761 (68,508) (10,334) 5,919 67,769 (51,874) (9,048) 6,847 Distr ilima (Edelnor) 60,734 (42,785) (5,303) 12,646 53,118 (35,844) (4,516) 12,758 Ampla 163,002 (105,795) (6,200) 51,007 151,998 (105,608) (6,567) 39,823 Investluz (Coelce) 122,454 (74,138) (10,407) 37,909 108,654 (80,046) (9,929) 18,679 Codensa 135,019 (93,682) (4,048) 37,289 133,822 (89,410) (4,362) 40,050 CAM Ltda. 26,884 (23,295) (2,656) 933 28,227 (24,709) (3,226) 292 Inmobi liaria Manso de Velasco Ltda. 1,967 (1,421) (576) (30) 1,767 (1,269) (717) (219) Synapsis Soluciones y Servicios IT Ltda. 14,301 (11,574) (2,174) 553 12,720 (9,516) (1,768) 1,436 Enersis Holding and other investment vehicles 1,272 (1,147) (4,814) (4,689) 1,267 (400) (6,138) (5,271) Consol idation Adjustments (147,996) 141,340 8,402 1,746 (164,841) 159,678 6,702 1,539 Total Consolidation 1,159,706 (714,371) (62,923) 382,412 1,224,601 (824,429) (60,515) 339,657
03M 07 03M 08
Table 4.1
Thousand US$ Operating Revenues Operating Costs SG & A Operating Income Operating
Revenues Operating Costs SG& A Operating Income
Endesa Chile 974,097 (527,896) (24,925) 421,276 1,097,895 (724,339) (19,338) 354,219 Cachoeira (*) 47,103 (19,004) (1,856) 26,242 123,809 (22,392) (1,332) 100,085 Fortaleza (**) 61,772 (33,618) (799) 27,355 91,743 (87,824) (911) 3,008 Cien (**) 64,726 (67,064) (3,357) (5,694) 3,506 (10,209) (2,151) (8,854) Chilectra 445,386 (342,497) (25,751) 77,138 579,508 (492,723) (24,122) 62,663 Edesur 193,645 (156,514) (23,610) 13,521 154,827 (118,513) (20,671) 15,644 Distr ilima (Edelnor) 138,755 (97,748) (12,116) 28,891 121,353 (81,891) (10,318) 29,145 Ampla 372,397 (241,701) (14,164) 116,532 347,258 (241,275) (15,003) 90,980 Investluz (Coelce) 279,761 (169,376) (23,775) 86,609 248,232 (182,875) (22,684) 42,674 Codensa 308,467 (214,027) (9,248) 85,192 305,732 (204,268) (9,966) 91,498 CAM Ltda. 61,419 (53,221) (6,068) 2,131 64,488 (56,451) (7,371) 665 Inmobi liaria Manso de Velasco Ltda. 4,495 (3,246) (1,317) (68) 4,038 (2,900) (1,638) (501) Synapsis Soluciones y Servicios IT Ltda. 32,671 (26,443) (4,968) 1,261 29,061 (21,740) (4,038) 3,283 Enersis Holding and other investment vehicles 2,906 (2,622) (10,998) (10,714) 2,896 (913) (14,024) (12,041) Consol idation Adjustments (338,114) 322,908 19,195 3,989 (376,598) 364,802 15,311 3,516 Total Consolidation 2,649,485 (1,632,069) (143,756) 873,660 2,797,749 (1,883,510) (138,256) 775,982 (*) Consolidated by Endesa Chile until September 30th, 2005. Since October 1th is consolidated by Enersis through Endesa Brasil.(**) Since October 1, 2005, these subsidiar ies are consolidated by Enersis through Endesa Brasil.
03M 07 03M 08

PRESS RELEASE First Quarter 2008 – Consolidated Income Statement
Pg. 15
NON OPERATING INCOME As of March 31, 2008, Enersis shows a non-operating income loss amounting to Ch$176,262 million, which represents increased losses of Ch$27,793 million, with respect to the non-operating loss obtained as of the same date of 2007, which amounted to Ch$148,469 million. Net interest expenses decreased 30.0%, or Ch$25,790 million, from a net expense of Ch$86.025 million as of March 2007, to a net expense of Ch$60.235 million in the current period. The decrease is mainly attributable to a lower average interest rate and the impact of foreign exchange rate in the financial expenses of –principally- Endesa Chile, Ampla and Coelce. Likewise, our subsidiary Edesur -during this period- reduced its interest payments by Ch$5,728 million by bringing penalties up to date regarding quality of service.
Net profits from investments in related companies show an increase of Ch$5,292 million, after accounting a net loss of Ch$1,509 million during the first quarter of the year 2007, to a net profit of Ch$3,783 million in March 2008. This benefit is mainly due to the accounting of the profit obtained in Gas Atacama Holding of Ch$2,983 million (a loss of Ch$1,633 million as of March 2007). Amortization on positive goodwill does not show significant variations and amounted to Ch$15,062 million as of March 31, 2008, a drop of Ch$65 million, equivalent to 0.4% compared with the same period of 2007. Net other non-operating revenues and expenses accounted an increase in losses of Ch$52,458 million compared to a net loss of Ch$45.864 million as of March 2007. Main reasons that explain such variation in the results are:
Higher net losses of Ch$47,546 million, originating from the conversion adjustment to Chilean accounting rules (Technical Bulletin N°64) mainly of the subsidiaries in Brazil, Colombia and Peru (Ch$6,655 million, net of minority holders).
A lower profit -on account of the tariff adjustment of previous years in Edesur- amounting to Ch$30.233 million, acknowledged in March 2007.
The foregoing was partially offset by:
Lower expense on account of Equity Taxes in Colombia, of Ch$12,965 million. Profit on account of a capacity re-settlement in Chile, of Ch$6,586 million. Lower expenses on account of penalties & fines, of Ch$6,551 million, in CIEN and CGTF.
Price-level restatement shows a negative variation of Ch$4,448 million, which is mostly attributable to the higher inflation effect during the first quarter of the year 2008 which reached 0.8%, as compared with 0.2% during the same period of last year. Such variation impacts non-monetary assets & liabilities and certain monetary ones, mainly UF-denominated bonds, as well as the updating of profit & loss accounts. Foreign Exchange difference as of March 31, 2008 accounted a negative variation of Ch$2,034 million, from a profit of Ch$200 million during the first quarter of the year 2007 to a loss of Ch$1,834 million in the current period. The foregoing is the result of a mismatched position in US dollars of assets owned by the company during both periods, and also due to variations of the US dollar parity with the Chilean peso. Thus, during the first quarter of the year 2007, the foreign exchange rate increased $6.82 pesos, from $532.39 to $539.21, as opposed to this period in which the foreign exchange rate dropped by $59.18 pesos, from $496.89 to $437.71.

PRESS RELEASE First Quarter 2008 – Consolidated Income Statement
Pg. 16
Income tax and Deferred tax during the first quarter of 2008 were Ch$55,936 million; which, when compared to the Ch$105,556 million of 2007’s first quarter, results in a positive variation of Ch$49,620 million. Income tax, expenses accounted Ch$34,741 million, mainly explained by lower income tax provision in our subsidiaries: Endesa Chile Ch$16,251 million, Coelce Ch$8,443 million, Edesur Ch$8,152 million, Cien Ch$8,014 million and CGTF Ch$3,170, partially offset by increments in Ampla Ch$6,447 million, Pehuenche Ch$3,796 million and Codensa Ch$3,081 million. Deferred taxes, which do not represent cash flows- show a positive variation of Ch$14,879 million, originating mostly from the acknowledged effect on Enersis Ch$12,108 million, on Ampla Ch$8,249 million, on Chilectra Ch$7,658 million and on Coelce Ch$5,966 million, partially offset by Cien Ch$9,049 million, San Isidro Ch$4,930 million, Endesa Chile Ch$2,296 million and Edegel Ch$2,152 million. Amortization on negative goodwill amounted to Ch$1,010 million as of March 31, 2008, which does not present any significant variations with respect to the same period of last year, in which it amounted to Ch$1,219 million. Minority interest decreased by Ch$32,359 million, reaching Ch$38,721 million, as a result of a decrease in some of our subsidiaries’ results. Emgesa decreased by Ch$14,262 million, Codensa Ch$9,915 million, Edegel Ch$8,766 million, Edelnor Ch$5,019 million and Edesur Ch$4,304 million. These negative results were partially offset by increases at Endesa Chile by Ch$9,572 million, Endesa Brazil Ch$9,075 million and Pehuenche by Ch$1,362 million. EVOLUTION OF KEY FINANCIAL RATIOS Table 5 Indicator Unit 03M 07 03M 08 Var 07-08 Chg %Liquidity Times 1.26 1.28 0.02 1.6%Acid ratio test * Times 1.18 1.19 0.01 0.8%Working capital million Ch$ 428,254 466,313 38,059 8.9%Working capital th. US$ 978,396 1,065,346 86,950 8.9%Leverage ** Times 0.96 1.01 0.05 5.2%Short-term debt % 0.27 0.31 0.04 14.8%Long-term debt % 0.73 0.69 (0.04) (5.5%)Interest Coverage*** Times 4.59 5.20 0.61 13.3%EBITDA**** th. US$ 1,145,998 1,010,472 (135,526) (11.8%)ROE % 7.36% 9.64% 2.28% 31.0%ROA % 1.92% 2.60% 0.68% 35.4%
* Current assets net of inventories and pre-paid expenses** Using the ratio = Total debt / (equity + minority interest)***EBITDAEI/Interest expenses = (Earnings before taxes+Fin exp+Net non operating income+depreciation+Positive Goodwill)
/Interest expenses****EBITDA: Operating Income+Depreciation+Amortization

PRESS RELEASE First Quarter 2008 – Consolidated Income Statement
Pg. 17
Liquidity ratio as of March 2008 is 1.28x, which represents an increase of 1.6%, compared to the same date of 2007. This reflects a company with solid liquidity position to fulfill its financial obligations, finance its investments with cash surplus, having an adequate maturity schedule of its debt. Leverage was 1.01 times as of March 31, 2008, increasing its level by 5.2% when compared to the same period of the year 2007 Hedging of financial expenses increased 0.61 times or the equivalent to 13.3%, growing from 4.59x, in March 2007, to 5.20x in the current period. The foregoing is the result of an increase of the results obtained by the Enersis Group in the current period, added to the reduction in financial expenses. ROE is 9.64%, which is compared positively against previous year figure of 7.36%. This increase is directly related to better results obtained in the period. ROA went from 1.92% in March 2007, to 2.60% in March 2008, reflecting the best results obtained in the current period and the reduction of those assets that are US dollars denominated.

PRESS RELEASE First Quarter 2008 – Consolidated Balance Sheet
Pg. 18
CONSOLIDATED BALANCE SHEET ASSETS UNDER CHILEAN GAAP, MILLION CH$ Table 6 ASSETS - (million Ch$) 03M 07 03M 08 Var 07-08 Chg %
CURRENT ASSETSCash 54,697 40,332 (14,365) (26.3%)Time deposits 373,216 379,586 6,370 1.7%Marketable securities 19,105 5,616 (13,490) (70.6%)Accounts receivable, net 994,098 889,030 (105,068) (10.6%)Notes receivable, net 8,736 12,355 3,619 41.4%Other accounts receivable, net 116,179 88,236 (27,942) (24.1%)Amounts due from related companies 25,994 147,285 121,291 466.6%Inventories 84,359 92,492 8,134 9.6%Income taxes recoverable 79,533 142,720 63,187 79.4%Prepaid expenses 55,706 62,965 7,258 13.0%Deferred income taxes 60,774 67,896 7,121 11.7%Other current assets 173,815 202,278 28,463 16.4%Total currrent assets 2,046,212 2,130,790 84,578 4.1%
PROPERTY, PLANT AND EQUIPMENTLand 145,350 129,769 (15,581) (10.7%)Buildings and infraestructure and works in progress 12,163,407 10,643,888 (1,519,519) (12.5%)Machinery and equipment 2,214,289 1,776,714 (437,575) (19.8%)Other plant and equipment 642,497 543,145 (99,352) (15.5%)Technical appraisal 34,008 33,878 (130) (0.4%)
Sub - Total 15,199,552 13,127,394 (2,072,159) (13.6%)Accumulated depreciation (6,388,362) (5,710,003) 678,359 10.6%Total property, plant and equipment 8,811,190 7,417,391 (1,393,799) (15.8%)
OTHER ASSETSInvestments in related companies 126,068 50,028 (76,040) (60.3%)Investments in other companies 26,394 20,596 (5,798) (22.0%)Positive goodwill, net 694,622 629,291 (65,331) (9.4%)Negative goodwill, net (48,311) (31,941) 16,370 33.9%Long-term receivables 157,163 188,794 31,631 20.1%Amounts due from related companies 99,110 2,589 (96,521) (97.4%)Deferred income taxes 11,014 - (11,014) -Intangibles 100,598 88,079 (12,519) (12.4%)Accumulated amortization (61,797) (56,365) 5,432 8.8%Others assets 305,010 255,928 (49,082) (16.1%)Total other assets 1,409,872 1,146,999 (262,873) (18.6%)
TOTAL ASSETS 12,267,274 10,695,180 (1,572,094) (12.8%)

PRESS RELEASE First Quarter 2008 – Consolidated Balance Sheet
Pg. 19
ASSETS UNDER CHILEAN GAAP, THOUSAND US$ Table 6.1 ASSETS - (thousand US$) 03M 07 03M 08 Var 07-08 Chg %
CURRENT ASSETSCash 124,961 92,143 (32,818) (26.3%)Time deposits 852,657 867,209 14,552 1.7%Marketable securities 43,648 12,829 (30,819) (70.6%)Accounts receivable, net 2,271,133 2,031,093 (240,040) (10.6%)Notes receivable, net 19,959 28,226 8,267 41.4%Other accounts receivable, net 265,424 201,586 (63,838) (24.1%)Amounts due from related companies 59,386 336,490 277,104 466.6%Inventories 192,727 211,310 18,583 9.6%Income taxes recoverable 181,703 326,062 144,359 79.4%Prepaid expenses 127,268 143,850 16,582 13.0%Deferred income taxes 138,846 155,116 16,270 11.7%Other current assets 397,101 462,127 65,026 16.4%Total currrent assets 4,674,812 4,868,040 193,228 4.1%
PROPERTY, PLANT AND EQUIPMENTLand 332,070 296,472 (35,598) (10.7%)Buildings and infraestructure and works in progress 27,788,736 24,317,215 (3,471,521) (12.5%)Machinery and equipment 5,058,803 4,059,112 (999,691) (19.8%)Other plant and equipment 1,467,861 1,240,878 (226,983) (15.5%)Technical appraisal 77,696 77,398 (298) (0.4%)
Sub - Total 34,725,166 29,991,076 (4,734,090) (13.6%)Accumulated depreciation (14,594,966) (13,045,173) 1,549,793 10.6%Total property, plant and equipment 20,130,200 16,945,903 (3,184,297) (15.8%)
OTHER ASSETSInvestments in related companies 288,017 114,295 (173,722) (60.3%)Investments in other companies 60,300 47,053 (13,247) (22.0%)Positive goodwill, net 1,586,946 1,437,690 (149,256) (9.4%)Negative goodwill, net (110,372) (72,973) 37,399 33.9%Long-term receivables 359,057 431,322 72,265 20.1%Amounts due from related companies 226,428 5,914 (220,514) (97.4%)Deferred income taxes 25,163 - (25,163) -Intangibles 229,828 201,227 (28,601) (12.4%)Accumulated amortization (141,183) (128,772) 12,411 8.8%Others assets 696,831 584,697 (112,134) (16.1%)Total other assets 3,221,016 2,620,454 (600,562) (18.6%)
TOTAL ASSETS 28,026,029 24,434,397 (3,591,632) (12.8%)

PRESS RELEASE First Quarter 2008 – Consolidated Balance Sheet
Pg. 20
LIABILITIES AND SHAREHOLDERS EQUITY UNDER CHILEAN GAAP, MILLION CH$ Table 7 LIABILITIES AND SHAREHOLDER´S EQUITY - (million Ch$) 03M 07 03M 08 Var 07-08 Chg %
CURRENT LIABILITIESShort-term debt due to banks and financial institutions 150,499 173,041 22,542 15.0%Current portion of long-term debt due to banks and financial institutions 154,659 110,883 (43,776) (28.3%)Current portion of bonds payable 256,141 329,774 73,634 28.7%Current portion of long-term notes payable 45,639 31,071 (14,569) (31.9%)Dividends payable 38,575 115,853 77,278 200.3%Accounts payable 419,725 442,989 23,265 5.5%Short-term notes payable 12,394 13,471 1,077 8.7%Miscellaneous payables 118,816 86,608 (32,207) (27.1%)Accounts payable to related companies 32,662 31,595 (1,067) (3.3%)Accrued expenses 77,706 76,260 (1,446) (1.9%)Withholdings 117,424 90,252 (27,173) (23.1%)Income taxes payable 105,892 27,298 (78,594) (74.2%)Anticipated income 3,931 6,354 2,423 61.6%Reinbursable financial contribution 945 1,482 537 56.8%Other current liabilities 82,950 127,545 44,595 53.8%Total current liabilities 1,617,958 1,664,477 46,519 2.9%
LONG-TERM LIABILITIESDue to banks and financial institutions 1,086,537 933,298 (153,239) (14.1%)Bonds payable 2,352,309 1,887,512 (464,797) (19.8%)Long -term notes payable 121,693 97,363 (24,330) (20.0%)Accounts payables 164,701 142,772 (21,929) (13.3%)Amounts payable to related companies 12,317 7,190 (5,128) (41.6%)Accrued expenses 376,361 307,755 (68,607) (18.2%)Deferred income taxes - 30,700 30,700 -Reinbursable financial contribution 3,251 4,251 1,001 30.8%Other long-term liabilities 265,782 304,952 39,170 14.7%Total long-term liabilities 4,382,953 3,715,794 (667,159) (15.2%)
Minority interest 3,088,018 2,426,260 (661,758) (21.4%)
SHAREHOLDERS´ EQUITYPaid-in capital, no par value 2,610,922 2,594,015 (16,907) (0.6%)Additional paid-in capital 5,222 20,752 15,530 297.4%Additional paid-in capital (share premium) 186,438 186,340 (98) (0.1%)Other reserves (246,892) (546,510) (299,618) 121.4%
Total capital and reserves 2,555,691 2,254,598 (301,093) (11.8%)Retained earnings 564,325 564,303 (22) (0.0%)Net income for the period 58,526 69,748 11,221 19.2%Interim dividends - - - -Deficits of subsidaries in development stage (197) - 197 (100.0%)
Total retained earnings 622,654 634,050 11,396 1.8%Total shareholder s equity 3,178,345 2,888,649 (289,696) (9.1%)
TOTAL LIABILITIES AND SHAREHOLDER´S EQUITY 12,267,274 10,695,180 (1,572,094) (12.8%)
PRESS RELEASE First Quarter 2008 – Consolidated Balance Sheet
Pg. 21
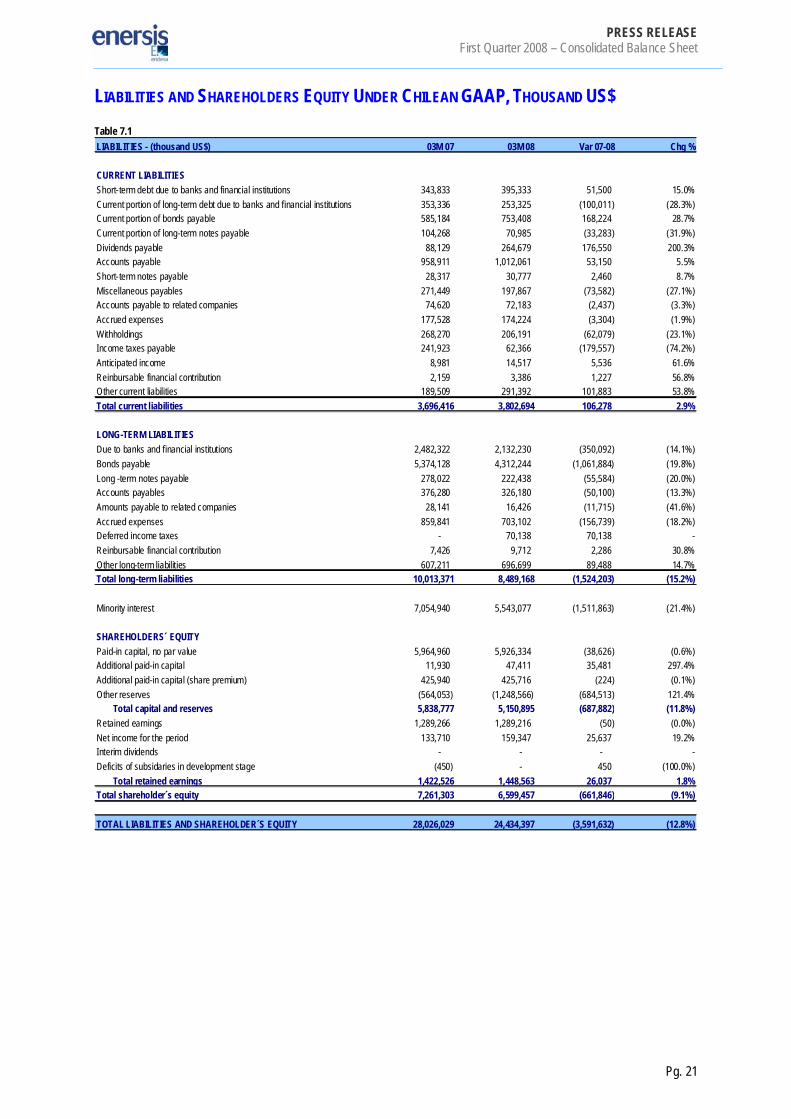
LIABILITIES AND SHAREHOLDERS EQUITY UNDER CHILEAN GAAP, THOUSAND US$ Table 7.1 LIABILITIES - (thousand US$) 03M 07 03M 08 Var 07-08 Chg %
CURRENT LIABILITIESShort-term debt due to banks and financial institutions 343,833 395,333 51,500 15.0%Current portion of long-term debt due to banks and financial institutions 353,336 253,325 (100,011) (28.3%)Current portion of bonds payable 585,184 753,408 168,224 28.7%Current portion of long-term notes payable 104,268 70,985 (33,283) (31.9%)Dividends payable 88,129 264,679 176,550 200.3%Accounts payable 958,911 1,012,061 53,150 5.5%Short-term notes payable 28,317 30,777 2,460 8.7%Miscellaneous payables 271,449 197,867 (73,582) (27.1%)Accounts payable to related companies 74,620 72,183 (2,437) (3.3%)Accrued expenses 177,528 174,224 (3,304) (1.9%)Withholdings 268,270 206,191 (62,079) (23.1%)Income taxes payable 241,923 62,366 (179,557) (74.2%)Anticipated income 8,981 14,517 5,536 61.6%Reinbursable financial contribution 2,159 3,386 1,227 56.8%Other current liabilities 189,509 291,392 101,883 53.8%Total current liabilities 3,696,416 3,802,694 106,278 2.9%
LONG-TERM LIABILITIESDue to banks and financial institutions 2,482,322 2,132,230 (350,092) (14.1%)Bonds payable 5,374,128 4,312,244 (1,061,884) (19.8%)Long -term notes payable 278,022 222,438 (55,584) (20.0%)Accounts payables 376,280 326,180 (50,100) (13.3%)Amounts payable to related companies 28,141 16,426 (11,715) (41.6%)Accrued expenses 859,841 703,102 (156,739) (18.2%)Deferred income taxes - 70,138 70,138 -Reinbursable financial contribution 7,426 9,712 2,286 30.8%Other long-term liabilities 607,211 696,699 89,488 14.7%Total long-term liabilities 10,013,371 8,489,168 (1,524,203) (15.2%)
Minority interest 7,054,940 5,543,077 (1,511,863) (21.4%)
SHAREHOLDERS´ EQUITYPaid-in capital, no par value 5,964,960 5,926,334 (38,626) (0.6%)Additional paid-in capital 11,930 47,411 35,481 297.4%Additional paid-in capital (share premium) 425,940 425,716 (224) (0.1%)Other reserves (564,053) (1,248,566) (684,513) 121.4%
Total capital and reserves 5,838,777 5,150,895 (687,882) (11.8%)Retained earnings 1,289,266 1,289,216 (50) (0.0%)Net income for the period 133,710 159,347 25,637 19.2%Interim dividends - - - -Deficits of subsidaries in development stage (450) - 450 (100.0%)
Total retained earnings 1,422,526 1,448,563 26,037 1.8%Total shareholder´s equity 7,261,303 6,599,457 (661,846) (9.1%)
TOTAL LIABILITIES AND SHAREHOLDER´S EQUITY 28,026,029 24,434,397 (3,591,632) (12.8%)

PRESS RELEASE First Quarter 2008 – Consolidated Cash Flow Analysis
Pg. 22
CONSOLIDATED BALANCE SHEET ANALYSIS The company’s Total Assets as of March 2008 dropped by Ch$1,572,094 million respect to the same period of the previous year; this is mostly attributable to:
A reduction of Fixed assets for Ch$1,393,799 million, equivalent to 15.8% mainly as a result of the impact of the real foreign exchange rate on the fixed assets of foreign companies, pursuant to Technical Bulletin N°64 in those subsidiaries that reside in unstable countries, for approximately Ch$1,608,000 million and for 1-year fixed asset depreciation of nearly Ch$404,250 million and for fixed asset sales for Ch$3.556 million. The foregoing is partially offset by fixed asset additions during the last year of approximately Ch$613,340 million.
A reduction of Other assets for Ch$262,873 million, caused mainly because of:
Reduced receivables from related companies for Ch$96,521 million, as a result of transferring
Atacama Finance receivables to the short-term. Reduced investments in related companies of Ch$76,040 million, mostly attributable to the
impairment provision in Gas Atacama Holding Ltda. for Ch$48,890 million, the acknowledged impairment of investments during the last 12 months for Ch$2,540 million and the impact of the foreign exchange rate for nearly Ch$31,000 million
Reduced Positive Goodwill on investments for Ch$65,331 million, basically brought about by the amortization of the Positive Goodwill on investments registered during the last 12 months.
Reduction in Other long-term assets for Ch$49,082 million, basically explained by the amortization of deferred expenses for Ch$48,260 million, a reduction of tax credits for Ch$7,853 million and smaller guarantee deposits for Ch$2,583 million, partially offset by a growth in the fair value of derivative instruments for Ch$12,074 million.
An increase in Long-term debtors for Ch$31,631 million, principally as a consequence of the increases of Codensa for Ch$56,600 million, the Codesa Hogar program, Chocón and Endesa Costanera for Ch$14,048 million, for increments to contributions to the investment FONINVEMEM. The foregoing is partially offset by a reduction of Ampla’s regulatory assets of Ch$27,510 million, as well as Edesur’s of Ch$10,253 million, and for the acknowledgement of the retroactive tariff price adjustment.
A reduction of the balance on Negative Goodwill on investments of Ch$16,370 million, mostly attributable to the amortization of the last 12 months and the impact of the foreign exchange rate.

PRESS RELEASE First Quarter 2008 – Consolidated Cash Flow Analysis
Pg. 23
Current assets presents an increase of Ch$84,578 million equivalent to 4,1%, which is explained by:
Increased receivables from related companies for Ch$121,291 million, mostly attributable to the
transferring of Atacama Finance Co. receivables by Ch$80.145 million to the short-term, and to increased receivables from GNL Quintero by Ch$45,198 million, partially offset by a reduction of accounts receivable from GNL Chile by Ch$3,675 million.
Increased recoverable taxes for Ch$63,187 million as a consequence of the increases in Endesa Chile by Ch$41,631 million, in San Isidro by Ch$12,680 million, in Enersis by Ch$ 7,900 million and in Endesa Eco by Ch$5,709 million; partially offset by a reduction in Chilectra by Ch$4,147 million.
Increases in Other current assets of Ch$28,463 million, explained mostly by increased deposits on account of debt and guarantees on Enersis by Ch$38,378 million, an increase in Coelce by Ch$16,097 million for the Brazilian Government’s environmental project Luz para todos; partially offset by smaller buyback agreements in Chilectra by Ch$17,418 million, and in Cachoeira Dourada by Ch$4,071 million in smaller deposits.
A reduction in sales debtors by Ch$105,068 million, mainly because of the impact of currency variations and of the previous year updating. The principal reductions occur in Coelce by Ch$38,302 million, in Codensa by Ch$32,380 million, in Ampla by Ch$14,485 million, in Cien by Ch$12,304 million, in Emgesa by Ch$8,731 million, in Edesur by Ch$8,117 million and in Pehuenche by Ch$7,546 million; partially offset by increases in Endesa Chile of Ch$14,846 million and Cachoeira Dourada of Ch$10,822 million.
A reduction in miscellaneous debtors by Ch$27,942 million mostly explained by smaller debtors on account of capacity settlement in Chile by Ch$7,783 million, a greater collection in Codensa Hogar’s portfolio by Ch$6,829 million, and smaller advance payments to suppliers in San Isidro and Coelce for Ch$6,337 million and Ch$4,957 million, respectively.
The company’s Total Liabilities accounted a reduction of Ch$1,572,094 million with respect to the same period of the previous year.
Long-term liabilities presents a reduction of Ch$667,159 million, equivalent to 15,2% and mostly
attributable to:
A reduction in bonds payable reaching Ch$464,797 million, mostly explained by the transfer to short-term of Ch$329,450 million in Endesa Chile, Edegel Ch$9,490 million, Edelnor Ch$7,188 million and by a sharp reduction of the impact of the constant $/US$ exchange rate en Chile for approximately Ch$400,000 million. The foregoing is partially offset by the placement of new bond issues in Codensa of Ch$96,097 million, in Endesa Chile of Ch$79,290 million, in Edegel of Ch$35,503 million, in Edelnor of Ch$35,081 million, in Edesur of Ch$22,765 million and in Emgesa of Ch$9,612 million.
A reduction of Long-term Bank Debt for Ch$153,239 million owed to a reduction in Edesur of Ch$42,098 million, in Enersis of Ch$39,154 million, in Coelce of Ch$22,600 million, in El Chocón of Ch$22,177 million, in CGTF of Ch$20,572 million, in Cien of Ch$20,418 million, in Edegel of Ch$16,698 million and in Endesa Costanera of Ch$13,366 million, partially offset by an increase in Ampla of Ch$38,253 million and Endesa Chile of Ch$19,851 million.
Reduced Provisions for Ch$68,606 million, which are explained mostly by reduced provisions on account of tax & labor contingencies in Ampla, Coelce and CIEN for Ch$ 42,143 million, a lesser benefit obligation to retired employees in Codensa, Emgesa, Ampla and Coelce of Ch$14,239 million, and a smaller provision for contingencies in Endesa Fortaleza of Ch$13,122 million.

PRESS RELEASE First Quarter 2008 – Consolidated Cash Flow Analysis
Pg. 24
Current Liabilities increased by Ch$46,519 million, equivalent to 2.9%, which are explained by variations in:
Increased short-term public borrowing amounting to Ch$73,634 million mostly attributable to
transfers from the long-term in Endesa Chile, Codensa, Edegel and Edelnor -as previously explained- for Ch$359,434 million; and partially offset by payments in Ampla of Ch$83,348 million, in Endesa Chile of Ch$81,172 million, in Edegel of Ch$32,272 million and in Edelnor of Ch$16,782 million, added to the Chilean peso appreciation effect.
Increased Dividends Payable of Ch$77,278 million; of which, Ch$52,411 million correspond to dividends payable to third parties, and Ch$25,717 million to Endesa Internacional.
Increased Other Current Liabilities for Ch$45,132 million as a result of the increment in Edesur of Ch$40,826 million, increased fair values of derivative contracts for Ch$17,458 million, partially offset by reduced liabilities on account of collections on Codensa’s portfolio for Ch$8,191 million.
Reduced Income Tax Payments reaching Ch$78.594 million; noteworthy among which are: Endesa Chile and its Chilean subsidiaries with Ch$58,689 million, Edelnor with Ch$13,191 million and Codensa with Ch$13,154 million, partially offset by an increase in Edesur‘s income tax payments of Ch$6,730 million.
Reduced Bank Borrowings of Ch$43,776 million, mainly attributable to distribution in Edesur by Ch$15,967 million, in Emgesa by Ch$15,815 million, in Pehuenche by Ch$14,990 million, in Coelce by Ch$13,576 million and in Cachoeira Dourada by Ch$3,313 million; partly offset by short-term transfers in Ampla of Ch$16,969 million, in El Chocón of Ch$7,531 million and in Costanera of Ch$5,152 million.
Reduced miscellaneous Debtors amounting to Ch$32,207 million mostly because of the reduction occurring in Emgesa of Ch$12,307 million, the equity tax payment in Edegel of Ch$10,899, and the payment of a leasing and a fuel bill in Ampla of Ch$5,844 million.
Minority interest totaled Ch$2,426,260 million, reflecting a reduction of Ch$661,758 million, equivalent to 21.4% of the total, as a result of shareholders’ equity reductions experienced by the companies because of the dividends paid out and of the impact of the US dollar / Chilean peso exchange rate. The company’s Equity dropped by Ch$289,696 million, when compared to that of March 2007. This variation is mostly explained by a drop in reserves amounting to Ch$299,618 million, mainly attributable to the impact of the US dollar / Chilean peso exchange rate in hedging foreign investments; all this was partially offset by an increase of this year’s results amounting to Ch$11,221 million.

PRESS RELEASE First Quarter 2008 – Consolidated Cash Flow Analysis
Pg. 25
DEBT MATURITY WITH THIRD PARTIES, MILLION CH$ Table 8
TOTAL Million Ch$ 2008 2009 2010 2011 2012 BalanceChile 204,778 431,588 46,384 91,136 12,789 1,029,391 1,816,067
Enersis 1,852 155,053 1,855 1,961 2,074 466,859 629,654 Chilectra 30 - - - - - 30 Other (*) 5,721 294 172 - - - 6,187
Endesa Chile (**) 197,175 276,241 44,358 89,175 10,715 562,533 1,180,197 Argentina 24,925 46,366 40,394 46,439 14,119 7,863 180,106
Edesur 2,213 9,489 11,932 11,963 4,886 - 40,483 Costanera 17,605 26,664 18,248 16,238 9,233 7,863 95,852
Chocon 5,107 10,213 10,213 18,238 - - 43,771 Hidroinvest - - - - - - -
CTM - - - - - - - Tesa - - - - - - -
Perú 84,690 56,322 25,091 32,617 46,472 104,221 349,413 Edelnor 30,138 16,626 4,791 10,353 14,346 51,259 127,514 Edegel 54,552 39,696 20,300 22,263 32,126 52,962 221,899
Brazil 74,954 84,735 132,818 171,557 169,717 101,534 735,315 Endesa Brasil - - - - - - -
Coelce 53,343 12,550 18,559 18,559 17,536 43,514 164,061 Ampla 15,523 65,871 57,586 95,994 95,873 31,191 362,038
Cachoeira - - - - - - - Cien 2,121 2,060 52,110 52,110 51,060 - 159,460
Fortaleza 3,967 4,254 4,563 4,894 5,249 26,830 49,756 Colombia 64,884 88,397 54,012 144,173 81,393 255,067 687,925
Codensa 50,268 12,014 54,012 48,058 8,103 154,145 326,600 Emgesa 14,615 76,383 - 96,116 73,290 100,921 361,325 Betania - - - - - - -
TOTAL 454,231 707,408 298,699 485,921 324,491 1,498,076 3,768,826 (*) Includes: CAM(**) Includes: Endesa Chile Internacional, Pangue, Pehuenche, San Isidro, Celta and Tunel El Melon.
DEBT MATURITY WITH THIRD PARTIES, THOUSAND US$ Table 8.1
TOTALThousand US$ 2008 2009 2010 2011 2012 BalanceChile 467,840 986,014 105,971 208,211 29,218 2,351,766 4,149,020
Enersis 4,231 354,237 4,237 4,481 4,739 1,066,593 1,438,518 Chilectra 68 - - - - - 68 Other (*) 13,070 673 392 - - - 14,135
Endesa Chile (**) 450,470 631,105 101,341 203,730 24,480 1,285,173 2,696,298 Argentina 56,944 105,929 92,284 106,095 32,256 17,965 411,474
Edesur 5,056 21,680 27,261 27,330 11,163 - 92,489 Costanera 40,222 60,916 41,690 37,098 21,094 17,965 218,985
Chocon 11,667 23,333 23,333 41,667 - - 100,000 Hidroinvest - - - - - - -
CTM - - - - - - - Tesa - - - - - - -
Peru 193,485 128,673 57,324 74,517 106,171 238,105 798,275 Edelnor 68,855 37,984 10,946 23,654 32,775 117,108 291,321 Edegel 124,630 90,690 46,378 50,863 73,396 120,997 506,954
Brazil 171,241 193,587 303,438 391,941 387,739 231,966 1,679,913 Endesa Brasil - - - - - - -
Coelce 121,869 28,672 42,401 42,401 40,062 99,412 374,816 Ampla 35,465 150,490 131,562 219,310 219,033 71,259 827,119
Cachoeira - - - - - - - Cien 4,845 4,706 119,051 119,051 116,652 - 364,304
Fortaleza 9,062 9,719 10,424 11,181 11,992 61,295 113,673 Colombia 148,235 201,953 123,397 329,381 185,951 582,729 1,571,647
Codensa 114,844 27,448 123,397 109,794 18,511 352,163 746,157 Emgesa 33,391 174,505 - 219,587 167,440 230,567 825,489 Betania - - - - - - -
TOTAL 1,037,743 1,616,157 682,414 1,110,145 741,337 3,422,532 8,610,328 (*) Includes: CAM(**) Includes: Endesa Chile Internacional, Pangue, Pehuenche, San Isidro, Celta and Tunel El Melon.

PRESS RELEASE First Quarter 2008 – Consolidated Cash Flow Analysis
Pg. 26
CONSOLIDATED CASH FLOW UNDER CHILEAN GAAP, MILLION CH$ Table 9 Million Ch$ 03M 07 03M 08 Var 07-08 Chg %CASH FLOWS PROVIDED BY OPERATING ACTIVITIESNet income (loss) for the year 58,526 69,748 11,222 19.2%Gain (losses) from sales of assets:Losses (gain) on sale of property, plant and equipment 16 (492) (508) N/ACharges (credits) to income which do not represent cash flows:Depreciation 116,856 101,031 (15,825) (13.5%)Amortization of intangibles 2,347 1,605 (742) (31.6%)Write-offs and accrued expenses 6,835 9,427 2,592 37.9%Equity in income of related companies (715) (4,202) (3,487) -Equity in losses of related companies 2,224 419 (1,805) (81.2%)Amortization of positive goodwill 15,127 15,062 (65) (0.4%)Amortization of negative goodwill (1,219) (1,009) 210 17.2%Price-level restatement, net 144 4,592 4,448 3,088.6%Exchange difference, net (200) 1,834 2,034 N/AOther credits to income which do not represent cash flows (10,694) (6,690) 4,004 37.4%Other charges to income which do not represent cash flows 41,407 84,835 43,428 104.9%Changes in assets which affect cash flows:Decrease (increase) in trade receivables (84,692) 44,256 128,948 N/ADecrease (increase) in inventory (11,551) (62,689) (51,138) 442.7%Decrease (increase) in other assets (42,283) (75,963) (33,680) (79.7%)Changes in liabilities which affect cash flow:Decreased (increase) in payable accounts associated with operating results 14,303 61,196 46,893 327.9%Decreased (increase) of payable interest (5,464) (19,463) (13,999) (256.2%)Decreased (increase) in income tax payable (43,455) 22,942 66,397 N/ADecreased (increase) in other accounts payable associated with non-operating results 60,591 10,189 (50,402) (83.2%)Decreased (increase) in value added tax and other similar taxes payable, net 9,127 (30,469) (39,596) N/AIncome (loss) attributable to minority interest 71,080 38,721 (32,359) (45.5%)NET CASH FLOW PROVIDED BY OPERATING ACTIVITIES 198,308 264,878 66,570 33.6%

PRESS RELEASE First Quarter 2008 – Consolidated Cash Flow Analysis
Pg. 27
Cont. Table 9 Million Ch$ 03M 07 03M 08 Var 07-08 Chg %CASH FLOWS FROM FINANCING ACTIVITIESProceeds from issuance of shares issued to minorities - - - -Proceeds from debt issuance 389,562 168,501 (221,061) (56.7%)Proceeds from bond issuance 114,484 19,426 (95,058) (83.0%)Proceeds from loans obtained from related companies - - - -Proceeds from other loans obtained from related companies - - - -Other sources of financing 253 - (253) -Capital paid - - - -Dividends paid (128,036) (39,830) 88,206 68.9%Payment of debt (281,772) (145,209) 136,563 48.5%Payment of bonds (21,244) (90,429) (69,185) 325.7%Payments of loans obtained from related companies - - - -Payments of other loans obtained from related companies - - - -Payments of shares issuance costs - - - -Payments of bonds issuance costs - - - -Other disbursements for financing (567) (463) 104 18.3%NET CASH FLOW FROM FINANCING ACTIVITIES 72,680 (88,005) (160,685) (221.1%)CASH FLOWS FROM INVESTING ACTIVITIESProceeds from sale of property, plant and equipment 536 307 (229) (42.8%)Sale of investment - 7,381 7,381 -Other loans received from related companies - - - -Other receipts from investments - 251 251 -Additions to property, plant and equipment (131,811) (146,292) (14,481) (11.0%)Long-term investments (34,564) - 34,564 100.0%Investment in financing instruments - - - -Other loans granted to related companies (4,479) (12,675) (8,196) 183.0%Other investment disbursements (86) (22,036) (21,950) 25,523.5%NET CASH FLOW FROM INVESTMENT ACTIVITIES (170,405) (173,064) (2,659) (1.6%)NET CASH FLOW FOR THE PERIOD 100,583 3,809 (96,774) 96.2%EFFECT OF PRICE-LEVEL RESTATEMENT ON CASH AND CASH EQUIVALENT 15,455 (34,228) (49,683) N/ANET VARIATION ON CASH AND CASH EQUIVALENT 116,038 (30,419) (146,457) N/ACASH AND CASH EQUIVALENT AT THE BEGINNING OF THE YEAR 476,689 581,134 104,445 21.9%CASH AND CASH EQUIVALENT AT THE END OF THE PERIOD 592,727 550,715 (42,012) (7.1%)

PRESS RELEASE First Quarter 2008 – Consolidated Cash Flow Analysis
Pg. 28
UNDER CHILEAN GAAP, THOUSAND US$ Table 9.1 Thousand US$ 03M 07 03M 08 Var 07-08 Chg %CASH FLOWS PROVIDED BY OPERATING ACTIVITIESNet income (loss) for the year 133,710 159,349 25,639 19.2%Gain (losses) from sales of assets:Losses (gain) on sale of property, plant and equipment 36 (1,123) (1,159) N/ACharges (credits) to income which do not represent cash flows:Depreciation 266,971 230,818 (36,153) (13.5%)Amortization of intangibles 5,362 3,667 (1,695) (31.6%)Write-offs and accrued expenses 15,615 21,537 5,922 37.9%Equity in income of related companies (1,634) (9,600) (7,966) -Equity in losses of related companies 5,081 958 (4,123) (81.2%)Amortization of positive goodwill 34,559 34,410 (149) (0.4%)Amortization of negative goodwill (2,785) (2,306) 479 17.2%Price-level restatement, net 329 10,490 10,161 3,088.6%Exchange difference, net (457) 4,190 4,647 N/AOther credits to income which do not represent cash flows (24,432) (15,285) 9,147 37.4%Other charges to income which do not represent cash flows 94,599 193,816 99,217 104.9%Changes in assets which affect cash flows:Decrease (increase) in trade receivables (193,489) 101,107 294,596 N/ADecrease (increase) in inventory (26,390) (143,221) (116,831) 442.7%Decrease (increase) in other assets (96,600) (173,546) (76,946) (79.7%)Changes in liabilities which affect cash flow:Decreased (increase) in payable accounts associated with operating results 32,677 139,811 107,134 327.9%Decreased (increase) of payable interest (12,483) (44,466) (31,983) (256.2%)Decreased (increase) in income tax payable (99,278) 52,413 151,691 N/ADecreased (increase) in other accounts payable associated with non-operating results 138,427 23,277 (115,150) (83.2%)Decreased (increase) in value added tax and other similar taxes payable, net 20,852 (69,610) (90,462) N/AIncome (loss) attributable to minority interest 162,391 88,464 (73,927) (45.5%)NET CASH FLOW PROVIDED BY OPERATING ACTIVITIES 453,062 605,149 152,087 33.6%

PRESS RELEASE First Quarter 2008 – Consolidated Cash Flow Analysis
Pg. 29
Cont. Table 9.1 Thousand US$ 03M 07 03M 08 Var 07-08 Chg %CASH FLOWS FROM FINANCING ACTIVITIESProceeds from issuance of shares issued to minorities - - - -Proceeds from debt issuance 890,000 384,959 (505,041) (56.7%)Proceeds from bond issuance 261,552 44,380 (217,172) (83.0%)Proceeds from loans obtained from related companies - - - -Proceeds from other loans obtained from related companies - - - -Other sources of financing 578 - (578) -Capital paid - - - -Dividends paid (292,513) (90,996) 201,517 68.9%Payment of debt (643,741) (331,747) 311,994 48.5%Payment of bonds (48,534) (206,595) (158,061) 325.7%Payments of loans obtained from related companies - - - -Payments of other loans obtained from related companies - - - -Payments of shares issuance costs - - - -Payments of bonds issuance costs - - - -Other disbursements for financing (1,295) (1,058) 237 18.3%NET CASH FLOW FROM FINANCING ACTIVITIES 166,046 (201,057) (367,103) (221.1%)CASH FLOWS FROM INVESTING ACTIVITIESProceeds from sale of property, plant and equipment 1,225 701 (524) (42.8%)Sale of investment - 16,862 16,862 -Other loans received from related companies - - - -Other receipts from investments - 574 574 -Additions to property, plant and equipment (301,138) (334,221) (33,083) (11.0%)Long-term investments (78,966) - 78,966 100.0%Investment in financing instruments - - - -Other loans granted to related companies (10,233) (28,957) (18,724) 183.0%Other investment disbursements (196) (50,344) (50,148) 25,523.5%NET CASH FLOW FROM INVESTMENT ACTIVITIES (389,308) (395,386) (6,078) (1.6%)NET CASH FLOW FOR THE PERIOD 229,794 8,703 (221,091) 96.2%EFFECT OF PRICE-LEVEL RESTATEMENT ON CASH AND CASH EQUIVALENT 35,309 (78,199) (113,508) N/ANET VARIATION ON CASH AND CASH EQUIVALENT 265,102 (69,496) (334,598) N/ACASH AND CASH EQUIVALENT AT THE BEGINNING OF THE YEAR 1,089,052 1,327,668 238,616 21.9%CASH AND CASH EQUIVALENT AT THE END OF THE PERIOD 1,354,155 1,258,172 (95,983) (7.1%)

PRESS RELEASE First Quarter 2008 – Consolidated Cash Flow Analysis
Pg. 30
CONSOLIDATED CASH FLOW ANALYSIS During the period, the company generated a positive cash flow of Ch$3,809 million, which is comprised by the following items: Table 10
Effective Cash Flow (million Ch$) 03M 07 03M 08 Var 07-08 Chg %Operating 198,308 264,878 66,570 33.6%Financing 72,680 (88,005) (160,685) 221.1%Investment (170,405) (173,064) (2,659) (1.6%)
Net cash flow of the period 100,583 3,809 (96,774) 96.2%
Table 10.1
Effective Cash Flow (thousand US$) 03M 07 03M 08 Var 07-08 Chg %Operating 453,058 605,144 152,086 33.6%Financing 166,046 (201,057) (367,103) 221.1%Investment (389,310) (395,386) (6,076) (1.6%)
Net cash flow of the period 229,793 8,701 (221,092) 96.2%
As of March 31, 2008, the company’s Operating activities generated a net positive cash flow of Ch$264,878 million, representing an increase of 33.6% with respect to the same period of last year. This cash flow is comprised mostly of: The year’s profit of Ch$69,748 million, plus:
Charges to results that do not represent a cash flow for Ch$218,805 million, mainly corresponding to the year’s depreciation for Ch$101,031 million, penalties & provisions for Ch$9,427 million, Amortization of Positive Goodwill for Ch$15,062 million, Amortization for Intangibles for Ch$1,605 million, loss of permanent investments for Ch$419 million, and other charges that do not represent cash flow for Ch$84,835 million, among which is the impact on account of negative conversions by the foreign subsidiaries –pursuant to Technical Bulletin N°64- amounting to Ch$82,537 million.
Variation of net liabilities that affect the operating cash flow for Ch$44,394 million. The foregoing was partially offset by:
Credits that do not represent cash flow for Ch$11,902 million and which correspond to other credits for Ch$6,690 million; of which, Ch$5,879 million correspond to the positive conversion effect of the foreign subsidiaries, profits from investments in related companies for Ch$4,202 million, and amortization of goodwill on investments for Ch$1,010 million.
Variation of net assets that affect the operating cash flow for Ch$94,397 million. Financing activities originated a net positive cash flow of Ch$88,005 million, mainly from payments of Ch$145,209 million, dividend payments of Ch$39,830 million, payment bond debt of Ch$90,429 million, and other disbursements amounting to Ch$463 million. The foregoing is partially offset by loans amounting to Ch$168,500 million and the placement of bonds amounting to Ch$19,426 million. Investment activities generated a net cash flow of Ch$173,064 million, which compared with the same period of last year, represents a reduction of 1.6% or Ch$2,659 million. These disbursements correspond mainly to the incorporation of fixed assets amounting to Ch$146,292 million, other loans to related companies of Ch$12,675 million, and other disbursements reaching Ch$22,036 million; the foregoing was partially offset by collections from the sale of permanent investments for Ch$7,381, collections from the sale of fixed assets for Ch$307 million, and other investment income for Ch$251 million.

PRESS RELEASE First Quarter 2008 – Consolidated Cash Flow Analysis
Pg. 31
CASH FLOW RECEIVED FROM FOREIGN SUBSIDIARIES BY ENERSIS, CHILECTRA AND ENDESA CHILE Table 11 Millions Ch$
03M 07 03M 08 03M 07 03M 08 03M 07 03M 08 03M 07 03M 08 03M 07 03M 08Argentina - 78 - - 343 206 - - - - Peru - - 1,281 - - - - - - - Brazil - - - 23,644 - - - - - - Colombia - - 20,487 9,423 - - - - - - Total - 78 21,768 33,067 343 206 - - - -
Millions Ch$03M 07 03M 08
Argentina 343 284Peru 1,281 - Brazil - 23,644Colombia 20,487 9,423Total 22,111 33,351
Interest Received Dividends Received Management Fee
Total Cash Received
Prepayment intercompany Capital Reductions
Table 11.1 Thousand US$
03M 07 03M 08 03M 07 03M 08 03M 07 03M 08 03M 07 03M 08 03M 07 03M 08Argentina - 178 - - 784 471 - - - - Peru - - 2,927 - - - - - - - Brazil - - - 54,017 - - - - - - Colombia - - 46,804 21,528 - - - - - - Total - 178 49,731 75,545 784 471 - - - -
Thousand US$03M 07 03M 08
Argentina 784 648Peru 2,927 - Brazil - 54,017Colombia 46,804 21,528Total 50,515 76,194
Total Cash Received
Interest Received Dividends Received Management Fee Capital ReductionsPrepayment Intercompany
Source: Internal Financial Report

PRESS RELEASE First Quarter 2008 – Consolidated Cash Flow Analysis
Pg. 32
CAPEX AND DEPRECIATION Table 12
Million Ch$ 03M 07 03M 08 03M 07 03M 08Endesa 59,117 61,329 51,862 47,560Cachoeira (*) 471 15 3,693 2,745Fortaleza (**) 77 273 1,383 961Cien (**) 23 296 3,604 2,698Chilectra S.A. 11,056 10,206 5,050 5,586Edesur S.A. 8,875 10,411 11,103 8,404Edelnor S.A. 5,283 4,912 4,750 3,219Ampla 16,069 23,645 11,072 10,064Coelce 22,178 25,527 10,978 8,863Codensa S.A. 6,473 6,710 11,776 9,310Cam Ltda. 920 734 417 454Inmobiliaria Manso de Velasco Ltda. 339 732 83 65Synapsis Soluciones y Servicios Ltda. 853 1,423 723 702Holding Enersis 77 79 362 400Total 131,811 146,292 116,856 101,031
Payments for Additions of Fixed assets Depreciation
Table 12.1
Thousand US$ 03M 07 03M 08 03M 07 03M 08Endesa 135,059 140,112 118,484 108,656Cachoeira (*) 1,076 35 8,436 6,271Fortaleza (*) 176 624 3,160 2,195Cien (*) 52 675 8,234 6,164Chilectra S.A. 25,258 23,318 11,537 12,763Edesur S.A. 20,276 23,786 25,365 19,199Edelnor S.A. 12,069 11,222 10,853 7,353Ampla 36,712 54,020 25,296 22,992Coelce 50,667 58,318 25,080 20,249Codensa S.A. 14,789 15,329 26,905 21,269Cam Ltda. 2,103 1,677 954 1,038Inmobiliaria Manso de Velasco Ltda. 774 1,673 190 149Synapsis Soluciones y Servicios Ltda. 1,949 3,251 1,651 1,604Holding Enersis 176 181 827 913Total 301,136 334,221 266,971 230,815
(*) Consolidated by Enersis through Endesa Brasil since October 1st, 2005.
DepreciationPayments for Additions of Fixed assets

PRESS RELEASE First Quarter 2008 – Risks Hedging
Pg. 33
ANALYSIS OF THE INTEREST AND THE EXCHANGE RATE RISK The company has a high percentage of its loans in US Dollars considering that an important part of its sales, in the different markets where it operates, are mainly indexed to that currency. However, the Brazilian, Argentine and Colombian markets are indexed to the US Dollar to a lower extent and, therefore, subsidiaries in those markets have most of their liabilities in local currency. In the case of Argentina, the company has chosen to replace dollar denominated debt with local currency debt, when market financial conditions allow it. In a high exchange rate risk scenario, the company has continued with its policy of partly covering its liabilities in dollars in order to minimize the effects of the fluctuations in the exchange rate upon results. Considering the important reduction in the accounting mismatch in recent years, the company has modified its policy on Dollar-Peso hedging in order to establish a policy of covering cash flows, together with a maximum permissible accounting mismatch, on which hedging operations will be performed. As of March 31, 2008, the company has hedged in Chile, through US$/UF Swap operations, an amount of US$ 600 million on a consolidated basis and holds US$ 125 million in forward contracts, allowing for an adequate management of the hedging policy. At the same period of last year, the Company had already engaged US$ 600 million of the total US$/UF swap and the US$ 125 million of US$/UF swap as part of the settlement of the new hedging policy already mentioned. Additionally, the company kept US$1 million short-term forward contracts. In terms of interest rate risk, the Company had, on a consolidated basis, a proportion of its indebtedness at a fixed / variable ratio of approximately 70.2% fixed / 29.8% variable as of March 31, 2008. The percentage of its indebtedness at a fixed rate has decreased compared with the 69.2% / 30.8% ratio as of the same date in 2007.

PRESS RELEASE First Quarter 2008 – Risks Hedging
Pg. 34
OTHER RISKS As is the usual practice in bank credits and capital market operations, a portion of Enersis financial debt –as well as that of its affiliate Endesa Chile- is subject to cross-default provisions (incumplimiento cruzado). Should certain defaults on the part of relevant subsidiaries not be resolved, they could result in cross-defaults at the level of Enersis and Endesa Chile, in which case, they may eventually call up certain liabilities in these companies. Nonpayment –following whatever grace period may be applicable- of debt of these companies or of any of its more relevant subsidiaries, for individual amounts over the equivalent of US$ 30 million, could enforce the payment acceleration provisions of syndicated credits subscribed in 2004. The credits subscribed by Endesa (in January and December 2006) and by Enersis (in December 2006) have a US$ 50 million threshold. Analogously, nonpayment –following whatever grace period may be applicable- of debt of these companies or of any of its more relevant subsidiaries, for individual amounts over the equivalent of US$ 30 million, could enforce the payment acceleration provisions of the Yankee Bonds. Additionally, certain credit contracts include provisions according to which certain events –other than nonpayment- on the part of these companies or any of its more relevant subsidiaries, such as bankruptcy, insolvency, adverse final judicial decisions for amounts over US$ 50 million, or asset expropriation could trigger the application of the acceleration provisions of these credits. These credits have no clauses by virtue of which eventual changes in the classification of these companies or of their debt by risk classification companies would generate the obligation to prepay such debt. Nevertheless, a change in the risk classification of foreign currency debt according to the risk classification agency, Standard & Poor’s (S&P), could cause a change in the margin applicable to determine the rate of interest on credits syndicated and subscribed between 2004 and 2006. As of March 2008, these obligations & restrictions have been met fully.

PRESS RELEASE First Quarter 2008 – Breakdown by country
Pg. 35
ARGENTINA GENERATION COSTANERA Operating Income, increased by Ch$2,575 million, reaching at a first-quarter result of Ch$6,815 million in March 2008, which represents an increase of 60.7%, in turn, resulting from 6.1% better revenues, while operating costs remained roughly similar to those of its homologous preceding quarter. A more efficient management in terms of production and commercial policy has enabled Costanera increase its operating income, considering that its physical sales expanded by 5.1% to 2,575 GWh as of March 2008. Table 13
03M 07 03M 08 03M 07 03M 08 Chg %Operating Revenues 100 106 43,835 46,497 6.1%Operating Costs (89) (89) (38,976) (39,088) (0.3%)Gross Profit 11 17 4,859 7,410 52.5%
Selling and Administrative Expenses (1) (1) (620) (595) 3.9%Operating Income 10 16 4,239 6,815 60.7%
Million US$ Million Ch$
Figures may differ from those accounted under Argentine GAAP.
Additional Information Table 14
Costanera 03M 07 03M 08 Var 07-08 Chg %GWh Produced 2,445 2,575 130 5.3%GWh Sold 2,450 2,575 126 5.1%Market Share 9.6% 9.7% - 1.3%
Costanera Financial Debt Maturity (with third party)US$ 219 million
4061
42 3721 18
-20406080
2008 2009 2010 2011 2012 Balance
US$ M
illio
n

PRESS RELEASE First Quarter 2008 – Breakdown by country
Pg. 36
CHOCÓN Operating Income, dropped by 51.2% to Ch$2,537 million during the first quarter of 2008, as a result of 26.5% lower physical sales as compared with the previous year, conditioned by the Limay River water management on the part of Argentina’s Energy Secretariat and the low hydrology of the area. The Chocon’s reservoirs went to the minimum level, ending the first quarter without energy available. Table 15
03M 07 03M 08 03M 07 03M 08 Chg %Operating Revenues 31 22 13,706 9,711 (29.2%)Operating Costs (19) (16) (8,265) (6,895) 16.6%Gross Profit 12 6 5,440 2,815 (48.3%)
Selling and Administrative Expenses (1) (1) (247) (279) (12.9%)Operating Income 12 6 5,194 2,537 (51.2%)
Million US$ Million Ch$
Figures may differ from those accounted under Argentine GAAP. Additional Information Table 16
Chocón 03M 07 03M 08 Var 07-08 Chg %GWh Produced 735 466 (269) (36.7%)GWh Sold 817 600 (217) (26.5%)Market Share 3.2% 2.3% - (29.2%)
Chocon Financial Debt Maturity (with third party)US$ 100 million
1223 23
42
- --
20
40
60
2008 2009 2010 2011 2012 Balance
US$
Millio
n

PRESS RELEASE First Quarter 2008 – Breakdown by country
Pg. 37
DISTRIBUTION EDESUR Operating Income increased by Ch$928 million during the first quarter of the year 2007 from Ch$ 5,919 million to Ch$6,847 million. The later is principally explained by better buy/sell margins during the period, which is associated to the increased demand, the greater number of clients, an increase of the capacity sold to large corporate clients. The increase in demand has been strongly boosted by the greater level of economic activity and the higher temperatures, all of which have contributed to an increase of physical sales by 2.4%, reaching 4,083 GWh during the first quarter of 2008. Energy losses increased by 0.1p.p. reaching 9.2% as of March 2008 and the number of clients grew by 35,000, reaching 2.2 million clients. Table 17
03M 07 03M 08 03M 07 03M 08 Chg %Revenues from Sales 181 142 79,028 62,110 (21.4%)Other Operating Revenues 13 13 5,734 5,659 (1.3%)
Operating Revenues 194 155 84,761 67,769 (20.0%)Energy Purchases (99) (75) (43,366) (32,724) 24.5%Other Operating Cost (57) (44) (25,141) (19,150) 23.8%
Operating Costs (157) (119) (68,508) (51,874) 24.3%Selling and Administrative Expenses (24) (21) (10,334) (9,048) 12.4%
Operating Income 14 16 5,919 6,847 15.7%
Million US$ Million Ch$
Figures may differ from those accounted under Argentine GAAP. Additional Information Table 18
Edesur 03M 07 03M 08 Var 07-08 Chg %Customers (Th) 2,202 2,237 35 1.6%GWh Sold 3,985 4,083 98 2.4%Clients/Employee 904 870 (34) (3.7%)Energy Losses % (3M) 9.1% 9.2% 0.1 0.8%
Edesur Financial Debt Maturity (with third party)US$ 92 million
5
2227 27
11-
-102030
2008 2009 2010 2011 2012 Balance
US$ M
illion

PRESS RELEASE First Quarter 2008 – Breakdown by country
Pg. 38
BRAZIL ENDESA BRASIL (*) Table 19
Chg %03M 07 03M 08 03M 07 03M 08
684 641 299,578 280,386 (6.4%)19 59 8,445 25,640 203.6%
704 699 308,023 306,026 (0.6%)(263) (305) (115,153) (133,398) (15.8%)(147) (124) (64,532) (54,457) 15.6%(411) (429) (179,685) (187,855) (4.5%)
(45) (46) (19,687) (20,343) (3.3%)Operating Income 248 224 108,651 97,828 (10.0%)
Million US$ Million Ch$
Energy PurchasesOther Operating Cost
Operating CostsSelling and Administrative Expenses
Revenues from Sales
Operating RevenuesOther Operating Revenues
Figures may differ from those accounted under Brazilian GAAP. (*) Consolidated by Enersis since October 1st 2005.
GENERATION CACHOEIRA DOURADA Operating Income, in the first quarter of the year 2008 reached Ch$43,808 million, which is significantly higher than the Ch$11,487 million obtained during the same period of the year 2007 which represents an increase of 281.4%. The latter is the consequence of the policy of reducing the sale contracts of energy and of the high prices that prevailed in the energy market during the first months of this year, which was partially offset by a 17.1% reduction in physical sales, to 877 GWh. Table 20
03M 07 03M 08 03M 07 03M 08 Chg %47 124 20,617 54,192 162.8%
(19) (22) (8,318) (9,801) (17.8%)28 101 12,299 44,391 260.9%(2) (1) (812) (583) 28.2%
Operating Income 26 100 11,487 43,808 281.4%
Million US$ Million Ch$
Operating RevenuesOperating Costs
Selling and Administrative ExpensesGross Profit
Figures may differ from those accounted under Brazilian GAAP. Additional Information Table 21
Cachoeira 03M 07 03M 08 Var 07-08 Chg %GWh Produced 981 705 (276) (28.1%)GWh Sold 1,057 877 (180) (17.1%)Market Share 1.2% 0.9% - (25.0%)
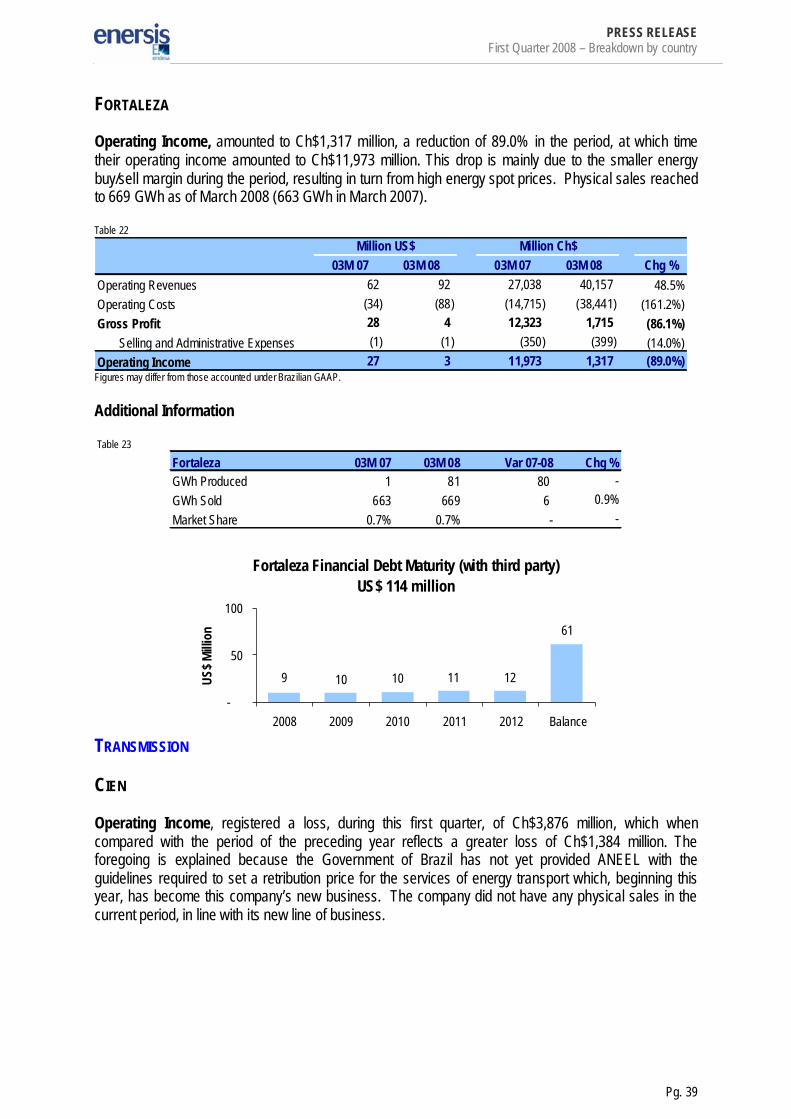
PRESS RELEASE First Quarter 2008 – Breakdown by country
Pg. 39
FORTALEZA Operating Income, amounted to Ch$1,317 million, a reduction of 89.0% in the period, at which time their operating income amounted to Ch$11,973 million. This drop is mainly due to the smaller energy buy/sell margin during the period, resulting in turn from high energy spot prices. Physical sales reached to 669 GWh as of March 2008 (663 GWh in March 2007). Table 22
03M 07 03M 08 03M 07 03M 08 Chg %62 92 27,038 40,157 48.5%
(34) (88) (14,715) (38,441) (161.2%)28 4 12,323 1,715 (86.1%)(1) (1) (350) (399) (14.0%)
Operating Income 27 3 11,973 1,317 (89.0%)
Operating Costs
Selling and Administrative ExpensesGross Profit
Operating Revenues
Million US$ Million Ch$
Figures may differ from those accounted under Brazilian GAAP. Additional Information Table 23
Fortaleza 03M 07 03M 08 Var 07-08 Chg %GWh Produced 1 81 80 -GWh Sold 663 669 6 0.9%Market Share 0.7% 0.7% - -
Fortaleza Financial Debt Maturity (with third party)US$ 114 million
10 10 11 12
61
9
-
50
100
2008 2009 2010 2011 2012 Balance
US$ M
illion
TRANSMISSION CIEN Operating Income, registered a loss, during this first quarter, of Ch$3,876 million, which when compared with the period of the preceding year reflects a greater loss of Ch$1,384 million. The foregoing is explained because the Government of Brazil has not yet provided ANEEL with the guidelines required to set a retribution price for the services of energy transport which, beginning this year, has become this company’s new business. The company did not have any physical sales in the current period, in line with its new line of business.

PRESS RELEASE First Quarter 2008 – Breakdown by country
Pg. 40
Table 24
03M 07 03M 08 03M 07 03M 08 Chg %65 4 28,331 1,535 (94.6%)
(67) (10) (29,354) (4,469) (115.2%)(2) (7) (1,022) (2,934) (187.0%)(3) (2) (1,469) (942) 35.9%
Operating Income (6) (9) (2,492) (3,876) (55.5%)
Operating Costs
Selling and Administrative ExpensesGross Profit
Operating Revenues
Million US$ Million Ch$
Figures may differ from those accounted under Brazilian GAAP.
Cien Financial Debt Maturity (with third party)US$ 364 million
5
119 119 117
-5-
50
100
2008 2009 2010 2011 2012 Balance
US$
Millio
n
DISTRIBUTION AMPLA Operating Income, accounted Ch$39,823 million, which, when compared with the same date of the preceding year, represents a drop of 21.9% or the equivalent to Ch$11,184 million. Such lower result is owed mainly to lower energy buy/sell margins, which dropped mainly because of the increase of average energy buying prices. Physical sales increased by 1.1% to 2,394 GWh during the present period. Energy losses diminished by 1.8 p.p, down to a level of 21.0% (22.8% in the year 2007). The number of Ampla clients increased by 63,000, reaching 2.4 million clients. Table 26
03M 07 03M 08 03M 07 03M 08 Chg %Revenues from Sales 365 338 159,826 147,751 (7.6%)Other Operating Revenues 7 10 3,176 4,248 33.7%
Operating Revenues 372 347 163,002 151,998 (6.8%)Energy Purchases (178) (164) (78,065) (71,649) 8.2%Other Operating Cost (63) (78) (27,730) (33,959) (22.5%)
Operating Costs (242) (241) (105,795) (105,608) 0.2%Selling and Administrative Expenses (14) (15) (6,200) (6,567) (5.9%)
Operating Income 117 91 51,007 39,823 (21.9%)
Million Ch$Million US$
Figures may differ from those accounted under Brazilan GAAP. Additional Information Table 27
Ampla 03M 07 03M 08 Var 07-08 Chg %Customers (Th) 2,342 2,405 64 2.7%GWh Sold 2,367 2,394 27 1.1%Clients/Employee 1,682 1,755 73 4.3%Energy Losses % (3M) 22.8% 21.0% (1.8) (8.2%)

PRESS RELEASE First Quarter 2008 – Breakdown by country
Pg. 41
Ampla Financial Debt Maturity (with third party)US$ 827 million
35
150 132219 219
71
-100200300
2008 2009 2010 2011 2012 Balance
US$ M
illion
COELCE Operating Income, dropped by Ch$19,230 million, reaching Ch$18.679 million during the first quarter of the year 2008. Such drop in the operating income is principally attributable to a reduction of this year’s buy/sell margin, as a result of the downturn of tariff prices occurred in April of 2007 and the greater purchase price of energy. The foregoing was partially offset by a 5.0% increase in physical sales to 1,803 GWh during the first quarter of the year 2008. Energy losses dropped by 1.1 p.p, to a level of 11.4% in the current period. The number of clients reached 2.72 million, all of which represents a growth of 154,000 clients when compared to the same date of the year 2007, i.e. a 6.0% increase. Table 28
03M 07 03M 08 03M 07 03M 08 Chg %Revenues from Sales 272 237 119,254 103,578 (13.1%)Other Operating Revenues 7 12 3,199 5,076 58.7%
Operating Revenues 280 248 122,454 108,654 (11.3%)Energy Purchases (117) (130) (51,169) (57,043) (11.5%)Other Operating Cost (52) (53) (22,969) (23,003) (0.1%)
Operating Costs (169) (183) (74,138) (80,046) (8.0%)Selling and Administrative Expenses (24) (23) (10,407) (9,929) 4.6%
Operating Income 87 43 37,909 18,679 (50.7%)
Million Ch$Million US$
Figures may differ from those accounted under Brazilian GAAP.
Additional Information Table 29
Coelce 03M 07 03M 08 Var 07-08 Chg %Customers (Th) 2,571 2,725 155 6.0%GWh Sold 1,717 1,803 86 5.0%Clients/Employee 2,034 2,159 125 6.2%Energy Losses % (3M) 12.5% 11.4% (1.1) (9.4%)
Coelce Financial Debt Maturity (with third party)US$ 375 million
122
29 42 42 40
99
-50
100150
2008 2009 2010 2011 2012 Balance
US$ M
illion

PRESS RELEASE First Quarter 2008 – Breakdown by country
Pg. 42
CHILE GENERATION ENDESA CHILE
Consolidated Income Statement of Endesa Chile Table 30
03M 07 03M 08 03M 07 03M 08 Chg %Operating Revenues 974 1,098 426,372 480,560 12.7%Operating Costs (528) (724) (231,065) (317,050) (37.2%)
Selling and Administrative Expenses (25) (19) (10,910) (8,464) 22.4%Operating Income 421 354 184,397 155,046 (15.9%)
Interest Income 11 10 4,631 4,544 (1.9%)Interest Expenses (111) (90) (48,691) (39,434) 19.0%
Net Financial Income (Expenses) (101) (80) (44,059) (34,890) 20.8%Equity Gains from Related Company 19 56 8,117 24,430 201.0%Equity Losses from Related Company (5) (1) (2,190) (276) 87.4%
Net Income from Related Companies 14 55 5,926 24,154 307.6%Other Non Operating Income 20 23 8,725 10,009 14.7%Other Non Operating Expenses (98) (144) (42,915) (62,923) (46.6%)
Net other Non Operating Income (Expenses) (78) (121) (34,189) (52,914) (54.8%)Price Level Restatement 0 (2) 18 (708) (4096.2%)Foreign Exchange Effect (1) 27 (633) 11,804 (1963.5%)
Net of Monetary Exposure (1) 25 (616) 11,097 (1902.2%)Positive Goodwill Amortization (1) (1) (240) (255) (6.3%)Non Operating Income (167) (121) (73,178) (52,809) 27.8%Net Income b. Taxes, Min Int and Neg Goodwill Amort. 254 234 111,220 102,236 (8.1%)Extraordinary Items - - - - -Income Tax (99) (84) (43,157) (36,667) 15.0%Minority Interest (36) 25 (15,541) 11,080 171.3%Negative Goodwill Amortization 3 2 1,208 1,000 (17.2%)NET INCOME 123 177 53,730 77,649 44.5%
Million US$ Million Ch$
*Includes generation subsidiaries in Chile, Argentina, Colombia and Peru. Chilean Operations
Operating Income, reached Ch$88,266 million, 19.5% less that the Ch$109,584 million accounted at the end of the first quarter of 2007, even though operating revenue amounted to Ch$297,355 million, which, when compared with Ch$226,752 million in the same period of the previous year, represented an increase of 31.1%. This price hike, resulting from the first quarter in which the node price of over US$100 per MWh with high energy spot prices, was amply compensated by a greater operating cost which increased by 79%, amounting to Ch$205,145 million; noteworthy among which are Ch$102,348 million from higher fuel & lubricant costs on account of greater thermal generation with petroleum at high prices derived –among other reasons- from a low hydrology. It is worth mention that this commercial policy has enabled Endesa Chile been a net seller in the spot market, even when its production as accounted at the March 2008 closing meant a 6.9% drop in generation. Physical sales during the first quarter of the year totaled 4,755 GWh.

PRESS RELEASE First Quarter 2008 – Breakdown by country
Pg. 43
Additional Information
Table 31
Chilean Companies 03M 07 03M 08 Var 07-08 Chg %GWh Produced 5,191 4,830 (360) (6.9%)GWh Sold 5,226 4,755 (472) (9.0%)Market Share 39.9% 36.0% - (9.8%)
Endesa-Chile Parent Company Financial Debt Maturity (with third party)US$ 2,696 million
450 631
101 204 24
1,285
-500
1,0001,500
2008 2009 2010 2011 2012 Balance
US$ M
illion
s

PRESS RELEASE First Quarter 2008 – Breakdown by country
Pg. 44
DISTRIBUTION CHILECTRA Operating Income, accounted Ch$27,428 million during the period, which represents a drop of Ch$6,336 million with respect to the same period of last year equivalent to 18.8%. This is due to the increase in energy purchases considering higher prices paid out to generators and greater physical energy purchases in order to satisfy the demand of our clients. The Ch$58,706 million in greater operating revenues were not enough to offset the greater operating costs of Ch$65,755 million. During the period, physical sales amounted to 3,171 GWh, with a slight 0.4% increase when compared to the same period of 2007, impacted by the energy savings plan launched by the Government of Chile. The foregoing was partially offset by lower sales & administration expenses of Ch$714 million or 6%, mainly explained by a reduction of Ch$820 million in operating & maintenance costs. Table 32
03M 07 03M 08 03M 07 03M 08 Chg %Revenues from Sales 412 541 180,366 236,598 31.2%Other Operating Revenues 33 39 14,583 17,058 17.0%
Operating Revenues 445 580 194,950 253,656 30.1%Energy Purchases (304) (451) (132,845) (197,450) (48.6%)Other Operating Cost (39) (42) (17,069) (18,220) (6.7%)
Operating Costs (342) (493) (149,914) (215,670) (43.9%)Selling and Administrative Expenses (26) (24) (11,272) (10,558) 6.3%
Operating Income 77 63 33,764 27,428 (18.8%)Interest Income 4 6 1,847 2,814 52.3%Interest Expenses (16) (11) (7,171) (4,684) 34.7%
Net Financial Income (Expenses) (12) (4) (5,324) (1,870) 64.9%Equity Gains from Related Company 27 26 11,981 11,361 (5.2%)Equity Losses from Related Company - (3) - (1,521) -
Net Income from Related Companies 27 22 11,981 9,839 (17.9%)Other Non Operating Income 5 6 2,251 2,762 22.7%Other Non Operating Expenses (1) (6) (240) (2,800) 1066.8%Conversion Effect (BT 64) - - - -
Net other Non Operating Income (Expenses) 5 (0) 2,011 (39) (101.9%)Price Level Restatement (1) (3) (272) (1,436) 427.9%Foreign Exchange Effect (2) 18 (726) 8,091 (1214.9%)
Net of Monetary Exposure (2) 15 (998) 6,655 (767.0%)Positive Goodwill Amortization (0) (0) (162) (135) 16.5%Non Operating Income 17 33 7,509 14,451 92.4%Net Income b. Taxes, Min Int and Neg Goodwill Amort. 94 96 41,273 41,878 1.5%Extraordinary Items - - - - Income Tax (16) 1 (6,988) 542 107.8%Minority Interest (0) (5) (139) (1,971) 1316.8%Negative Goodwill Amortization - - - - NET INCOME 78 92 34,146 40,450 18.5%
Million Ch$Million US$
Additional Information
Table 33
Chilectra 03M 07 03M 08 Var 07-08 Chg %Customers (Th) 1,445 1,492 48 3.3%GWh Sold 3,157 3,171 15 0.4%Clients/Employee 2,032 2,047 15 0.8%Energy Losses % (3M) 5.1% 5.5% 0.4 9.2%

PRESS RELEASE First Quarter 2008 – Breakdown by country
Pg. 45
COLOMBIA GENERATION On September, 2007 Colombian generation companies Emgesa and Betania completed the merger process, and the resulting company was named Emgesa. EMGESA Operating Income, totaled Ch$42,539 million at the closing of the first quarter of 2008, which is Ch$1,542 million higher than the operating income obtained during the same period in 2007. The greater result is explained, principally, by growth in energy sales margin, resulting from higher spot prices that prevailed in the market, higher revenues due to reliability charges and lower thermal generation costs, and the good hydrology during the period. Physical sales increased by 9.1%, amounting to 3,760 GWh as of March 2008. Table 36
03M 07 03M 08 03M 07 03M 08 Chg %Operating Revenues 196 184 85,929 80,487 (6.3%)Operating Costs (99) (84) (43,526) (36,781) 15.5%Operating Margin 97 100 42,403 43,707 3.1%
Selling and Administrative Expenses (3) (3) (1,405) (1,167) 16.9%Operating Income 94 97 40,997 42,539 3.8%Since September 1, 2007, Betania is merged with Emgesa.
Million US$ Million Ch$
* Please notice that these figures could differ from those accounted under Colombian GAAP.
Additional Information Table 37
Emgesa 03M 07 03M 08 Var 07-08 Chg %GWh Produced 2,745 2,882 137 5.0%GWh Sold 3,448 3,760 312 9.1%Market Share 19.9% 21.2% - 6.6%
Emgesa Financial Debt Maturity (with third party)US$ 825 million
33
175
-
220167
231
-
100
200
300
2008 2009 2010 2011 2012 Balance
US$
Millio
n

PRESS RELEASE First Quarter 2008 – Breakdown by country
Pg. 46
DISTRIBUTION CODENSA Operating Income, totaled Ch$40,050 million during the first quarter of the year 2008, which represents a growth of Ch$ 2,761 million or 7.4% with respect to the same period of last year. This increment is mostly owed to the increased energy demand which increased physical sales by 4.9% reaching 2,884 GWh and a 1.6pp reduction in energy losses, which went from 9.2% during the first quarter of the year 2007 to 7.6% in the current period, added to the period’s better buy/sell margin. Clients increased by 73,000, reaching 2.2 million as of March 2008. Table 38
03M 07 03M 08 03M 07 03M 08 Chg %Revenues from Sales 225 223 98,687 97,580 (1.1%)Other Operating Revenues 83 83 36,332 36,242 (0.2%)
Operating Revenues 308 306 135,019 133,822 (0.9%)Energy Purchases (142) (138) (62,163) (60,454) 2.7%Other Operating Cost (72) (66) (31,519) (28,956) 8.1%
Operating Costs (214) (204) (93,682) (89,410) 4.6%Selling and Administrative Expenses (9) (10) (4,048) (4,362) (7.8%)
Operating Income 85 91 37,289 40,050 7.4%
Million Ch$Million US$
* Please noticethat these figures could differ from those accounted under Colombian GAAP.
Additional Information Table 39
Codensa 03M 07 03M 08 Var 07-08 Chg %Customers (Th) 2,157 2,230 73 3.4%GWh Sold 2,750 2,884 133 4.9%Clients/Employee 2,302 2,370 68 2.9%Energy Losses % (3M) 9.2% 7.6% (1.6) (17.6%)
Codensa Financial Debt Maturity (with third party)US$ 746 million
11527
123 11019
352
-
350
2008 2009 2010 2011 2012 Balance
US$ M
illion

PRESS RELEASE First Quarter 2008 – Breakdown by country
Pg. 47
PERU GENERATION EDEGEL Operating Income, accounted Ch$13,171 million, which represents a 42.0% drop with respect to the Ch$22,694 million of the first quarter of 2007. Generation increased by 3.6%, reaching 2,074 GWh. However, operating revenue decreased 20.5%, from Ch$48,226 million to Ch$38,323 million. Operating costs increased by 2.6% to Ch$22,976 million. The decrease in revenues is largely attributable to a 38% drop in average spot prices. Increase costs are mostly attributable to a 15.4% increase in thermal generation, compared to the first quarter of 2007. Table 40
03M 07 03M 08 03M 07 03M 08 Chg %Operating Revenues 110 88 48,226 38,323 (20.5%)Operating Costs (51) (52) (22,399) (22,976) (2.6%)Operating Margin 59 35 25,828 15,347 (40.6%)
Selling and Administrative Expenses (7) (5) (3,134) (2,176) 30.6%Operating Income 52 30 22,694 13,171 (42.0%)
Million US$ Million Ch$
* Please noticethat these figures could differ from those accounted under Peruvian GAAP.
Additional Information
Table 41
Edegel 03M 07 03M 08 Var 07-08 Chg %GWh Produced 2,002 2,074 72 3.6%GWh Sold 1,951 2,063 112 5.7%Market Share 32.9% 31.7% - (3.8%)
Edegel Financial Debt Maturity (with third party)US$ 507 million
12591
46 5173
121
-
50
100
150
2008 2009 2010 2011 2012 Balance
US$ M
illion

PRESS RELEASE First Quarter 2008 – Breakdown by country
Pg. 48
DISTRIBUTION EDELNOR Operating Income registered Ch$12,758 million, higher by Ch$112 million to the result obtained during the same period of the previous year, reaching Ch$12,646 million. This is mostly due to the greater energy demand and the better unit margin sales conditions. The increment in demand and greater sales to half-tension Regulated Clients contribute to a better sales margin. The important increase in demand for energy made physical sales sore by 8.0% amounting to 1,396 GWh during the period. The number of clients increased by 34,000 reaching 995,000 as of March 2008. Energy losses increased by 0.1 p.p to a level of 8.5% in the current period as compared to last year’s 8.4% in the same period.
Operating Income Table 42
03M 07 03M 08 03M 07 03M 08 Chg %Revenues from Sales 132 114 57,677 50,037 (13.2%)Other Operating Revenues 7 7 3,056 3,081 0.8%
Operating Revenues 139 121 60,734 53,118 (12.5%)Energy Purchases (80) (67) (34,905) (29,361) 15.9%Other Operating Cost (18) (15) (7,879) (6,483) 17.7%
Operating Costs (98) (82) (42,785) (35,844) 16.2%Selling and Administrative Expenses (12) (10) (5,303) (4,516) 14.8%
Operating Income 29 29 12,646 12,758 0.9%
Million Ch$Million US$
* Please noticethat these figures could differ from those accounted under Peruvian GAAP.
Additional Information
Table 43
Edelnor 03M 07 03M 08 Var 07-08 Chg %Customers (Th) 961 995 33 3.5%GWh Sold 1,292 1,396 105 8.1%Clients/Employee 1,773 1,780 6 0.4%Energy Losses % (3M) 8.4% 8.5% 0.1 2.1%
Edelnor Financial Debt Maturity (with third party)US$ 291 million
6938
11 24 33
117
-
50
100
2008 2009 2010 2011 2012 Balance
US$ M
illion

PRESS RELEASE First Quarter 2008 – Breakdown by country
Pg. 49
PARTIALLY CONSOLIDATED INCOME STATEMENT (Parent Company First Quarter 2008 Earnings Report)
UNDER CHILEAN GAAP, MILLION CH$ Table 44
(in million Ch$ of 3M08) 3M 07 3M 08 Var %Gross Operating Margin 907 868 (4.4%)S&A Expenses (4,363) (4,214) 3.4%Operating Income (3,456) (3,347) 3.2%Endesa 32,228 46,575 44.5%Chilectra 21,958 30,334 38.2%Edesur 10,175 1,961 (80.7%)Edelnor 2,691 (2,706) (200.5%)Ampla 2,898 7,207 148.7%Coelce - - N/ACodensa 2,818 62 (97.8%)CAM LTDA 342 125 (63.4%)Inm Manso de Velasco 628 632 0.7%Synapsis 231 1,338 477.8%Endesa Brasil 5,607 15,470 175.9%CGTF - - N/AOther - - N/ANet Income from Related Companies 79,576 100,998 26.9%Interest Income 11,197 7,602 (32.1%)Interest Expense (14,800) (13,189) 10.9%Net Financial Income (Expenses) (3,604) (5,587) (55.1%)Other Non Operating Income 1,910 3,904 104.4%Other Non Operating Expenses (319) (81) 74.5%Net other Non Operating Income (Expenses) 1,592 3,823 140.2%Price Level Restatement (188) (1,553) (724.7%)Foreign Exchange Effect 1,474 (21,841) (1581.7%)Net Monetary Exposure 1,286 (23,394) (1919.5%)Positive Goodwill Amortization (14,723) (14,670) 0.4%Non Operating Income 64,126 61,169 (4.6%)Net Income before (1), (2) & (3) 60,671 57,823 (4.7%)Income Tax (1) (2,155) 11,915 (652.9%)Negative Goodwill Amortization (2) 11 9 (14.6%)Minority Interest (3) - - N/ANET INCOME 58,526 69,748 19.2%EPS (Ch$) 1.79 2.14 EPADS (US$) 0.20 0.24 Common Shares Outstanding (Th) 32,651,166 32,651,166

PRESS RELEASE First Quarter 2008 – Breakdown by country
Pg. 50
UNDER CHILEAN GAAP, THOUSAND US$
Table 44.1 (in thousand US$ of 3M08) 3M 07 3M 08 Var %
Gross Operating Margin 2,073 1,983 (4.4%)S&A Expenses (9,968) (9,628) 3.4%Operating Income (7,895) (7,646) 3.2%Endesa 73,629 106,405 44.5%Chilectra 50,165 69,303 38.2%Edesur 23,245 4,480 (80.7%)Edelnor 6,149 (6,182) (200.5%)Ampla 6,621 16,465 148.7%Coelce - - N/ACodensa 6,437 142 (97.8%)CAM LTDA 781 286 (63.4%)Inm Manso de Velasco 1,435 1,444 0.7%Synapsis 529 3,056 477.8%Endesa Brasil 12,809 35,342 175.9%CGTF - - N/AOthers - - N/ANet Income from Related Companies 181,800 230,742 26.9%Interest Income 25,581 17,367 (32.1%)Interest Expense (33,813) (30,132) 10.9%Net Financial Income (Expenses) (8,233) (12,765) (55.1%)Other Non Operating Income 4,364 8,919 104.4%Other Non Operating Expenses (728) (185) 74.5%Net other Non Operating Income (Expenses) 3,636 8,733 140.2%Price Level Restatement (430) (3,548) (724.7%)Foreign Exchange Effect 3,368 (49,898) (1581.7%)Net Monetary Exposure 2,937 (53,447) (1919.5%)Positive Goodwill Amortization (33,637) (33,515) 0.4%Non Operating Income 146,504 139,749 (4.6%)Net Income before (1), (2) & (3) 138,609 132,103 (4.7%)Income Tax (1) (4,924) 27,222 (652.9%)Negative Goodwill Amortization (2) 25 21 (14.6%)Minority Interest (3) - - N/ANET INCOME 133,710 159,349 19.2%EPS (Ch$) 1.79 2.14 EPADS (US$) 0.20 0.24 Common Shares Outstanding (Th) 32,651,166 32,651,166

PRESS RELEASE First Quarter 2008 – Breakdown by country
Pg. 51
OWNERSHIP OF THE COMPANY AS OF MARCH 31, 2008
TOTAL SHAREHOLDERS: 8,417
Foreign Inv. Funds2%
Stockbrokers, M. Funds & Ins. Co's
8%
Retail3%
Endesa Spain61%
Chilean Pension Funds17%
ADS9%
CONFERENCE CALL INVITATION Enersis is pleased to inform you that it will hold a conference call to review its results for the period, on Monday, April 28, 2008, at 12:00 AM EST (Eastern Standard Time) (12:00 pm Chilean time). To participate, please dial +1 (617) 213-4866 or +1 (888) 713-4214 (toll free USA), approximately 10 minutes prior to the scheduled start time, Passcode ID: 23968574. The phone replay will be available between April 28, 2008, and May 05, 2008, dialing +1 (617) 801-6888 or +1 (888) 286-8010 (toll free USA) Passcode ID: 86353109. To access the call online, or to access the replay, go to: http://www.enersis.com Investor Relations.

PRESS RELEASE First Quarter 2008 – Contact Information
Pg. 52
CONTACT INFORMATION For further information, please contact us:
Susana Rey
Head of Investor Relations [email protected] 56 (2) 353 4554
Ignacio González Investor Relations
Representative [email protected] 56 (2) 353 4552
Denisse Labarca Investor Relations
Representative [email protected] 56 (2) 353 4492
Doris Saba Investor Relations
Representative [email protected] 56 (2) 353 4555
Carmen Poblete Investor Relations
Representative [email protected] 56 (2) 353 4447
María Luz Muñoz Investor Relations
Assistant [email protected]
56 (2) 353 4682 DISCLAIMER This Press Release contains statements that could constitute forward-looking statements within the meaning of the Private Securit ies Litigation Reform Act of 1995. These statements appear in a number of places in this announcement and include statements regarding the intent, belief or current expectations of Enersis and its management with respect to, among other things: (1) Enersis’ business plans; (2) Enersis’ cost-reduction plans; (3) trends affecting Enersis’ financial condition or results of operations, including market trends in the electricity sector in Chile or elsewhere; (4) supervision and regulation of the electricity sector in Chile or elsewhere; and (5) the future effect of any changes in the laws and regulations applicable to Enersis’ or its subsidiarys. Such forward-looking statements are not guarantees of future performance and involve risks and uncertaint ies. Actual results may differ materially from those in the forward-looking statements as a result of various factors. These factors include a decline in the equity capital markets of the United States or Chile, an increase in the market rates of interest in the United States or elsewhere, adverse decisions by government regulators in Chile or elsewhere and other factors described in Enersis’ Annual Report on Form 20-F. Readers are cautioned not to place undue reliance on those forward-looking statements, which state only as of their dates. Enersis undertakes no obligation to release publicly the result of any revisions to these forward-looking statements.