Energy use and CO2-emissions for consumed products and ... · PDF fileprivate and public...
52
Energy use and CO2-emissions for consumed products and services. IPP-indicators for private and public consumption based on environmental accounts by: Annica Carlsson, Viveka Palm and Anders Wadeskog Environmental Accounts, Statistics Sweden, 2006.
-
Upload
nguyendang -
Category
Documents
-
view
218 -
download
4
Transcript of Energy use and CO2-emissions for consumed products and ... · PDF fileprivate and public...
Energy use and CO2-emissions for consumed products and services. IPP-indicators for private and public consumption based on environmental accounts by: Annica Carlsson, Viveka Palm and Anders Wadeskog Environmental Accounts, Statistics Sweden, 2006.


Preface This report has been prepared on commission from EUROSTAT, which supports and co-ordinates the development of environmental statistics in the EU Member States. The European Commission through DG Environment has contributed financially to the project. Viveka Palm Anders Wadeskog and Annica Carlsson have carried out in the work and are responsible for the report. In 1993, Statistics Sweden, the National Institute of Economic Research and the Swedish Environmental Protection Agency were instructed by the Government to prepare a study covering the physical links between the economy, the environment and natural resources, the monetary reflection of these relations, and the state of the environment. The aim of the work on environmental accounts at Statistics Sweden is to develop a system of physical accounts that are linked to the production and consumption activities described in the national accounts. In practice this means developing a system of environmental and natural resource statistics that can be linked to the industry, product and sector categories used in the national accounts, thus forming a satellite system of accounts around the national accounts. According to the UN, a system of environmental accounts should in principle cover:
• Flows of materials through the economy, e.g. energy and chemicals, together with the emissions and waste to which these flows give rise. Within the EU, many countries have opted to use the NAMEA system1 to describe these flows.
• Economic variables that are already included in the national accounts but are of obvious environmental interest, such as investments and expenditure in the area of environmental protection, environment-related taxes and subsidies, and environmental classification of activities and the employment associated with them.
• Natural resources. Environmental accounts should make it possible to describe stocks and changes in stocks of selected finite or renewable resources. They should deal both with questions related to the monetary valuation of this natural capital and qualitative aspects that do not have any market or other defined monetary value, e.g. the value of outdoor life and biodiversity. Statistics Sweden, February 2006
1 NAMEA stands for National Accounting Matrix including Environmental Accounts. In principle this is a Social Accounting Matrix (SAM) supplemented by environmental accounts data on, e.g., emissions to air and waste, linked to the Use and Supply Matrices that a SAM is constructed around. Just as a SAM is a way of presenting national accounts data, NAMEA is a way of presenting environmental accounts data.


Table of contents 1. Introduction............................................................................................................................6
1.1 Integrated product policy (IPP)........................................................................................6 1.2 IPP in Sweden ..................................................................................................................7 1.3 Environmental accounts...................................................................................................8
2. Objectives..............................................................................................................................10 3. Method ..................................................................................................................................12
3.1 Input-Output Analysis....................................................................................................12 3.2 Calculations of emissions ..............................................................................................13 3.3 Household use ................................................................................................................16 3.4 Fossil fuels, biomass and electricity use ........................................................................16 3.5 Emissions to air, Swedish data.......................................................................................17 3.6 International emissions and energy data ........................................................................17
4. Assessment of data quality ..................................................................................................18 4.1 Introduction....................................................................................................................18 4.2 Trade in goods................................................................................................................19 4.3 Trade in services ............................................................................................................20 4.4 Business statistics...........................................................................................................20 4.5 Product statistics ............................................................................................................21 4.6 Energy statistics .............................................................................................................22 4.7 Air emissions statistics...................................................................................................22
5. Results ...................................................................................................................................24 5.1 Inventory of European data............................................................................................24 5.2 IPP-indicators by product groups...................................................................................25 5.3 IPP-indicators for private consumption by purpose.......................................................28 5.4 Time series .....................................................................................................................31
6. Discussion..............................................................................................................................34 7. Conclusions ...........................................................................................................................36 8. References .............................................................................................................................37 Appendix
Included figures and tables: Figure 1. Outline of Model 1 (ideal) to calculate emissions caused in other countries due to
Swedish consumption. Figure 2. Outline Model 2, use of domestic IO-tables and emissions coefficients as a basis for
calculating emissions in other countries due to Swedish consumption. Figure 3. The indirect and direct carbon emissions from public consumption from 1993-2002. Figure 4. The indirect and direct carbon emissions from private consumption from 1993-2002. Figure 5. The carbon emissions from producing food from 1993-2002.
Table 1. Quality Issues in the European Statistical System Table 2. Air emission data for EU25, 2000. Table 3. Carbon dioxide emissions from Swedish private and public consumption by NACE,
2002 (tonnes). Table 4. Energy use, for private and public consumption, 2002 [TJ]. Table 5. Carbon dioxide emissions (tonnes) by purpose, Swedish private consumption 2002. Table 6. The fuel, electricity and distance heating use for private consumption, 2002.


Summary Time series from 1993-2002 for Sweden of data relevant for making IPP-indicators is available at the web-site of the Environmental Accounts, Statistics Sweden, and also described and analysed in this report. The data is energy use and carbon dioxide emissions linked to the private and public consumption of Sweden and disaggregated on a product group level, both classifications of NACE and COICOP are used. All calculations of the suggested IPP-indicators are based on the Swedish environmental and national accounts, e.g. input-output (IO) matrices and emissions by industry. The environmental pressure from private and public consumption is calculated as the environmental pressure in the Swedish production system including the imports, plus impacts from the user phase. Emissions caused in other countries due to Swedish consumption, are however calculated as they were domestic, i.e. imported products are handled as they were domestically produced. This since data on energy use and time series of air emission data in the framework of environmental accounts were not possible to collect for EU25, or EU15, within the frames of the project. The results show that the total emission of carbon dioxide from Swedish private and public consumption is 44 million tonnes in 2002, of which the private consumption stands for 80%. For both public and private consumption a trend of decreasing emissions of fossil carbon dioxide emissions can be seen can be seen. The data show how environmental pressure and resource use can be connected to the consumption of goods and services. The largest product group is direct emissions from fossil fuel use by households, other large shares are generation of electricity and heat, followed by housing and food. By comparing different policy initiatives with these product groups it is possible to see how important the IPP-initiatives can become in a total consumption perspective. The categories of transport, housing and food are of evident importance. The economic goals are to increase the GDP leading to increasing consumption. The key question for IPP policies is how to decouple the increasing economic consumption from the corresponding environmental pressure and energy use. Such decoupling can be accomplished in different ways: by switching to less carbon intensive fuels, by consuming services rather than goods, by efficiency measures etc.. The direct emissions from transport and heating houses are around 15 million tonnes. However. for private consumption the indirect emissions that are connected to the goods and services bought are of importance when compared with the direct emissions. Meat, milk, cheese and eggs are large groups among the food products. Also fish, bread and vegetables can be noted. Food in general is connected to emissions of around 5 million tones of carbon dioxide or 0,5 tonnes per capita. The public consumption has around seven million tons of carbon dioxide connected to it. The size shows the potential for green procurement. The profile of public spending and private spending is in some cases different, and there are some areas such as defense where the public consumption is of vast importance. The underlying data comes from many different sources, and are based both on questionnaires to involved industries, but also on emission factors for CO2-content in fuels and model assumptions for smaller enterprises. The data quality is good in the respect that the data is generated every year and that the methods and coverage is as good as the economic standards in the national accounts demand. From this follows that an advantage of the method is that it is designed for

regular updating. Comparability between nations is also possible due to international classifications of industries, fuels, emission inventories and product groups. However, it is wise to treat the absolute figures with caution, and concentrate on comparisons between groups of products and between years. The availability of international data is still not sufficient to really produce the kind of indicators we have presented here for the whole of EU or for a single member state with accurate calculations of the environmental pressures caused in other countries. In order to get good data also on the imported products and goods, more environmental accounts data is needed. The discussions on making a regulation for this type of statistics is a clear example of something that could rapidly increase the availability of country data in the EU. Basically three sources of data would need to be completed or developed further:
• Symmetric Input-Output tables for all member states, which is something that most have committed to, and eventually will be, delivering every 5 years.
• Environmental Accounts data for energy use, emissions and other data in the harmonized
system, which most have agreed on. Data is available but not for all member states at 2-digit NACE level to link into the IO tables.
• Trade data for single country, bilateral and multilateral trade analysis of environmental
pressures caused among trading partners. EU-wide analysis of trade with the rest of the world is probably easier to come by.

6
1. Introduction 1.1 Integrated product policy (IPP) Integrated Product Policy is a European Union level initiative aimed at reducing the environmental burden of products and services throughout their life-cycles. The environmental relevance of the IPP approach is given by its general aim of reducing the environmental burdens of products and services throughout their life cycle by using a toolbox of policy instruments to green markets through both the demand side (consumption) and the supply side (product development) (Charter, 2001). The need to develop indicators for IPP has been identified both on a national (Swedish EPA, 2002) and a European (COM 2003) level. Such indicators are needed to measure the environmental improvements induced by the IPP approach (ibid). How can progress of IPP be measured? As was noted in the Commission’s latest report on IPP (Integrated product policy, building on environmental life-cycle thinking. Communication from the Commission to the Council and the European Parliament. COM (2003), there is a need for IPP-indicators. Many of the suggestions made are entirely based on an LCA-perspective, which does not allow an aggregation of products and therefore can not be linked to the total consumption of products. There are examples of studies with the objective of analyse product specific indicators for a basket of products as a measure of the IPP development in the whole economy (cf. the study by the Institute for Product Development (IPU), Commissions web site2). As mentioned, indicators based on LCA are data intensive. Even if there are LCA-databases available, they are not updated on a regular basis and do not contain time-series. However, the environmental accounts do contain time-series and thus seem well adapted to be used in this context. Both national and regional studies have been made during the last years, showing the importance of trade as a component in the environmental pressure of consumption. The national studies cover Norway (Straumann, 2003; Hammer Strömman et al, 2004; Hertwich et al, 2002), Sweden, Denmark (Munksgaard et al. 2005 and StatBank Denmark for the time 1993-2000), Japan (Kondo et al, 1998), Holland (de Haan, 2002) and Australia (Lenzen, 1998). Regional comparisons of Japan, USA, Western Europe and the OECD have also been made (Muradian et al., 2002; Ahmad, 2003; Ahmad and Wyckoff, 2003; Hubacek and Giljum, 2003; Lenzen et al., 2004). Most of these studies have presented data in the forms of indicators such as the net trade balance, also called the environmental balance of trade. Recently, studies on IPP indicators alike the ones we present in this report has been conducted by Weidema et al.,(2005) and in the EIPRO– study (Tukker et al., 2005). The study of Weidema et al. (2005) were based on a combination of environmental statistics and the Danish national accounts, divided into 138 product groups. Consumption were divided between private consumption and public consumption and the results indicate that public consumption of products has much less impact on the environment than private consumption. The greatest potential for environmental improvements were identified in the product areas of food, housing, transport by ship and electricity (ibid.). In the EIPRO-study (Tukker et al., 2005) the objective of the study was to identify products (or product groups) that have the greatest environmental impact from a life-cycle perspective in the EU25. The EIPRO-study conclude that the Input-Output based analysis of products gives an overview which hardly can be created in any other way (ibid.).
2 http://europa.eu.int/comm/environment/ipp/pdf/ta_indicators.pdf visited 21/02/2006.
7
1.2 IPP in Sweden The interest in product policy in Sweden can be dated back to the 1960-ies when the first policy measures were taken to decrease product waste littering. Through an information campaign started by the Swedish Society for Nature Conservation called “Håll naturen ren” (Keep nature tidy, see www.hsr.se) the message was spread of the need for proper waste management from the consumer side. In 1971, the legislation was changed so that waste dumping in the sea became illegal and so that the municipalities received a greater responsibility for collecting and managing the waste. Some economic incentives such as refund on aluminium cans and on vehicles were set up. Gradually the environmental product field became more research intensive; the life cycle assessments on food packaging introduced the idea of measuring environmental performance per function, in order to be able to compare between different materials used for the same purpose. Different policy measures are discussed to reduce the environmental impact of goods. Examples of the types of mechanisms include producer responsibility, environmental agreements, environmental taxes, eco-labelling, environmental product declarations, product directives, product and material standards and procurement regulations. Similar measures to those suggested in this report have been constructed for the Swedish Producer Responsibility Committee, within a study focusing on environmental impacts of different product groups (Finnveden, G., Johansson, J., Moberg, Å., Palm, V. and Wadeskog, A. with contributions from Suh, S. and Huppes, G. (2001): Miljöpåverkan från olika varugrupper. In Swedish). In that study the questions asked were: • Which were the most important product groups from an environmental perspective? • Had the existing producer responsibility in Sweden focused on the ”right” product groups?
(Acknowledging that the definition of ”right” can be made in several ways). • Which product groups could be of interest for an extension of the producer responsibility? The approach and results have resulted in a large interest, not least from the international IPP discussions. Some results from that work will be published in a special issue on IPP in Journal of Industrial Ecology (Palm et al., 2005). However, the data and method are not yet easily available for the practitioners in the area. Therefore, there is a need for a report in English and also to publish such data on a web-site in order for different actors and practitioners to make use of it. The Swedish EPA finances a research centre called FLIPP (Furthering Life cycle considerations through Integrated Product Policy). FLIPP is organised as a joint research program between the departments of Environmental Systems Analysis at Chalmers University of Technology (ESA) and the International Institute for Industrial Environmental Economics at Lund University (IIIEE). The research program of FLIPP has two focus areas, which also are aimed to be integrated in the structure of the program; 1) the relation between different actors within the product chain (the industry perspective) and 2) the possibilities of governments to control the environmental impact in the product chain (the policy perspective). Statistics Sweden participates in an ongoing project run by the Royal Institute of Technology, who also are a co-partner of FLIPP. The aim of that project is similar to this project to develop indicators for IPP for the Swedish and EU arena. A first step will be to make an inventory of and describe the needs of different stakeholders. Other issues will be to select sources of data, calculation methods, the level of aggregation of indicators (e.g. product, groups of products, or industry branches), and what environmental aspects should be indicated. An appropriate set of indicators for IPP will be suggested and calculated. The indicators will be based on a hybrid approach combining Life Cycle Assessment (LCA) and Environmentally extended Input Output Analysis (EIOA). Industry
8
data from the EIOA will be combined with user and end-of-life data from LCA databases. The final report of the project are to be finished in December 20063.
1.3 Environmental accounts Environmental accounts describe the connections between the environment and the economy, e.g. in natural resource extraction or the emissions of air pollutants by a given sector of society or industry. It is a system that links the environmental pressure to the economic actors in society, and it can also be used to link the environmental pressure to the consumption of different product groups, with the help of input-output analysis. By including statistics on traded goods and services from different countries, as well as different national emission patterns, the environmental pressure of these product groups in a life-cycle perspective may also be covered. Since 1993, Statistics Sweden produces environmental accounts focusing on the connections between the environment and the economy (SEEA, 1993; UN, 2000; SEEA 2003). The environmental accounts connect economic data from the national accounts system, that describe the production and consumption activities (e.g. value added and employment in different industries), with environmental data such as emissions, waste and use of material that stem from these activities (See for example Keuning and de Haan, 1996; Keuning et al., 1999; Hellsten et al., 1999; Statistics Sweden, 2003; and Isacsson et al., 2000). The environmental accounts also include other data, e.g. environmental taxes, subsidies and environmental protection expenditures as well as some social data (See e.g. Palm 2001, Sjölin et al. 2000, MIR2003:3, MIR2003:4, MIR2004:1). Input-output accounts (IOA) are a part of the national accounts and are used for bringing consistency in the system, to align the production with the consumption activities for a certain year, as well as for different types of analyses. The IOA was invented by Wassily Leontief in the end of the 1930-ies, partly based on the ideas that were proposed by Quesnay in his “Tableau Economique” in the midst of the 18th century (Leontief, 1986). The IOA were used in models for economic planning since the 1940ies and onwards, and are still at the core of many economic models used. The accounts are created by describing several matrices where all different industries and sectors in the economy are depicted according to their production input, i.e. the goods they purchase, called the demand or use matrix, and by the goods or services they produce, called the goods or supply matrix, in monetary terms. By combining this information, a linear activity model between production and consumption is obtained, expressed as final demand including private consumption, investments and export, in a country (See e.g. UN, 1996). For example, Sweden is a small open economy with extensive trade with the world around. A large part of what is consumed in Sweden – equal to 34 per cent of GNP – is produced elsewhere in the world. Similarly, a large part of what is produced is consumed in other parts of the world (40 per cent of GNP). The ordinary environmental statistics are concerned with the activities and state of the administrative and geographic boundary of Sweden, which is a mixture of the production and the consumption within the country. The indicators of IPP that we suggest in this report illustrate the environmental pressure of the nations consumption, including imported goods and excluding exported goods.
3 More information on the project is available on www.infra.kth.se/fms

9

10
2. Objectives The expected output of this project is a description of a method that would make it possible to produce IPP-indicators from the environmental accounts. The output will also be a presentation of data on environmental pressure per product group consumed in Sweden that could be used for indicators for IPP for the years 1993-2002. The indicators produced can be disaggregated showing the impact of particular product groups or services. In this project, we would focus on energy consumption and fossil carbon dioxide emissions. The data are internationally available, the carbon dioxide emissions will be in focus because of the Kyoto protocol and what may follow, and the energy consumption is a complement which shows the demand for energy also in those countries where the energy mix is not so carbon dioxide intense, such as France, Sweden and Norway.

11
12
3. Method The calculations are based on data from the Swedish SEEA. The national accounts provide monetary data on the economic activities presented either by industry or by products and services, through supply and use tables. The supply and use tables can be transformed into input-output (IO) matrices. The IO-matrices provide linkages between different production sectors in the economy. For each industry, the matrices show how much is purchased from other industries in terms of input goods and how much is supplied to other industries and to final demand in monetary terms. In the SEEA, this information is complemented by calculating the use of resources and corresponding emissions by industry. By using the input-output structure it is then possible to redistribute this information so that resources and emissions are shown by products and services consumed in final demand. In this report, the results for private and public consumption are presented. The IO-structure is partly updated each year. However, a detailed investigation of all transactions is not possible, so parts of the structure rely on older data. The documentation of techniques and data provision of the economic IO for Sweden is described in Statistical messages. Since 1999, the Swedish National Accounts has been adapted to the European System of National and Regional accounts (ESA 95), as stipulated in the EU council regulation of 1996. Industries are defined according to the international standard NACE rev.1.1 classification (Found at the Eurostat homepage in the classification database RAMON, Eurostat, 1996) and is harmonised with the UN classification ISIC (guide to the classifications can be found at the classification registry at UN website http://unstats.un.org/unsd). The data was aggregated into 51 industries. The categories of final demand can either be expressed as NACE-products, following the same categories as the industry classification (approximately 60 in the Swedish case), or they can be further refined using the COICOP (classification of individual consumption by purpose) nomenclature, also found at the Eurostat and UN-websites. In this report both classifications will be used.
3.1 Input-Output Analysis Going from an industry-based accounting system to the product-based approach in IPP requires using Input-Output Analysis (IOA). The IOA redistributes the environmental pressure in the production phase to the goods and services of final demand. Capital goods (i.e. Gross Capital Formation) was not allocated as intermediary inputs into industries. Public Consumption in Final Demand includes all intermediary inputs/use that is used in production in the public sector. However in this report, results are not presented for the whole final demand, but for the private and public consumption. The exports are not included. In the future, part of the investments could be part of the Swedish consumption indicators. In this project however, investments are not included. In the future, investments would ideally be handled specifically in the analysis and the indicators. Gross investments are classified as final demand but a part of this, e.g. replacements, could be attributed to the production of goods and services in the current year. This would mean a reallocation of indirect emissions from gross investments to the other components of final demand. In this project however, it has not been possible to do this reallocation. The environmental pressure data included in the report are emissions of CO2 from fossil fuels, district heating and electricity. The environmental pressure from private and public consumption
13
is calculated as the total environmental pressure in the Swedish production system including the imports, plus impacts from the user phase, namely the fuel consumption and corresponding air emissions from private cars, electricity use, fuel use and corresponding air emissions in private housing. As most Statistical Agencies in Europe, Statistics Sweden is committed to delivering symmetric domestic IO-tables to Eurostat every 5 year. The first year being 1995. The time series of calculations at the Environmental Accounts is therefore based on symmetric IO-tables for the whole series from 1993, developed at the Environmental Accounts. The IO-tables used are based on the 134 by 134 Use and Supply Tables. The matrices used are: Use and Make Tables for domestic use and production. The 134 products by 134 industries domestic use tables were converted to product by product tables using the Make matrix and the so called industry assumption. This means that an industry that produces several different products is assumed to do this with the same production recipe. The same applies to all matrices in the industry dimension. The Final Demand side of the analysis is covered using to different classifications systems. When looking at the different components, Final Demand is classified according to NACE. When looking strictly at Private Consumption Final Demand is classified by purpose (COICOP). The National Accounts contains cross-classification of private consumption between NACE and COICOP. Import Tables for inputs into domestic production as well as domestic final demand Tables from the Environmental Accounts, covering Emissions to Air and Energy use by fuel and industry, were used in all calculations.
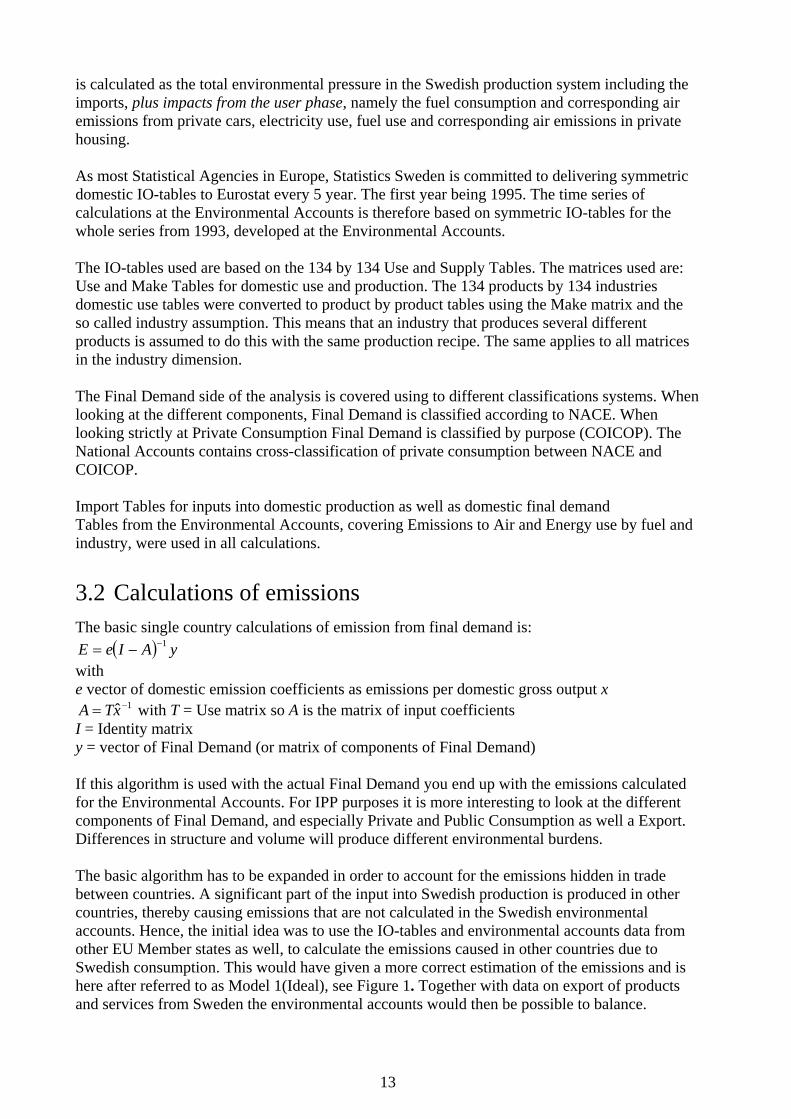
3.2 Calculations of emissions The basic single country calculations of emission from final demand is:
( ) yAIeE 1−−= with e vector of domestic emission coefficients as emissions per domestic gross output x
1ˆ −= xTA with T = Use matrix so A is the matrix of input coefficients I = Identity matrix y = vector of Final Demand (or matrix of components of Final Demand) If this algorithm is used with the actual Final Demand you end up with the emissions calculated for the Environmental Accounts. For IPP purposes it is more interesting to look at the different components of Final Demand, and especially Private and Public Consumption as well a Export. Differences in structure and volume will produce different environmental burdens. The basic algorithm has to be expanded in order to account for the emissions hidden in trade between countries. A significant part of the input into Swedish production is produced in other countries, thereby causing emissions that are not calculated in the Swedish environmental accounts. Hence, the initial idea was to use the IO-tables and environmental accounts data from other EU Member states as well, to calculate the emissions caused in other countries due to Swedish consumption. This would have given a more correct estimation of the emissions and is here after referred to as Model 1(Ideal), see Figure 1. Together with data on export of products and services from Sweden the environmental accounts would then be possible to balance.
14
Figures can then also be presented at an industrial level, for example in environmental economic profiles, which show for instance the contribution of different industries to total Swedish import and export. The method of trade-adjust environmental accounts has been presented and discussed in a former project “Environmental Impact of Swedish Trade” (MIR2002:2). As described elsewhere Model 1(ideal) was due to lack of data not possible to accomplish this time.
Priv
ate
Con
sPu
blic
Con
sEx
port
....
....
FinalDemand
TradeMatrix
Cou
ntry
A
Cou
ntry
B
Cou
ntry
C
......
DomesticInput/Output
Matrix
Country XInput/Output
Matrix
Country XEmission
and EnergyCoefficients
DomesticEmission
and EnergyCoefficients
DomesticEmissions
and Energy Use
Country XEmissions
and Energy Usefrom Swedish Final Demand
ImportMatrix
Figure 1. Outline of Model 1 (ideal) to calculate emissions caused in other countries due to Swedish consumption. (Environmental Accounts, Statistics Sweden).

15
A second best solution of carrying out these types of calculations is therefore to use the domestic IO-tables and emissions coefficients and calculate emissions in other countries by calculating these emission as if imported products were produced domestically. This model is referred to as Model 2, illustrated in Figure 2.
Priv
ate
Con
sPu
blic
Con
sEx
port
....
....
FinalDemand
DomesticEmission
and EnergyCoefficients
DomesticEmissions
and Energy Use
DomesticInput/Output
Matrix
DomesticInput/Output
Matrix
DomesticEmission
and EnergyCoefficients
Emissionsand Energy Usein other countries
ImportMatrix
Figure 2. Outline Model 2, use of domestic IO-tables and emissions coefficients as a basis for calculating emissions in other countries due to Swedish consumption, i.e. imported products are handled as they were domestic (Environmental accounts, Statistics Sweden).

16
Model 2, gives an expanded basic algorithm for calculating emissions in Sweden ( dE ) and abroad ( fE ) is:
( ) ( )( ) ( ) ⎟⎟⎠
⎞⎜⎜⎝
⎛
+−−= −
−
fddddm
dddfdfd
yyy
eeEE 11
AIAAI
with:
de vector of domestic emission coefficients as emissions per domestic gross output xd fe vector of emission coefficients for imported products
( ) 1−− dAI is the domestic inverse matrix dT - the domestic interindustry transaction table mT - is the interindustry transaction table for intermediate imports dx - vector of gross domestic production values
these are then used to create
1ˆ −= ddd xTA
and 1ˆ −
= dmm xTA
ddy - domestic final demand of domestic products fdy - domestic final demand of imported products
If Model 1(ideal) would have been possible, we would use the actual fe , i.e. the emission coefficients for the different trading partners, together with a weighed matrix to allocate import and export over the different trading partners to get a more accurate estimate of the emissions in other countries (Statistics Sweden, 2002).
3.3 Household use The household use of fossil fuels has been allocated to petroleum products (NACE 23). The household use of electricity is allocated to electricity (NACE 40). The environmental pressure from the use phase occurring before the final demand, the so-called indirect environmental pressure, is included in the calculations. Some emissions from the use phase are however not included, for example emissions of organic substances from paints. Emissions from the waste phase are partly included, just as they are in the national inventories, and attributed to the waste management industry and (as part of final demand) to the service of waste management.
3.4 Fossil fuels, biomass and electricity use The energy data is expressed in a common energy unit, TJ (terajoule). Gross consumption of primary energy and equivalents is calculated from the following items: Inland supply plus import, minus export and changes in stocks. Concerning the fuels wood, wood waste, sulphite and sulphate lyes, peat and waste the total consumption for energy purpose is recorded as inland supply of primary energy. Bunkering for foreign shipping covers supply to bunkers for seagoing ships of all flags. Supplies for international air traffic are evaluated as final inland consumption.

17
Consumption by energy producing industries covers the consumption of electric energy, fuel oils, gases etc. for the operation of power stations, thermal power plants, refineries, coke-oven plants and gasworks. Energy data by industry can be found in the statistical database on the web-site of Statistics Sweden (www.scb.se).
3.5 Emissions to air, Swedish data The data on emissions is based largely on the Swedish primary emissions inventory reported according to the recommendations of the IPCC (Intergovernmental Panel of Climate Change), which are calculated based on the energy consumption and process emissions for broad sectors such as agriculture, transport, housing and industry. However, additional emissions from bunkering of fuel for international shipping and aviation are also included, as these activities are exempted from the IPCC system boundary, but included in the system boundary of the national accounts. As the IPCC do not require data that is disaggregated by industry, this disaggregation is made specifically for the environmental accounts. For the large companies in the manufacturing industry the energy data and process data are collected in surveys. For smaller companies and for the industries in the service sector the disaggregation of the energy data is made with help information from registers on employment and financial records, as well as surveys on energy use in housing. For road transports, the energy data is disaggregated by help of the car register. The car register provides information on which industries own the vehicles. The disaggregation is based on the reported distance that the registered vehicles have travelled. For energy use for housing, the help data is taken from economic surveys on the cost for fuels. The emissions data by industry is available at Statistics Swedens’ data-base at www.scb.se/mi1301-en .
3.6 International emissions and energy data Traditionally, the environmental accounts have described the activities inside Sweden (or inside any other country calculating environmental accounts). Emissions to air, for example are produced on the basis of the emissions in Sweden due to Swedish production and consumption. As discussed in “3.2 Calculations of emissions” we would ideally use environmental account data from the countries that provide the goods and services imported to Sweden, Model 1 (ideal). This would generate the possibility to adjust the calculations to cover the emissions that occurs in other countries due to Swedish consumption. In this study an inventory was made on what data that were available for air emissions and energy use in other EU member countries' Environmental Accounts (cf. section 5.1 Inventory of European data). Data were collected from Eurostat and no direct contact with other statistical offices and their Environmental Account departments where taken. Due to lack of data on energy use and lack of time series this material was not used. Instead the Swedish data has been used as a proxy for the international data.

18
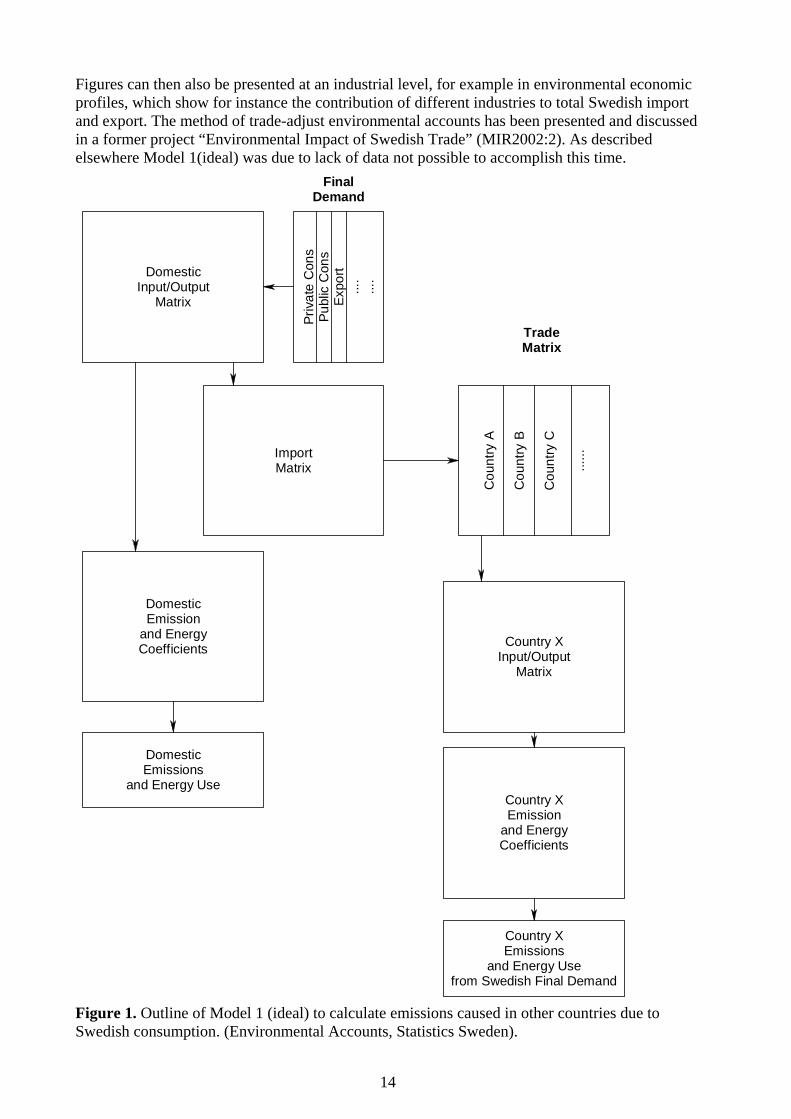
4. Assessment of data quality 4.1 Introduction The quality of data can be assessed from different, and often conflicting, criteria (see for example Table 1 that presents the different dimensions of data quality in the quality framework of Eurostat. Statistics Sweden has published a document (in Swedish) which is a quality guideline for the official statistics (MIS 2001:1). The quality is assessed from the perspective of the users and more specifically for the planned uses of the statistics. Even if a quantitative measure of the quality is always wished for, in reality it is often impossible to provide an overall measure for the many different aspects. Descriptions of the data processing and a documentation of sources and references to international classifications and guidelines are also part of the data quality. To ensure a good quality it is necessary to have a good contact with the main users. In Sweden, the contact with users is assured in several ways. A council with representatives for many of the most important users such as the National Institute of Economic Research, the Swedish EPA, the ministry of sustainable development, ministry of industry and of finance, as well as representatives from Universities, the regions and NGOs meets twice a year to discuss and take part in the latest developments of the environmental accounts. When governmental committees are assigned projects that may benefit from the use of the accounts data, we make contacts with them to assure that they are aware of this possibility. Reports in English and Swedish have been put on the web-site of Statistics Sweden, in order to enhance the availability (see http://www.scb.se/mi1301-en for the English reports and http://www.scb.se/mi1301 for all the reports). The results are published in three main publication series. Time series are presented in the ordinary publications for official statistics, with only some comments to the tables. These are in Swedish with a very short English summary, and English names on the tables. The more reader-friendly analysis of different areas in the environmental accounts are published in the series ‘Miljöräkenskaper’, mostly in Swedish, but also in English. There are English summaries available for most reports in Swedish. Other reports in English, dealing mostly with methodological issues, are published in Eurostat working papers. (The work with these reports have partly been financed by the European Commission.)
19
Dimension Description
Relevance Statistics are relevant if users’ needs are met and if
subject-matter areas are covered by statistics illuminating
different perspectives
Accuracy Closeness between the value finally retained and the true,
but unknown, population value
Timeliness and
punctuality
Time length between the release time and the end of the
reference period; the agreement between the actual
release time and the target release time
Accessibility and
clarity
Accessibility refers the physical conditions in which
users can obtain data. Clarity refers to the information
environment.
Comparability Comparability over time, between geographical areas,
and between domains.
Coherence The adequacy of statistics, especially from different
sources, to be combined.
Table 1. Quality Issues in the European Statistical System (Svante Öberg, Director General, Statistics Sweden, December 2005 http://www.scb.se/Grupp/Omscb/_Dokument/Quality%20Issues%20in%20the%20ESS_Svante%20Oberg.doc. The data underlying the indicators in this report are collected from many different statistical areas. Trade statistics, national accounts, environmental accounts and the underlying primary data sources such as energy statistics, economic statistics by industry and by product categories are all necessary for these assessments (see Methods). The inherent accuracy measures for the survey data in the statistical areas are mixed in the calculations, and we do not have a quantitative error measure for the accuracy of the results. However, the strong reliance on time-series and national comparisons gives a good base for finding outliers and inconsistencies in the data. The accounts are designed to provide for comparability, relevance and coherence. They are built according to internationally harmonized concepts and follow guidelines to ensure that the statistics are comparable between nations and between industries as well as over time (See Methods). The processing of the data takes time and so the timeliness of the data suffer from this, causing a delay of approximately two years between publications year and the data year.
4.2 Trade in goods Before Sweden’s entry into EU, the flows of goods to EU were analysed via customs and shipping documents reported by firms to the Customs and Tax Authorities. Since Sweden's entry to the EU in 1995, foreign trade statistics for imports have included goods that a) arrive in Sweden via trade with other EU countries (single market) or b) are imported

20
from countries outside the EU and released for free circulation within the single market or released for free consumption on the Swedish domestic market. Exports includes goods that a) are dispatched from Sweden via trade with other EU countries or b) are exported or re-exported, after import, to countries outside the EU. In the databases, both arrivals from the EU and imports from non-EU countries are called imports, while both dispatches to the EU and exports to non-EU countries are called exports.
4.3 Trade in services Statistics on Sweden's exports and imports of services are compiled by Sweden's Riksbank (Central Bank), see www.riksbank.se, and are not published in Statistics Sweden's databases. The Riksbank also compiles Sweden's current account balance of payments, in which Statistics Sweden's statistics on total exports and imports of goods are included. Information on the sources and methods used by Sweden's Riksbank are presented on their web-site: http://www.riksbank.com/pagefolders/15620/BoP_källor_och_metoder_engelska.pdf
4.4 Business statistics4 Since the start of 1997 the Business statistics (Företagsstatistiken – FS) conforming to the EU regulation on Structural Business Statistics (SBS) have been the main source for the output calculations. However, the statistics are considerably more comprehensive than is required by the Regulation. They cover all industries apart from agriculture, forestry, fishing and financial corporations. In the Business statistics all enterprises with a minimum of 50 employees are surveyed by questionnaire. Enterprises with fewer than 50 employees are surveyed through administrative material from the National Tax Board. The material is known as Standardised accounting statements (Standardiserade räkenskapsutdrag – SRU), consisting of annexes to the enterprises’ income declarations. The Business statistics are scrutinised jointly with the product-based output statistics (Industrins varuproduktion – IVP). Prior to 1997 the Business statistics only covered the corporations sector and were known as Financial statistics for enterprises. In order to cover the whole of industry, therefore, supplementary inquiries were undertaken. For certain industries, however, sources other than the Business statistics are used. For agriculture, forestry and fishing, material from the Swedish Board of Agriculture, the Swedish University of Agricultural Sciences, the National Board of Forestry and the National Board of Fisheries are used. For NACE 40-41 Electricity, gas, heat, water and sewage plants, the Business statistics are used but the energy statistics also play an important role here. NACE 45 Construction is calculated from the use side as the sum of investment in and repairs to buildings and structures. For the service industries, the Business statistics are the main source, but for NACE 61 Transport by sea and NACE 62 Air transport detailed special statistics are used and, for NACE 65-67 Financial activity, the main source are financial market statistics. For Mining and Manufacturing, the Industrial output statistics are used with effect from 1996 – when they replaced, inter alias, the product-based output data in the previous Industrial statistics – and the Business statistics from 1997.
4 The text below on business and product statistics is based on the GNI inventory desription, which is available from the National Accounts at Statistics Sweden.

21
The Business statistics are structured somewhat differently for different industries. Industry as a whole is surveyed by establishments, whereas service industries are surveyed mainly on an enterprise level. Service industries are supplemented in the Business statistics by those establishments in industrial enterprises, which are classified as service industry units and reduced by those establishments in service enterprises, which are classified as industrial units. Several other inquiries apart from the Business statistics have been used in order to verify and supplement the Business statistics. Statistics Sweden produces intermittent sample surveys of the service industries, in which data is collected on turnover, consumption, investment etc. on a more detailed level than is possible from the Business statistics.
4.5 Product statistics The Household budget statistics (HBS) constitute the only consistent inquiry, which measures household consumption expenditure as such. One of the problems in using other data sources, e.g. turnover, is that it is difficult to show the exact proportion of total sales income accounted for by households. As the HBS is a relatively small sample survey, the HBS material produced is subjected to critical scrutiny. In those cases in which the HBS estimate is not up to the standard of data from other sources and there are sound reasons to place more confidence in other sources instead, the HBS estimate is discarded. Special attention is of course focused on items which are habitually underestimated in HBS inquiries and expenditure which has poor coverage because of the composition of the sample, for example in households with persons aged over 75. Direct measurement methods are used for most expenditure in household consumption. However, indirect methods are applied in order to calculate a utility value for all dwellings other than rented accommodation. Indirect methods are further used to record the utility value of car benefits and of PC benefits. In addition an indirect method is used to calculate charges to households for the consumption of dental, medical and child-care services produced by private operators. The Swedish national accounts are based on product-by-product supply and use tables, which means that all production and use of goods and services is arranged in a system of product balances. This provides an opportunity to check the calculated consumption of goods and services for household consumption and other use against the supply of the corresponding goods and services. If there are differences between supply and use, a residual item arises and special analysis is then devoted to the good or service in question and the required measures are taken in order to bring about a better balance between supply and use. The product balancing technique is such that benchmarks in household consumption can be affected. In the 1995 benchmarking, an important criterion for the evaluation of household budget data, for example, were the results of the product balance reconciliation. The calculations for household petroleum consumption are carried out in the national accounts special energy balances. For petroleum products there are statistics from a number of sources, and these are coordinated into five different product balances in which the allocation to different user groups is specified. Analysis, reconciliation and adjustments thus arise for all of the 230 product groups, which make up the smallest building blocks of household consumption allocated to purposes. GDP and GNI are calculated and compiled in that part of the national accounts system known as the product accounts. The annual calculation is performed and balanced in a system of supply and use tables. The supply and use tables (SUT) are the basic tables which can subsequently be

22
further processed to Input-Output tables. The table system also includes employment calculations with the average numbers of employees and hours worked per industry/purpose. The degree of detail in the Swedish system is such that the output calculations are performed on around 400 product groups and 134 industries; household consumption expenditure is recorded for 147 purposes in accordance with COICOP; consumption expenditure of departments and agencies of government is allocated to sectors, industries and functions (COFOG), which makes 58 uses. Gross fixed capital formation is broken down by sector, industry and function (COFOG), split on 128 uses in the economy. The calculations and balancing in SUTs mainly affects products from market output and production for own final use, and sales by other non-market producers (departments and agencies of government and non-profit institutions serving households). They also include value added components and employment for market producers and producers for own final use. The value added components for other non-market producers, which do not affect the balancing, are added at a somewhat later stage.
4.6 Energy statistics The energy statistics are based on several surveys covering different economical sectors and different types of fuels. The manufacturing enterprises (NACE 10-40) are the most well-covered, while agriculture, forest, and fishing industry do not have yearly survey’s but are calculated from less frequent sampling. The service sectors are covered by surveys to the large housing companies and by surveys on economic statistics rather than by quantities of fuel use.
4.7 Air emissions statistics The air emission statistics can be divided into three areas: stationary emissions, mobile emissions and process emissions. The main source of activity data for stationary emissions is the energy statistics and industry statistics. For mobile emissions, fuel data from the energy statistics are being processed in a number of ways. For the land transports a model from the Road authority is used to calculate the emissions from cars, buses and light and heavy lorries. This information is then disaggregated on industry by data on mileage from the car register. Process emissions, finally, are collected from environmental reports from the companies. The calculation of emissions are guided by the principles stipulated by IPCC, which is part of the international obligatory reporting. However, since the accounts have a somewhat broader definitions, including also data on international shipping and air traffic, additional data is collected for these areas. IPCC has also recommended methods for assessing the uncertainty of the emissions. In Sweden, work has been carried out to estimate the uncertainty in the total emission figure, by the method labeled as Tier 1. The uncertainty in the activity data and emission factors were estimated by the expert that calculates the statistics and combined in Equation 1 for different years and emissions. The results indicate an uncertainty for the total CO2-emissions in 1990 and 2004 of between 2 and 3 % (Gustafsson, 2005). For the environmental accounts, the total figure should be the same, if we disregards the international shipping and airport data. For the different industries it is expected that the uncertainty will vary however, depending on the quality of the emission factors and the quality of the fuel data. The Tier 1 method aims at providing a simple as well as time efficient procedure of estimating uncertainties associated with activity data, emission factors and direct emissions. Once the uncertainties in the source categories have been determined, they may be combined to provide uncertainty estimates for the entire inventory in any year and the uncertainty in the overall

23
inventory trend over time. The Tier 1 method for combining estimating uncertainty is based on the error propagation equations as presented in the IPCC Good Practice Guidance. Equation 1 is used when uncertainties are combined by multiplication (for example activity data multiplied with emission factors). Equation 1 in the Tier 1 method:
Where: Utotal is the percentage uncertainty in the product of the quantities (half the 95%
confidence interval divided by the total and expressed as a percentage);
24
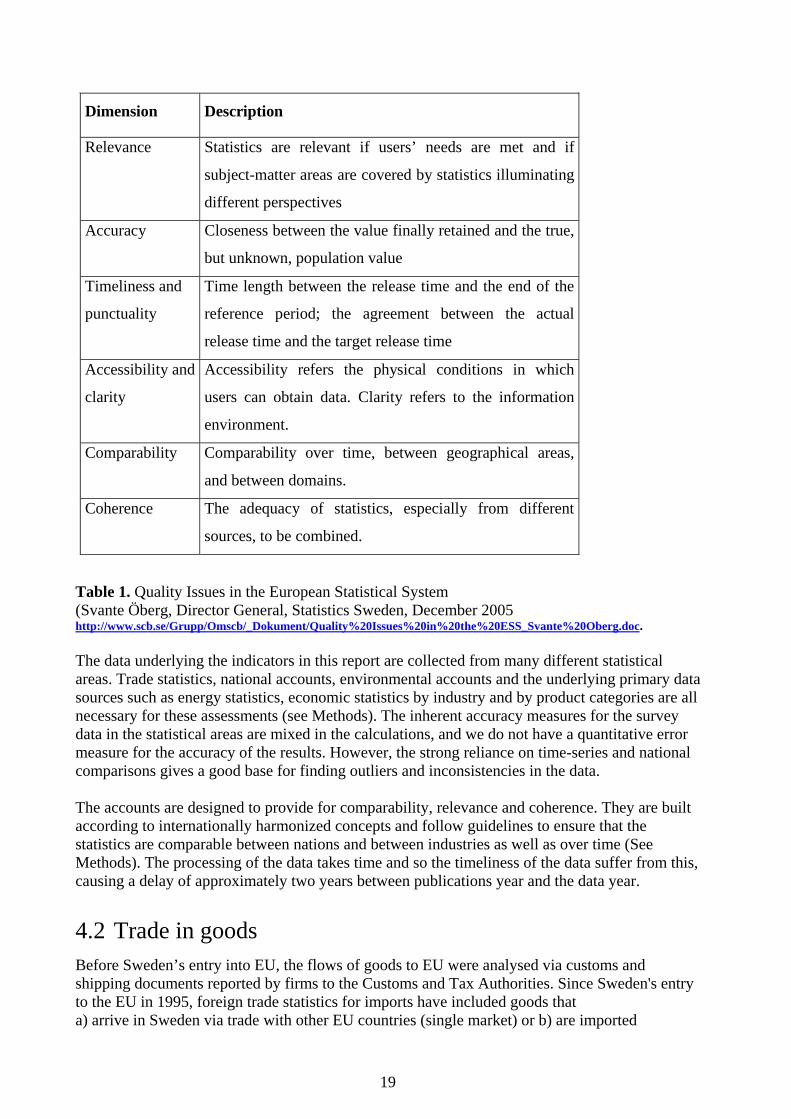
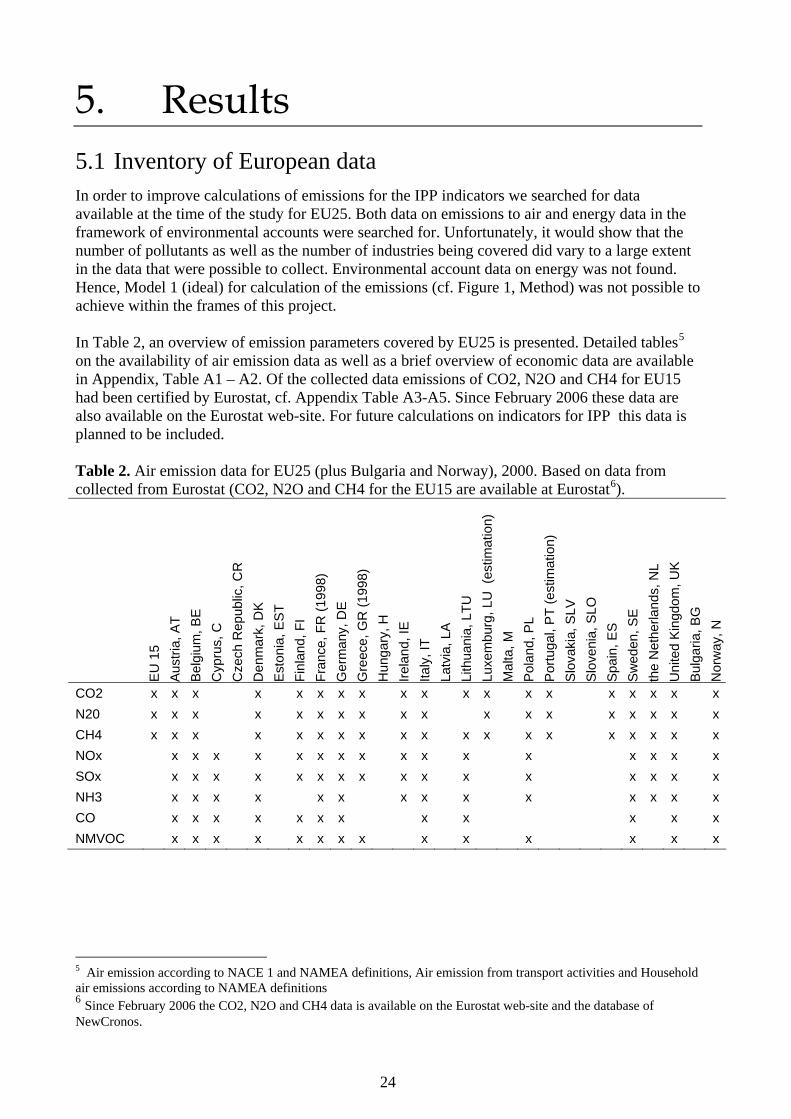
5. Results 5.1 Inventory of European data In order to improve calculations of emissions for the IPP indicators we searched for data available at the time of the study for EU25. Both data on emissions to air and energy data in the framework of environmental accounts were searched for. Unfortunately, it would show that the number of pollutants as well as the number of industries being covered did vary to a large extent in the data that were possible to collect. Environmental account data on energy was not found. Hence, Model 1 (ideal) for calculation of the emissions (cf. Figure 1, Method) was not possible to achieve within the frames of this project. In Table 2, an overview of emission parameters covered by EU25 is presented. Detailed tables5 on the availability of air emission data as well as a brief overview of economic data are available in Appendix, Table A1 – A2. Of the collected data emissions of CO2, N2O and CH4 for EU15 had been certified by Eurostat, cf. Appendix Table A3-A5. Since February 2006 these data are also available on the Eurostat web-site. For future calculations on indicators for IPP this data is planned to be included. Table 2. Air emission data for EU25 (plus Bulgaria and Norway), 2000. Based on data from collected from Eurostat (CO2, N2O and CH4 for the EU15 are available at Eurostat6). E
U 1
5 A
ustri
a, A
T
Bel
gium
, BE
C
ypru
s, C
C
zech
Rep
ublic
, CR
D
enm
ark,
DK
Est
onia
, ES
T Fi
nlan
d, F
I Fr
ance
, FR
(199
8)
Ger
man
y, D
E
Gre
ece,
GR
(199
8)
Hun
gary
, H
Irela
nd, I
E
Italy
, IT
Latv
ia, L
A
Lith
uani
a, L
TU
Luxe
mbu
rg, L
U (
estim
atio
n)
Mal
ta, M
P
olan
d, P
L P
ortu
gal,
PT
(est
imat
ion)
Sl
ovak
ia, S
LV
Slo
veni
a, S
LO
Spa
in, E
S
Sw
eden
, SE
th
e N
ethe
rland
s, N
L U
nite
d K
ingd
om, U
K
Bul
garia
, BG
N
orw
ay, N
CO2 x x x x x x x x x x x x x x x x x x xN20 x x x x x x x x x x x x x x x x x xCH4 x x x x x x x x x x x x x x x x x x xNOx x x x x x x x x x x x x x x x xSOx x x x x x x x x x x x x x x x xNH3 x x x x x x x x x x x x x xCO x x x x x x x x x x x xNMVOC x x x x x x x x x x x x x x
5 Air emission according to NACE 1 and NAMEA definitions, Air emission from transport activities and Household air emissions according to NAMEA definitions 6 Since February 2006 the CO2, N2O and CH4 data is available on the Eurostat web-site and the database of NewCronos.

25
5.2 IPP-indicators by product groups In Table 3 the emissions of carbon dioxide from Swedish private and public consumption are shown, by product NACE. The direct emissions from fossil fuel use by households have been allocated to NACE 23, which is the largest group. Other product groups with a large share of the emissions are electricity and heat generation with approximately 15% of emissions from Swedish consumption, followed by housing and food. The total emissions are 44 million tonnes of which the private consumption stands for 80%. For many product groups the emissions from the private and public consumption are of similar size though, and for some (Construction, Defense, Education and Health services, NACE 45, 74, 80 and 85) the public emissions are higher. The interpretation of the figures is not always straightforward. Especially not for some of the machinery categories, it is difficult to grasp what products are included. Waste treatment and water use is included in the housing group, because of national accounting standards. By using purpose categories instead of NACE, a finer disaggregation of consumption groups are possible. Table 3. Carbon dioxide emissions (tonnes) from Swedish private and public consumption by NACE, 2002.
Private
consumption Public
consumption Total P&P Private C Public C P&P01 Agricultural
products 1 096 036 42 865 1 138 901 2,92% 0,64% 2,57%
02 Forest products
7 985 22 8 007 0,02% 0,00% 0,02%
05 Fish 229 148 10 557 239 705 0,61% 0,16% 0,54%10+11+12 Peat 8 666 0 8 666 0,02% 0,00% 0,02%13-14 Stone, sand
and gravel 5 525 35 126 40 651 0,01% 0,52% 0,09%
15-16 Food 4 176 512 337 548 4 514 060 11,13% 5,01% 10,19%17 Textiles 171 725 54 765 226 490 0,46% 0,81% 0,51%18 Clothes 312 033 14 535 326 568 0,83% 0,22% 0,74%19 Leather
merchandise 131 336 12 535 143 871 0,35% 0,19% 0,32%
20 Wood, cork 26 695 6 917 33 613 0,07% 0,10% 0,08%21 Paper 58 987 89 310 148 297 0,16% 1,32% 0,33%22 Publishing 177 380 94 983 272 363 0,47% 1,41% 0,62%23 Petroleum
products 14 537 761 1 173 301 15 711 062 38,73% 17,40% 35,48%
24 Chemicals 291 417 279 988 571 405 0,78% 4,15% 1,29%25 Rubber and
plastics 60 908 61 256 122 164 0,16% 0,91% 0,28%
26 Glass and glass fiber
92 856 63 717 156 573 0,25% 0,94% 0,35%
27 Steel and metall
6 637 30 014 36 652 0,02% 0,45% 0,08%
28 Metal goods 65 590 64 806 130 396 0,17% 0,96% 0,29%29 Machines 79 148 68 053 147 201 0,21% 1,01% 0,33%30 Computers 27 009 6 279 33 289 0,07% 0,09% 0,08%31 Electronics 68 839 25 905 94 744 0,18% 0,38% 0,21%32 Telephones 103 584 57 230 160 814 0,28% 0,85% 0,36%33 Watches,
clocks / Office equipments
24 443 86 367 110 810 0,07% 1,28% 0,25%

26
Table 3, Continuation. Carbon dioxide emissions (tonnes) from Swedish private and public consumption by NACE, 2002.
Private
consumption Public
consumption Total P&P Private C Public C P&P34 Motor
vehicles 630 679 4 668 635 347 1,68% 0,07% 1,43%
35 Other vehicles
102 809 111 402 214 211 0,27% 1,65% 0,48%
36 Furniture 382 103 53 737 435 839 1,02% 0,80% 0,98%40 Electricity and
heat 5 080 328 883 208 5 963 536 13,53% 13,10% 13,47%
41 Water 0 23 400 23 400 0,00% 0,35% 0,05%45 Construction 719 408 248 408 966 0,00% 6,05% 0,92%50 Maintenance
of vehicles 2 536 958 254 905 2 791 863 6,76% 3,78% 6,30%
55 Hotel and restaurants
1 046 058 97 000 1 143 057 2,79% 1,44% 2,58%
60 Land transport
826 119 453 842 1 279 962 2,20% 6,73% 2,89%
61 Sea transport 188 905 2 321 191 226 0,50% 0,03% 0,43%62 Air transport 410 423 322 170 732 592 1,09% 4,78% 1,65%63 Travel
agencies 778 317 51 880 830 197 2,07% 0,77% 1,87%
64 Post and telecom
269 658 121 077 390 735 0,72% 1,80% 0,88%
65 Finance services
56 068 1 670 57 738 0,15% 0,02% 0,13%
66 Insurance 103 323 2 678 106 001 0,28% 0,04% 0,24%67 Activities
auxiliary to financial intermediation
5 380 0 5 380 0,01% 0,00% 0,01%
70 Housing 2 414 801 436 418 2 851 219 6,43% 6,47% 6,44%71 Car rentals 288 326 43 159 331 484 0,77% 0,64% 0,75%72 Computer
treatment 7 758 59 099 66 857 0,02% 0,88% 0,15%
73 R & D 0 9 774 9 774 0,00% 0,14% 0,02%74-75 Defence,
Social insurance
33 858 338 248 372 106 0,09% 5,02% 0,84%
80 Education 30 253 141 003 171 257 0,08% 2,09% 0,39%85 Health care 155 996 253 899 409 895 0,42% 3,76% 0,93%90 Waste
treatment 0 21 772 21 772 0,00% 0,32% 0,05%
92 Recreation 259 786 3 557 263 344 0,69% 0,05% 0,59%93 Other service 167 299 28 896 196 194 0,45% 0,43% 0,44%95-99 Embassies
and intern. Organisations
15 8 24 0,00% 0,00% 0,00%
Total 37 536 160 6 744 119 44 280 279 100,00% 100,00% 100,00% In Table 4, the energy use for private and public consumption is shown by product NACE. The direct energy use of fossil fuels and of bio-fuels have been allocated to NACE 23 (petroleum products) and NACE 2 (forest products) respectively. The total energy use of Private and Public consumption in Sweden is around 700 000 TJ. Private consumption is by far the largest energy user (about 85% of the energy use is connected to private consumption). Petroleum products (NACE23), Electricity and heat (NACE40) together

27
with Food (NACE15-16) are the three largest products group with almost 60% of the total private and public consumption. As shown in Table 3, the categories Petroleum products, Electricity and heat and Food are also associated with the largest share of carbon dioxide emissions. For private consumption it can be noted that that forest products represents about 6% of energy use products (i.e. Biomass for fuels). The mix within Public consumption to some extent differs from the Private consumption. For the total Petroleum products (NACE 23) together with Electricity and heating (NACE 40) represents the largest shares. However, for Public consumption these are then followed by energy use in Housing (NACE 70) and Land transport (NACE 60) with approximately the same magnitude of TJ used. The large share of energy use for housing is explained by heating of public places of work. There are few product groups where the energy use by Public consumption exceeds the Private Consumption in absolute TJ. However, it can be seen in categories such as paper Paper (NACE 21), Construction (NACE 45), Social Insurance-Defence (NACE 74-75) and Education and Health (NACE 80 + NACE 85) The fact that there is no energy use for products of water (NACE 41) and waste treatment (NACE 90) in Private consumption is a result of that this is already included in the Housing (NACE 70), because of national accounting standards. Thus water provision and waste management are seen as functions of housing, that land-lords buy from the industries. Table 4. Energy use, for private and public consumption, by NACE 2002 [TJ]
Private
consumption[TJ]
Public consumption
[TJ]
Total P&P [TJ]
Private C Public C P&P
01 Agricultural products
15 573 609 16 182 2,60% 0,57% 2,29%
02 Forest products 38 599 921 39 520 6,44% 0,86% 5,59%05 Fish 2 842 131 2 973 0,47% 0,12% 0,42%10+11+12 Peat 125 0 125 0,02% 0,00% 0,02%13-14 Stone, sand and
gravel 61 386 447 0,01% 0,36% 0,06%
15-16 Food 60 603 4 805 65 408 10,11% 4,50% 9,26%17 Textiles 2 659 843 3 503 0,44% 0,79% 0,50%18 Clothes 4 649 217 4 865 0,78% 0,20% 0,69%19 Leather
merchandise 2 185 209 2 394 0,36% 0,20% 0,34%
20 Wood, cork 636 201 837 0,11% 0,19% 0,12%21 Paper 1 159 2 048 3 206 0,19% 1,92% 0,45%22 Publishing 3 159 1 744 4 903 0,53% 1,63% 0,69%23 Petroleum
products 202 915 20 886 223 801 33,84% 19,58% 31,68%
24 Chemicals 4 388 4 310 8 698 0,73% 4,04% 1,23%25 Rubber and
plastics 985 980 1 964 0,16% 0,92% 0,28%
26 Glass and glass fiber
1 086 573 1 659 0,18% 0,54% 0,23%
27 Steel and metall 65 253 319 0,01% 0,24% 0,05%28 Metal goods 728 735 1 463 0,12% 0,69% 0,21%29 Machines 1 026 899 1 925 0,17% 0,84% 0,27%30 Computers 348 81 429 0,06% 0,08% 0,06%31 Electronics 887 343 1 230 0,15% 0,32% 0,17%32 Telephones 1 496 823 2 319 0,25% 0,77% 0,33%33 Watches, clocks 329 1 177 1 506 0,05% 1,10% 0,21%

28
Table 4, Continuation. Energy use, for private and public consumption, by NACE 2002 [TJ]
Private
consumption[TJ]
Public consumption
[TJ]
Total P&P [TJ]
Private C Public C P&P
34 Motor vehicles 8 374 62 8 436 1,40% 0,06% 1,19%35 Other vehicles 1 324 1 520 2 843 0,22% 1,42% 0,40%36 Furniture 6 373 858 7 230 1,06% 0,80% 1,02%40 Electricity and
heat 100 018 17 385 117 403 16,68% 16,30% 16,62%
41 Water 0 343 343 0,00% 0,32% 0,05%45 Construction 8 4 688 4 696 0,00% 4,39% 0,66%50 Maintenance of
vehicles 36 901 3 708 40 608 6,15% 3,48% 5,75%
55 Hotel and restaurants
14 940 1 385 16 325 2,49% 1,30% 2,31%
60 Land transport 12 202 6 463 18 666 2,03% 6,06% 2,64%61 Sea transport 2 498 31 2 529 0,42% 0,03% 0,36%62 Air transport 5 697 4 472 10 169 0,95% 4,19% 1,44%63 Travel agencies 10 939 731 11 669 1,82% 0,68% 1,65%64 Post and
telecom 4 069 1 817 5 886 0,68% 1,70% 0,83%
65 Finance services 843 25 868 0,14% 0,02% 0,12%66 Insurance 1 618 42 1 660 0,27% 0,04% 0,23%67 Activities
auxiliary to financial intermediation
80 0 80 0,01% 0,00% 0,01%
70 Housing 33 337 6 482 39 818 5,56% 6,08% 5,64%71 Car rentals 4 113 616 4 729 0,69% 0,58% 0,67%72 Computer
treatment 115 876 991 0,02% 0,82% 0,14%
73 R & D 0 138 138 0,00% 0,13% 0,02%74-75 Defence, Social
insurance 496 5 010 5 506 0,08% 4,70% 0,78%
80 Education 466 2 172 2 638 0,08% 2,04% 0,37%85 Health care 2 392 3 889 6 281 0,40% 3,65% 0,89%90 Waste treatment 0 323 323 0,00% 0,30% 0,05%92 Recreation 3 996 55 4 051 0,67% 0,05% 0,57%93 Other service 2 396 414 2 810 0,40% 0,39% 0,40%TOTAL 599 697 106 677 706 374 100,00% 100,00% 100,00%
5.3 IPP-indicators for private consumption by purpose In Table 5 the indirect and direct CO2-emissions for private consumption by purpose are listed. The emissions are connected to the use of different fuels, but also electricity, heating, district heating and food such as meat, milk and bread. Two factors are important in this, both the intensity (emissions per Euro) and the amount of products that is bought. Other disaggregations would of course give different listing of which products are most intensive. Looking at the data by purpose it is easier to see the allocation depending on the volume of consumption (the amount bought). However, there is need for some caution as the underlying environmental data is by industry. That is, the environmental data for the food sector does not separate between food coming from different agricultural practices, but constitute the footprint of the agriculture in the nation and in imported goods as two parts. Still, the merit is that the amounts bought are also of great importance for the environmental impact of the consumption and can be seen in the data.

29
Table 5. Carbon dioxide emissions by purpose, Swedish private consumption 2002, (tonnes). Tonnes CO2 Percent CO201.1.1 Bread and cereals 595 013 2%01.1.2 Meat 945 185 3%01.1.3 Fish 859 955 2%01.1.4 Milk, cheese and eggs 955 051 3%01.1.5 Oils and fats 129 196 0%01.1.6 Fruit 342 806 1%01.1.7 Vegetables 606 097 2%01.1.8 Sugar and confectionery 426 840 1%01.1.9 Food products n.e.c. 191 496 1%01.2.1 Coffee, tea and cocoa 152 091 0%01.2.2 Soft drinks, juices 303 874 1%02.1.1 Spirits 49 123 0%02.1.2 Wine 125 438 0%02.1.31 Beer strong 73 340 0%02.1.32 Beer light 90 926 0%02.2.0 Tobacco 103 334 0%03.1 Clothing 749 443 2%03.2 Footwear 159 874 0%04.1 Actual rentals for housing 1 382 798 4%04.2. Rentals cottages 1 030 804 3%04.3 Maintenance & repair of dwelling 73 980 0%04.5.1 Electricity 3 365 966 9%04.5.2 Gas 26 250 0%04.5.3 Liquid fuels 3 558 602 9%04.5.4 Solid fuels 20 080 0%04.5.5 Heat energy 1 688 112 4%5 Furnishings & household eq. 1 015 982 3%6 Health 295 041 1%07.1 Purchase of vehicles 769 851 2%07.2 Operation of vehicles 11 642 089 31%07.3 Transport services 1 419 397 4%08.1 Postal, telephone, telefax services 40 150 0%09.1-09.2 Media Equipment and musical instrument 597 682 2%09.3-09.6 Games and hobbies 2 005 563 5%10 Education 3 758 0%11.1 Catering services 902 485 2%11.2 Accommodation services 143 572 0%12. Personal care 694 914 2% Total 37 536 160 100% InTable 6 the indirect energy use for private consumption is presented by purpose. For district heating the largest category is housing.

30
Table 6. The fuel, electricity and distance heating use for private consumption, 2002 [TJ].
Fuel[TJ] Percent
Electricity [TJ] Percent
District heating
TJ Percent01.1.1 Bread and cereals 17 849 2% 3 925 1% 546 0%01.1.2 Meat 27 334 2% 5 005 2% 678 1%01.1.3 Fish 21 957 2% 1 407 0% 340 0%01.1.4 Milk, cheese and
eggs 27 820 2% 4 864 2% 798 1%01.1.5 Oils and fats 4 183 0% 854 0% 116 0%01.1.6 Fruit 9 834 1% 1 643 1% 177 0%01.1.7 Vegetables 17 442 2% 2 870 1% 311 0%01.1.8 Sugar and
confectionery 12 818 1% 2 896 1% 441 0%01.1.9 Food products
n.e.c. 5 660 0% 1 172 0% 145 0%01.2.1 Coffee, tea and
cocoa 4 520 0% 906 0% 113 0%01.2.2 Soft drinks, juices 8 887 1% 1 835 1% 257 0%02.1.1 Spirits 1 429 0% 316 0% 47 0%02.1.2 Wine 3 647 0% 851 0% 121 0%02.1.31 Beer strong 2 136 0% 483 0% 72 0%02.1.32 Beer light 2 648 0% 578 0% 89 0%02.2.0 Tobacco 3 074 0% 792 0% 102 0%03.1 Clothing 22 172 2% 6 465 2% 977 1%03.2 Footwear 5 066 0% 1 650 1% 359 0%04.1 Actual rentals for
housing 41 360 4% 9 807 3% 14 515 11%04.2. Rentals cottages 25 279 2% 6 168 2% 726 1%04.3 Maintenance &
repair of dwelling 2 015 0% 625 0% 84 0%04.5.1 Electricity 132 653 11% 169 379 56% 284 0%04.5.2 Gas 183 383 16% 212 0% 7 0%04.5.3 Liquid fuels 189 888 16% 1 595 1% 75 0%04.5.4 Solid fuels 39 414 3% 180 0% 44 0%04.5.5 Heat energy 66 584 6% 4 262 1% 94 924 75%5 Furnishings &
household eq. 30 663 3% 9 581 3% 1 343 1%6 Health 8 854 1% 2 881 1% 718 1%07.1 Purchase of
vehicles 20 585 2% 7 494 2% 1 145 1%07.2 Operation of
vehicles 47 538 4% 11 631 4% 958 1%07.3 Transport services 40 622 4% 9 245 3% 481 0%08.1 Postal, telephone,
telefax services 1 179 0% 340 0% 59 0%09.1-09.2 Media equipment
and musical instrument 17 589 2% 5 671 2% 803 1%
09.3-09.6 Games and hobbies 58 932 5% 13 119 4% 1 846 1%
10 Education 118 0% 59 0% 15 0%11.1 Catering services 25 778 2% 6 200 2% 1 191 1%11.2 Accommodation
services 4 101 0% 987 0% 190 0%12. Personal care 20 956 2% 7 104 2% 1 860 1% Total 1 155 968 100% 305 051 100% 126 957 100%

31
5.4 Time series By looking at the emissions for a longer time period, the importance of yearly variations is seen (Figure 3 and 4).The variations can be due to factors such as business cycles, depending on prices of goods and of world market behavior. They can also be due to weather conditions, where cold periods may demand more peak energy which is often of fossil origin. The amount of rain and snow is also of importance for the potential for hydro power. The indirect emissions that are connected to the goods and services bought are of importance when compared with the direct emissions from heating houses (stationary) and from transports (mobile). For both public and private consumption a trend of decreasing emissions of fossil carbon dioxide emissions, mainly in the stationary emissions can be seen. This can be due to a shift of fuels from oil to more biofuel and heat pumps. It can also be an effect of a gradually warmer climate. The public consumption has around seven million tons of carbon dioxide connected to it. The size shows the potential for green procurement. As was noted in chapter 5.3 the profile of public spending and private spending is in some cases different, and there are some areas such as defense where the public consumption is of vast importance.
0
1 000 000
2 000 000
3 000 000
4 000 000
5 000 000
6 000 000
7 000 000
8 000 000
9 000 000
1993
1995
1997
1999
2001
Indirect
Direct emissions mobile
Direct emissionsstationary
Figure 3. The indirect and direct carbon emissions from public consumption from 1993-2002 [tonnes]. The private consumption stands for between 36 and 44 million tonnes per year during this time period or between 4 and 5 tonnes of carbon emission per person and year. For private consumption the indirect emissions are also of great importance (Figure 4). The direct emissions from transport and heating houses are around 15 million tonnes.

32
05 000 000
10 000 00015 000 00020 000 00025 000 00030 000 00035 000 00040 000 00045 000 00050 000 000
1993
1995
1997
1999
2001
IndirectDirect emissions mobileDirect emissions stat
Figure 4.The indirect and direct carbon emissions from private consumption from 1993-2002 [tonnes]. As can be seen in figure 5 meat, milk, cheese and eggs are large groups among the food products. Also fish, bread and vegetables can be noted. Food in general is connected to emissions of around 5 million tones of carbon dioxide or 0,5 tonnes per capita.
0
1 000 000
2 000 000
3 000 000
4 000 000
5 000 000
6 000 000
1993
1995
1997
1999
2001
Food products n.e.c.Sugar and confectionery Vegetables Fruit Oils and fats Milk, cheese and eggs Fish Meat Bread and cereals
Figure 5. The carbon emissions for producing food from 1993-2002, [tonnes].

33

34
6. Discussion The data show how environmental pressure and resource use can be connected to the consumption of goods and services. By comparing the different policy initiatives with these product groups it is possible to see how important the IPP- initiatives can become in a total consumption perspective. The categories of transport, housing and food are of evident importance. The economic goals are to increase the GDP leading to increasing consumption. The key question for IPP policies is how to decouple the increasing economic consumption from the corresponding environmental pressure and energy use. Such decoupling can be accomplished in different ways: by switching to less carbon intensive fuels, by consuming services rather than goods, by efficiency measures etc. Partly, the energy use in a country such will also vary between years due to weather conditions as will the availability of hydro power. This method makes it possible to see the potential for green procurement as it explicitly shows the environmental pressure from public consumption. It can also be seen how public and private consumption differ and thereby serve as information for policy makers on how to best device IPP measures, as well as to follow up on the results of the policies. The underlying data comes from many different sources, and are based both on questionnaires to involved industries, but also on emission factors for CO2-content in fuels and model assumptions for smaller enterprises. The data quality is good in the respect that the data is generated every year and that the methods and coverage is as good as the economic standards in the national accounts demand. Comparability between nations is also possible due to international classifications of industries, fuels, emission inventories and product groups. However, it is wise to treat the absolute figures with caution, and concentrate on comparisons between groups of products and between years. Compared to the results of Weidema et al. 2005 and EIPRO, the general pattern is the same. However, the level of the total environmental pressure in these studies has not been available for comparison. The lack of European data of broad and detailed data on environmental impacts of economic activities is also highlighted in the conclusions of the EIPRO-study (Tukker et al., 2005). The energy mix in Sweden is not typical in a European sense in that it has more biofuels for heating (approximately one fourth of the fuels are biofuels) but also more district heating. The electricity is mainly generated by hydro power and nuclear power. Thus the energy system is relatively low in carbon dioxide emissions As mentioned before, the availability of international data is still not sufficient to really produce the kind of indicators we have presented here for the whole of EU or for a single member state with accurate calculations of the environmental pressures caused in other countries. Basically three sources of data would need to be completed or developed further:
• Symmetric Input-Output tables for all member states, which is something that most have committed to, and eventually will be, delivering every 5 years.
• Environmental Accounts data for energy use, emissions and other data in the harmonized
system, which most have agreed on. Data is available but not for all member states at 2-digit NACE level to link into the IO tables.

35
• Trade data for single country, bilateral and multilateral trade analysis of environmental pressures caused among trading partners. EU-wide analysis of trade with the rest of the world is probably easier to come by.
In future projects the potential importance of investments have to be further elaborated. Investments would ideally be handled specifically in the analysis and the indicators. Gross investments are classified as final demand but a part of this, e.g. replacements, could be attributed to the production of goods and services in the current year. This would mean a reallocation of indirect emissions from gross investments to the other components of final demand. In this project however, it has not been possible to do this reallocation.
36
7. Conclusions The indicators show how environmental pressure and resource use can be connected to the consumption of goods and services. By comparing the different policy initiatives with these product groups it is possible to see how important the IPP- initiatives can become in a total consumption perspective. The categories of transport, housing and food are of evident importance. An advantage of this method is that it is designed for regular updating with standard statistics. By looking at the emissions over a time period, the importance of yearly variations is seen .The variations can be due to factors such as business cycles, depending on prices of goods and of world market behavior. They can also be due to weather conditions, where cold periods may demand more peak energy which is often of fossil origin. The indirect emissions that are connected to the goods and services bought are of importance when compared with the direct emissions from heating houses and from transports. For both public and private consumption a trend of decreasing emissions of fossil carbon dioxide emissions, mainly in the stationary emissions can be seen. The private consumption stands for between 36 and 44 million tonnes per year during 1993-2002 or between 4 and 5 tonnes of carbon emission per person and year. The direct emissions from transport and heating houses are around 15 million tonnes. Meat, milk, cheese and eggs are large groups among the food products. Food in general is connected to emissions of around 5 million tones of carbon dioxide or 0,5 tonnes per capita. The public consumption has around seven million tons of carbon dioxide connected to it. The size shows the potential for green procurement. The profile of public spending and private spending is in some cases different, and there are some areas such as defense where the public consumption is of vast importance. The underlying data comes from many different sources, and are based both on questionnaires to involved industries, but also on emission factors for CO2-content in fuels and model assumptions for smaller enterprises. The data quality is good in the respect that the data is generated every year and that the methods and coverage is as good as the economic standards in the national accounts demand. Comparability between nations is also possible due to international classifications of industries, fuels, emission inventories and product groups. In order to get good data also on the imported products and goods, more environmental accounts data is needed. The discussions on making a regulation for this type of statistics is a clear example of something that could rapidly increase the availability of country data in the EU. Basically three sources of data would need to be completed or developed further:
• Symmetric Input-Output tables for all member states.
• Environmental Accounts data for energy use, emissions and other data in the harmonized system.
• Trade data for single country, bilateral and multilateral trade analysis of environmental
pressures caused among trading partners.
37
8. References Ahmad, N.(2003) A framework for estimating carbon dioxide emissions embodied in international trade of goods, STD/SD/WAF (2003)20. In Workshop for Accounting Frameworks in Sustainable Development, Château de la Muette, Paris, France, Organisation for Economic Co-operation and development. Ahmad, N. and Wyckoff, A.(2003) Carbon dioxide emissions embodied in international trade of goods.DSTI/DOC 2003(15). Organisation for Economic Co-operation and Development, Paris. France. Charter, M. (2001).: Integrated Product Policy (IPP) and Eco-Product Development (EPD). In Christiansen, S., Horup, M. and Jensen, A.A. (Eds.): Proceedings of the 1st international conference on Life Cycle Management, Copenhagen, August 27-29. DK Teknik, Copenhagen. Commission of the European Communities (2003) Integrated Product Policy, Building on Environmental Life-Cycle Thinking. Communication from the Commission to the Council and the European Parliament. COM (2003) 302 final. Brussels. Commissions web-site on IPP: http://europa.eu.int/comm/environment/ipp/pdf/ta_indicators.pdf, visited 21/02/2006 de Haan, M. and Kee, P. (2002) Accounting for sustainable development: The NAMEA-based approach. Statistics Netherlands, Voorburg. Division of macro-economic Statistics and Dissemination. Working paper. Eurostat (1996) Statistical classification of economic activities in the European Community, Luxemburg. Finnveden, G., Johansson, J., Moberg, Å., Palm, V. and Wadeskog, A. with contributions from Suh, S. and Huppes, G. (2001) Miljöpåverkan från olika varugrupper. (In Swedish). Gustafsson, T. (2005). Improved structures for uncertainty analysis in the Swedish Greenhouse Gas Emission Inventory. Draft report. Swedish Methodology for Environmental Data. Statistics Sweden. Hammer Strömman, A. Gauteplass, A. (2004) Domestic fractions of emissions in linked economies. Working paper no 4./2004. NTNU Trondheim, Norway. Hellsten, E., Ribacke, S. and Wickbom, G. (1999) SWEEA—Swedish environmental and economic accounts, Structural Change and Economic Dynamics, 10, 39–72. Hertwich, E., Erlandsen, K., Sörensen, K, Aasness, J., Hubacek, K., November 2002. Pollution embodied in Norway's import and export and its relevance for the environmental profile of households. In: Hertwich, E. (Ed.), Life-cyxle Apporoaches to Sustainable Consumption Workshop Proceedings. Interim report IR-02-073. International Institute for Applied Systems Analysis, Laxenburg, Austria, pp.63-72.

38
Hubacek, K. and Giljum S. (2003). Applying physical input-output analysis to estimate land appropriation (ecological footprints) of international trade activities. Ecological Economics 44, 137-151. Isacsson, A., Jonsson, K., Linder, I., Palm, V. and Wadeskog, A (2000) Material Flow Accounts Direct Material Inputs (DMI) and Domestic Material Consumption (DMC) for Sweden 1987-1997. Eurostat Working paper. Kuening, S.J., and de Haan, M.(1996) Taking the Environment into Account: The NAMEA Approach, Review of Income and Wealth, 42, No. 2, 131-148. Kuening, S.J., van Dalen, J. and de Haan, M. (1999) The Netherlands’ NAMEA; presentation, usage and future extensions. Structural Change and Economic Dynamics, 10, No. 1 (March), 15-37. Kondo, Y., Moriguchi, Y., Shimizu, H., (1998). CO2 Emissions in Japan: Influences of Imports and Exports, Applied Energy 59 (2-3):163-174. Lenzen, M. (1998) Primary energy and greenhouse gases embodied in Australian final consumption: an input-output analysis, Energy Policy 26 (6):495-506. Lenzen, M., Pade L.-L. and Munksgaard J. (2004) CO2 multipliers in multi-region input-output models. Economic Systems Research 16(4): 391-412. Leontief, W. (1986) Input-Output Economics (2:nd Ed), Oxford University Press. MIR2002:2 Environmental Impact of Swedish Trade, MIR 2002:2. Statistics Sweden (2002) available at www.scb.se/mi1301-en, under publications. MIR2003:3 Indikatorer för hållbar utveckling - baserade på miljöekonomisk och social statistik. available at www.scb.se/mi1301-en, under publications. MIR2003:4 Environmental subsidies - a review of subsidies in Sweden between 1993 and 2000. Larsson, M. and Palm, V. available at www.scb.se/mi1301-en, under publications. MIR2004:1 Social statistics by industry. Villner, M., Larsson, M. and Palm, V. available at www.scb.se/mi1301-en, under publications. MIS 2001:1 Quality definition and recommendations for quality declarations of official statistics. Statiatiscs Sweden, 2001 Muradian, R., O’Connor, M. Martinez-Alier, J. (2002) Embodied pollution in trade: estimating the “environmental load displacement” of industrialised countries. Ecological Economics 41:51-67. Munksgaard, J., Block Christoffersen, L., Wier, M., Jensen, T. S., Gravgaard, O. and Kieding H. , 2005. An environmental performance index for Products: How to take Damage Costs into Consideration. at www.sanken.keio.ac.jp/papaios/iioa/conf/2005/paper/munksgaard.pdf december 2005. MIS 2001:1 Quality definition and recommendations for quality declarations of official statistics. Statiatiscs Sweden, 2001.
39
Palm, V. (2001) Uses of Environmental Accounts in Sweden. Eurostat 2/2001/B/1. Available at www.scb.se/mi1301-en, under publications. Palm V., Wadeskog A. and Finnveden G. (2005) Swedish experiences of using environmental accounts data for integrated product policy (IPP) issues. Submitted to Journal of Industrial Ecology SEEA (1993) Integrated Environmental and Economic Accounting. Studies in methods. Handbook on national accounting. Series F, N0.61. United Nations, New York SEEA (2003) Integrated Environmental and Economic Accounting 2003. United Nations, European Commission, International Monetary Fund, Organisation for Economic Cooperation and Development, World Bank. http://unstats.un.org/unsd/envAccounting/seea2003.pdf September 2005. Sjölin, M., Palm, V och Wadeskog,A. (2000). Miljöskatter och miljöskadliga subventioner. MIR 2000:3. SCB (Environmental taxes and environmentally damaging subsidies) Available at www.scb.se/mi1301-en, under publications. Straumann, R.(2003) Exporting pollution? Calculating the embodied emissions in trade for Norway. Statistics Norway, Report 2003/17. Oslo-Kongsvinger. Swedish EPA (2002) Kunskap om produkters miljöpåverkan –vad ger dagens statistik? Rapport 5231. Naturvårdsverket, Stockholm Tukker A., Huppes, G., Guinée, J., Heijungs, R., de Koning, A., van Oers, L., Suh S., Geerken, T., Van Holderbeke, Jansen, M. and Nielsen, P. (2005) Environmental Impact of Products (EIPRO) – Analysis of the life cycle environmental impacts related to the final consumption of the EU25. UN (1996) Handbook of Input-Output Table Compilation and Analysis, United Nations, New York. UN, 2000. Integrated Environmental and Economic Accounting: An Operational Manual. Series F, NO.78. United Nations Statistics Division, New York. Weidema, B.P., Christiansen, K., Nielsen, A.M., Norris, G.A., Notten, P. Suh, S., Madsen, J (2005) Prioritisation within the integrated product policy. Environmental project no. 980. Copenhagen: Danish Environmental Protection Agency.
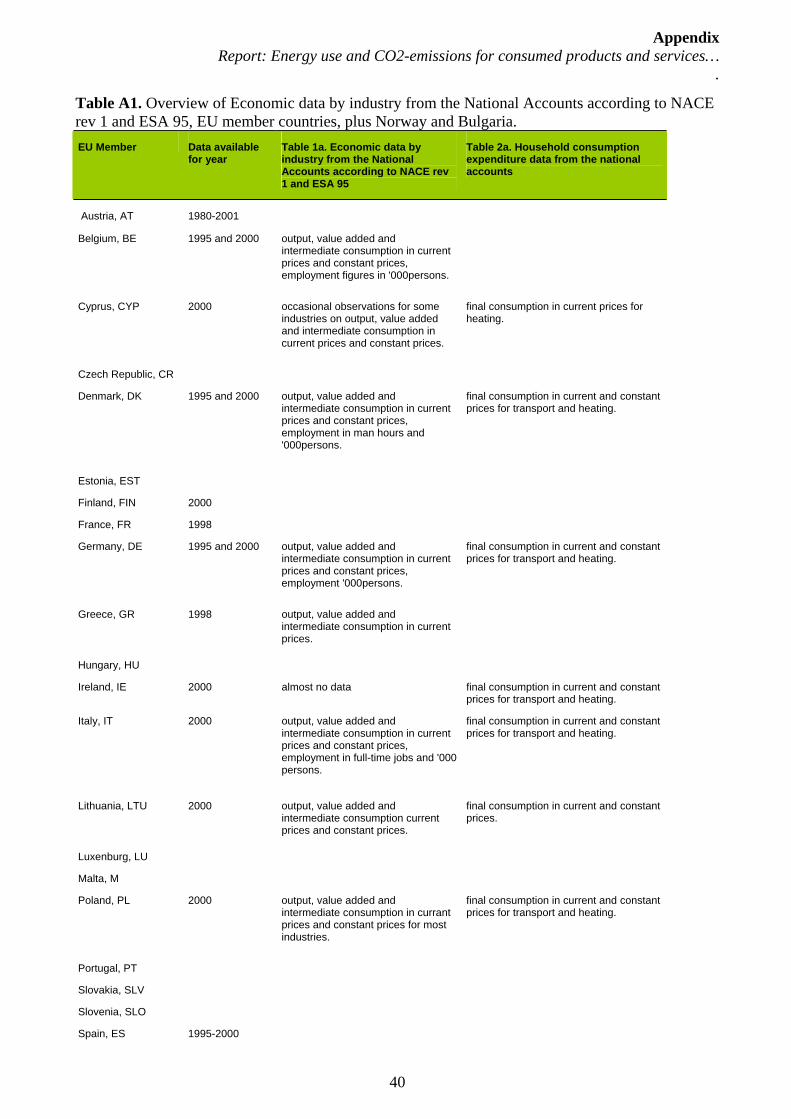
Appendix Report: Energy use and CO2-emissions for consumed products and services…
.
40
Table A1. Overview of Economic data by industry from the National Accounts according to NACE rev 1 and ESA 95, EU member countries, plus Norway and Bulgaria. EU Member Data available
for year Table 1a. Economic data by industry from the National Accounts according to NACE rev 1 and ESA 95
Table 2a. Household consumption expenditure data from the national accounts
Austria, AT 1980-2001
Belgium, BE 1995 and 2000 output, value added and intermediate consumption in current prices and constant prices, employment figures in '000persons.
Cyprus, CYP 2000 occasional observations for some industries on output, value added and intermediate consumption in current prices and constant prices.
final consumption in current prices for heating.
Czech Republic, CR
Denmark, DK 1995 and 2000 output, value added and intermediate consumption in current prices and constant prices, employment in man hours and '000persons.
final consumption in current and constant prices for transport and heating.
Estonia, EST
Finland, FIN 2000
France, FR 1998
Germany, DE 1995 and 2000 output, value added and intermediate consumption in current prices and constant prices, employment '000persons.
final consumption in current and constant prices for transport and heating.
Greece, GR 1998 output, value added and intermediate consumption in current prices.
Hungary, HU
Ireland, IE 2000 almost no data final consumption in current and constant prices for transport and heating.
Italy, IT 2000 output, value added and intermediate consumption in current prices and constant prices, employment in full-time jobs and '000 persons.
final consumption in current and constant prices for transport and heating.
Lithuania, LTU 2000 output, value added and intermediate consumption current prices and constant prices.
final consumption in current and constant prices.
Luxenburg, LU
Malta, M
Poland, PL 2000 output, value added and intermediate consumption in currant prices and constant prices for most industries.
final consumption in current and constant prices for transport and heating.
Portugal, PT
Slovakia, SLV
Slovenia, SLO
Spain, ES 1995-2000
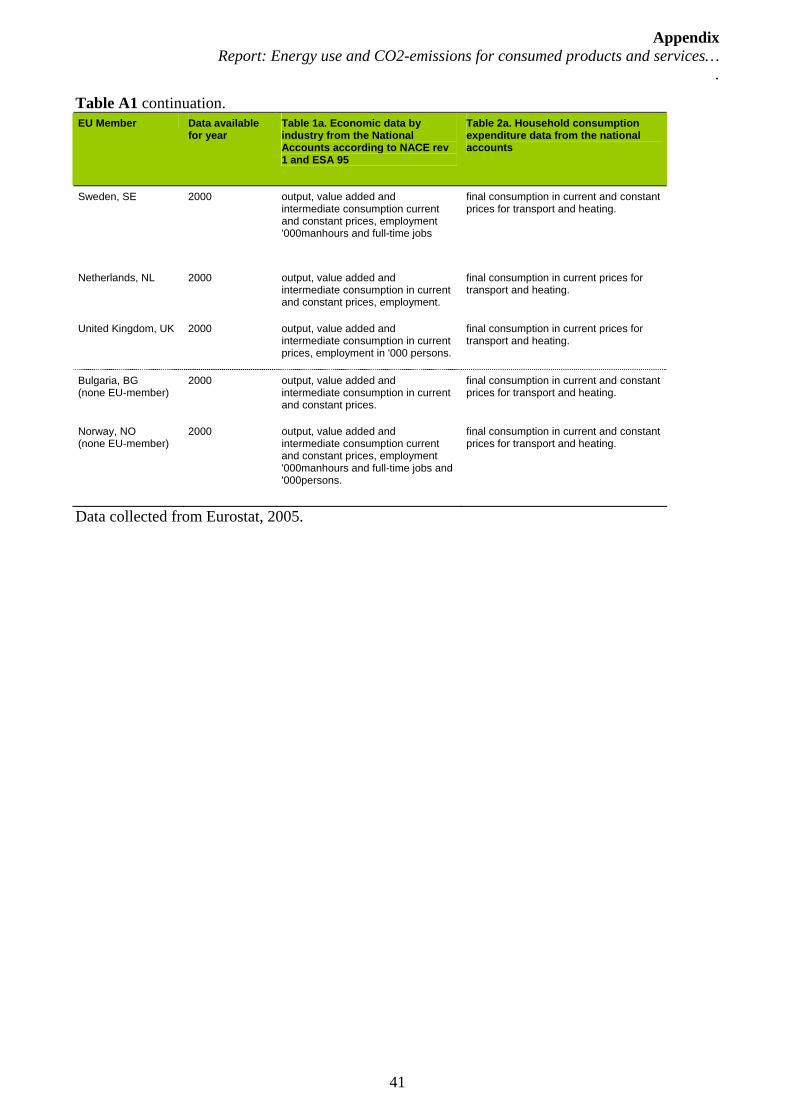
Appendix Report: Energy use and CO2-emissions for consumed products and services…
.
41
Table A1 continuation. EU Member Data available
for year Table 1a. Economic data by industry from the National Accounts according to NACE rev 1 and ESA 95
Table 2a. Household consumption expenditure data from the national accounts
Sweden, SE 2000
output, value added and intermediate consumption current and constant prices, employment '000manhours and full-time jobs
final consumption in current and constant prices for transport and heating.
Netherlands, NL 2000 output, value added and intermediate consumption in current and constant prices, employment.
final consumption in current prices for transport and heating.
United Kingdom, UK 2000 output, value added and intermediate consumption in current prices, employment in '000 persons.
final consumption in current prices for transport and heating.
Bulgaria, BG (none EU-member)
2000 output, value added and intermediate consumption in current and constant prices.
final consumption in current and constant prices for transport and heating.
Norway, NO (none EU-member)
2000 output, value added and intermediate consumption current and constant prices, employment '000manhours and full-time jobs and '000persons.
final consumption in current and constant prices for transport and heating.
Data collected from Eurostat, 2005.

Appendix Report: Energy use and CO2-emissions for consumed products and services…
.
42
Table A2. Overview of NAMEA air emission data in EU member countries, cf. Table 2 in the main report for a quick overview of some key emission parameters. Please observe that notes about the data are not included in the table. (Data is collected from Eurostat, however only data on CO2, CH4 and N2O for year 2000 has been controlled by Eurostat). EU Member Data
available for year
Table 1b. Air emission according to Nace rev 1 and NAMEA definitions Table 1bt. Air emissions from transport activities
Table 2b. Household air emissions according to NAMEA definitions.
1st Priority (CO2, of which CO2 from biomass as fuel, N20, CH4, HFCs, PFs, SF6)
2nd Priority (NOx, SOx, NH3, NMVOC, CO, PM10, CFCs, HFCFs)
3rd Priority (As, Hg, Pb, Zn, Cd, Cr, Se, Cu, Ni)
for a list of parameters cf. heading 'Table 1b' - all priorities.
for list of parameters cf. heading 'Table 1b' - all priorities.
Austria, AT 1980-2001 CO2, N2O NOx, SO2, NH3, NMVOC, CO, NH4,
Belgium, BE 1995 and 2000
CO2, N20, CH4, HFCs, SF6
NOx, SOx, NH3, NMVOC, CO, CFCs, HFCFs
CO2, N2O, CH4, NOx, SOx, NH3, NMVOC, CO, CFCs, HCFs [1995 only]
Cyprus, CYP 2000 NOx, SOx, NH3, NMVOC, CO [for some industries]
Pb [for some industries] NOx, SO2, NMVOC, CO from heating
Czech Republic, CR No data Denmark, DEN 1995 and
2000 CO2, of which CO2 from biomass as fuel, N20, CH4.
NOx, SOx, NH3, NMVOC, CO
CO2, N2O, NOx, SO2, NMVOC, CO [2000 only]
CO2, of which CO2 from biomass as fuel, N2O, CH4, NOx, SOx, NH3, NMVOC, CO [2000 only]
Estonia, EST No data Finland, FIN 2000 CO2, of which CO2 from
biomass as fuel, N20, CH4, (HFCs, PFs, SF6 only total)
NOx, SOx, NMVOC, CO, PM10
France, FR 1998 (2000) CO2, N20, CH4 Estimations by Eurostat
NOx, SOx, NH3, NMVOC, CO
CO2, N2O, CH4, NOx, SOx, NH3, NMVOC, CO
Germany, DE 1995 and 2000
CO2, N20, CH4 NOx, SOx, NH3, NMVOC, CO, PM10
CO2, N2O, NOx, SO2, NMVOC, CO, PM10 [2000 only]
CO2, N2O, CH4, NOx, SOx, NH3, NMVOC, CO, PM10 [only totals for 2000]
Greece, G 1998 Estimations by Eurostat on CO2, N20, CH4
NOx, SOx, NMVOC, CO CO2, N2O, CH4, NOx, SOx, NMVOC, CO
Hungary, H No data
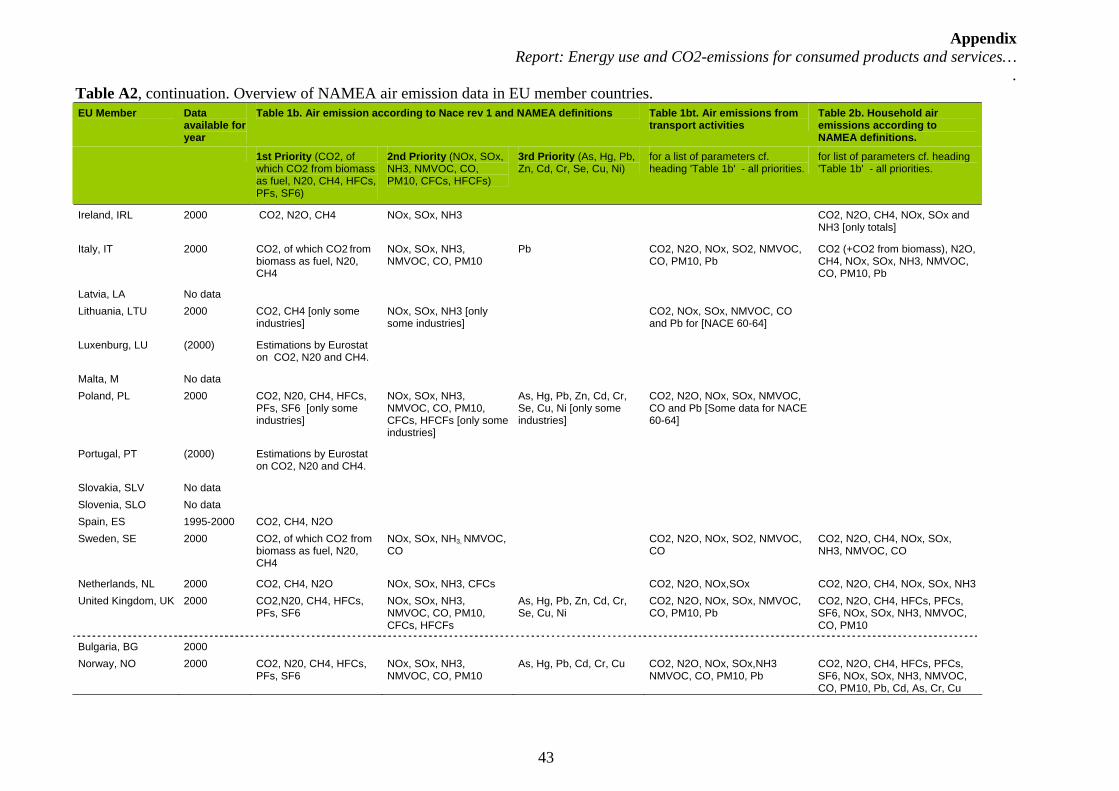
Appendix Report: Energy use and CO2-emissions for consumed products and services…
.
43
Table A2, continuation. Overview of NAMEA air emission data in EU member countries. EU Member Data
available for year
Table 1b. Air emission according to Nace rev 1 and NAMEA definitions Table 1bt. Air emissions from transport activities
Table 2b. Household air emissions according to NAMEA definitions.
1st Priority (CO2, of which CO2 from biomass as fuel, N20, CH4, HFCs, PFs, SF6)
2nd Priority (NOx, SOx, NH3, NMVOC, CO, PM10, CFCs, HFCFs)
3rd Priority (As, Hg, Pb, Zn, Cd, Cr, Se, Cu, Ni)
for a list of parameters cf. heading 'Table 1b' - all priorities.
for list of parameters cf. heading 'Table 1b' - all priorities.
Ireland, IRL 2000 CO2, N2O, CH4 NOx, SOx, NH3 CO2, N2O, CH4, NOx, SOx and NH3 [only totals]
Italy, IT 2000 CO2, of which CO2 from biomass as fuel, N20, CH4
NOx, SOx, NH3, NMVOC, CO, PM10
Pb CO2, N2O, NOx, SO2, NMVOC, CO, PM10, Pb
CO2 (+CO2 from biomass), N2O, CH4, NOx, SOx, NH3, NMVOC, CO, PM10, Pb
Latvia, LA No data Lithuania, LTU 2000 CO2, CH4 [only some
industries] NOx, SOx, NH3 [only some industries]
CO2, NOx, SOx, NMVOC, CO and Pb for [NACE 60-64]
Luxenburg, LU (2000) Estimations by Eurostat on CO2, N20 and CH4.
Malta, M No data Poland, PL 2000 CO2, N20, CH4, HFCs,
PFs, SF6 [only some industries]
NOx, SOx, NH3, NMVOC, CO, PM10, CFCs, HFCFs [only some industries]
As, Hg, Pb, Zn, Cd, Cr, Se, Cu, Ni [only some industries]
CO2, N2O, NOx, SOx, NMVOC, CO and Pb [Some data for NACE 60-64]
Portugal, PT (2000) Estimations by Eurostat on CO2, N20 and CH4.
Slovakia, SLV No data Slovenia, SLO No data Spain, ES 1995-2000 CO2, CH4, N2O Sweden, SE 2000 CO2, of which CO2 from
biomass as fuel, N20, CH4
NOx, SOx, NH3, NMVOC, CO
CO2, N2O, NOx, SO2, NMVOC, CO
CO2, N2O, CH4, NOx, SOx, NH3, NMVOC, CO
Netherlands, NL 2000 CO2, CH4, N2O NOx, SOx, NH3, CFCs CO2, N2O, NOx,SOx CO2, N2O, CH4, NOx, SOx, NH3 United Kingdom, UK 2000 CO2,N20, CH4, HFCs,
PFs, SF6 NOx, SOx, NH3, NMVOC, CO, PM10, CFCs, HFCFs
As, Hg, Pb, Zn, Cd, Cr, Se, Cu, Ni
CO2, N2O, NOx, SOx, NMVOC, CO, PM10, Pb
CO2, N2O, CH4, HFCs, PFCs, SF6, NOx, SOx, NH3, NMVOC, CO, PM10
Bulgaria, BG 2000 Norway, NO 2000 CO2, N20, CH4, HFCs,
PFs, SF6 NOx, SOx, NH3, NMVOC, CO, PM10
As, Hg, Pb, Cd, Cr, Cu CO2, N2O, NOx, SOx,NH3 NMVOC, CO, PM10, Pb
CO2, N2O, CH4, HFCs, PFCs, SF6, NOx, SOx, NH3, NMVOC, CO, PM10, Pb, Cd, As, Cr, Cu
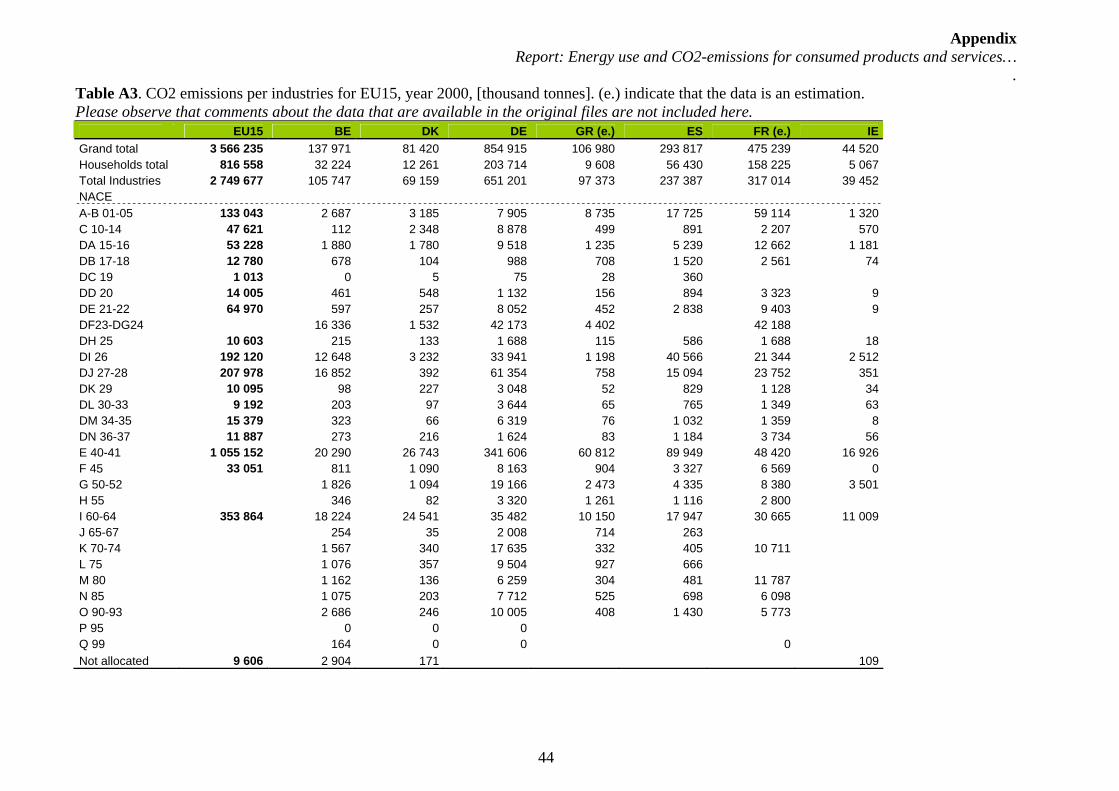
Appendix Report: Energy use and CO2-emissions for consumed products and services…
.
44
Table A3. CO2 emissions per industries for EU15, year 2000, [thousand tonnes]. (e.) indicate that the data is an estimation. Please observe that comments about the data that are available in the original files are not included here. EU15 BE DK DE GR (e.) ES FR (e.) IEGrand total 3 566 235 137 971 81 420 854 915 106 980 293 817 475 239 44 520Households total 816 558 32 224 12 261 203 714 9 608 56 430 158 225 5 067Total Industries 2 749 677 105 747 69 159 651 201 97 373 237 387 317 014 39 452NACE A-B 01-05 133 043 2 687 3 185 7 905 8 735 17 725 59 114 1 320C 10-14 47 621 112 2 348 8 878 499 891 2 207 570DA 15-16 53 228 1 880 1 780 9 518 1 235 5 239 12 662 1 181DB 17-18 12 780 678 104 988 708 1 520 2 561 74DC 19 1 013 0 5 75 28 360 DD 20 14 005 461 548 1 132 156 894 3 323 9DE 21-22 64 970 597 257 8 052 452 2 838 9 403 9DF23-DG24 16 336 1 532 42 173 4 402 42 188 DH 25 10 603 215 133 1 688 115 586 1 688 18DI 26 192 120 12 648 3 232 33 941 1 198 40 566 21 344 2 512DJ 27-28 207 978 16 852 392 61 354 758 15 094 23 752 351DK 29 10 095 98 227 3 048 52 829 1 128 34DL 30-33 9 192 203 97 3 644 65 765 1 349 63DM 34-35 15 379 323 66 6 319 76 1 032 1 359 8DN 36-37 11 887 273 216 1 624 83 1 184 3 734 56E 40-41 1 055 152 20 290 26 743 341 606 60 812 89 949 48 420 16 926F 45 33 051 811 1 090 8 163 904 3 327 6 569 0G 50-52 1 826 1 094 19 166 2 473 4 335 8 380 3 501H 55 346 82 3 320 1 261 1 116 2 800 I 60-64 353 864 18 224 24 541 35 482 10 150 17 947 30 665 11 009J 65-67 254 35 2 008 714 263 K 70-74 1 567 340 17 635 332 405 10 711 L 75 1 076 357 9 504 927 666 M 80 1 162 136 6 259 304 481 11 787 N 85 1 075 203 7 712 525 698 6 098 O 90-93 2 686 246 10 005 408 1 430 5 773 P 95 0 0 0 Q 99 164 0 0 0 Not allocated 9 606 2 904 171 109

Appendix Report: Energy use and CO2-emissions for consumed products and services…
.
45
Table A3. Continuation, CO2 emissions per industries for EU15, year 2000, [thousand tonnes]. IT LU (e.) NL PT (e.) FI SE UK ATGrand total 474 616 6 690 201 978 67 001 91 562 58 487 606 111 64 928Households. total 110 362 1 054 36 178 6 860 12 008 14 525 147 692 10 351Total industries 364 254 5 635 165 799 60 142 79 554 43 962 458 418 54 577NACE A-B 01-05 8 588 106 10 047 1 576 4 360 2 001 4 789 905C 10-14 569 2 2 201 206 3 661 547 24 000 929DA 15-16 2 169 44 4 620 1 115 329 896 9 895 665DB 17-18 1 729 48 390 1 143 40 98 2 439 259DC 19 361 19 1 148 15DD 20 564 8 150 310 961 262 4 902 323DE 21-22 6 399 15 2 305 1 335 23 659 2 085 4 373 3 194DF23-DG24 39 4 357 2 256 36 427 3 692DH 25 1 359 81 263 234 26 109 3 675 414DI 26 36 883 1 505 3 031 10 574 2 671 2 931 15 719 3 366DJ 27-28 23 689 954 7 310 1 074 6 066 7 027 33 185 10 118DK 29 1 925 25 378 256 46 240 1 623 185DL 30-33 934 4 390 34 9 114 1 383 139DM 34-35 2 087 1 250 31 43 434 3 228 122DN 36-37 715 8 314 82 12 202 3 382 3E 0-41 182 072 83 48 037 19 284 22 411 5 640 160 836 12 041F 45 2 512 37 1 699 1 844 964 1 559 3 458 114G 50-52 17 768 158 2 909 520 50 1 604 13 855 415H 55 2 333 167 2 520 122 105 3 679 534I 60-64 39 297 621 30 101 11 894 6 424 12 447 89 198 15 862J 65-67 980 738 3 472 51 62 4 212 74K 70-74 5 605 128 409 54 1 366 7 381 30L 75 2 608 213 2 953 716 174 11 028 M 80 780 107 959 61 4 120 5 606 N 85 1 921 157 1 672 1 031 26 5 984 O 90-93 2 931 386 7 896 117 232 335 4 014 282P 95 0 0 0 Q 99 0 0 0 0 0 Not allocated 1 028 2 976 1 523 895Data collected from Eurostat, 2005.

Appendix Report: Energy use and CO2-emissions for consumed products and services…
.
46
Table A4. CH4 emissions per industries for EU15, year 2000, [tonnes]. (e.) indicate that the data is an estimation. Please observe that comments about the data that are available in the original files are not included here. EU15 BE DK DE GR (e.) ES FR (e.) IEGrand total 17 188 169 502 759 273 394 4 121 157 551 347 1 870 885 2 616 581 608791Households. total 479 027 7 720 7 291 99 349 5 414 34 474 144 513 2728Total industries 16 709 141 495 038 266 103 4 021 808 545 933 1 836 411 2 472 069 606063NACE A-B 01-05 9 725 854 331 529 183 462 2 534 531 308 050 1 113 222 1 698 288 540288C 10-14 1 313 511 9 3 495 541 643 55 198 56 843 109 666 50DA 15-16 62 922 21 379 481 637 3 524 634 545DB 17-18 22 240 5 24 46 425 3 154 117 57DC 19 10 022 0 1 4 3 053 DD 20 20 721 4 345 139 106 89 1 159 DE 21-22 16 993 9 63 442 212 3 233 488 DF23-DG24 70 465 856 158 5 461 849 4 458 DH 25 4 413 0 31 69 106 3 067 72 DI 26 28 361 388 381 1 296 637 4 054 1 021 506DJ 27-28 47 275 4 017 81 2 298 318 6 266 3 091 22DK 29 1 313 6 45 153 64 44 29DL 30-33 1 111 2 24 190 72 46 DM 34-35 2 431 8 15 305 77 66 DN 36-37 3 327 12 104 76 129 226 32E 40-41 1 066 209 42 117 15 002 235 022 2 760 22 335 97 734 2512F 45 75 091 42 135 632 531 371 367 G 50-52 68 790 290 383 1 165 2 123 600 669 58528H 55 3 253 28 63 225 743 206 284 I 60-64 55 413 1 839 758 809 3 503 18 689 2 023 2590J 65-67 1 766 20 29 136 425 61 K 70-74 4 887 141 145 1 100 106 89 1 123 L 75 3 723 145 121 1 168 531 149 M 80 3 539 137 95 554 212 110 1 350 N 85 3 199 123 144 606 318 159 680 O 90-93 3 693 242 111 885 57 583 693 258 168 143 585 276 548 462 P 95 0 0 0 Q 99 12 12 0 Not allocated 399 059 1 395 3 038
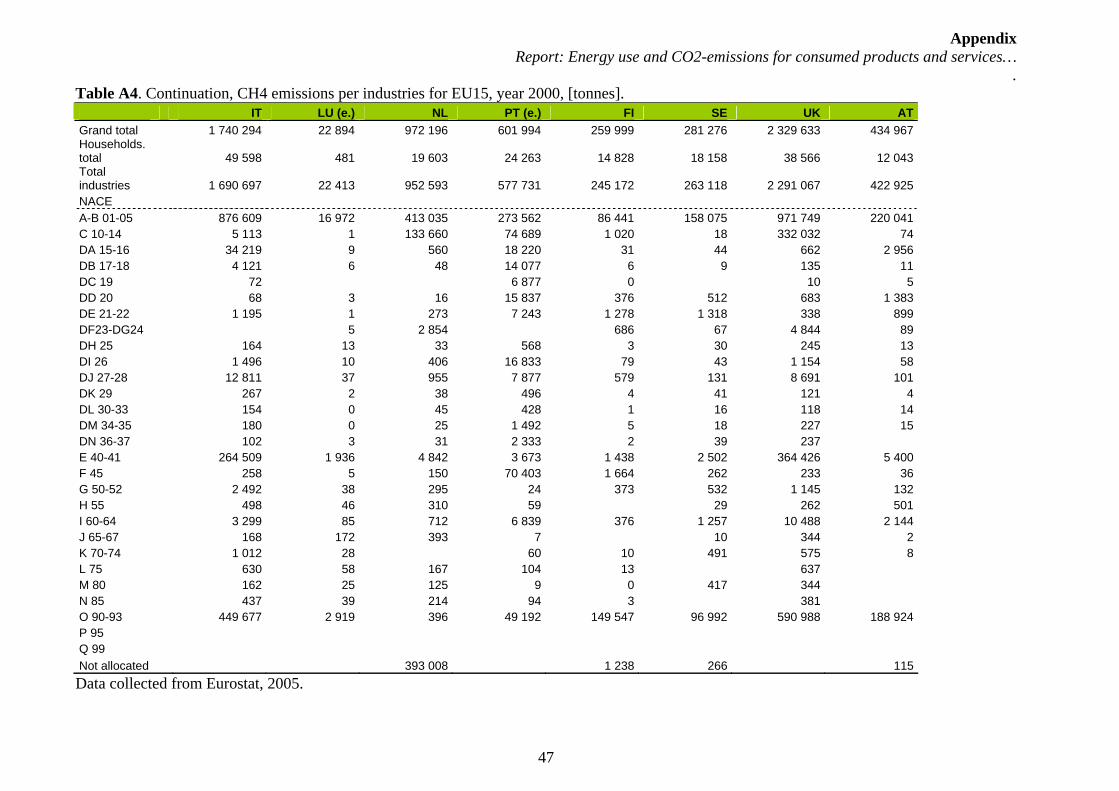
Appendix Report: Energy use and CO2-emissions for consumed products and services…
.
47
Table A4. Continuation, CH4 emissions per industries for EU15, year 2000, [tonnes]. IT LU (e.) NL PT (e.) FI SE UK ATGrand total 1 740 294 22 894 972 196 601 994 259 999 281 276 2 329 633 434 967Households. total 49 598 481 19 603 24 263 14 828 18 158 38 566 12 043Total industries 1 690 697 22 413 952 593 577 731 245 172 263 118 2 291 067 422 925NACE A-B 01-05 876 609 16 972 413 035 273 562 86 441 158 075 971 749 220 041C 10-14 5 113 1 133 660 74 689 1 020 18 332 032 74DA 15-16 34 219 9 560 18 220 31 44 662 2 956DB 17-18 4 121 6 48 14 077 6 9 135 11DC 19 72 6 877 0 10 5DD 20 68 3 16 15 837 376 512 683 1 383DE 21-22 1 195 1 273 7 243 1 278 1 318 338 899DF23-DG24 5 2 854 686 67 4 844 89DH 25 164 13 33 568 3 30 245 13DI 26 1 496 10 406 16 833 79 43 1 154 58DJ 27-28 12 811 37 955 7 877 579 131 8 691 101DK 29 267 2 38 496 4 41 121 4DL 30-33 154 0 45 428 1 16 118 14DM 34-35 180 0 25 1 492 5 18 227 15DN 36-37 102 3 31 2 333 2 39 237 E 40-41 264 509 1 936 4 842 3 673 1 438 2 502 364 426 5 400F 45 258 5 150 70 403 1 664 262 233 36G 50-52 2 492 38 295 24 373 532 1 145 132H 55 498 46 310 59 29 262 501I 60-64 3 299 85 712 6 839 376 1 257 10 488 2 144J 65-67 168 172 393 7 10 344 2K 70-74 1 012 28 60 10 491 575 8L 75 630 58 167 104 13 637 M 80 162 25 125 9 0 417 344 N 85 437 39 214 94 3 381 O 90-93 449 677 2 919 396 49 192 149 547 96 992 590 988 188 924P 95 Q 99 Not allocated 393 008 1 238 266 115Data collected from Eurostat, 2005.

Appendix Report: Energy use and CO2-emissions for consumed products and services…
.
48
Table A5. N2O emissions per industries for EU15, year 2000, [thousand tonnes]. (e.) indicate that the data is an estimation. Please observe that comments about the data that are available in the original files are not included here. EU15 BE DK DE GR (e.) ES FR (e.) IEGrand total 1 092 494 37 679 28 847 179 821 34 409 84 967 250 960 34711Households. total 61 720 3 036 1 026 12 597 1 140 5 824 8 926 1204Total industries 1 030 774 34 642 27 821 167 224 33 269 79 143 242 033 33507NACE A-B 01-05 704 263 16 033 21 947 116 976 21 246 54 939 180 329 27447C 10-14 2 127 9 45 59 50 70 63DA 15-16 2 384 16 50 214 104 302 461 171DB 17-18 868 4 3 25 104 161 94 37DC 19 100 0 0 2 40 DD 20 1 039 3 23 34 67 87 23DE 21-22 2 730 6 8 194 280 293 15DF 23 5 802 847 33 493 415 1 707 795 11,25DG 24 178 631 13 589 3 249 16 750 1 969 8 700 48 864 2707DH 25 520 0 4 32 72 54 29DI 26 6 084 264 61 477 104 1 672 155 58DJ 27-28 5 416 146 13 1 337 1 249 499 62DK 29 658 5 9 100 87 41 85DL 30-33 455 0 4 99 44 40 69DM 34-35 612 6 2 125 118 52 7DN 36-37 764 4 9 49 79 154 3,75E 40-41 42 471 170 733 12 117 7 877 2 490 1 845 164F 45 2 360 54 59 371 104 172 300 5G 50-52 5 766 149 72 814 207 324 779 851H 55 30 4 65 104 119 266 I 60-64 21 844 1 281 1 423 1 265 829 1 000 833 1200J 65-67 38 2 44 35 K 70-74 134 24 919 50 1 004 L 75 85 18 240 104 85 M 80 81 6 367 63 1 095 N 85 340 9 6 364 104 1 511 564 O 90-93 717 10 7 691 3 728 3 358 P 95 0 0 Q 99 13 0 Not allocated 2 719 619 499
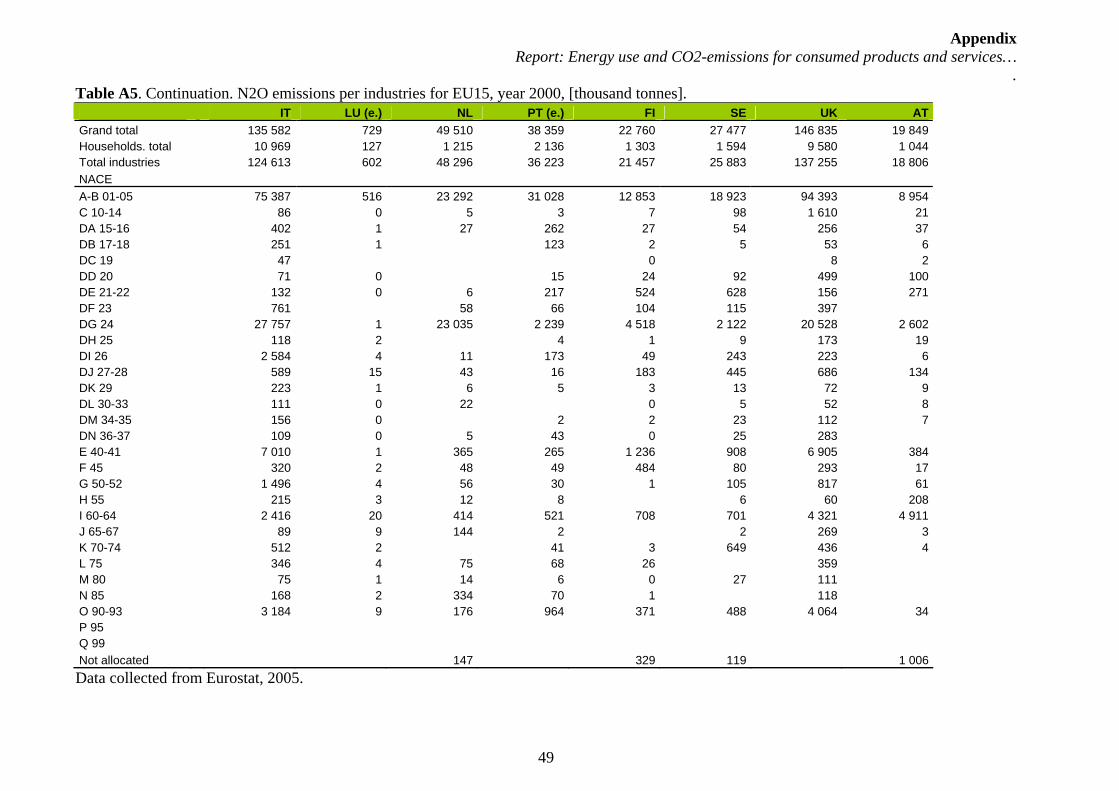
Appendix Report: Energy use and CO2-emissions for consumed products and services…
.
49
Table A5. Continuation. N2O emissions per industries for EU15, year 2000, [thousand tonnes]. IT LU (e.) NL PT (e.) FI SE UK AT
Grand total 135 582 729 49 510 38 359 22 760 27 477 146 835 19 849Households. total 10 969 127 1 215 2 136 1 303 1 594 9 580 1 044Total industries 124 613 602 48 296 36 223 21 457 25 883 137 255 18 806NACE A-B 01-05 75 387 516 23 292 31 028 12 853 18 923 94 393 8 954C 10-14 86 0 5 3 7 98 1 610 21DA 15-16 402 1 27 262 27 54 256 37DB 17-18 251 1 123 2 5 53 6DC 19 47 0 8 2DD 20 71 0 15 24 92 499 100DE 21-22 132 0 6 217 524 628 156 271DF 23 761 58 66 104 115 397 DG 24 27 757 1 23 035 2 239 4 518 2 122 20 528 2 602DH 25 118 2 4 1 9 173 19DI 26 2 584 4 11 173 49 243 223 6DJ 27-28 589 15 43 16 183 445 686 134DK 29 223 1 6 5 3 13 72 9DL 30-33 111 0 22 0 5 52 8DM 34-35 156 0 2 2 23 112 7DN 36-37 109 0 5 43 0 25 283 E 40-41 7 010 1 365 265 1 236 908 6 905 384F 45 320 2 48 49 484 80 293 17G 50-52 1 496 4 56 30 1 105 817 61H 55 215 3 12 8 6 60 208I 60-64 2 416 20 414 521 708 701 4 321 4 911J 65-67 89 9 144 2 2 269 3K 70-74 512 2 41 3 649 436 4L 75 346 4 75 68 26 359 M 80 75 1 14 6 0 27 111 N 85 168 2 334 70 1 118 O 90-93 3 184 9 176 964 371 488 4 064 34P 95 Q 99 Not allocated 147 329 119 1 006Data collected from Eurostat, 2005.