Transportation Alternatives Program Workshop and Public Comment

Energy Usage, Alternatives, and Transportation in the U.S.and What it Means to Michigan
prepared by
Harold SchockProfessor of Mechanical Engineering
Michigan State UniversityEast Lansing, Michigan
April 14, 2008

US Energy Flow DiagramFor the year of 2002, U.S. Department of Energy Website
Coal23.44
Natural Gas
19.84
Crude Oil 12.39
Fossil Fuel58.21
Domestic Production
71.57
Coal21.93
Supply100.87
Natural Gas
23.22Fossil Fuels83.48
Consumption96.95
Petroleum38.23
Imports29.95 Nuclear Electric Power 8.03
Renewable Energy 5.68Crude Oil
and Products
24.88
Nuclear Electric Power 8.03
Renewable Energy 5.52
NGPL 2.54
Other5.07
Adjustments 0.75
Coal1.27
Exports3.92
Other 2.66
Residential 20.46
Transportation26.75
Commercial17.44
Industrial32.60
RENEWABLE ENERGY IN TRILLION BTUsHydroelectric Power (2376, 42%); Wood (2170, 38%); Waste (551, 10%)Alcohol Fuels (147, 3%); Geothermal (315, 6%); Solar (64, 1%); Wind (59, 1%)

US Energy Flow DiagramFor the year of 2004, U.S. Department of Energy Website (Units Quad BTUs)

Insert diagram 1 here ..it is a pdf
diagram 1.jpg

What Brings us Here? The World Oil Supply!
• Hubbert’s Peak – M. King Hubbert (1903-1989)– Geologist who grew up in San Saba, Texas– Trained BS, MS, PhD University of Chicago– Worked at Columbia Univ, WW II Production Board, Shell
Research Lab in Houston, after retirement taught at Stanford andBerkeley and worked for the US Geological Survey
– In 1956 predicted, through a combination of knowledge, analysis and insight predicted world oil production would peak in 70s
– Recent estimates indicate peak may have been in 2005 but recent major price fluctuations show the near equality of supplyand demand…per capita production peaked in the late 1970s
– As demand exceeds supply lifestyles will change …. Unless oil is replaced with something else …. Is this day is upon us?
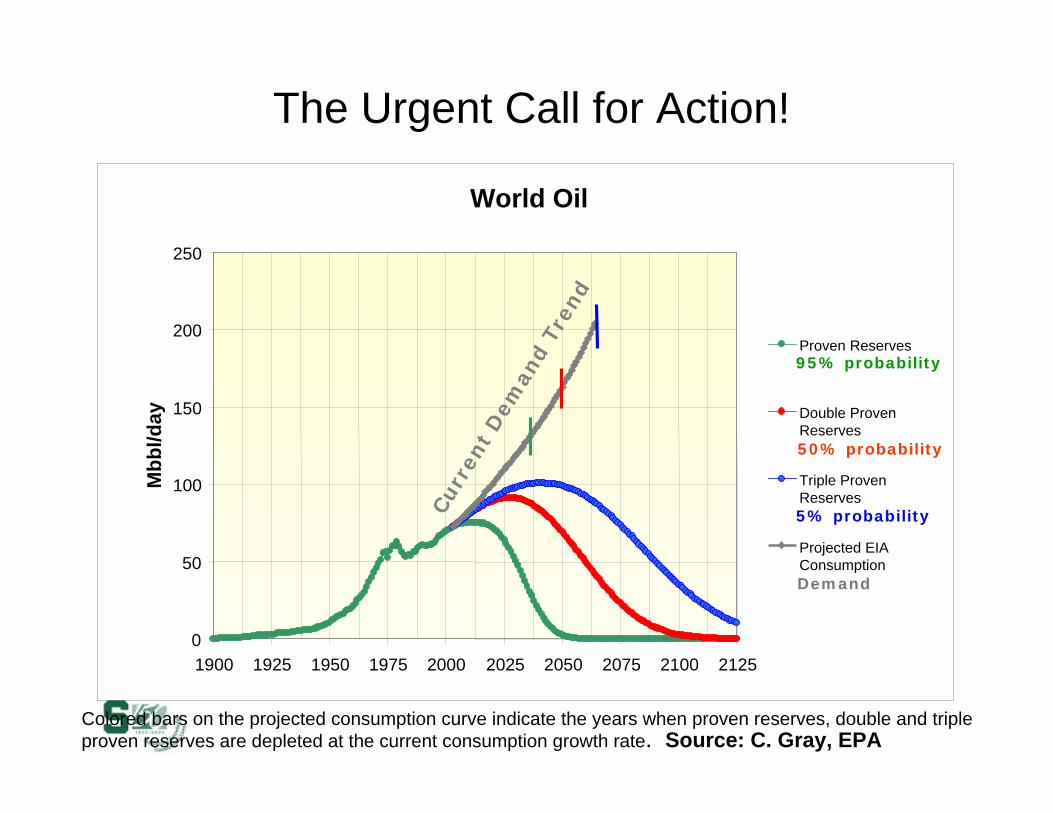
World Oil
0
50
100
150
200
250
1900 1925 1950 1975 2000 2025 2050 2075 2100 2125
Mbb
l/day
Proven Reserves
Double ProvenReserves
Triple ProvenReserves
Projected EIAConsumption
Colored bars on the projected consumption curve indicate the years when proven reserves, double and triple proven reserves are depleted at the current consumption growth rate. Source: C. Gray, EPA
The Urgent Call for Action!
95% probability
50% probability
5% probability
Demand
Cur
rent
Dem
and
Tren
d

Some Powertrain and Fuel Options for the Next Quarter Century
• Coal• Tar Sands – Heavy Oil• Oil Shale• Nuclear• Ethanol and Biofuels from Crops, Cellulose or other• Hydrogen from Hydrocarbons or other• Advanced IC Engines/Hybrids (Gasoline and Diesel)• Natural Gas Fuels• Electric Power from Grid

Coal• Pros
– Cheapest source of energy– Six thousand active coal mines currently in the US– Worldwide production viable for a few hundred years at
current rate– US and former Soviet Union have the world’s largest coal
reserves– Fisher-Tropsch reaction uses an iron rich catalyst to convert
gases to high grade gasoline and diesel fuel …including gases produced from coal … likely part of the future
• Cons– Smog, acid rain (sulfur), mercury pollution and carbon dioxide– Hazardous to mine underground and unsightly in open pits– Environmental problems that have plagued us for decades will
not be solved in a few years

Tar Sands (Heavy Oil Sands)
• Pitch, bitumen, tar and asphalt go back to the dawn of civilization• Tar sands discovered in 30 countries around the world but two stand
out– Eastern Alberta Canada and North of the Orinoco River in Venezuela– These two have more oil than all of the world’s conventional wells
• In-situ (20% recovery) and surface mining are both options• Production of oil from tar sands requires heat for extraction and
hydrogen for upgrading the oil …both processes major users of natural gas
• Significant water usage and it’s dispersal after use for oil recovery are important issues for both mining types
• Infrastructure issues are significant with cost and the variability in natural gas prices which can make a venture not economical

Oil Shale
• About 30 Countries and eight states in the US produce oil from shale
• Oil shale is an immature source rock for petroleum which has never been hot enough to be “cooked” into oil
• Green River Area where Utah, Wyoming and Colorado come together contains 60% of the world’s oil share … more oil than all the oilfields in the Mideast
• Commercial viability involves going from a lower H-C ratio to a higher one …thus need hydrogen and water
• Surplus natural gas (for H2 and heating) have been driven up due to the use of natural gas for making electricity
• The Green River flows into the Colorado then to San Diego, Las Vegas and water flow apportioned through a treaty with Mexico

Nuclear Energy• 442 nuclear power reactors in operation in 31 countries around the
world (~23% of the world’s electricity), 32 more under construction• Current power reactors are Generation II and III, 103 plants produce
20% of the electricity in the US• Generation III+ and particularly Generation IV have significant
advantages in safety and life cycle cost advantages over other energy sources
• DOE estimates that Gen IV plants could produce hydrogen equivalent to 1.4 M bbls/year of gasoline …about 3389 new nuclear plants would be required to meet the 13 M bbls of oil per day used in transportation in the US
• DOE’s Advanced Fuel Cycle Initiative and the Global Nuclear Energy Partnership has the goal of utilization of a higher fraction of energy in uranium, extending world’s resource from 100 to 1000 years
• Electricity: mean cost estimates (Univ. of Chicago 2004)normalilized to coal: coal=1, natural gas=1.1, nuclear power=1.1 not counting costs of carbon sequestration for coal and natural gas

Fossil Fuels Availability and Costs?
• Availability: estimates are that there as much as tens of of centuries worth of natural gas, coal, tar sands and oil shale
• Cost: Possibility of Global Warming caused by green house gases (CO2 and other natural and man made products)
CO2 levels will increase because of anthropogenic activity to levels that have not been seen on earth for the last 650,000 years
CO2 levels have been correlated with temperature swings …but not necessarily the cause of them

0
20
40
60
80
100
1 2 3 4 5 6 7 8 9 10 11 12 13 14 15
% Calorific Value of Hydrogen, ΔHH, with respect to thatof the Hydrocarbon, ΔHCH, used for its production,
[ΔHH/ΔHCH]%, for paraffins, C nH2n+2
Source of data: NIST Chemistry WebBookd t
<http://webbook.nist.gov/chemistry>
n

Challenges for “H2 Economy” and Fuel Cells
• Unavailability of hydrogen! The use of liquid and gaseous hydrocarbon fuels to make hydrogen for transportation has not been shown to be economically sensible at any price and there is no known viable H2 production method.
• There is no support infrastructure in place to deliver hydrogen- Storage, supply and facility location - are not understood.- Safety, emergency and building design - are unknown.- Service community - non existent.- Insurance, costs of supply etc. - are not mature.- Customer base - is unknown.
• Costs of fuel cell systems are an unknown or uncompetitive - Air-Gen $6,495-1kW, $14,950-2kW, AD Little est. $225/kw @500k/yr as compared to
$25 to $30 per kw for an IC engine). - Durability, recycle ability and serviceability are unknown.
• NAS report from Feb 2004- Estimates at least 25 to 30 years before fuel cells for transportation are practical for
consumer acceptance.

Historical and Recent HEV DevelopmentsHistoric:• 1902 Lohner-Porsche 1st hybrid, 1905 H. Piper files US patent for a
petrol hybrid vehicle..GMR: General Motors Research Labs.• 1966 GM Stirlec vehicle.• 1970 GM Commuter vehicle.1990’s:• 1991 GM HX3.• 1993 GM Freedom.• 1993 to 1998 DOE – GM, Ford Chrysler HPSP Program.Recent examples:• 1998 Honda Insight.• 1997 Toyota Prius. 1997 Japanese market & 1999 NA Market• 2004 Ford Escape – Toyota gen ll Lic.• 2005 Lexus SUV hybrid.• 2006 Toyota 07 Camry Hybrid: 40/24.8 mpg combined, 0-60 in 8.9/9.8 s

Benefits of Hybridization(T. Kinney, Ford Motor Company, sum of averages 41.5%)
0%
5%
10%
15%
20%
25%
30%
35%
Decel FuelShut-off
Idle EngineShut-off
Downsizedw/Electric
Assist
Regen toAccessories
Regen toElectric
Launch andAccessories
% M
-H F
uel E
cono
my
Gai
n
Benefits estimated without penalty for added hardwareEach category benefit independent
2-4% 2-4%4-6%
6-11%
13-31%

Performance of a Modern Hybrid2007 Honda Civic / Civic HybridCombined fuel economy: 33/47MPG (+30% H) Zero to 60 time: 8.3/7.4 seconds (+11% H)Battery life of hybrid: 150,000 mile warranty
2008 Lexus RX350 / 400hCombined fuel economy: 20.5/25.5MPG (+20% H)
2008 Ford Escape / Escape HybridCombined Fuel Economy 25/32MPG (+28% H)

Unadjusted FE and Efficiency(T. Kinney, Ford Motor Company)
10
15
20
25
30
35
40
45
50
55
2000 3000 4000 5000 6000 7000 8000
ETW (lb)
M-H
Fue
l Eco
nom
y (m
iles/
gallo
n)
Passenger Car BIC Energy Efficiency Trend Line (55 ton-mpg)
Turbo Diesels
Truck BIC Energy Efficiency Trend Line (52 ton-mpg)
50th Percentile - 48.5 ton-mpg
AT Vehicles: North American Fleet
TC Diesel Energy Efficiency – 75 to 80 ton-mpg
Hybrid Energy Efficiency – 80 to 100 ton-mpg
Today’s BIC SI Technology: 4v PFI, VCT and 5-6 spd AT

HEV Projections and Rationale• HEVs are a technically sound idea regardless with power plant being fuel cells or IC engines
• HEV design, development and production also offers the manufacturer and user the opportunity to acquire the “skill set” that would be required when and if the envisioned Hydrogen Economy becomes a reality.
• HEVs unquestionably address concerns of– global warming, cost of fuel ($2.77)* gallon and uncertainties of future supplies.
• Foreign oil dependency issues and changes in customer preferences. – “oil politics” coupled with balance of trade (-40B/yr @ 55% 2004)– unmistakable “green movement” is taking shape in the US– strong environmental issues on US west, east and south (Texas) coasts
• Continued strong liquid hydrocarbon energy demand by developing countries and economies.– including China and India – future environmental and infrastructural downside of traditional auto technologies
• Other Important factors– Risks of inaction … for the US– M.King Hubert Institute of Petroleum Studies has noted that world wide conventional oil supplies might have
recently peaked - late 2004.– AAA projects a US National average - regular fuel - $3.00 to $3.20 gal by end of 2005 to early 2006.
* August 15th, 2005
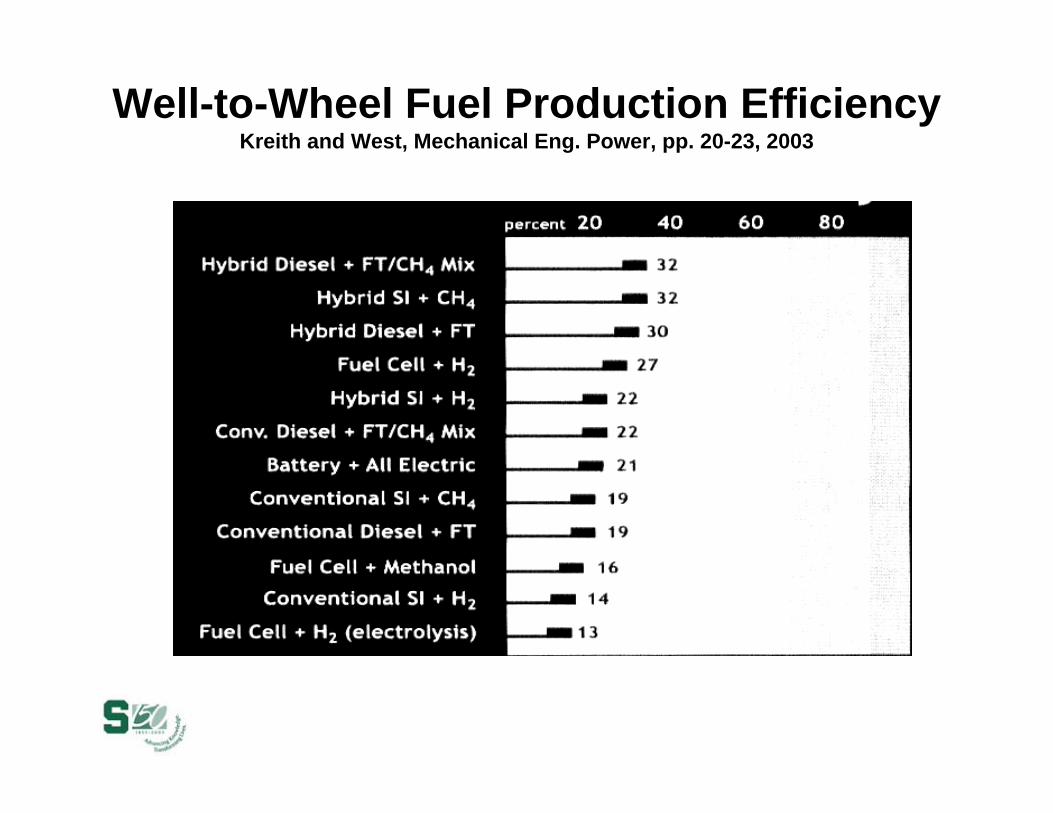
Well-to-Wheel Fuel Production EfficiencyKreith and West, Mechanical Eng. Power, pp. 20-23, 2003
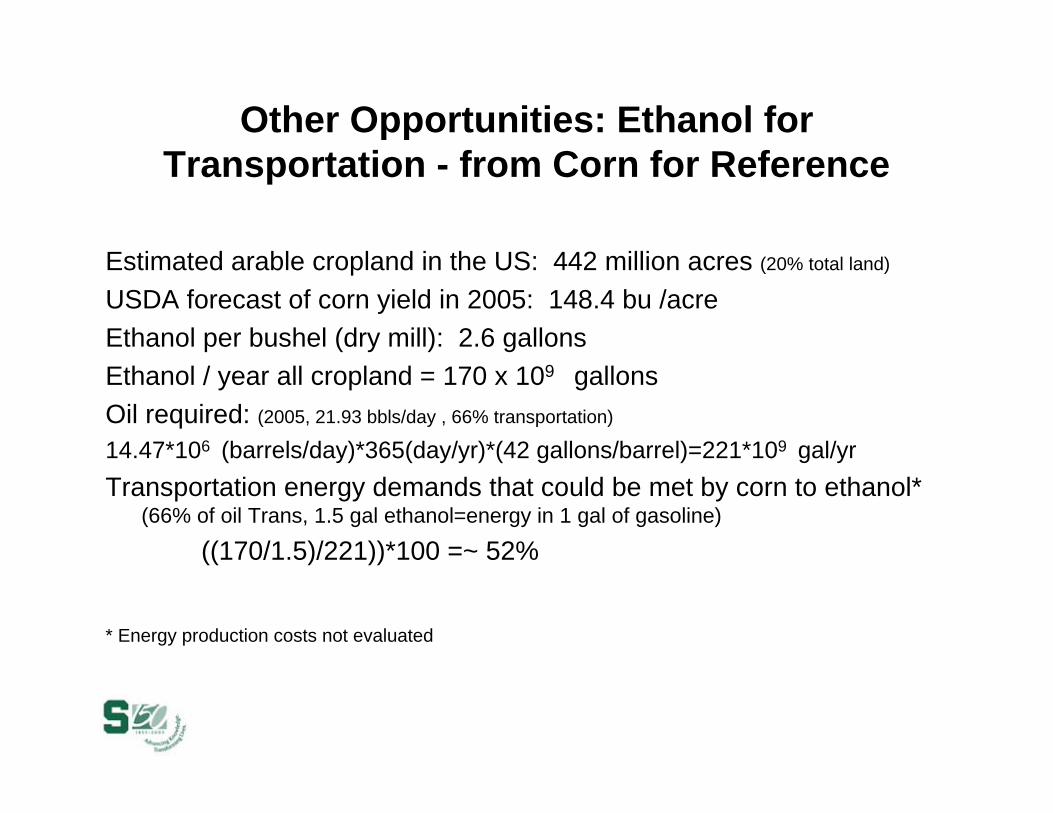
Other Opportunities: Ethanol for Transportation - from Corn for Reference
Estimated arable cropland in the US: 442 million acres (20% total land)
USDA forecast of corn yield in 2005: 148.4 bu /acreEthanol per bushel (dry mill): 2.6 gallonsEthanol / year all cropland = 170 x 109 gallonsOil required: (2005, 21.93 bbls/day , 66% transportation)
14.47*106 (barrels/day)*365(day/yr)*(42 gallons/barrel)=221*109 gal/yrTransportation energy demands that could be met by corn to ethanol*
(66% of oil Trans, 1.5 gal ethanol=energy in 1 gal of gasoline)
((170/1.5)/221))*100 =~ 52%
* Energy production costs not evaluated

Other Ethanol Related Comments
• Opportunity: Significant ethanol production in US possible ~ 50 B gallons per year in the US from cellulose; with projected technology improvements, 11% of arable land needed …energy equivalent to
– Hydrogen production of 400 nuclear power plants (DOE est) – ANWR discovery every 5 years– Hybridization of all personal transportation in the US (30% est.
improvement)
• Problems: Ethanol has about 66% of the energy of gasoline on a volume basis and thus mileage, range and fuel cost are potential issues with current spark ignition engine technology
– San Paulo online paper 2/06 “…buy ethanol at 70% price of gasoline”
• Solution: Develop an advanced low-to-high compression ratio combustion system for ethanol fueled IC engines that results in substantial efficiency improvement …20% over today’s flex-fueled engines

FE Benefits of Advances in IC Engine Technology … All Applicable to Hybrids
Near term – 5 years (demonstrated in laboratory)• Microelectronic control of combustion HCCI: +30% better than c. SI• Advanced “clean” diesels: +30% better than current SI• Directly Injected SI engines: +15%• Turbocompounding: +5-20% depending on operating mode• Thermoelectric recovery: +5% depending on operating mode
Longer term – 10 years*• Microelectronic control of combustion with IVVT : +40%• Very Advanced Combustion Control with SC (+50%) when merged
with a hybrid 75 mpg possible in a midsized car
* Estimated based on lab experiments and calculations

The Big Picture - One Perspective
Fact: 66% of the oil (20+ M-Bbl/day) used in the US is for Transportation … 40% by personal vehicles
• Over the next 10 years … technology changes for sparked IC engines, implementation of diesel and hybrids have the potential of improving combined fuel economy by 30% ….or saving 2.4 M bbls./ day …about 12% of the daily US consumption … (only personal vehicles considered in savings calculation)
• Equivalent to an ANWR discovery every 5 years(est. 5B bbls in ANWR)
• If made from corn, this is equivalent to using 32% of arable land in the US to making ethanol for transportation @150 bu/acre
• Energy costs for making HC fuel from crude and ethanol from cornnot considered

Strategic Challenges…
Business Challenges:• Compliance with Tier2 and 2007/2010 emission standards• Ever increasing cost of petroleum
Societal Challenges:• Clean Air• Climate Change issues• Resource conservation• Costs of increasing oil imports• Higher trade deficits• National security
The need for new ultra clean and ultra fuel-efficient technologies are becoming more urgent!

Ozone has been shown to reduce yields of vegetables and field crops
Clean Air Act requires EPA to take steps to remedy regional haze in 156 pristine “Class I” areas
65 million people live in areas that violate the fine PM air quality standard; 159 million people live in areas that are not in attainment for ozone
Diesel exhaust is likely to be carcinogenicto humans
Fine particles from diesel exhaust can remain in the atmosphere for weeks, and carry over hundreds of miles
Vehicles Contribute to Unhealthy Air for Millionssource: C. Gray, USEPA

Big Picture Economics – 2003source: C. Gray, USEPA
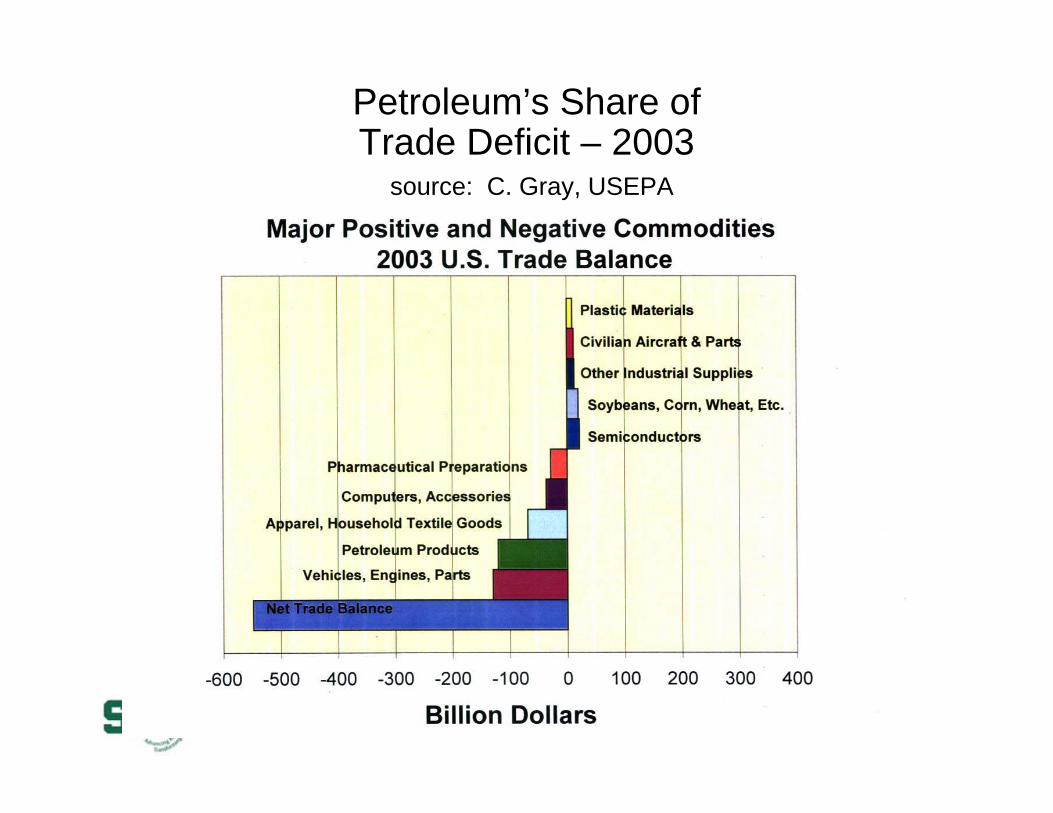
Petroleum’s Share of Trade Deficit – 2003
source: C. Gray, USEPA

The Bad News New Technology Used for Power/Size, Not FE
source: C. Gray, USEPA
-8%
53%
18% 19%
-10%0%
10%20%30%
40%50%60%
Fuel Economy Horsepower Acceleration Weight
% Change, 1988-2001

Traditional Vehicle Energy Pathsource: C. Gray, USEPA
Fuel
Engine
Driveline

Where Does the Energy Go in Typical UrbanDriving?
source: C. Gray, USEPA
Fuel
Engine
Driveline
100%
Engine Losses (62.4%)
Driveline Losses (5.6%)
18.2% 12.6%
Standby (17.2%)
Accessories (2.2%)
Aerodynamic Drag (2.6%)
Rolling Resistance (4.2%)
Braking (5.8%)

Typical Combined City/Highway Component Efficiencies
source: C. Gray, USEPA
Fuel
Engine(21%)
Driveline(74%)
28 mpg
Rolling ResistanceCrr= 0.008
Drag CoefficientCd= 0.32
Frontal Area FA = 2.0 m2
MassM = 3500 lb

With PNGV Aerodynamic Drag and Tire Characteristicssource: C. Gray, USEPA
Fuel
Engine(21%)
Driveline(74%)
33 mpg
Cd = 0.2FA = 2.0 m2
Crr = 0.006M = 3500 lb

Hybrid Vehicle Energy Pathsource: C. Gray, USEPA
Fuel
Engine Driveline
Secondary Energy Storage*Regenerative braking
*Engine buffer

“Perfect” Hybrid Vehicle Component Efficiencies: Source C. Gray, USEPA
Fuel
Engine(100%)
Driveline(100%)
SecondaryEnergy Storage
(100%)
Cd = 0.2FA = 2.0 m2
Crr =0.006M = 3500 lb
424 mpg
With high efficiency (33%) engine: 140 mpg
Without regenerative braking: 70 mpg

Reasonable Long-Term Targetsource: C. Gray, USEPA
Fuel
Engine(67%)
Driveline(90%)
SecondaryEnergy Storage
(80%)
Cd = 0.2FA = 2.0 m2
Crr = 0.006M = 3500 lb
216 mpg

Conventional SI with Premixed Charge + Gasoline = Low Emissions, but Inefficient
source: C. Gray, USEPA
• Homogeneous charge, inherently low PM
StoichStoich SI withSI withPREMIX CHARGEPREMIX CHARGE
GasolineGasolineTWCTWCEGREGR
LowEfficiency
LowEmissions
• High peak temp = High NOx, but Stoich operation allows TWC
• Throttling and Low compression ratios reduce efficiency

Conventional CI Direct Injection + Diesel Fuel = Efficient, but has High Emissionssource: C. Gray, USEPA
• High compression & unthrottled = high efficiency…
DieselDieselFuelFuel
EGREGR
HighEfficiency
HighEmissions
CIDICIDI• …But Stratified Charge = High
PM
• High peak combustion temperatures = high NOx ; lean operation prevents use of TWC

???
Research Opportunity: Lean Burn on Gasoline/Diesel-Like Fuels
source: C. Gray, USEPA
• If engine is operated with lean burn...
GasolineGasoline--Like?Like?DieselDiesel--Like?Like?
HighEfficiency
??EmissionsEmissions
Lean BurnLean Burn• Need more research on NOx Adsorbers, Plasma Cats, PM Traps
• Includes issue of achieving intermittent rich operation to purge adsorber

Research Opportunity: Gasoline/Diesel-Like Fuels at Stoich
source: C. Gray, USEPA
• If efficiency is obtained through high compression, high expansion + unthrottled...
PM TrapPM Trap
??EmissionsEmissions
HighEfficiency
??High CompressionHigh CompressionHigh ExpansionHigh ExpansionUnthrottled Unthrottled StoichStoich
• How can the engine be operated at stoich, so as to allow TWC?
GasolineGasoline--LikeLikeDieselDiesel--LikeLike
EGR, TWCEGR, TWC

EPA Clean Diesel Combustion(1.9L Multi-Cylinder Evaluation)
source: C. Gray, USEPA
Engine Brake Efficiency (%) Brake Specific NOx (g/hp-hr)
42%
40-41%
Pexhaust = Pinput + .1 Bar NOx below .2 everywhere
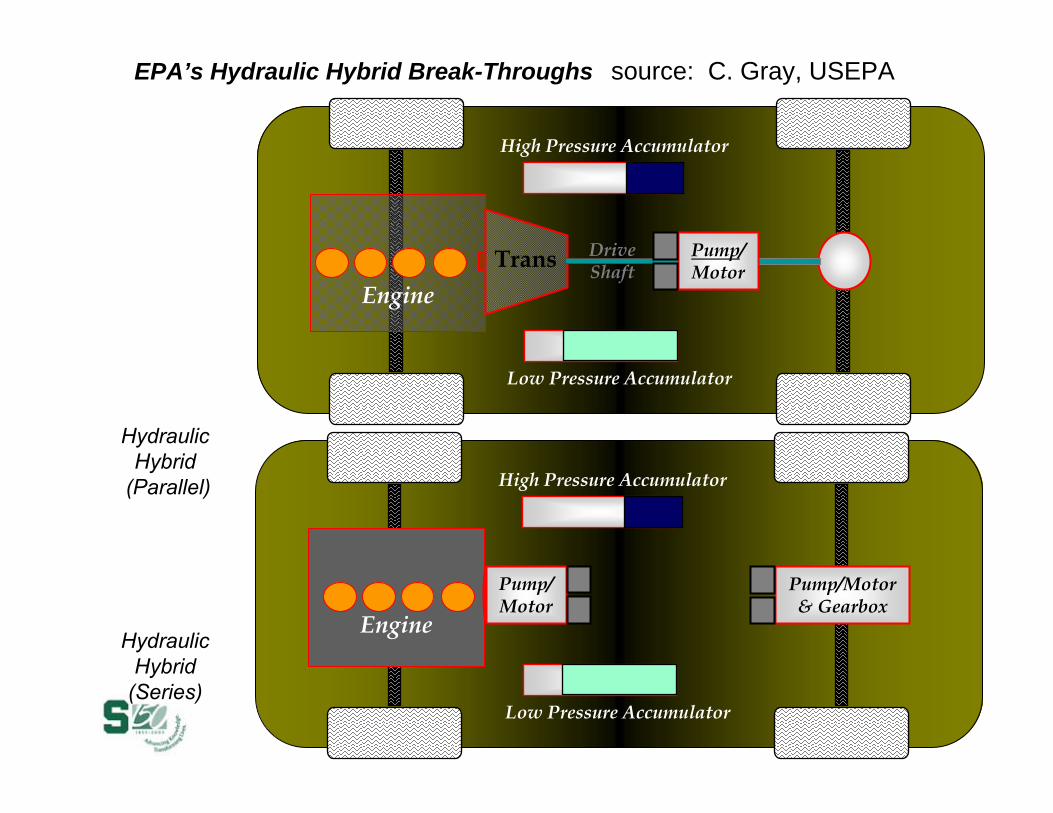
EPA’s Hydraulic Hybrid Break-Throughs source: C. Gray, USEPA
EngineTrans Drive
Shaft
Conventional Vehicle
High Pressure Accumulator
Low Pressure Accumulator
Pump/Motor
Engine
Pump/Motor & Gearbox
High Pressure Accumulator
Low Pressure Accumulator
Pump/Motor
MildHydraulic
Hybrid(Parallel)
FULLHydraulic
Hybrid(Series)

Historic EPA Hydraulic Hybrid Test Chassis
source: C. Gray, USEPA
Full Series Hydraulic Hybrid 80+ mpg combined city/highway mpg~8 seconds 0-60 acceleration timeNo need for expensive lightweight materials (test weight 3800 lb)Led the way for subsequent demonstration vehicles

MSU’s Automotive Facility: Online Fall, 2007

Measured pressure data Indicator diagram in linear scales
Indicator diagram in logarithmic scales
Diesel Combustion Analysis (Visual Techniques…Qualitative Analysis)
Diesel Fuel Spray Analysis (Infrared Techniques…Qualitative Mixing)
Pressure Traces are Evaluated to Study the Quantitative Conversion of Reactants to Products
Techniques for Evaluation and Control of an ICE at MSU
Quantification of dynamic stage of combustion (i-f)

Technology Being Developed in MSU-Hybrid Project
• Power electronics for component and system efficiency– DC-DC converters– Z-source inverter
• Electrical machines and drives– IPMAC for reduced iron losses, weight, and torque pulsations– Operation with minimal sensors for cost and reliability
• Fault diagnosis and prognosis for components and systems• Development of advanced prime movers
– Numerical simulation tools for powertrain optimization– Advanced clean diesels including the ability to effectively use
biofuels• Vehicle integration
– Durability, reliability and performance optimization– Physical and virtual development/validation

How can the University Community from the State of Michigan Contribute?
• Develop technology which promises “economical” production of 50 B gallons of ethanol per year (2.4 M bbls oil per day equiv) – High value biofuel “additive” which will enhance HCCI combustion
and/or “clean” diesels– Requires molecules which provide local reaction sites during
compression ignition (or during TJI)• New engine technologies that take advantage of biofuel properties
– Microelectronic controls– Advanced thermoelectrics– Other regeneration cycles
• Develop advanced technology critical to hybrids: Battery technology, power electronics, high efficiency machines, fault prognostics using cost effective technology

Thermoelectric Conversion of Waste Heat to Electricity in an IC Engine Powered Vehicle
Prepared by:Harold Schock, Larry Brombolich, Eldon Case, Charles Cauchy, Tim Hogan,
Mercouri Kanatzidis, James Novak, Fang Peng, Fei Ren,Tom Shih, Jeff Sakamoto, Todd Sheridan, Ed Timm
04/11/2008
Supported By: Acknowledgement: ONR support US Department of Energy under MURI ProgramEnergy Efficiency Renewable Energy (EERE) Mihal Gross, Project MonitorJohn Fairbanks and Samuel Taylor, Contract Monitors
IOWA STATEUNIVERSITY
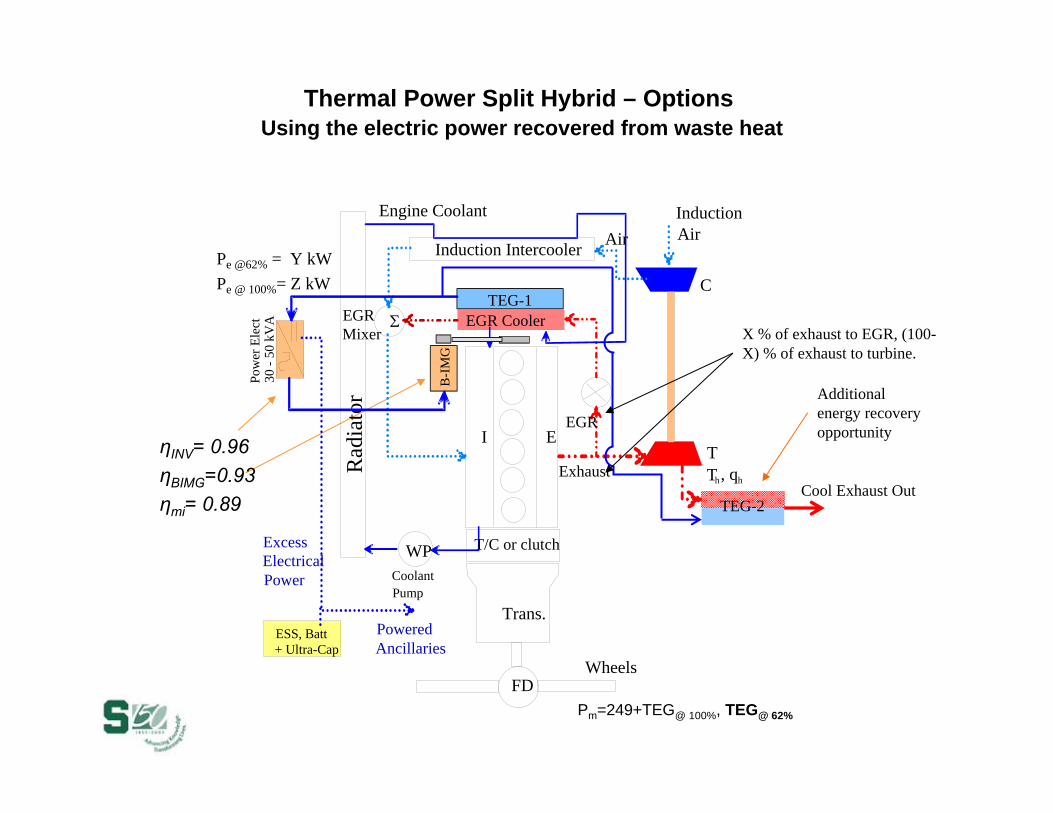
Thermal Power Split Hybrid – OptionsUsing the electric power recovered from waste heat
I E
WheelsFD
Trans.
C
T
Σ
Induction Intercooler
InductionAir
EGR
EGRMixer
ESS, Batt+ Ultra-Cap
Th, qh
Pe @62% = Y kWPe @ 100%= Z kW
Pow
er E
lect
30 -
50 k
VA EGR Cooler
WP
Engine CoolantAir
Exhaust
CoolantPump
TEG-1
Rad
iato
r
T/C or clutch
B-I
MG
ExcessElectricalPower
PoweredAncillaries
Cool Exhaust OutTEG-2
ηINV= 0.96ηBIMG=0.93ηmi= 0.89
X % of exhaust to EGR, (100-X) % of exhaust to turbine.
Additional energy recovery opportunity
Pm=249+TEG@ 100%, TEG@ 62%
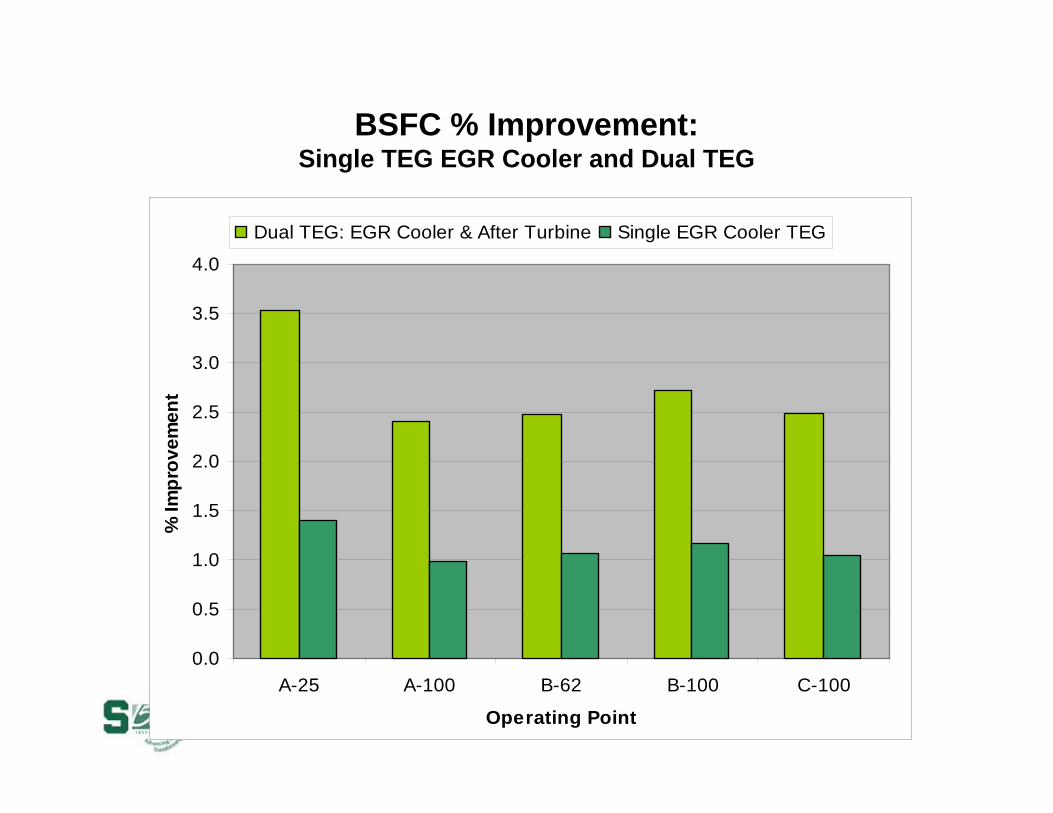
BSFC % Improvement:Single TEG EGR Cooler and Dual TEG
0.0
0.5
1.0
1.5
2.0
2.5
3.0
3.5
4.0
A-25 A-100 B-62 B-100 C-100
Operating Point
% Im
prov
emen
t
Dual TEG: EGR Cooler & After Turbine Single EGR Cooler TEG

Assessment of Economic Feasibility Based on Fuel Savings
Fuel Efficiency = 10 mi/gal
$0
$20,000
$40,000
$60,000
$80,000
$100,000
0 250 500 750 1000
Thousand Miles
5% increase - $3per gallon
10% increase - $3per gallon
5% increase - $5per gallon
10% increase - $5per gallon
Fuel Efficiency = 5 mi/gal
$0
$20,000
$40,000
$60,000
$80,000
$100,000
0 250 500 750 1000
Thousand Miles
5% increase - $3per gallon
10% increase - $3per gallon
5% increase - $5per gallon
10% increase - $5per gallon
Delivery Truck
$45,455$23,810$27,273$14,286
1Mmiles
$22,727$11,905$1,3636$7,143
500Kmiles
$11,364$5,952$6,818$3,571
250K miles
10%imp. bsfc
5%imp. bsfc
10%imp. bsfc
5%imp. bsfc
Savings @ $5 per gallonSavings @ $3 per gallon
OTR Truck
$90,909$47,619$54,545$28,571
1Mmiles
$45,455$23,810$27,273$14,286
500Kmiles
$22,727$11,905$13,636$7,143
250Kmiles
10%imp. bsfc
5%imp. bsfc
10%imp. bsfc
5% imp. bsfc
Savings @ $5 per gallonSavings @ $3 per gallon

Summary• For multiple decades, fossil fuels will supply the greatest fraction
of our transportation energy
• Fossil fuel costs, liquid fuel power density and GHG considerations will make biofuels viable
• Next decade: Technologies such as advanced power electronics, thermoelectrics, turbo-compounding and advanced combustion systems can make 5-40% improvements in fuel economy ….. when implemented in a hybrid configuration
• Adaptation biofuels will be a occupy a small but growing market segment….and likely will require subsidies to be viable … ethanol from switchgrass and other feedstocks appears promising
• Powertrains for next 50 years: advanced IC engines which have a near 50% energy conversion efficiency implemented in hybrids

Finally - All Options Must be Considered …the Reasonable Ones Carefully!
Thanks for your attention!
Harold [email protected]
517 353 9328