ENERGY SUPPLY WITH NEGATIVE CARBON EMISSIONS...
33
ENERGY SUPPLY WITH NEGATIVE CARBON EMISSIONS Historical Environmental Budget of Bioethanol in Brazil and Future Expectations Jose Roberto Moreira Stanford University Stanford, California June 15, 2012
Transcript of ENERGY SUPPLY WITH NEGATIVE CARBON EMISSIONS...

ENERGY SUPPLY WITH NEGATIVE CARBON EMISSIONS
Historical Environmental Budget of Bioethanol in Brazil and Future
Expectations
Jose Roberto Moreira Stanford University Stanford, California
June 15, 2012

photosynthesis
Source :
88
CO2
88
CO2
8 CO2 from fuel
77 CO2 from boiler
44 CO2 from fermenta8on
SUGAR CANE, ETHANOL AND THE GHG EFFECT
Sugar cane
Alcohol
121
CO2
Net CO2 Balance f/ air
In 121g
Out 8+77=85g
Per 46g ETH.
Removal 618g CO2/liter ethanol
88 CO2 209 CO2

Relative mass fractions in conversion of liquid sucrose to sugar and/or ethanol.
THE PAST

Annual CO2 reduction of ethanol production unit with integrated CO2 capture relative to the reference system without CO2 capture.

CONCLUSIONS
• The performance of CHP in many sugar cane-processing industries is rather poor. It is possible to increase electricity generation from 15 kWhe per tonne sugar cane processed to between 60 and 100 kWhe per t cane. In 2012, 175 kWh/tcane
• This surplus electricity could be used as the source of the extra electricity required for CO2 recovery from fermentation and combustion of bagasse, thus cancelling the energy penalties for pumping CO2. This increases the estimated technical global carbon abatement potential from 141 Mtonnes C yr−1 to 165 Mtonnes C yr−1.
• If a location by a sea or river port (near saline aquifer) is assumed, this study suggests that CO2 capture and storage could be accomplished at 70 US$ tonne−1 CO2−1 .
• If a storage site is nearby, or if connection to a nearby major CO2 pipeline is possible, this cost could be reduced.

Bioethanol refinery description Data are based on two previous works. In one hand, the description of a real bioethanol refinery in France, in a region which seems favorable to CO2 underground storage. This first firm processes sugar beets to produce sugar and high purity alcohol for the perfume, solvents and bioethanol. Only the bioethanol production itself is studied here. An overall of this study is available in Laude et al. (2010). In the other hand, to deal with upper volumes, we established a study on scale effects, see Laude and Ricci (2010). We choose here an ethanol production of 4Mhl/yr. Two CO2 sources are depicted: the cogeneration unit (fed with natural gas) and the fermentation unit. For an ethanol production of 4Mhl/yr, the volumes of CO2 emitted are 300,000 t/yr from the fermentation unit and around 407,000t/yr from the cogeneration unit.
Source: Biomass and CCS: The influence of learning effect Audrey Laudea Chris8an Jonenb

Source: Biomass and CCS: The influence of learning effect Audrey Laudea Chris8an Jonenb

Michael C. Carbo. IEA-‐CERT CCS workshop, Sydney, 20 February 2012
THE PRESENT
Pacca, S. & J.R.Moreira Accepted for publica8on at
Energy Policy

Assump8ons
• Historical yield of sugar cane and planted area recorded in Brazil from 1975 to 2007
• Original land vegetation with an intensity equivalent of 20% of tropical forests (IPCC Guidelines)
• Production of electricity sold to the grid based in historical records for Brazil
• Emissions due sugar cane plantation, harvesting, processing and distribution from Macedo et al, 2006
• N2O emissions to atmosphere according with IPCC Guidelines
• Fuel efficiency for ethanol - 1.3 liters per liter of gasoline
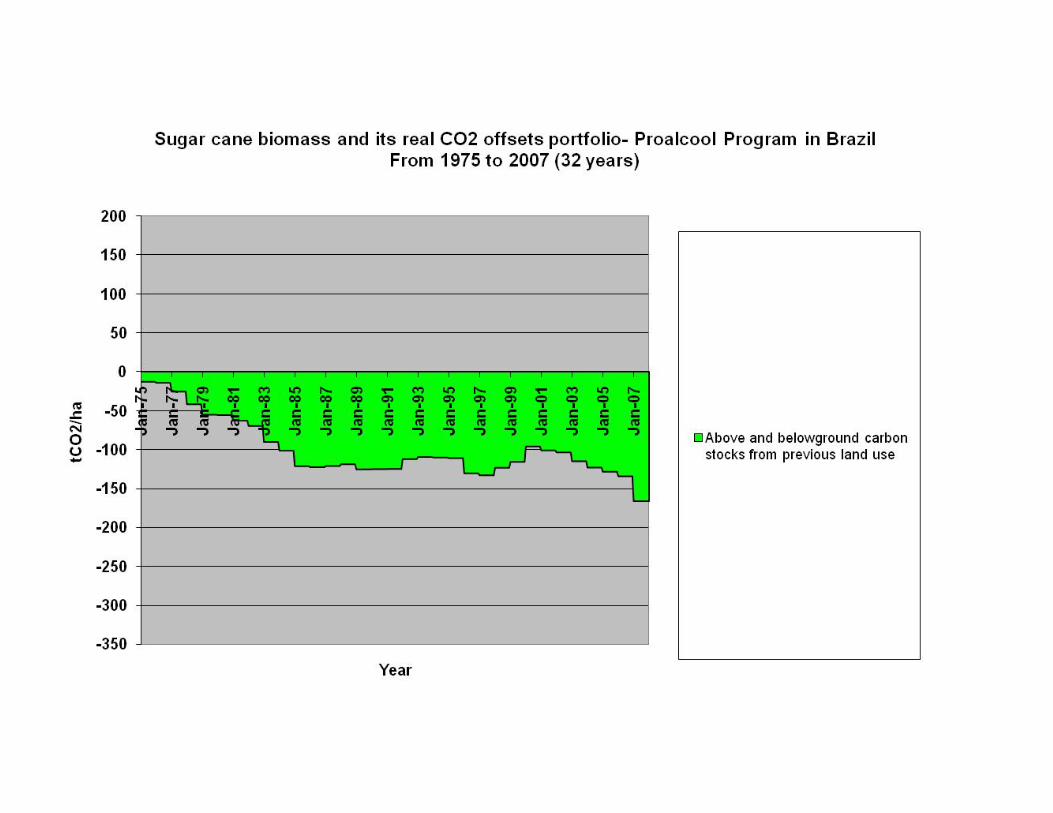


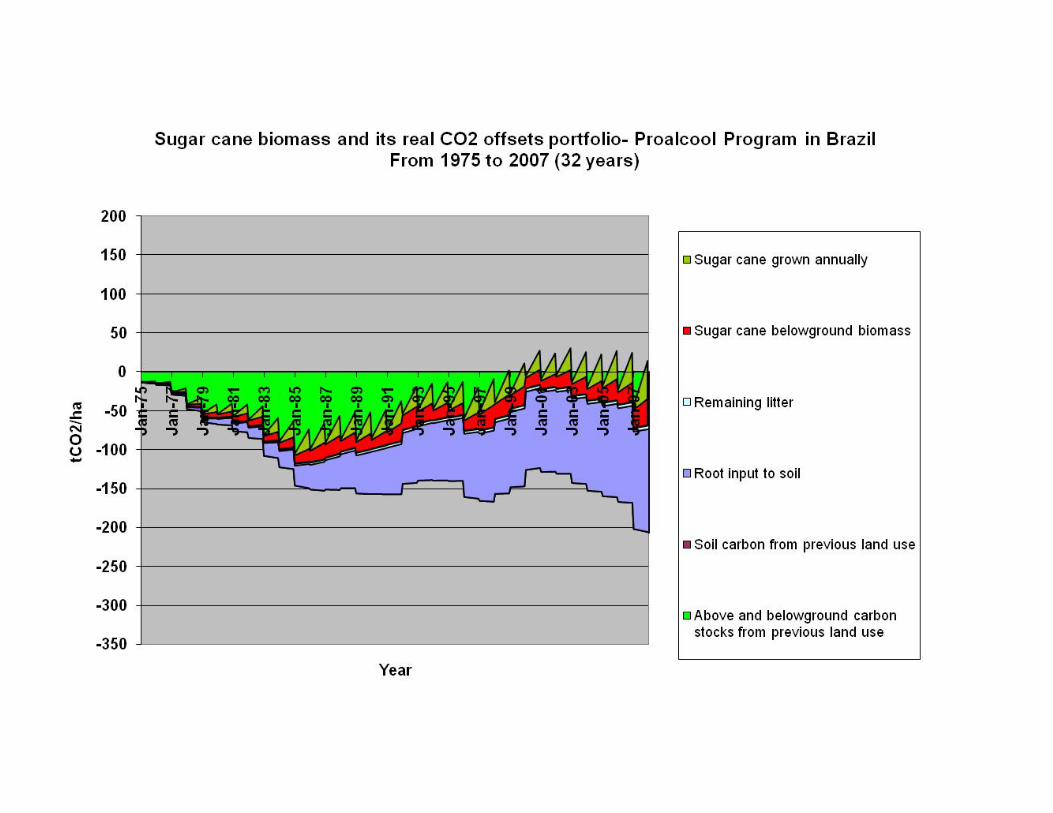

Results
• Accumulated net CO2 emission mitigation up to the end of the period (2007) = 1.5 tCO2/m3 of ethanol produced
• Payback time to neutralize initial emissions = 18 years (1993)
• Negligible contribution from electricity generated and sold to the grid

Effect of modern GHG emissions accounting.
• Emissions are accounted in the same year it occurred (above and below ground vegetation and C from soil). • Emissions are accounted during 20 years starting in the year they occurred with no annual discount. • Emissions from fertilizers and from CH4 are accounted when occurred. • Emissions from Indirect Land Use and Land Use Changes must be accounted.
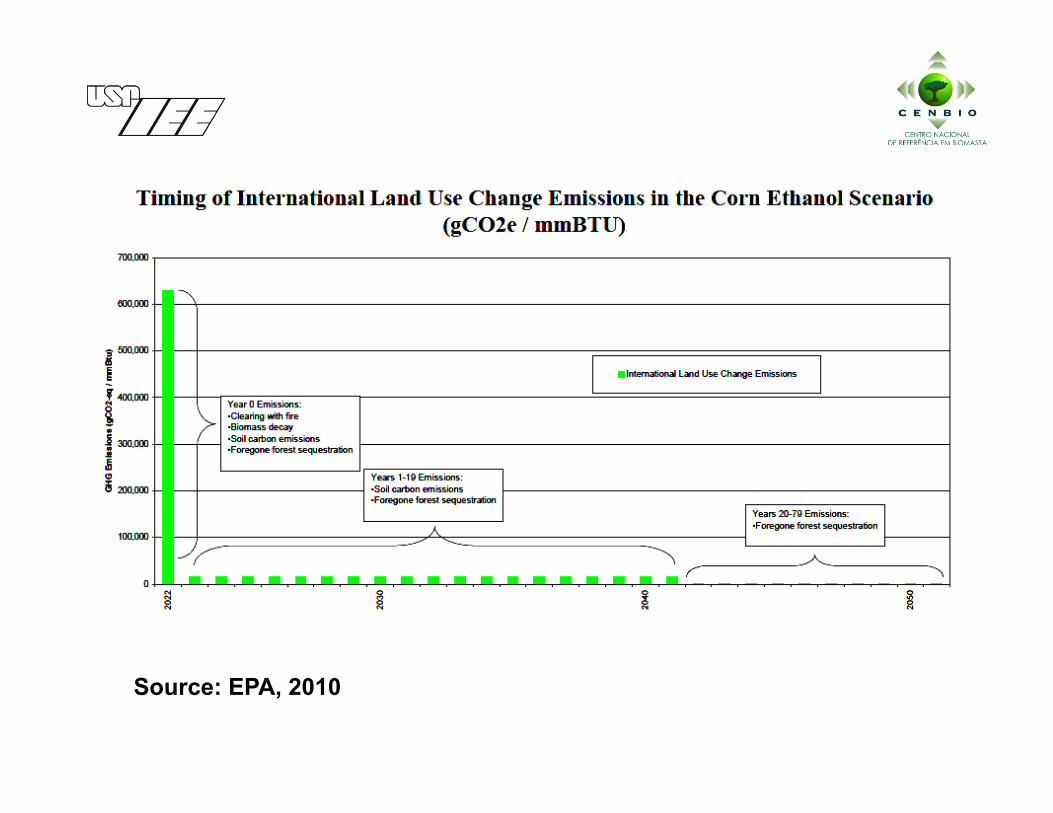
Source: EPA, 2010

4gCO2/MJ
Source: EPA, 2010
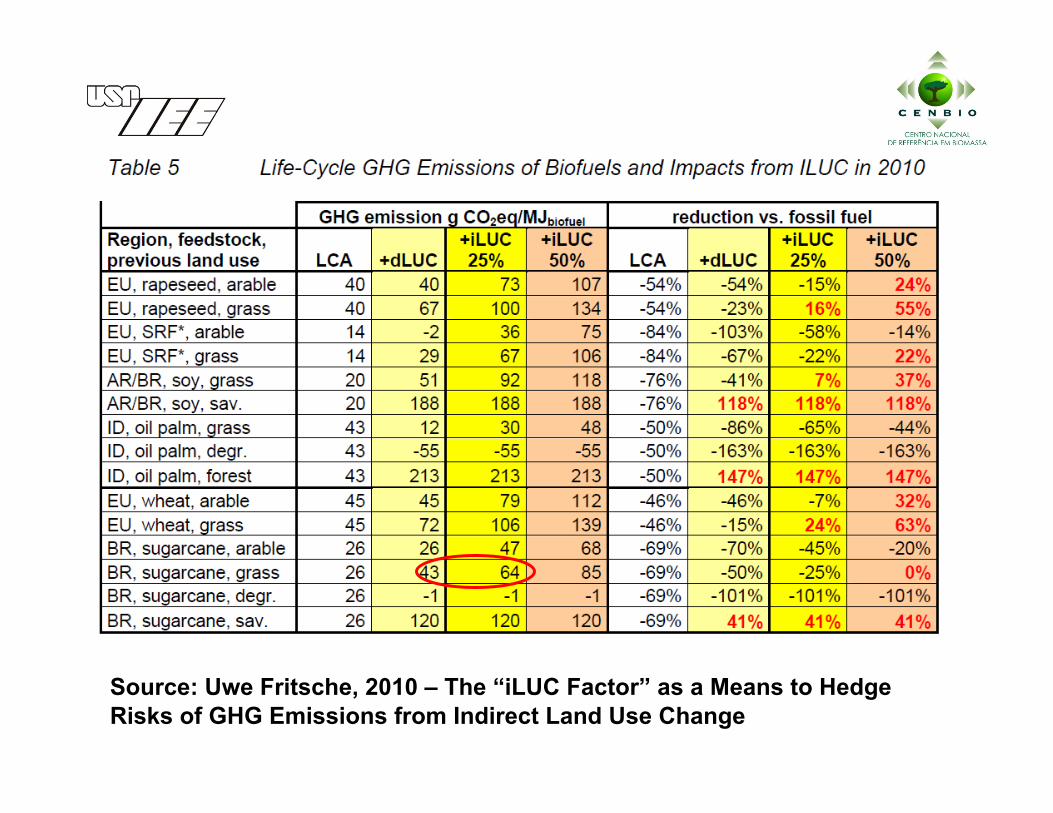
Source: Uwe Fritsche, 2010 – The “iLUC Factor” as a Means to Hedge Risks of GHG Emissions from Indirect Land Use Change

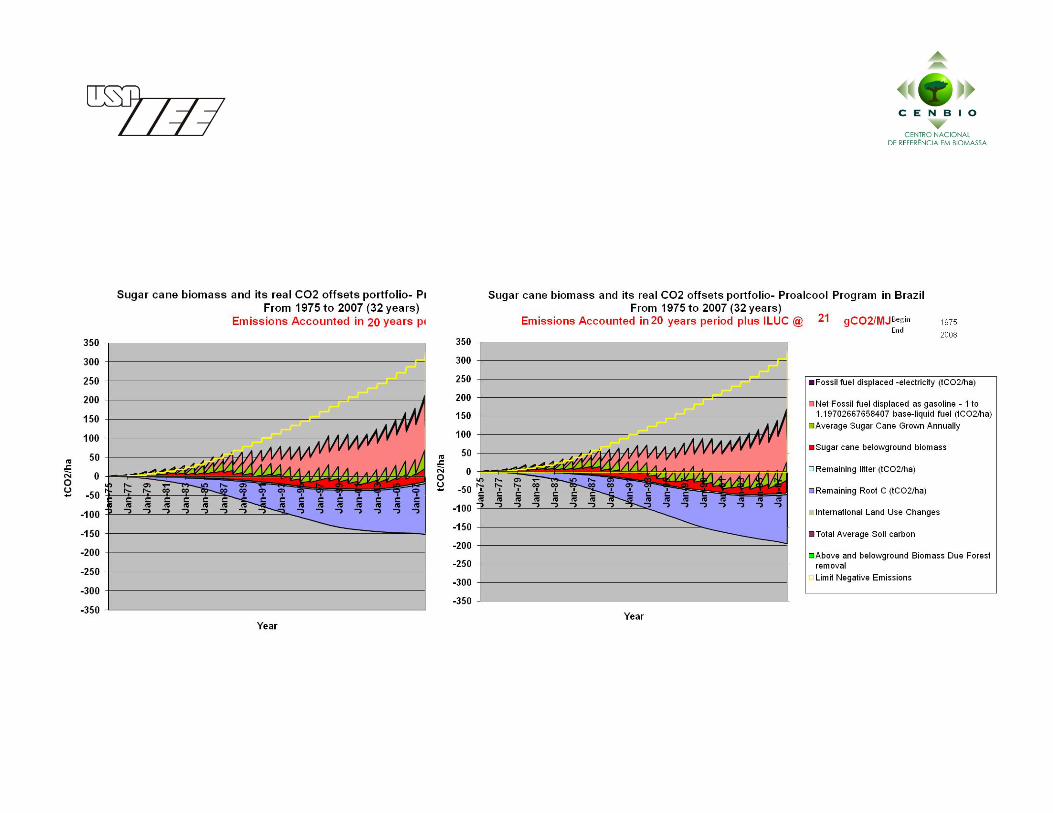

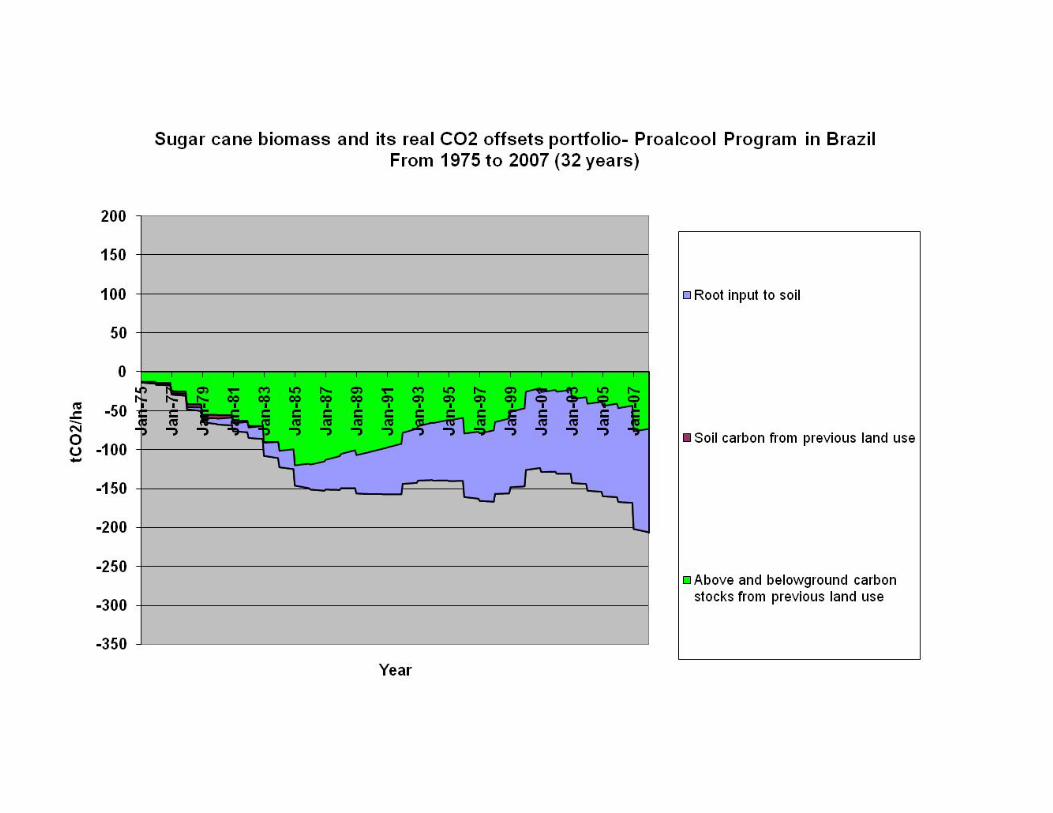
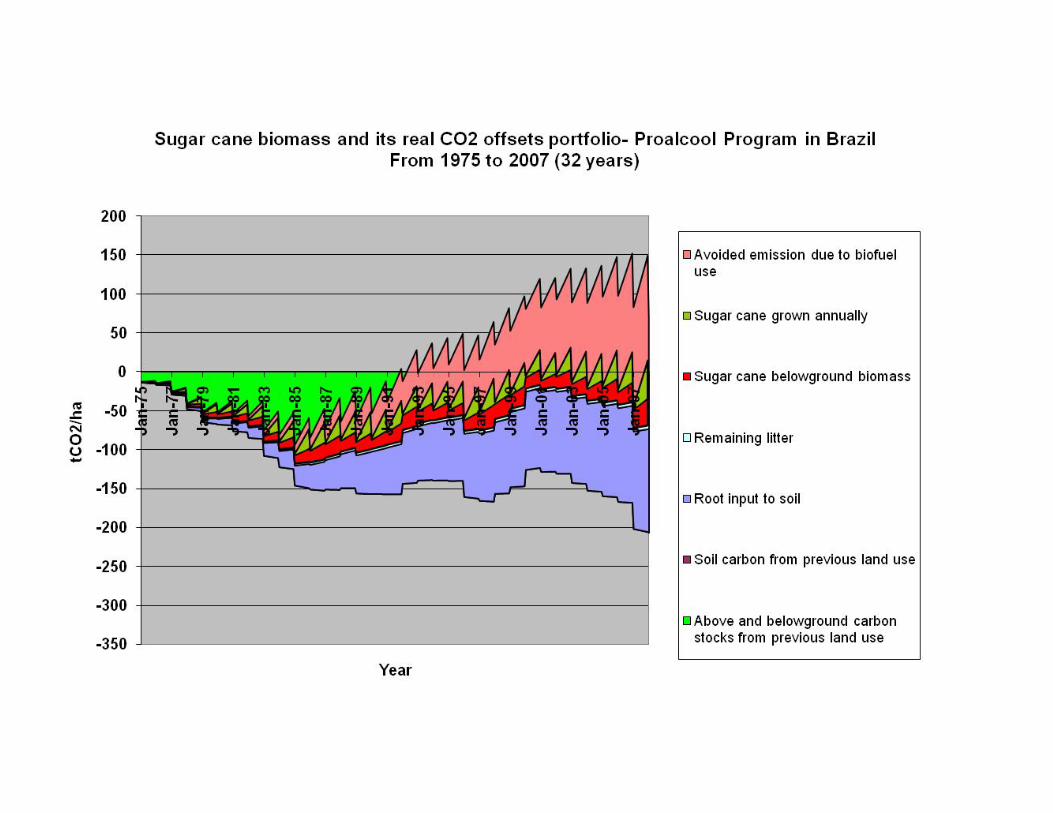
Assump8ons
• Historical yield of sugar cane and planted area recorded in Brazil from 1975 to 2007
• Original land vegetation with an intensity equivalent of 20% of tropical forests (IPCC Guidelines)
• Use of all bagasse and 50% of straw for energy purpose since 1975
• Production of electricity based in presently used steam-based technology (135 kWh/tcane sold to the grid) since the start of the Alcohol Program (1975)
• Emissions due sugar cane plantation, harvesting, processing and distribution from Macedo et al, 2006
• N2O emissions to atmosphere according with IPCC Guidelines
• Fuel efficiency for ethanol - 1.3 liters per liter of gasoline
• CCS of CO2 from fermentation since 1975


Results
Accumulated CO2 emission mitigation of 4.77 tCO2/m3 of ethanol produced
Payback time to neutralize initial emissions = 12 years (1987)
Contributions from ethanol, electricity sold to the grid and CO2 capture very similar (1/3 each one)

THE FUTURE

Source: Tim Dixon, IEA GHG R&D Programme, SBSTA33/COP16/CMP6 Cancun, 1 Dec 2010
Conclusions
• Technical potential BE-CCS options is large in 2050. Up to -10 Gt in power sector (33% of global electricity demand), or; Up to -5 Gt in bio-fuel sector (31% of global fuel demand) Biomass potential is limiting factor
• Realizable potential BE-CCS options is almost -3 Gt (biomass share ~10% of global electricity demand). Co-firing installed capacity + CCS retrofit is largest Biofuels up to -1 Gt (5% of global fuel demand = conservative estimate)
• Economic potential with CO2 price of 50 €/tonne = Up to -3 Gt in both power and bio-fuel sector
• Early BE-CCS opportunities with bio-ethanol most likely exist in US and Brazil

Michael C. Carbo. IEA-‐CERT CCS workshop, Sydney, 20 February 2012

Source: Michael C. Carbo. IEA-CERT CCS workshop, Sydney, 20 February 2012
Opportunities

Accumulated CO2 emission mitigation of 750 tCO2/ha due energy produced from sugar cane in the period 2008-2039 per ha planted means 10.9 GtCO2 mitigated for 14.5 Mha of harvested area.
Considering ethanol yield of 12 m3/ha in 2039, annual ethanol production is 174 Mm3 (887 Mboe/yr or 2.4 Mboe/day)
For the ECN scenario we should produce 385 Mm3/yr of ethanol (5.3 Mboe/day), thus avoiding accumulated 24.1 GtCO2, if plantation had started in 2008. This represents less than 2.5% of global emission in the period.
Considering that 70 Mha of sugar cane harvested can power the global automobile fleet in2039 (Pacca and Moreira 2011), if all fleet be powered by ethanol and electricity, accumulated emission mitigation would be 5.1 % of global emission in the period.
Modest results but important. Probably, one of the least expensive CCS altenative.
CONCLUSION