ENERGY SUBSIDIES IN THE EUROPEAN UNION - CORE · · 2017-05-03ENERGY SUBSIDIES IN THE EUROPEAN...
85
WORKING DOCUMENT OF THE EUROPEAN PARLIAMENT'S DG FOR RESEARCH. NOT YET PUBLISHED BY THE EUROPEAN PARLIAMENT. ENERGY SUBSIDIES IN THE EUROPEAN UNION Final Report Frans Oosterhuis Institute for Environmental Studies (IVM) Vrije Universiteit Amsterdam July 2001
Transcript of ENERGY SUBSIDIES IN THE EUROPEAN UNION - CORE · · 2017-05-03ENERGY SUBSIDIES IN THE EUROPEAN...

WORKING DOCUMENT OF THE EUROPEAN PARLIAMENT'S DG FOR RESEARCH.
NOT YET PUBLISHED BY THE EUROPEAN PARLIAMENT.
ENERGY SUBSIDIES IN THE EUROPEAN UNION
Final Report
Frans OosterhuisInstitute for Environmental Studies (IVM)Vrije UniversiteitAmsterdam
July 2001

2
ACKNOWLEDGEMENT
This study on energy subsidies in the EU was commissioned by the European Parliament,Directorate General for Research. The author would like to thank all those who providedvaluable suggestions and comments on earlier drafts of this report.

3
CONTENTS
SUMMARY...............................................................................................................................................................................5INTRODUCTION..................................................................................................................................................................71. METHODOLOGICAL ISSUES AND GENERAL CONSIDERATIONS.........................................................8
1.1 DEFINING AND QUANTIFYING ENERGY SUBSIDIES.................................................................................81.2 EXTERNAL COSTS AND UNCOMPENSATED DAMAGE.............................................................................91.3 THE INHERITANCE OF PAST SUBSIDIES.......................................................................................................11
2. ENERGY SUBSIDIES IN THE EUROPEAN UNION......................................................................................... 132.1 THE EUROPEAN UNION........................................................................................................................................142.2 AUSTRIA......................................................................................................................................................................182.4 DENMARK...................................................................................................................................................................232.5 FINLAND.....................................................................................................................................................................262.6 FRANCE........................................................................................................................................................................282.7 GERMANY...................................................................................................................................................................332.8 GREECE........................................................................................................................................................................372.9 IRELAND.....................................................................................................................................................................402.10 ITALY..........................................................................................................................................................................423.11 LUXEMBOURG........................................................................................................................................................452.12 THE NETHERLANDS.............................................................................................................................................472.13 PORTUGAL...............................................................................................................................................................512.14 SPAIN..........................................................................................................................................................................532.15 SWEDEN ....................................................................................................................................................................552.16 UNITED KINGDOM................................................................................................................................................58
3. THE ACCESSION COUNTRIES .......................................................................................................................... 603.1 BULGARIA ..................................................................................................................................................................603.2 CYPRUS........................................................................................................................................................................613.3 CZECH REPUBLIC....................................................................................................................................................623.4 ESTONIA ......................................................................................................................................................................643.5 HUNGARY...................................................................................................................................................................653.6 LATVIA ........................................................................................................................................................................673.7 LITHUANIA ................................................................................................................................................................683.8 MALTA .........................................................................................................................................................................693.9 POLAND.......................................................................................................................................................................703.10 ROMANIA .................................................................................................................................................................713.11 SLOVAKIA ................................................................................................................................................................723.12 SLOVENIA ................................................................................................................................................................743.13 TURKEY.....................................................................................................................................................................75
4. CONCLUSIONS.............................................................................................................................................................. 77REFERENCES ..................................................................................................................................................................... 79APPENDIX: ABBREVIATIONS .................................................................................................................................... 85

4
5
SUMMARY
Many European governments as well as the EU itself provide financial support to varioussources of energy. Such subsidies have been introduced for a variety of reasons, includingeconomic, social, political, technological and environmental ones. However, energy subsidiesalso imply market distortions, leading to inefficiencies in the functioning of energy markets,and they may have unwanted side effects, such as reducing the attractiveness of energyconservation and renewable energy.
The present study contains a survey of energy subsidies existing in the EU and the AccessionCountries by the end of the 20th century. Lacking any ‘objective’ definition of whatconstitutes a subsidy, and lacking any ‘objective’ baseline against which the size of a subsidycan be measured, some pragmatic and sometimes arbitrary choices had to be made.Furthermore, the information needed to quantify the amounts of subsidy involved was notalways available.
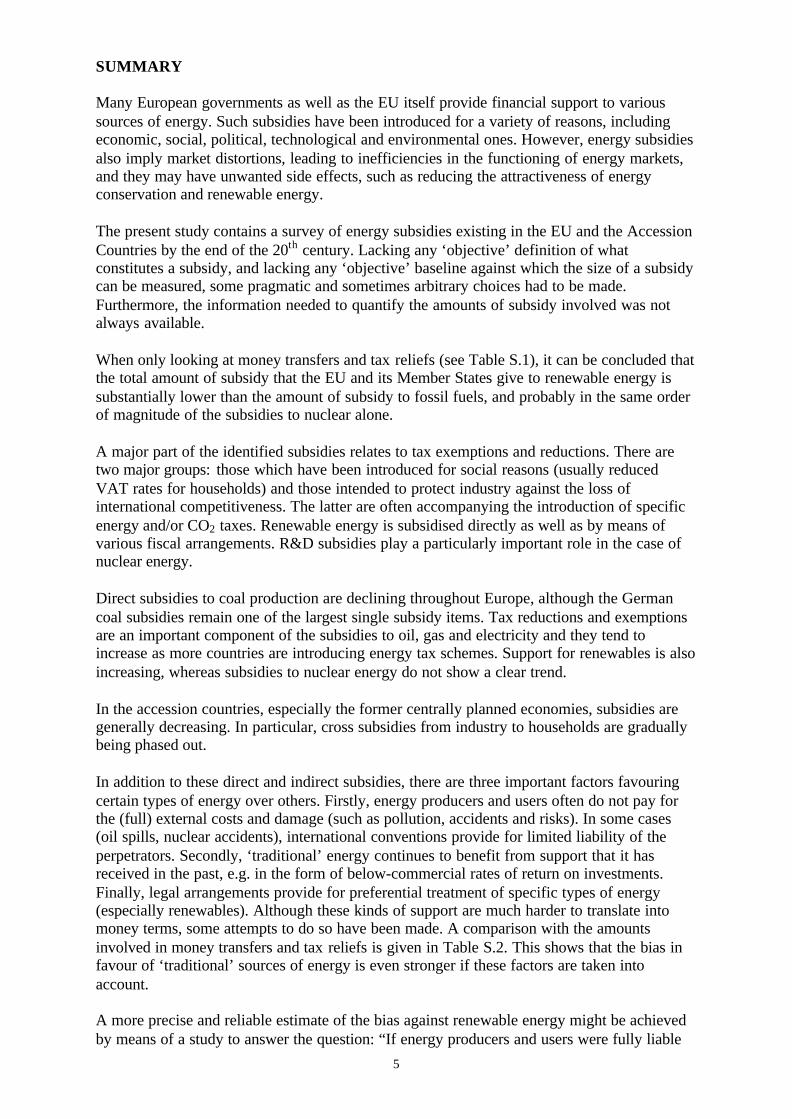
When only looking at money transfers and tax reliefs (see Table S.1), it can be concluded thatthe total amount of subsidy that the EU and its Member States give to renewable energy issubstantially lower than the amount of subsidy to fossil fuels, and probably in the same orderof magnitude of the subsidies to nuclear alone.
A major part of the identified subsidies relates to tax exemptions and reductions. There aretwo major groups: those which have been introduced for social reasons (usually reducedVAT rates for households) and those intended to protect industry against the loss ofinternational competitiveness. The latter are often accompanying the introduction of specificenergy and/or CO2 taxes. Renewable energy is subsidised directly as well as by means ofvarious fiscal arrangements. R&D subsidies play a particularly important role in the case ofnuclear energy.
Direct subsidies to coal production are declining throughout Europe, although the Germancoal subsidies remain one of the largest single subsidy items. Tax reductions and exemptionsare an important component of the subsidies to oil, gas and electricity and they tend toincrease as more countries are introducing energy tax schemes. Support for renewables is alsoincreasing, whereas subsidies to nuclear energy do not show a clear trend.
In the accession countries, especially the former centrally planned economies, subsidies aregenerally decreasing. In particular, cross subsidies from industry to households are graduallybeing phased out.
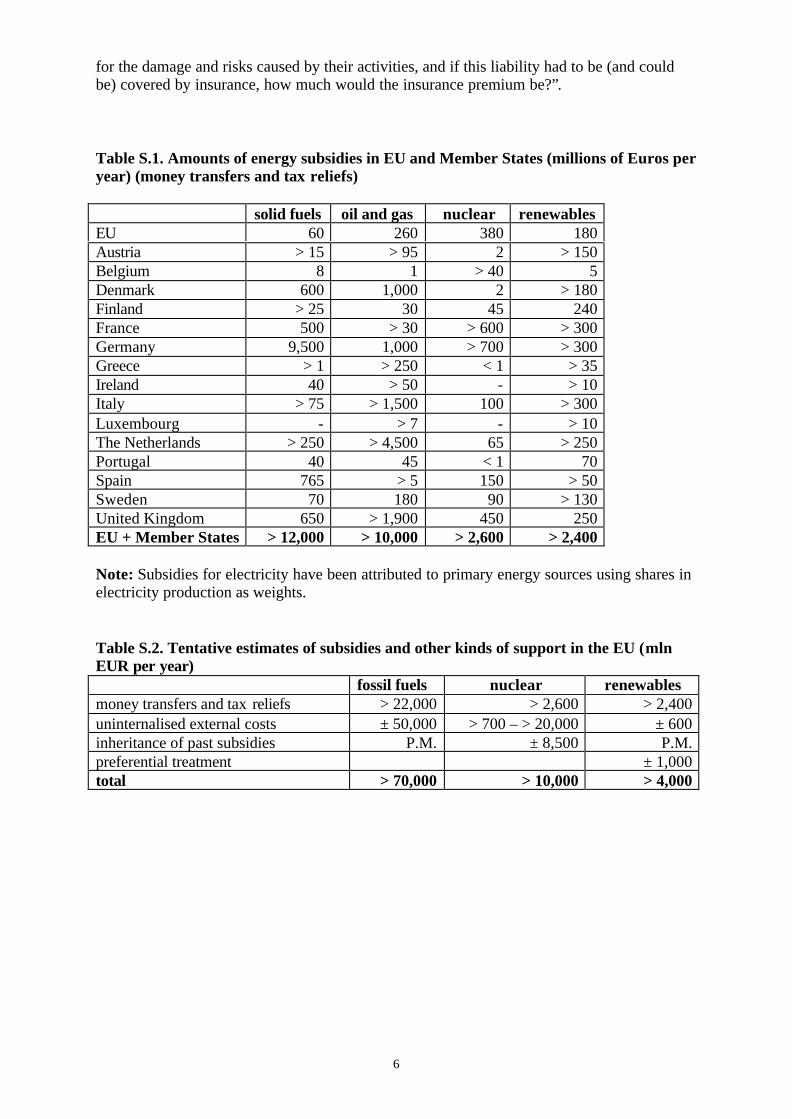
In addition to these direct and indirect subsidies, there are three important factors favouringcertain types of energy over others. Firstly, energy producers and users often do not pay forthe (full) external costs and damage (such as pollution, accidents and risks). In some cases(oil spills, nuclear accidents), international conventions provide for limited liability of theperpetrators. Secondly, ‘traditional’ energy continues to benefit from support that it hasreceived in the past, e.g. in the form of below-commercial rates of return on investments.Finally, legal arrangements provide for preferential treatment of specific types of energy(especially renewables). Although these kinds of support are much harder to translate intomoney terms, some attempts to do so have been made. A comparison with the amountsinvolved in money transfers and tax reliefs is given in Table S.2. This shows that the bias infavour of ‘traditional’ sources of energy is even stronger if these factors are taken intoaccount.
A more precise and reliable estimate of the bias against renewable energy might be achievedby means of a study to answer the question: “If energy producers and users were fully liable
6
for the damage and risks caused by their activities, and if this liability had to be (and couldbe) covered by insurance, how much would the insurance premium be?”.
Table S.1. Amounts of energy subsidies in EU and Member States (millions of Euros peryear) (money transfers and tax reliefs)
solid fuels oil and gas nuclear renewablesEU 60 260 380 180Austria > 15 > 95 2 > 150Belgium 8 1 > 40 5Denmark 600 1,000 2 > 180Finland > 25 30 45 240France 500 > 30 > 600 > 300Germany 9,500 1,000 > 700 > 300Greece > 1 > 250 < 1 > 35Ireland 40 > 50 - > 10Italy > 75 > 1,500 100 > 300Luxembourg - > 7 - > 10The Netherlands > 250 > 4,500 65 > 250Portugal 40 45 < 1 70Spain 765 > 5 150 > 50Sweden 70 180 90 > 130United Kingdom 650 > 1,900 450 250EU + Member States > 12,000 > 10,000 > 2,600 > 2,400
Note: Subsidies for electricity have been attributed to primary energy sources using shares inelectricity production as weights.
Table S.2. Tentative estimates of subsidies and other kinds of support in the EU (mlnEUR per year)
fossil fuels nuclear renewablesmoney transfers and tax reliefs > 22,000 > 2,600 > 2,400uninternalised external costs ± 50,000 > 700 – > 20,000 ± 600inheritance of past subsidies P.M. ± 8,500 P.M.preferential treatment ± 1,000total > 70,000 > 10,000 > 4,000
7
INTRODUCTION
Subsidies and other types of financial support to various sources of energy are quite commonthroughout the European Union, as well as in the countries that have applied for membership(the accession countries). These subsidies have been introduced for various reasons, such as:- ‘traditional’ energy policy considerations (security of supply, diversification,
development of domestic energy resources, competitiveness);- social and regional policy considerations (e.g. to maintain income and employment in
mining regions or to make heating fuels affordable for low-income households);- technology policy considerations (e.g. to build up a strong international position in
nuclear know-how);- environmental policy considerations (e.g. to stimulate renewable energy).
In a liberalising European energy market, the need for a ‘level playing field’ implies the needfor a critical assessment of the distortions created by existing energy subsidies. Furthermore,financial support to conventional energy sources may be barriers to achieve the EU’s policyobjectives on CO2 reduction and a higher share of renewables.
Against this background, the European Parliament has commissioned the present study,which presents a survey of existing energy subsidies in the EU, its member states and theaccession countries.
The report is structured as follows. In Chapter 1, some methodological aspects and generalconsiderations are discussed. Chapter 2 presents a review of energy subsidies in the EU andits 15 member states. The situation in the 13 accession countries is described in Chapter 3,whereas Chapter 4 contains the conclusions.
8
1. METHODOLOGICAL ISSUES AND GENERAL CONSIDERATIONS
1.1 DEFINING AND QUANTIFYING ENERGY SUBSIDIES
The fact that many governments provide substantial amounts of financial support to theproduction and consumption of energy has led to a considerable research activity in recentyears. An important reason for the interest in energy subsidies is the possible negative impacton the environment that they could have, by providing ‘perverse’ incentives – i.e., byincreasing the demand for energy in general and for polluting types of energy in particular.Another major concern, mainly expressed by economists, are the market distortions thatenergy subsidies generate, thus impeding the market mechanism to function properly, leadingto a sub-optimal allocation and restricting social welfare. Several studies have been publishedon environmentally adverse subsidies, including energy subsidies (e.g. Roodman, 1996; DeMoor and Calamai, 1997; Greenpeace, 1997; Myers and Kent, 1998; OECD, 1996, 1999b).
When trying to identify and quantify energy subsidies, one will unavoidably be confrontedwith a number of methodological and definition problems. Two of the main problems are:1. The fact that there is no fundamental difference between energy subsidies in a narrow
sense (i.e., direct payments from the public budget benefiting the supply or use of energy)and other kinds of support. Thus, all policies favouring the production or consumption of(specific kinds of) energy can in principle be seen as ‘subsidies’. Looking only at actualcash flows would lead to a limited and distorted result. However, including all policiesthat affect the supply of and demand for energy would imply an unmanageable task.Somehow, a compromise between the two extremes has to be found. The emphasis in thisreport is on subsidies involving actual money transfers (including tax relief), but attentionis also paid to other kinds of support (see Sections 1.2, 1.3 and 1.4).
2. The fact that there is no such thing as an ‘objective baseline’, i.e. an ‘ideal’ situation thatprovides a reference against which the size of a subsidy can be measured. For example,the fact that fuels are taxed more heavily when they are used for transport than when theyare used for heating could be regarded as a subsidy for the heating fuels. However, thehigher tax for the transport fuel can also be seen as a payment for the use of infrastructureand for ‘external costs’ (such as congestion and accidents). Determining whether asubsidy exists (either on the transport or the heating fuel) and what its size is wouldrequire a full assessment of these external costs, which is obviously not feasible.
The present study takes a pragmatic approach in dealing with these complexities. Rather thanstarting from a definition of energy subsidies, the demarcation line has been drawn bydescribing types of support that have remained beyond the scope of the study. Thus, thefollowing arrangements are not included as energy subsidies1:- differences in mineral oil tax rates between road traffic and other types of use of the same
fuel;- differentiations and exemptions in excise taxes on mineral oil products for road transport
(e.g., reduced rates for unleaded petrol or low-sulphur diesel);- exemptions from taxes for fuels which are used for non-energy purposes (e.g. as a
chemical feedstock);- exemptions from taxes for fuels which are used for electricity generation (if electricity is
taxed);- public money for investments that only have an indirect relationship with energy use
(e.g., in road infrastructure);
1 In some cases, they may be mentioned in the text, but they are not counted as subsidies whenestimating the order of magnitude of subsidies for particular types of energy.
9
- public money for programs related to the termination of energy production activities, in asfar as these expenditures are not part of the normal costs that should have been borne bythe operator of the activity (e.g. losses incurred due to a politically motivated earlyclosure of nuclear plants; social programs to alleviate the consequences of coal mineclosures);
- differentiations in the conditions under which energy companies can operate (lacking any‘baseline’ for these conditions), except when these conditions relate to provisions whichalso apply to other industries (thus, a lower corporate tax rate for oil and gas producingcompanies than for other companies is included as a subsidy, but differences in the state’sshare in mining profits or royalties are not);
- subsidy schemes which are not exclusively related to energy and for which the partrelated to energy could not be identified separately;
- ‘cross-subsidies’, i.e. subsidies entirely financed by other users of the same kind ofenergy;
- financial compensation, given in reaction to energy price increases (such as those givenby several governments to the transport, agriculture and fisheries sectors, followingprotests in autumn 2000);
- subsidies for energy conservation (including subsidies for combined heat and power2);- general energy subsidies which could not be allotted to a particular fuel or type of energy;- general public provisions that can be related to energy (e.g. military expenditures to
safeguard oil supplies from the Middle East, or the cost of police forces protectingnuclear transports).
Furthermore, the present report does not refer to subsidies to energy projects and investmentsoutside the EU or the accession countries. Subsidies amounting to less than EUR 1 millionper year are also excluded. The emphasis is on subsidies provided by central governments,although subsidies by regional governments are included where they play an important role inenergy policies.
Having drawn these pragmatic demarcation lines, an overview of the various energy subsidyschemes in the EU and the accession countries will be presented in the next chapters. Beforedoing so, three types of government support will be discussed that do not involve actualmoney transfers, but which can be important factors favouring particular types of energy: thenon-internalisation of external costs, the lasting impact of subsidies that have been providedin the past; and the existence of legal arrangements giving preferential treatment to certainkinds of energy.
1.2 EXTERNAL COSTS AND UNCOMPENSATED DAMAGE
An important, but largely hidden type of support to energy is the fact that energy producersand consumers often do not pay the full social cost of energy. In economic terms: the externalcost of energy remains to a large extent uninternalised. Examples of such costs are theenvironmental damage caused by oil spills or by air pollution from burning fossil fuels, thecosts of accidents (e.g. in coal mining), and the risks associated with nuclear power.Obviously, some internalisation occurs if regulations are in place which oblige the energyproducer or user to take preventive measures or to compensate the damage. However, thecosts of the uncompensated damage and risks that remain are largely borne by society as awhole rather than by the firms or individuals bringing them about. Such shifts of (potential)costs from the private to the public domain can be seen as subsidies.
2 Although subsidies to combined heat and power (CHP) are intended to be instruments of energyconservation, they can also be regarded as subsidies favouring the fuel that is being used. However, even if onetakes that vision, the subsidy could not be attributed to one particular kind of energy, because CHP can involveseveral types of fuels (though in practice the majority is fossil).
10
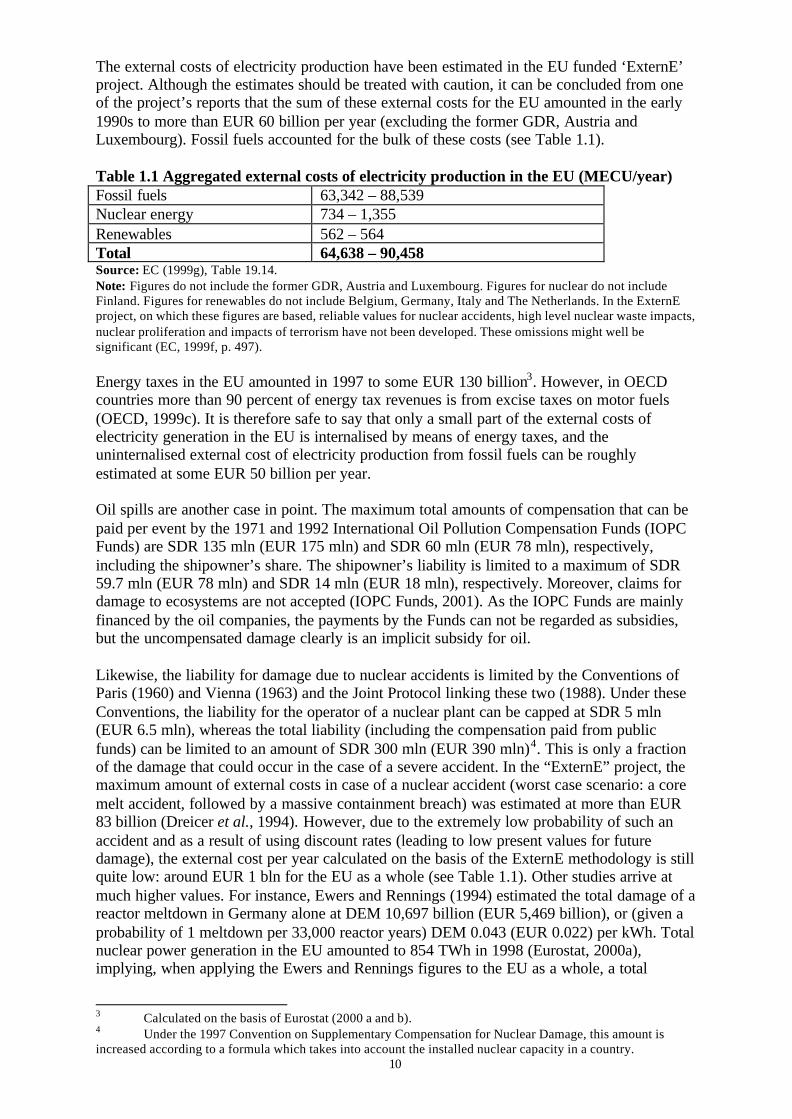
The external costs of electricity production have been estimated in the EU funded ‘ExternE’project. Although the estimates should be treated with caution, it can be concluded from oneof the project’s reports that the sum of these external costs for the EU amounted in the early1990s to more than EUR 60 billion per year (excluding the former GDR, Austria andLuxembourg). Fossil fuels accounted for the bulk of these costs (see Table 1.1).
Table 1.1 Aggregated external costs of electricity production in the EU (MECU/year)Fossil fuels 63,342 – 88,539Nuclear energy 734 – 1,355Renewables 562 – 564Total 64,638 – 90,458Source: EC (1999g), Table 19.14.Note: Figures do not include the former GDR, Austria and Luxembourg. Figures for nuclear do not includeFinland. Figures for renewables do not include Belgium, Germany, Italy and The Netherlands. In the ExternEproject, on which these figures are based, reliable values for nuclear accidents, high level nuclear waste impacts,nuclear proliferation and impacts of terrorism have not been developed. These omissions might well besignificant (EC, 1999f, p. 497).
Energy taxes in the EU amounted in 1997 to some EUR 130 billion3. However, in OECDcountries more than 90 percent of energy tax revenues is from excise taxes on motor fuels(OECD, 1999c). It is therefore safe to say that only a small part of the external costs ofelectricity generation in the EU is internalised by means of energy taxes, and theuninternalised external cost of electricity production from fossil fuels can be roughlyestimated at some EUR 50 billion per year.
Oil spills are another case in point. The maximum total amounts of compensation that can bepaid per event by the 1971 and 1992 International Oil Pollution Compensation Funds (IOPCFunds) are SDR 135 mln (EUR 175 mln) and SDR 60 mln (EUR 78 mln), respectively,including the shipowner’s share. The shipowner’s liability is limited to a maximum of SDR59.7 mln (EUR 78 mln) and SDR 14 mln (EUR 18 mln), respectively. Moreover, claims fordamage to ecosystems are not accepted (IOPC Funds, 2001). As the IOPC Funds are mainlyfinanced by the oil companies, the payments by the Funds can not be regarded as subsidies,but the uncompensated damage clearly is an implicit subsidy for oil.
Likewise, the liability for damage due to nuclear accidents is limited by the Conventions ofParis (1960) and Vienna (1963) and the Joint Protocol linking these two (1988). Under theseConventions, the liability for the operator of a nuclear plant can be capped at SDR 5 mln(EUR 6.5 mln), whereas the total liability (including the compensation paid from publicfunds) can be limited to an amount of SDR 300 mln (EUR 390 mln)4. This is only a fractionof the damage that could occur in the case of a severe accident. In the “ExternE” project, themaximum amount of external costs in case of a nuclear accident (worst case scenario: a coremelt accident, followed by a massive containment breach) was estimated at more than EUR83 billion (Dreicer et al., 1994). However, due to the extremely low probability of such anaccident and as a result of using discount rates (leading to low present values for futuredamage), the external cost per year calculated on the basis of the ExternE methodology is stillquite low: around EUR 1 bln for the EU as a whole (see Table 1.1). Other studies arrive atmuch higher values. For instance, Ewers and Rennings (1994) estimated the total damage of areactor meltdown in Germany alone at DEM 10,697 billion (EUR 5,469 billion), or (given aprobability of 1 meltdown per 33,000 reactor years) DEM 0.043 (EUR 0.022) per kWh. Totalnuclear power generation in the EU amounted to 854 TWh in 1998 (Eurostat, 2000a),implying, when applying the Ewers and Rennings figures to the EU as a whole, a total
3 Calculated on the basis of Eurostat (2000 a and b).4 Under the 1997 Convention on Supplementary Compensation for Nuclear Damage, this amount isincreased according to a formula which takes into account the installed nuclear capacity in a country.

11
external cost from nuclear accident risks for the EU of almost EUR 20 billion per year.Including the external cost of other parts of the nuclear cycle would imply still (much) higherfigures. Allowing nuclear plant operators to leave this damage largely uninsured implies animplicit subsidy (by way of unpaid insurance premiums) in the same orders of magnitude.
It can be concluded that the size of uninternalised external costs of energy is considerable,even though the estimates are largely uncertain (especially in the case of nuclear). In order toarrive at more precise figures of the implicit subsidy involved, it might be interesting tolaunch a study to answer the question: “If energy producers and users were fully liable for thedamage and risks caused by their activities, and if this liability had to be (and could be)covered by insurance, how much would the insurance premium be?”.
1.3 THE INHERITANCE OF PAST SUBSIDIES
Before the process of liberalisation and privatisation started in the EU, energy supply waswidely regarded as a ‘public service’. Energy companies were in many cases state owned andheavily regulated so as to contribute to the political objectives of governments. Although theinvisible subsidies implied in these arrangements have been substantially reduced, they havenot disappeared. Moreover, the impact of past subsidies can remain a beneficial factor forparticular types of energy for a long time, especially in case of long term investments.
For example, countries like The Netherlands and Denmark have devoted large amounts ofmoney to the creation of natural gas networks. Although the role of direct governmentsubsidies was limited, tariff regulations and fiscal facilities have played an important role.Present users of natural gas are still benefiting from these investments by paying lower pricesthan would have been the case if the infrastructure had been financed on commercial terms.
Similarly, investments in nuclear power plants have been facilitated by requiring financialrates of return well below commercial rates. Michaelis (1997) argues that, if a 10%-11%required rate of return (RRR) is taken as the benchmark for the market rate, the 5% RRRrequired by the British government in the early 1980s reduced the apparent cost of nuclear-generated electricity by approximately 1.6 pence per kWh (nearly 40%). Investment innuclear power plants has also benefited from direct subsidies. For instance, the EuropeanCommunity has contributed EUR 2.9 billion to investments in nuclear power plants since thestart of the Euratom Treaty in 1957 (EC, 2000r). Current nuclear power production stillbenefits from these capital subsidies. Assuming that for all existing nuclear capacity in theEU government investment support has led to an average cost reduction of EUR 0.01 perkWh, the effective annual subsidy (given the above mentioned nuclear power generation of854 TWh) amounts to some EUR 8.5 billion.
Renewable energy also benefits from past public investments (e.g. in large scalehydropower), but to a much lesser extent.
Another example of subsidy legacies from the past are the ‘stranded costs’ involved inprojects that would have been too risky for a commercial firm, but could be done thanks tothe ‘soft budget constraints’ of state owned or monopolistic enterprises. Examples are the fastbreeder reactors that have been closed down in Germany and France and an expensive coalgasification project in The Netherlands. With the liberalisation of the energy markets, thesecosts and the huge subsidies they imply are becoming visible.
12
1.4 PREFERENTIAL TREATMENT OF PARTICULAR TYPES OF ENERGY
Several EU governments have introduced arrangements requiring energy companies topurchase specific kinds of electricity (in particular renewables based) from independentpower producers at a fixed price. The best known example of such an arrangement is theGerman ‘Stromeinspeisungsgesetz’. Comparable arrangements exist in Austria, Greece, Italyand Spain. In March 2001, the European Court of Justice has ruled that this type of supportdoes not constitute state aid under the EU Treaty (ENDS, 2001). Nevertheless, an implicitsubsidy element is involved. In 1997, electricity production from renewables in the fivecountries mentioned (excluding large scale hydro, which usually does not qualify for such‘feed in’ arrangements) amounted to 33 TWh (calculated on the basis of EC (2000v) andEurostat, (2000a)). Assuming an average price premium of EUR 0.03 per kWh, the implicitannual subsidy can be estimated to be in the order of magnitude of EUR 1 billion.

13
2. ENERGY SUBSIDIES IN THE EUROPEAN UNION
This Chapter provides information on the energy subsidies provided by the EU and its fifteenmember states. They are classified by category of energy: solid fuels (coal, lignite and peat);oil and gas; nuclear energy; renewables; and electricity. The most recent availableinformation has been used, generally relating to the late 1990s or the year 2000.
To the extent possible, attempts have been made to quantify the amounts of subsidiesinvolved5. As a reasonably precise quantification of subsidies is not always possible, theamounts mentioned should be treated with caution and mainly be regarded as indicators ofthe orders of magnitude. The (rounded) total amounts of quantifiable subsidies by type ofenergy are mentioned in the tables at the end of each section. Subsidies to electricity havebeen ‘translated’ into subsidies for primary energy sources by distributing them according tothe share of each energy type in total gross electricity generation in 1998.
5 Quantifiable subsidy amounts have been expressed in Euros per year (printed bold and in italics).Exchange rates used are those of December 31st, 1999. Incidentally, the value of the Euro and the US Dollarwere almost exactly the same by that date. In case of subsidy amounts showing large differences betweendifferent years, averages of several years have been calculated to the extent possible.

14
2.1 THE EUROPEAN UNION
General
Many EU energy subsidy schemes and funding programmes cover energy in general and cantherefore not always be attributed (completely) to a particular type of energy. The main‘general’ support schemes that are relevant for energy include:- The Thematic Programme ‘Energy’ within the 5th framework programme for research,
technological development and demonstration (1999-2002). The budget is EUR 1,042mln, of which 1,026 mln for ‘key actions’. Part of this amount could be attributed tospecific types of energy (see Table 2.1.1)6;
- Parts of the Structural Funds (which include the Regional Development Fund (ERDF),the Social Fund and the Guidance section of the European Agricultural Guidance andGuarantee Fund). Under Objective I, an amount of EUR 2,496 mln was budgeted forenergy projects in the period 1994-1999. Energy projects have been financed undernational programmes as well as under various Community Initiatives, such as Interreg II,FEDER, Urban, EMS, Leader and Regis II;
- Parts of Phare (mainly within the sectors ‘environment and nuclear safety’ and‘infrastructure’, for which in the period 1990-1998 EUR 447 mln and EUR 958 mln hasbeen disbursed, respectively - EC, 2000s);
- ALURE: a programme for economic co-operation in the energy sector between the EUand Latin America (budget: EUR 25 mln for the period 1998-2002);
- Synergy: a programme for co-operation with non-member countries in the area of energy.It has a budget of EUR 15 mln for the period 1998-2002;
- ETAP: a programme for analysis and forecast at the EU level, and other related work inthe energy sector (budget: EUR 5 mln for the period 1998-2002)
Table 2.1.1. Subdivision of RTD subsidies for energy in the 5th Framework ProgrammeKey action: Cleaner energysystems, including renewables
Key action: Economic and efficientenergy for a competitive Europe
Total (mln €)
percentage amount (mln € ) percentage amount (mln € )coal 1.6 7.7 0.3 2.0 9.7oil and gas 2.6 12.7 25.7 140.7 153.4renewables 50.3 240.7 27.6 151.2 391.9electricity 22.9 109.7 5.9 32.0 141.7other/notattributable
22.6 108.3 40.4 221.1 329.4
TOTAL 100 479 100 547 1,026
Solid fuels
The CARNOT programme was devised in order to promote European technology relating tothe clean and efficient use of solid fuels. It covers the years 1998-2002 and has a budget ofEUR 3 mln (somewhat less than EUR 1 mln per year).
Within the framework of the ECSC, a coal research programme has been running for morethan 40 years. The current annual budget is about EUR 25 mln.
6 This has been done by attaching to each RTD project that has been funded up to now a weightconsisting of the product of its duration and number of participating institutions.
15
The share of coal in the 5th RTD programme’s budget was estimated at EUR 9.7 mln (cf.Table 2.1.1) or EUR 2 mln per year.
Under a 1994-1999 Structural Funds programme, financial support for the use of peat inIreland has been provided (EC, 2001). The amount involved was about IEP 20 mln (IEA,1999c) or EUR 4 mln per year.
Under the Phare programme, support for coal related projects amounted to a total of EUR26.75 mln (EUR 3.3 mln per year) over the period 1990-1997 (calculated after ERM, 1999).
Oil and gas
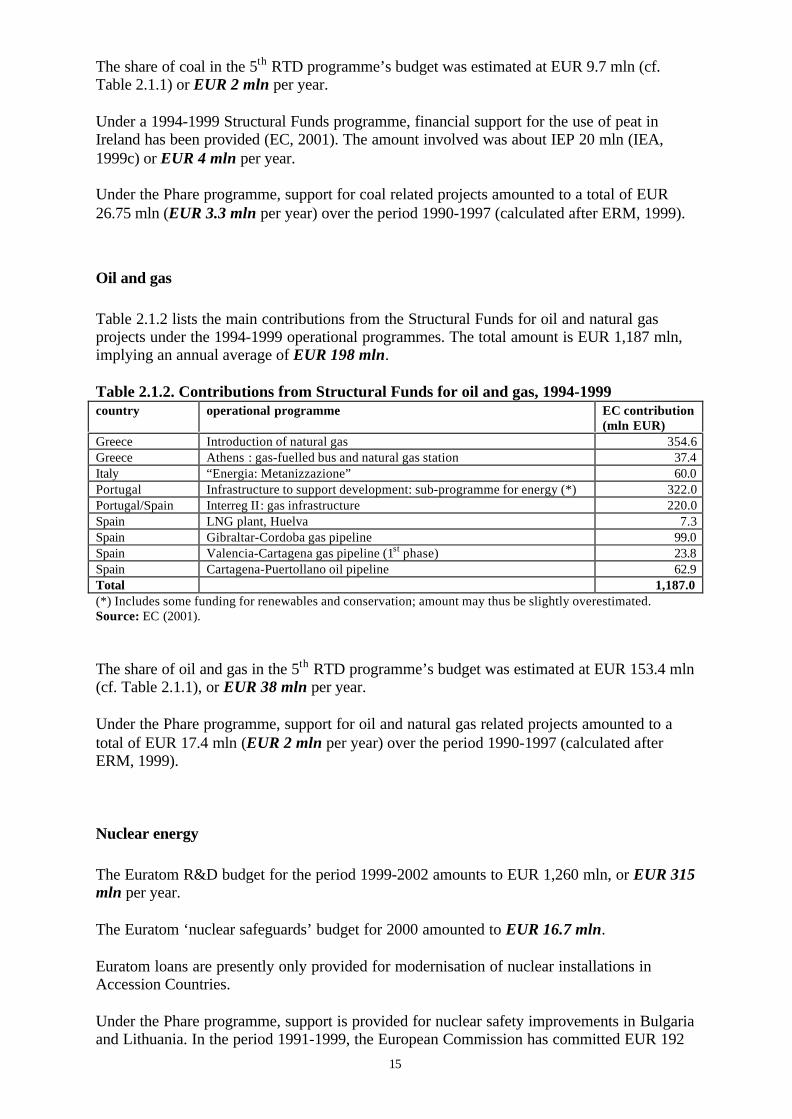
Table 2.1.2 lists the main contributions from the Structural Funds for oil and natural gasprojects under the 1994-1999 operational programmes. The total amount is EUR 1,187 mln,implying an annual average of EUR 198 mln.
Table 2.1.2. Contributions from Structural Funds for oil and gas, 1994-1999country operational programme EC contribution
(mln EUR)Greece Introduction of natural gas 354.6Greece Athens : gas-fuelled bus and natural gas station 37.4Italy “Energia: Metanizzazione” 60.0Portugal Infrastructure to support development: sub-programme for energy (*) 322.0Portugal/Spain Interreg II: gas infrastructure 220.0Spain LNG plant, Huelva 7.3Spain Gibraltar-Cordoba gas pipeline 99.0Spain Valencia-Cartagena gas pipeline (1st phase) 23.8Spain Cartagena-Puertollano oil pipeline 62.9Total 1,187.0(*) Includes some funding for renewables and conservation; amount may thus be slightly overestimated.Source: EC (2001).
The share of oil and gas in the 5th RTD programme’s budget was estimated at EUR 153.4 mln(cf. Table 2.1.1), or EUR 38 mln per year.
Under the Phare programme, support for oil and natural gas related projects amounted to atotal of EUR 17.4 mln (EUR 2 mln per year) over the period 1990-1997 (calculated afterERM, 1999).
Nuclear energy
The Euratom R&D budget for the period 1999-2002 amounts to EUR 1,260 mln, or EUR 315mln per year.
The Euratom ‘nuclear safeguards’ budget for 2000 amounted to EUR 16.7 mln.
Euratom loans are presently only provided for modernisation of nuclear installations inAccession Countries.
Under the Phare programme, support is provided for nuclear safety improvements in Bulgariaand Lithuania. In the period 1991-1999, the European Commission has committed EUR 192
16
mln (on average EUR 21 mln per year) for nuclear safety under the Phare programme (EC,2000u).
Renewables
Financial support for renewable energy is mainly coming from the Structural Funds. Theamount spent on renewable energy in the period 1994-1999 is estimated at EUR 300 mln(EUR 50 mln per year). Projects have been supported in Greece, Spain, France, Ireland, Italy,Portugal, Austria and the United Kingdom, featuring notably wind, solar and biomass (EC,1999c).
The share of renewables in the 5th RTD programme’s budget was estimated at EUR 391.9mln (cf. Table 2.1.1) or EUR 98 mln per year.
A source of funding dedicated specifically to renewable energy is the Altener programme.The budget for Altener II (1998-2002) is EUR 77 mln or EUR 15 mln per year.
Under the Phare programme, support for renewables related projects amounted to a total ofEUR 14.3 mln (EUR 1.8 mln per year) over the period 1990-1997 (calculated after ERM,1999).
Electricity
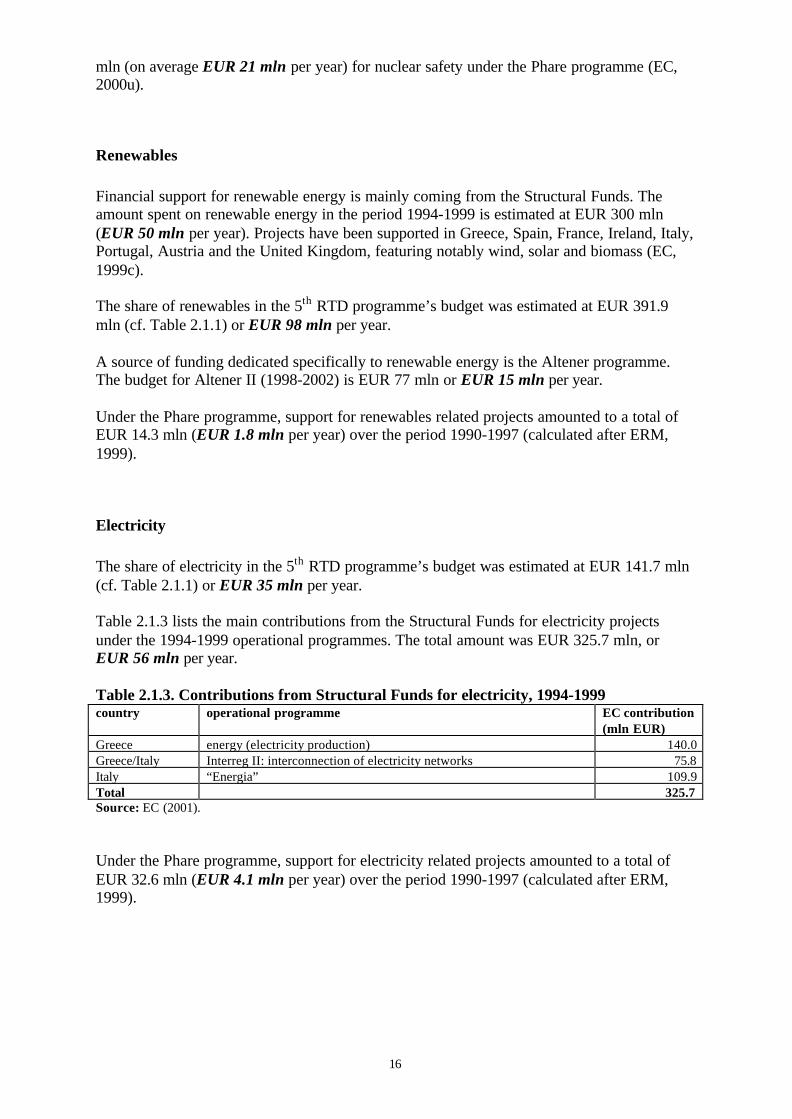
The share of electricity in the 5th RTD programme’s budget was estimated at EUR 141.7 mln(cf. Table 2.1.1) or EUR 35 mln per year.
Table 2.1.3 lists the main contributions from the Structural Funds for electricity projectsunder the 1994-1999 operational programmes. The total amount was EUR 325.7 mln, orEUR 56 mln per year.
Table 2.1.3. Contributions from Structural Funds for electricity, 1994-1999country operational programme EC contribution
(mln EUR)Greece energy (electricity production) 140.0Greece/Italy Interreg II: interconnection of electricity networks 75.8Italy “Energia” 109.9Total 325.7Source: EC (2001).
Under the Phare programme, support for electricity related projects amounted to a total ofEUR 32.6 mln (EUR 4.1 mln per year) over the period 1990-1997 (calculated after ERM,1999).

17
Table 2.1.4. European Union: Summary TableFinal energy consumption (1998): 945.5 MtoeGross electricity generation (1998): 2,490 TWh
coal oil & gas nuclear renewables electricityshare in gross electricity generation (1998) 27% 23% 34% 15%quantifiable subsidies (mln EUR per year) 35 240 350 165 95quantifiable subsidies, incl. attributedelectricity subsidies (mln EUR per year) 60 260 380 180Source: Energy statistics: Eurostat (2000a); other figures: this section.

18
2.2 AUSTRIA
Solid fuels
The importance of coal in Austria’s energy market has greatly diminished over the past twodecades. Out of about 20 coal mines operating in the 1960s, only one still operates. Thegovernment’s financial support to the coal industry in 1996 was estimated to have beenaround ATS 75 million (EUR 5.5 mln). This support was mainly used for social programmesin connection with mine closures (which is not an energy subsidy in terms of this report), andfor exploration (IEA, 1998b).
Coal and coal products are not subject to the energy tax. If coal were taxed at the same rateper GJ as natural gas (ATS 0.6 per m3 or ATS 1.8 per GJ), the 66.6 PJ final use of coal andcoal products in 1998 (Statistik Österreich, 2000) would have been subject to a total taxamount of ATS 119.9 mln or EUR 8.7 mln.
In the years 1995-1998, the Austrian government spent less than EUR 1 mln per year on coalrelated R&D (IEA, 1999f).
Oil and gas
Natural gas and electricity are subject to an energy tax of ATS 0.60 per m3 and ATS 0.2 perkWh, respectively. Until June 2000, the rate for electricity was ATS 0.1 per kWh. For energyintensive enterprises there is a ceiling on the total tax burden of the energy tax. Total final gasconsumption amounted to 161.7 PJ or 4.49 bln m3 in 1998 and total final electricityconsumption to 179.8 PJ or 49.9 TWh (Statistik Österreich, 2000). If all final consumptionwere taxed, the revenues would have been ATS 2.7 billion and ATS 5.0 billion, respectively,or ATS 7.7 billion in sum. Total revenues from the energy tax were ATS 5.5 billion in 1997(EC, 2000b). Assuming (somewhat arbitrarily) an equal distribution of this implicit subsidybetween gas and electricity, both received ATS 1.1 billion or EUR 80 mln.
In 1998, the Austrian government spent less than EUR 1 mln per year on oil and gas relatedR&D (IEA, 1999f).
Land-locked Austria is not a member of an International Oil Pollution Compensation Fund.
Nuclear energy
Austria has no nuclear power plants.
In 1995-1998, the Austrian government spent on average EUR 2.0 mln per year on nuclearrelated R&D (IEA, 1999f). This budget was mainly for nuclear fusion.
19
Renewables
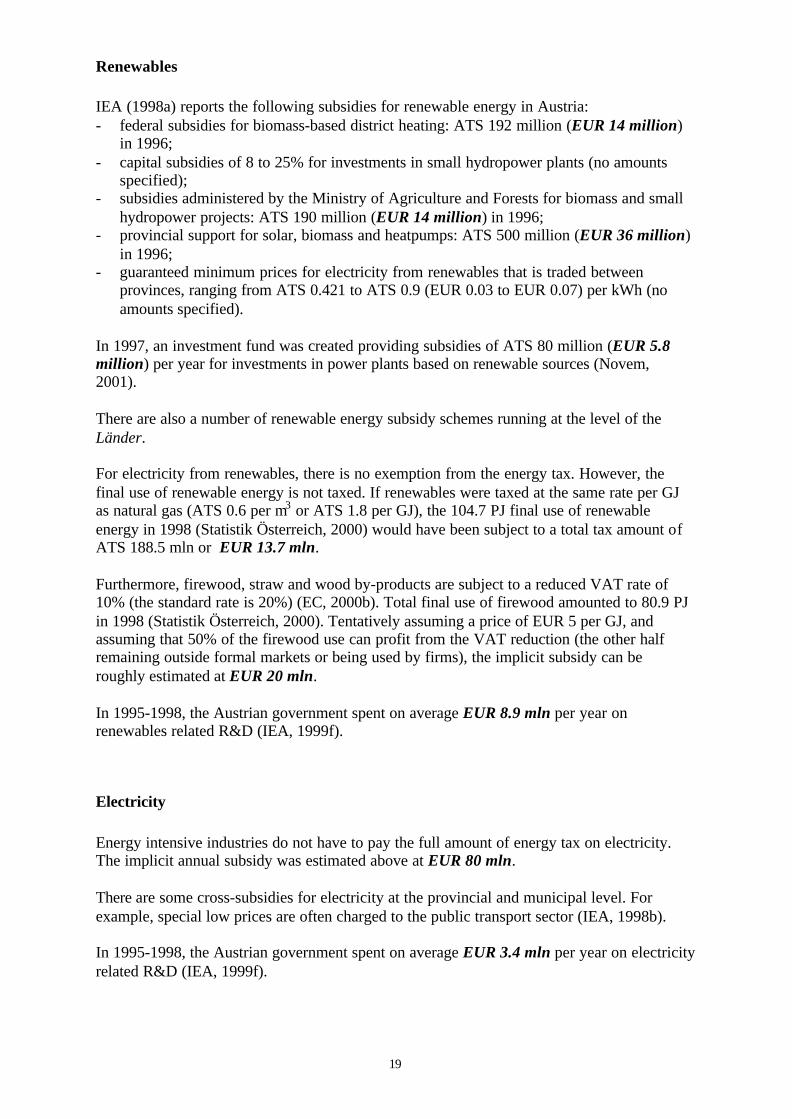
IEA (1998a) reports the following subsidies for renewable energy in Austria:- federal subsidies for biomass-based district heating: ATS 192 million (EUR 14 million)
in 1996;- capital subsidies of 8 to 25% for investments in small hydropower plants (no amounts
specified);- subsidies administered by the Ministry of Agriculture and Forests for biomass and small
hydropower projects: ATS 190 million (EUR 14 million) in 1996;- provincial support for solar, biomass and heatpumps: ATS 500 million (EUR 36 million)
in 1996;- guaranteed minimum prices for electricity from renewables that is traded between
provinces, ranging from ATS 0.421 to ATS 0.9 (EUR 0.03 to EUR 0.07) per kWh (noamounts specified).
In 1997, an investment fund was created providing subsidies of ATS 80 million (EUR 5.8million) per year for investments in power plants based on renewable sources (Novem,2001).
There are also a number of renewable energy subsidy schemes running at the level of theLänder.
For electricity from renewables, there is no exemption from the energy tax. However, thefinal use of renewable energy is not taxed. If renewables were taxed at the same rate per GJas natural gas (ATS 0.6 per m3 or ATS 1.8 per GJ), the 104.7 PJ final use of renewableenergy in 1998 (Statistik Österreich, 2000) would have been subject to a total tax amount ofATS 188.5 mln or EUR 13.7 mln.
Furthermore, firewood, straw and wood by-products are subject to a reduced VAT rate of10% (the standard rate is 20%) (EC, 2000b). Total final use of firewood amounted to 80.9 PJin 1998 (Statistik Österreich, 2000). Tentatively assuming a price of EUR 5 per GJ, andassuming that 50% of the firewood use can profit from the VAT reduction (the other halfremaining outside formal markets or being used by firms), the implicit subsidy can beroughly estimated at EUR 20 mln.
In 1995-1998, the Austrian government spent on average EUR 8.9 mln per year onrenewables related R&D (IEA, 1999f).
Electricity
Energy intensive industries do not have to pay the full amount of energy tax on electricity.The implicit annual subsidy was estimated above at EUR 80 mln.
There are some cross-subsidies for electricity at the provincial and municipal level. Forexample, special low prices are often charged to the public transport sector (IEA, 1998b).
In 1995-1998, the Austrian government spent on average EUR 3.4 mln per year on electricityrelated R&D (IEA, 1999f).

20
Table 2.2.1. Austria: Summary TableFinal energy consumption (1998): 22.8 MtoeGross electricity generation (1998): 57.5 TWh
coal oil & gas nuclear renewables electricityshare in gross electricity generation (1998) 7% 22% 0% 70%quantifiable subsidies (mln EUR per year) 10 80 2 > 100 > 80quantifiable subsidies, incl. attributedelectricity subsidies (mln EUR per year) > 15 > 95 2 > 150Source: Energy statistics: Eurostat (2000a); other figures: this section.
21
2.3 BELGIUM
Solid fuels
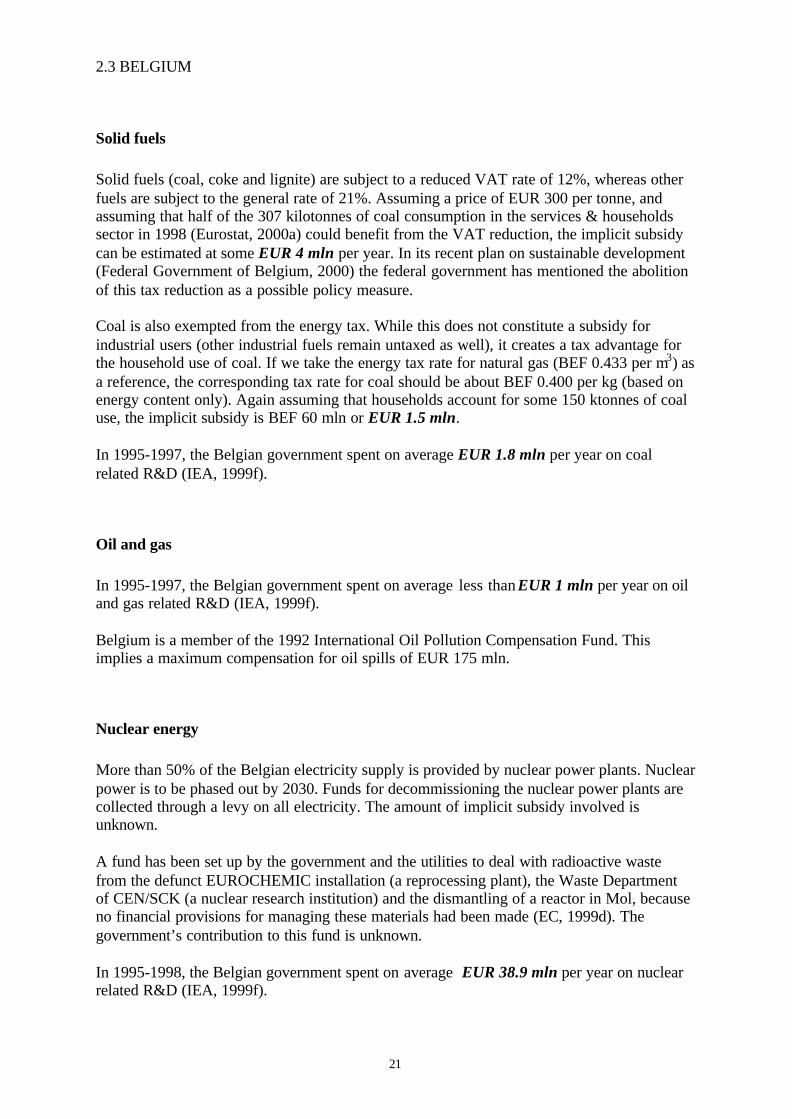
Solid fuels (coal, coke and lignite) are subject to a reduced VAT rate of 12%, whereas otherfuels are subject to the general rate of 21%. Assuming a price of EUR 300 per tonne, andassuming that half of the 307 kilotonnes of coal consumption in the services & householdssector in 1998 (Eurostat, 2000a) could benefit from the VAT reduction, the implicit subsidycan be estimated at some EUR 4 mln per year. In its recent plan on sustainable development(Federal Government of Belgium, 2000) the federal government has mentioned the abolitionof this tax reduction as a possible policy measure.
Coal is also exempted from the energy tax. While this does not constitute a subsidy forindustrial users (other industrial fuels remain untaxed as well), it creates a tax advantage forthe household use of coal. If we take the energy tax rate for natural gas (BEF 0.433 per m3) asa reference, the corresponding tax rate for coal should be about BEF 0.400 per kg (based onenergy content only). Again assuming that households account for some 150 ktonnes of coaluse, the implicit subsidy is BEF 60 mln or EUR 1.5 mln.
In 1995-1997, the Belgian government spent on average EUR 1.8 mln per year on coalrelated R&D (IEA, 1999f).
Oil and gas
In 1995-1997, the Belgian government spent on average less than EUR 1 mln per year on oiland gas related R&D (IEA, 1999f).
Belgium is a member of the 1992 International Oil Pollution Compensation Fund. Thisimplies a maximum compensation for oil spills of EUR 175 mln.
Nuclear energy
More than 50% of the Belgian electricity supply is provided by nuclear power plants. Nuclearpower is to be phased out by 2030. Funds for decommissioning the nuclear power plants arecollected through a levy on all electricity. The amount of implicit subsidy involved isunknown.
A fund has been set up by the government and the utilities to deal with radioactive wastefrom the defunct EUROCHEMIC installation (a reprocessing plant), the Waste Departmentof CEN/SCK (a nuclear research institution) and the dismantling of a reactor in Mol, becauseno financial provisions for managing these materials had been made (EC, 1999d). Thegovernment’s contribution to this fund is unknown.
In 1995-1998, the Belgian government spent on average EUR 38.9 mln per year on nuclearrelated R&D (IEA, 1999f).

22
Renewables
Since 1995, electricity generated from renewables is supported with a subsidy of BEF 1(EUR 0.025) per kWh. The measure was estimated to cost BEF 30 million (EUR 0.7 million)per year (IEA, 1998a). In July 1998 the amount of support was increased to BEF 2 (EUR0.05) per kWh for hydro and wind power installations with a maximum capacity of 10 MW(Federaal Planbureau, 1999). Therefore, the order of magnitude of the subsidy is now likelyto be some EUR 1 mln.
In all three administrative regions (Flanders, Wallonia and Brussels Capital) investments inrenewable energy are eligible to a subsidy of 15%. In the case of photovoltaic energy inFlanders there is an investment subsidy of 50%. Furthermore, 14% of investments inrenewable energy can be deducted from company profits (IEA, 1998a). Subsidies forrenewable energy are also available in the Walloon region, but information on budgets isgenerally lacking (Novem, 2001).
In 1995-1997, the Belgian government spent on average EUR 3.5 mln per year onrenewables related R&D (IEA, 1999f).
Electricity
Over the past decade, the ‘social electricity tariff’, intended to protect low-incomehouseholds, has involved an average amount of cross-subsidy of BEF 500 mln or EUR 12mln per year (IEA, 1997b). As this is a transfer between electricity users and does notdiscriminate between fuels, it is excluded from our quantification.
In 1995-1997, the Belgian government spent on average EUR 4.2 mln per year on electricityrelated R&D (IEA, 1999f).
Table 2.3.1. Belgium: Summary TableFinal energy consumption (1998): 37.4 MtoeGross electricity generation (1998): 83.2 TWh
coal oil & gas nuclear renewables electricityshare in gross electricity generation (1998) 17% 24% 55% 2%quantifiable subsidies (mln EUR per year) 7 < 1 > 40 5 4quantifiable subsidies, incl. attributedelectricity subsidies (mln EUR per year) 8 1 > 40 5Source: Energy statistics: Eurostat (2000a); other figures: this section.
23
2.4 DENMARK
Solid fuels
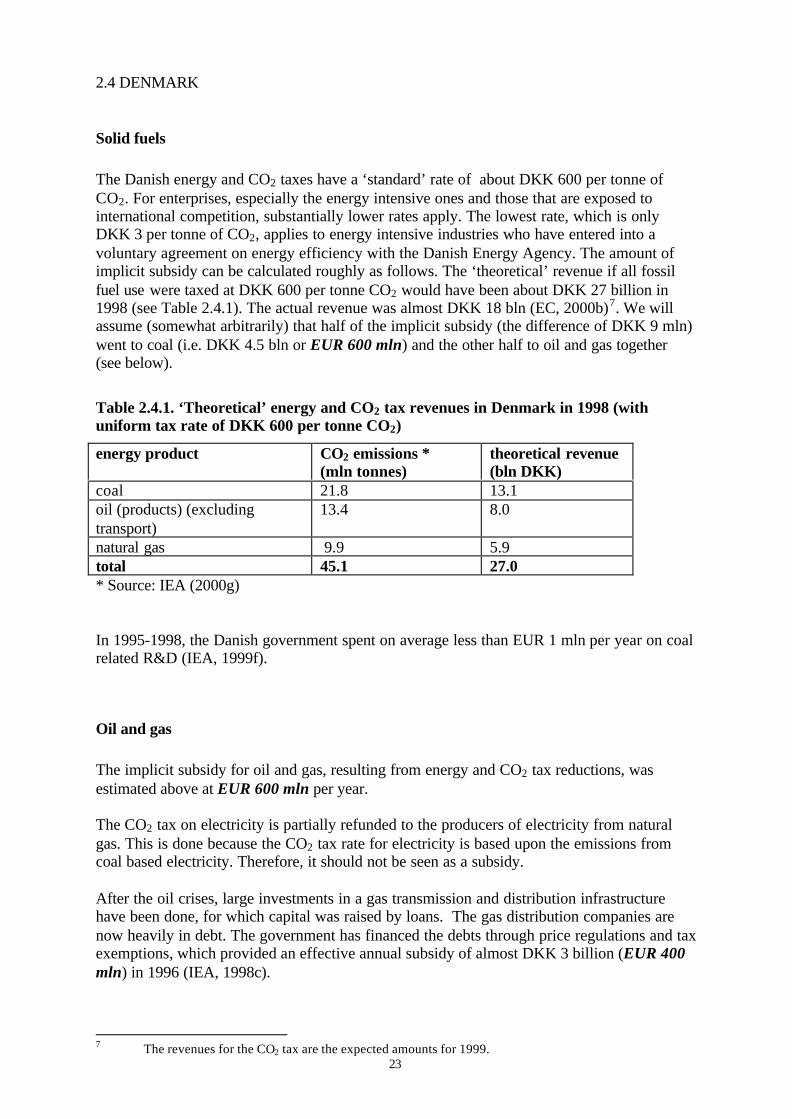
The Danish energy and CO2 taxes have a ‘standard’ rate of about DKK 600 per tonne ofCO2. For enterprises, especially the energy intensive ones and those that are exposed tointernational competition, substantially lower rates apply. The lowest rate, which is onlyDKK 3 per tonne of CO2, applies to energy intensive industries who have entered into avoluntary agreement on energy efficiency with the Danish Energy Agency. The amount ofimplicit subsidy can be calculated roughly as follows. The ‘theoretical’ revenue if all fossilfuel use were taxed at DKK 600 per tonne CO2 would have been about DKK 27 billion in1998 (see Table 2.4.1). The actual revenue was almost DKK 18 bln (EC, 2000b)7. We willassume (somewhat arbitrarily) that half of the implicit subsidy (the difference of DKK 9 mln)went to coal (i.e. DKK 4.5 bln or EUR 600 mln) and the other half to oil and gas together(see below).
Table 2.4.1. ‘Theoretical’ energy and CO2 tax revenues in Denmark in 1998 (withuniform tax rate of DKK 600 per tonne CO2)
energy product CO2 emissions *(mln tonnes)
theoretical revenue(bln DKK)
coal 21.8 13.1oil (products) (excludingtransport)
13.4 8.0
natural gas 9.9 5.9total 45.1 27.0* Source: IEA (2000g)
In 1995-1998, the Danish government spent on average less than EUR 1 mln per year on coalrelated R&D (IEA, 1999f).
Oil and gas
The implicit subsidy for oil and gas, resulting from energy and CO2 tax reductions, wasestimated above at EUR 600 mln per year.
The CO2 tax on electricity is partially refunded to the producers of electricity from naturalgas. This is done because the CO2 tax rate for electricity is based upon the emissions fromcoal based electricity. Therefore, it should not be seen as a subsidy.
After the oil crises, large investments in a gas transmission and distribution infrastructurehave been done, for which capital was raised by loans. The gas distribution companies arenow heavily in debt. The government has financed the debts through price regulations and taxexemptions, which provided an effective annual subsidy of almost DKK 3 billion (EUR 400mln) in 1996 (IEA, 1998c).
7 The revenues for the CO2 tax are the expected amounts for 1999.
24
Royalty payments on oil and gas production have been abolished in the most recent licensingrounds (IEA, 1998c).
In 1995-1998, the Danish government spent on average EUR 2.8 mln per year on oil and gasrelated R&D (IEA, 1999f).
Denmark is a member of the 1992 International Oil Pollution Compensation Fund. Thisimplies a maximum compensation for oil spills of EUR 175 mln.
Nuclear energy
Denmark has no nuclear power plants.
In 1995-1998, the Danish government spent on average EUR 1.7 mln per year on nuclearrelated R&D (IEA, 1999f).
Renewables
Electricity from renewables is exempted from the energy and CO2 taxes on electricity. In thecase of the CO2 tax this exemption is achieved by granting a refund of DKK 0.1 per kWh tothe producers of electricity from renewables. This is equal to the CO2 tax rate for electricity,which is based upon coal based electricity. Therefore, it should not be seen as a subsidy. Theexemption from the energy tax, however, can be seen as a subsidy. The amount involved canbe estimated as follows. In 1998, the total revenues of the energy tax on electricity amountedto DKK 7.0 billion (EC, 2000b). Final consumption of electricity was 32.0 TWh (Eurostat,2000a), implying an effective tax rate of DKK 0.22 per kWh. Given a gross electricityproduction from renewables of 4.3 TWh (Eurostat, 2000a), the total amount of subsidyinvolved can be estimated at DKK 937 mln or EUR 126 mln.
By 2002, the direct financial support of electricity from renewables will be replaced by asystem of ‘green certificates’. This system has recently been approved by the EuropeanCommission.
In the period 1995-1999 the Danish Energy Agency paid an amount of DKK 329.7 mln (onaverage EUR 8.9 mln per year) in subsidies for investments in renewable energy installations(Energistyrelsen, 2000b).
A subsidy scheme for investments in solar cells was started in 1998. An amount of DKK 1billion was reserved for a period of five years (EUR 27 mln per year) (ENDS, 1998a).
Shareholders in private wind turbine cooperatives can opt for a model of income taxation inwhich the first DKK 3000 (EUR 400) of income from the sale of wind power is tax free(Energistyrelsen, 1999). As the extent to which this scheme is used is unknown, the amountof subsidy involved cannot be calculated.
In 1995-1998, the Danish government spent on average EUR 17.2 mln per year onrenewables related R&D (IEA, 1999f).

25
Electricity
In 1995-1998, the Danish government spent on average EUR 4 mln per year on renewablesrelated R&D (IEA, 1999f).
Table 2.4.2. Denmark: Summary TableFinal energy consumption (1998): 15.1 MtoeGross electricity generation (1998): 41.1 TWh
coal oil & gas nuclear renewables electricityshare in gross electricity generation (1998) 58% 32% 0% 10%quantifiable subsidies (mln EUR per year) 600 1,000 2 > 180 4quantifiable subsidies, incl. attributedelectricity subsidies (mln EUR per year) 600 1,000 2 > 180Source: Energy statistics: Eurostat (2000a); other figures: this section.
26
2.5 FINLAND
Solid fuels
Since 1996, investment aid for electricity and heat generation from peat has ceased, but it stillexists for cogeneration and district heating plants using mixtures of peat and wood as a fuel(IEA, 1999b) (see below under renewables). Furthermore, small scale peat power is includedin the refund scheme for the tax on electricity (see below under renewables). The implicitsubsidies cannot be calculated due to lack of data.
In 1995-1997, the Finnish government spent on average EUR 3.6 mln per year on coalrelated R&D (IEA, 1999f).
Oil and gas
In the past, the use of natural gas has been stimulated by subsidies and a reduced VAT rate.Following Finland’s accession to the EU, these arrangements have been terminated.Presently, natural gas benefits from a reduced CO2 tax rate: FIM 51 instead of FIM 102 pertonne of CO2. This tax reduction is not relevant for gas used for electricity generation,because since 1997 fuel inputs for electricity are exempt from the CO2 tax (instead, theelectricity itself is taxed). Gas use for other purposes than electricity production in Finlandamounted to 1.2 Mtoe in 1997 (calculated after EC, 1999a), or 900 mln m3. Given anemission of 1.96 kg CO2 per m3, the total CO2 emissions from this gas use are some 1.76 mlntonnes, which means that the tax reduction implies a subsidy of FIM 90 mln (EUR 15 mln)per year for natural gas.
In 1995-1997, the Finnish government spent on average less than EUR 1 mln per year on oiland gas related R&D (IEA, 1999f).
Finland is a member of the 1992 International Oil Pollution Compensation Fund. This impliesa maximum compensation for oil spills of EUR 175 mln.
Nuclear energy
Radioactive waste producers have full responsibility for managing their radioactive waste andfor covering all related expenses. In order to cover expected expenses for radioactive wastemanagement and decommissioning of the nuclear plants, the operators of the plants payannual fees to a government-controlled fund, which are tax-exempted (EC, 1999d).
In 1995-1997, the Finnish government spent on average EUR 8.4 mln per year on nuclearrelated R&D (IEA, 1999f).
27
Renewables
Since 1997, when the Finnish CO2 tax was transformed into a general tax on electricity, a taxrefund equal to the electricity tax is available for electricity from renewables (IEA, 1998a).The revenues from the electricity tax were estimated at FIM 2 billion in 1999 (EC, 2000b).As renewables account for about 30% of Finnish electricity production, the subsidy impliedcan be estimated at FIM 857 million or EUR 144 million per year.
Investment subsidies for new and renewable energy technologies are available to a maximumof 30% of the investment cost. In 1998, the amount of available subsidies was FIM 130million (EUR 22 million) (IEA, 1999b). It should be noted that these subsidies are partlyaccruing to non-renewable energy (e.g. subsidies to combined heat and power / districtheating plants using a mixture of wood and peat as a fuel).
Subsidies are also granted for the management of young forests and the harvesting of woodfor energy. These subsidies amount to between FIM 12 and 15 per MWh (IEA, 1999b).Given a biomass input for power generation of 1.32 Mtoe (15.35 TWh) in 1997 (EC, 1999a),and assuming that all of this biomass input benefited from the support scheme, the totalamount of subsidy can be estimated at FIM 184 mln (EUR 31 mln) per year.
In 1995-1998, the Finnish government spent on average EUR 4.5 mln per year on renewablesrelated R&D (IEA, 1999f).
Electricity
The tax on electricity is levied at a reduced rate for industry and greenhouse horticulture:FIM 0.025 instead of FIM 0.041 per kWh. Industrial electricity use amounted to 39.6 TWh in1997 (calculated after EC, 1999a), so the tax reduction implies a subsidy of FIM 633 mln(EUR 106 mln) to industry. The subsidy to greenhouse horticulture cannot be calculated dueto lack of data.
In 1995-1997, the Finnish government spent on average EUR 15.7 mln per year on electricityrelated R&D (IEA, 1999f).
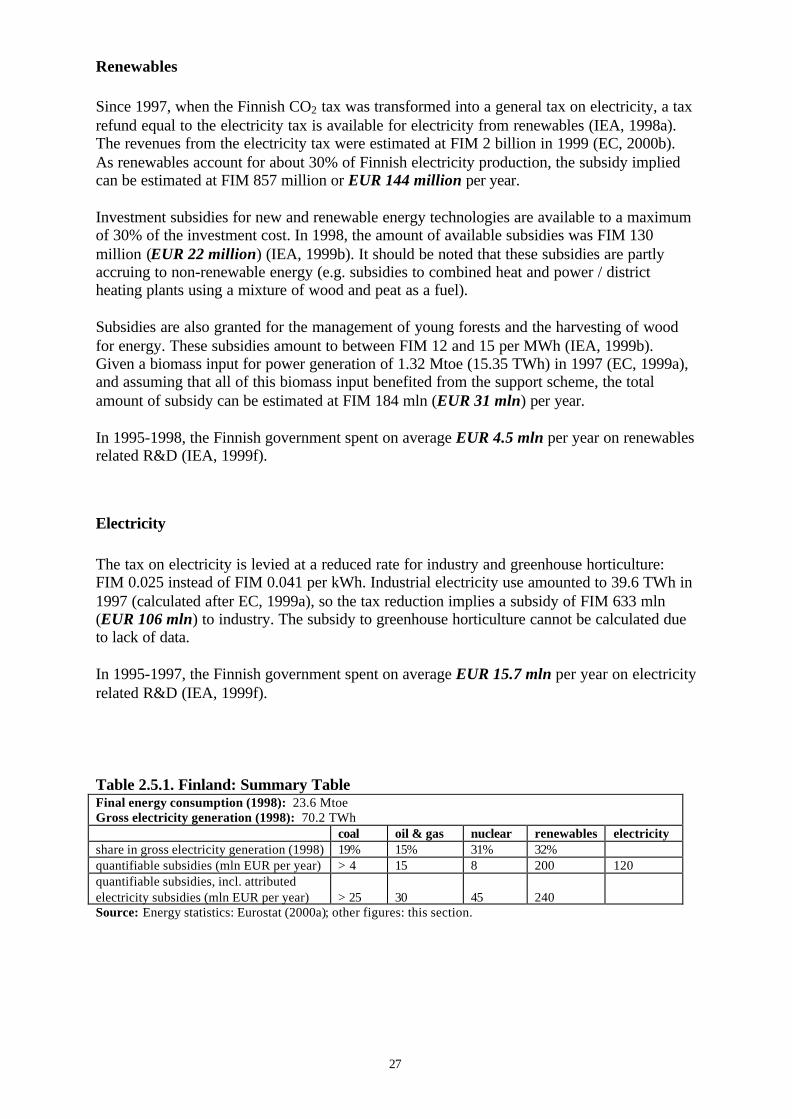
Table 2.5.1. Finland: Summary TableFinal energy consumption (1998): 23.6 MtoeGross electricity generation (1998): 70.2 TWh
coal oil & gas nuclear renewables electricityshare in gross electricity generation (1998) 19% 15% 31% 32%quantifiable subsidies (mln EUR per year) > 4 15 8 200 120quantifiable subsidies, incl. attributedelectricity subsidies (mln EUR per year) > 25 30 45 240Source: Energy statistics: Eurostat (2000a); other figures: this section.

28
2.6 FRANCE
Solid fuels
According to the European Commission (2000a), state aid to coal mining in France amountedto an average EUR 72 million per year in the period 1995-1996. IEA (2000d) estimated thePSE (Producer Subsidy Equivalent) at FRF 2,578 mln or EUR 393 million in 1998. Thisamount includes aid to current production only. Total subsidies for the French coal miningindustry (including social programmes related to mine closure) are much higher: Bonduelle etal. (1998) mention an annual amount of FRF 4.5 billion (EUR 686 million) and according toIEA (2000d) the total support (PSE + assistance not benefiting current production) amountedto FRF 6.6 billion (EUR 1 billion) in 1998.
Indirect types of support to coal include (Bonduelle et al., 1998):- compulsory purchases of coal-generated electricity (implicit subsidy estimated at FRF
600 mln or EUR 91 mln per year);- the rehabilitation of old mine areas;- uninternalised external costs (uncompensated environmental damage) from coal-fired
power plants.
In 1995-1998, the French government spent on average EUR 5.4 mln per year on coal relatedR&D (IEA, 1999f).
The use of coal is not taxed in France (apart from VAT). However, as there is not (yet) ageneral energy tax scheme, this cannot be regarded as a subsidy.
Indigenous coal production in France is to be progressively reduced and will ceasecompletely by 2005 (IEA, 2000d).
Oil and gas
The Institut Français du Pétrole (IFP) receives a certain percentage of the revenues of the taxon oil products and invests it in R&D. In 1996, the R&D funds financed in this wayamounted to FRF 871 mln for oil and FRF 235 mln for gas (Bonduelle et al., 1998); togetherFRF 1,106 mln (EUR 169 mln). As this is financed solely by a tax on oil products, it is not tobe considered a subsidy. The oil support fund FSH receives an annual budget in the order ofFRF 240 mln (EUR 37 mln) per year from the government (IEA, 2000d). The R&D budget ofGaz de France (GDF) amounted to FRF 634 mln (EUR 97 mln) in 1999 (IEA, 2000d). As inthe case of EDF (see below), this should not be regarded as a subsidy. According to IEA(1999f), the average government budget for oil and gas related R&D amounted to EUR 32.5mln per year on average in the period 1995-1998.
In response to protests against high prices of oil products, the French government decided inSeptember 2000 to reduce diesel excise tax rates in case of sharp price increases of crude oil.While this measure is not a subsidy, it has the effect of stabilising the price of diesel, thusmaking its use more attractive. Taxes on diesel have been traditionally low in France,compared to taxes on other motor fuels.
29
France has informed the European Commission that it intends to apply a reduced dieselexcise tax rate for short distance public passenger transport, starting in 2001.
Since the early 1990s, the government has maintained a support policy for small retailers ofautomotive fuels. The aim of this policy is to maintain petrol supply in remote areas. Thepolicy is financed by a tax that yielded a total revenue of FRF 53 mln in 1997. The tax wasraised in December 1999 to yield a total revenue of FRF 73 mln. The government intends tomaintain this higher level of support in 2001 (IEA, 2000d). As the tax is (presumably) leviedon oil products, the support can be considered to be a cross-subsidy.
Indirect subsidies to the oil industry include (Bonduelle et al., 1998):- uninternalised external costs of the use of oil products, in particular by motor vehicles;- military expenditures to protect the interests in oil producing areas, such as the Persian
Gulf.
France is a member of the 1992 International Oil Pollution Compensation Fund. This impliesa maximum compensation for oil spills of EUR 175 mln. The ‘Erika’ oil spill (December1999) has caused considerable damage on the French coast. Although Fina Elf, which hadhired the Erika, promised to pay at least USD 85 million compensation, it is likely that asubstantial amount of implicit subsidy by way of uncompensated damage will be involved.By December 2000, some 2,950 claims had been received by the 1992 IOPC Fund for clean-up operations, property damage and loss of earnings in the fishery and tourism sectors. Some1,770 claims had been assessed. Of these, 1,460 claims totalling FRF 113 million had beenapproved for FRF 84 million. Payments had been made totalling FRF 42 million, i.e. 50% ofthe amounts approved (IOPC Funds, 2001).
Nuclear energy
The main part of public spending on nuclear R&D in France takes place through theCommissariat à l’énergie atomique (CEA). Nuclear R&D expenses by CEA amounted toFRF 4,638 mln in 1996. Another large publicly financed nuclear research institute is thedepartment IN2P3 of the Centre national de recherche scientifique (CNRS), whose nuclearbudget amounted to FRF 1,234 mln in 1995 (Bonduelle et al., 1998). In our view, the R&Dbudget of electricity company EDF (FRF 594 mln in 1995, according to Bonduelle et al.,1998; FRF 3.1 billion in 1999, according to IEA, 2000d) should not be considered as asubsidy, but as ‘normal’ R&D expenses of an enterprise (although it is state-owned). Thesame is true for the FRF 1,251 mln spent on nuclear R&D by Cogéma (IEA, 2000d). Thetotal annual amount of nuclear R&D subsidy could thus be estimated at about FRF 7 bln orslightly above EUR 1 bln. According to IEA (1999f), the average annual government budgetfor nuclear R&D in the period 1995-1998 was EUR 515.8 mln, which can be used as aconservative estimate.
The annual budget of the Direction de la Sûreté des Installations Nucléaires (DSIN), which ischarged with safeguarding the security of nuclear installations, can be regarded as a subsidyto nuclear energy. This budget amounts to FRF 650 mln (EUR 99 mln) (Bonduelle et al.,1998). Government proposals seeking greater independence for the safety authorities haverecently been rejected by the National Assembly (IEA, 2000d).
According to EDF, the owner of all nuclear power plants in France, the cost ofdecommissioning the existing plants will amount to FRF 102 billion. This amount is basedupon an average decommissioning cost that is fixed by the Ministry of Industry, amounting toFRF 1,698 per kW installed by the end of 1998. The cumulated provisions amounted to FRF

30
44.5 billion in 1998. Given an average age of 13 years and a lifetime of 30 years, EDFconcludes that these provisions are sufficient to cover all decommissioning costs (EDF,1999). However, doubts have been expressed whether the budget for decommissioning (15%of the investment costs) will be sufficient (Bonduelle et al., 1998). Moreover, if the economiclife of the reactors is reduced (e.g. due to increasing maintenance costs) the necessaryprovisions for decommissioning will not be realised.
Other forms of indirect support to the nuclear industry include (Bonduelle et al., 1998):- nuclear overcapacity, leading to exports of electricity at prices below the level of full cost
coverage;- investments in new nuclear plants at times of overcapacity, the main purpose of the
investment being support to nuclear plant builder Framatome;- the mandatory reprocessing of spent nuclear fuel (intended to support reprocessing firm
Cogema);- limited liability for damage due to a nuclear accident (to FRF 600 mln or EUR 91 mln);- impacts of the nuclear cycle on health (estimated using the ‘ExternE’ methodology at
FRF 120 mln to 5940 mln, or EUR 18 mln to 905 mln per year).
Renewables
In 1996, the government initiated ‘EOLE’, a plan to promote grid-connected wind electricity.It is run in a similar fashion to the UK's NFFO, whereby the government (in co-operationwith EDF and ADEME) launches a competitive bid process for a certain amount of capacity.Successful bids are chosen on cost grounds: the average in 1997 was FRF 0.337 per kWh.EOLE aims to drive costs down to (a competitive) FRF 0.25 per kWh by 2005. A market forpower from the successful bids is guaranteed, and will be bought for the rate determined atthe time of bidding for 15 years (IEA, 1998a). So far, the amount of capacity that wasaccepted following the bidding rounds has exceeded expectations: a total of 124 MW wasaccepted (IEA, 2000d). Assuming a load factor of 0.2, the energy generated by the 124 MWwind turbine capacity could be 217 GWh per year. With a premium of FRF 0.087 per kWh,the implied subsidy amounts to FRF 18.9 mln or EUR 2.9 mln per year.
In 1998, a biogas programme was started, designed to equip waste dumps with combustionfacilities for the use of methane from waste fermentation. Like the ‘EOLE’ programme, it isbased on calls for tender. The first tendering round for 10 MW of electricity generatingcapacity was successfully concluded in May 1999 (IEA, 2000d). Given this relatively smallcapacity, the amount of subsidy involved probably does not (yet) exceed EUR 1 mln.
The ‘HELIOS 2006’ programme, established in May 1999 and carried out by ADEME,provides investment subsidies for households equipping themselves with solar water heaters(IEA, 2000d). Total funding is FRF 30 mln or (assuming the programme’s duration is 7years) less than EUR 1 mln per year.
Promotion of wood energy for heating is being strengthened via a ‘Wood Energy Plan’. Thetotal budget for the plan, which ran between 1995 and 1998, was FRF 215 mln, of which FRF74.5 mln came from the national government, and the remainder from regional, local or EUfunds (IEA, 1998a). On 1 January 1999, FRF 120 mln of subsidies had been spent (of whichFRF 47 mln were from ADEME). This programme was extended to comprise the ‘WoodWastes Plan’, announced in February 1998. Under this plan, viability studies relating to theuse of wood wastes as well as investment costs of installations using wood wastes aresubsidised. At present, ADEME spends FRF 65 mln (EUR 10 mln) per annum on theseprogrammes (IEA, 2000d).
31
Firewood is subject to a reduced VAT rate of 5.5%, whereas other energy products arecharged with 19.6% VAT (EC, 2000c). The use of wood for heating houses in France wasestimated at 7.1 Mtoe in 1996 (IEA, 1998a). It is not known to what extent this wood waspurchased in transactions involving VAT (a significant part of the firewood used in Franceremains outside formal markets). Tentatively, one could assume that 50% of the firewoodwas formally traded, at an average price of FRF 500 per toe (including 5.5% VAT), implyinga subsidy of FRF 237 mln or EUR 36 mln per year.
The Amortisation of Electrification Costs Fund (FACE) includes a source of finance forinvestments in renewables and demand-side management in rural areas. The annual budgetfor this part of FACE is FRF 100 mln (EUR 15 mln). The majority of funds are spent onphotovoltaic systems in rural areas, and aim to reduce either grid extensions or gridstrengthening, via reducing peak demand or increasing stand-alone generation capacity (IEA,1998a).
EDF is obliged to purchase renewables-based electricity from independent power producerson the basis of ‘avoided cost’. In March 2001, the European Court of Justice has ruled thatthis type of support does not constitute state aid under the EU Treaty (ENDS, 2001).
Biofuels benefit from excise tax exemption of up to FRF 2.3 per litre for RME and FRF 3.29per litre for ethanol (FRF 1.46 for ethanol-derived ETBE). The Government estimates thatthis subsidy will cost FRF 1.5 billion (EUR 230 mln) per year in lost tax receipts. Thisprogramme is followed for agricultural reasons, as it is not cost-effective in terms of CO2reduction alone (IEA, 1998a). In a recent judgement (case T-184/97), the European Court ofJustice ruled that the French tax exemptions for biofuels are incompatible with EC legislationon mineral oil excise taxation (ECJ, 2000).
Tax credits are available for investments in renewable energy technologies in overseasdepartments for small hydro, wind, biomass photovoltaic and solar thermal power schemes,whereby renewable energy investments by a company can be deducted against taxable profits(IEA, 1998a). Bonduelle et al. (1998) mention a general tax deduction for investments inrenewable energy equipment amounting to 25% of the total investment. The amount ofsubsidy (tax foregone) is unknown.
According to IEA (1998a), national government expenditure on renewables R&D accountedfor 1% of total energy R&D budget in 1996 (EUR 5.8 mln). This was the lowest reportedproportion of any OECD country's energy R&D budget that is spent on renewable energy.The majority is spent on biomass, photovoltaics and geothermal. On average, the governmentbudget for renewables related R&D amounted to EUR 4.5 mln per year in the period 1995-1998 (IEA, 1999f). ADEME is the main organisation involved, its R&D budget amounting tosome FRF 20 mln (EUR 3 mln) per year (Bonduelle et al., 1998). In 1999, ADEME’sspending on renewable R&D had increased to FRF 82 mln (EUR 12.5 mln) (IEA, 2000d).
Electricity
Reinforcement and extension of the electricity grid in rural areas is financed withcontributions from the FACE (see above). In recent years, these amounted to FRF 2.2 bln(EUR 335 mln) per year (Bonduelle et al., 1998). As FACE is financed by a levy onelectricity use, its expenses can only be regarded as cross-subsidies.
32
EDF runs a programme ‘Vivrélec’, aiming at promoting the use of electricity for domesticspace heating. It is estimated that in 1997 an amount of FRF 234 to 546 mln (EUR 36 to 83mln) was spent under this programme. However, as this money comes from EDF’s ownfunds, it should not be regarded as a subsidy in our definition.
Similarly, the money transfers resulting from the principle of ‘péréquation tarifaire’ shouldnot be regarded as subsidies. This principle implies that all consumers in France (includingthe overseas territories), regardless where they live, should face the same tariff structure andrates. It is obvious, however, that large amounts of ‘cross subsidy’ are involved. IEA (2000d)estimates that it constitutes a transfer of wealth from metropolitan France to other areas(including the overseas departments) in the order of FRF 2 billion (EUR 300 million) peryear.
Apart from nuclear R&D, no specific government subsidies for electricity related R&D isreported.
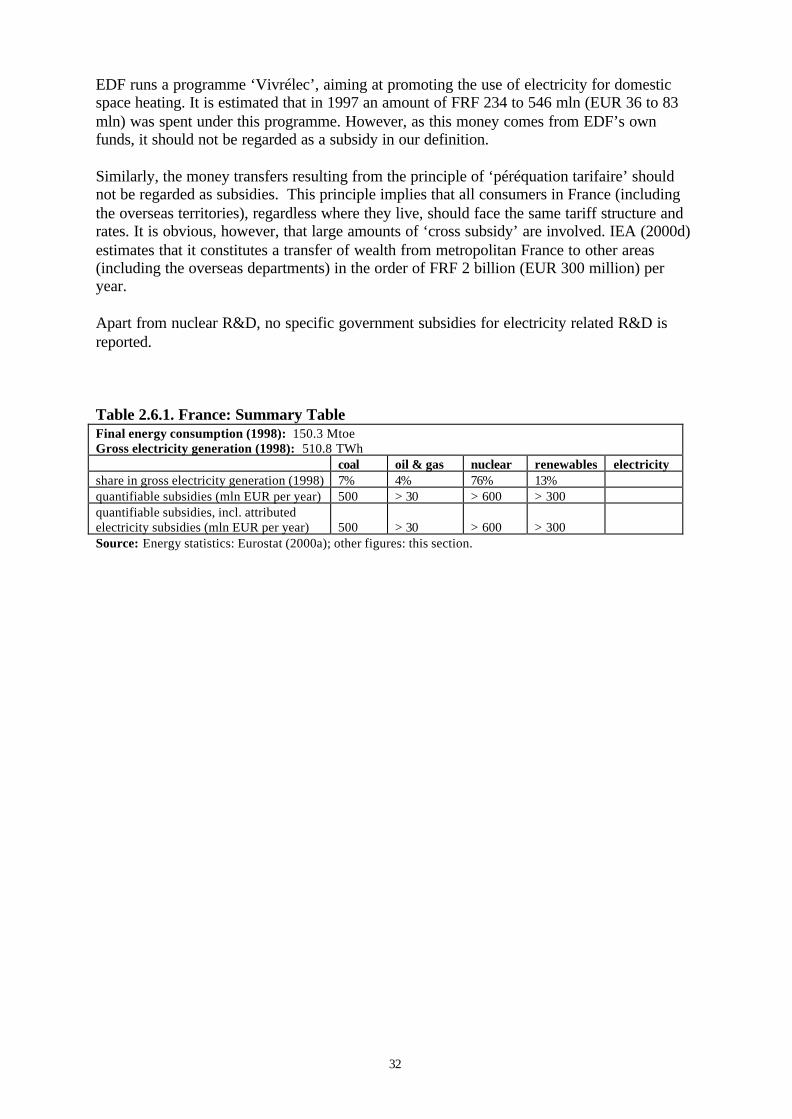
Table 2.6.1. France: Summary TableFinal energy consumption (1998): 150.3 MtoeGross electricity generation (1998): 510.8 TWh
coal oil & gas nuclear renewables electricityshare in gross electricity generation (1998) 7% 4% 76% 13%quantifiable subsidies (mln EUR per year) 500 > 30 > 600 > 300quantifiable subsidies, incl. attributedelectricity subsidies (mln EUR per year) 500 > 30 > 600 > 300Source: Energy statistics: Eurostat (2000a); other figures: this section.

33
2.7 GERMANY
Solid fuels
According to the European Commission (2000a), state aid to coal production in Germanyamounted to an average EUR 4.8 billion per year in the period 1995-1998. This amountincludes aid to current production only. Since 1996, these subsidies are financed directlyfrom the federal budget. Before that time, they were financed by the ‘Kohlepfennig’, asurcharge on the electricity bills. The German Ministry of Finance foresees a decrease ofGerman coal subsidies from DEM 9.25 billion (EUR 4.8 billion) in 1998 to DEM 5.3 billion(EUR 2.7 billion) in 2005 (Bundesfinanzministerium, 2000a).
In the new Bundesländer, subsidies have been provided in the past by some Ländergovernments for lignite fired power plants. Until 2005, access to the grid in this part ofGermany can be denied if it endangers lignite based power generation (IEA, 1998d).
In contrast with other fossil fuels and electricity, coal remains untaxed under the ‘ecologicaltax reform’ which was introduced in 1999. If we take natural gas as a reference, which istaxed (in 2000) at 6.8 DEM per MWh, then, given a coal consumption of 86.7 Mtoe (= 1028TWh) in 1997 (EC, 1999a), tax revenues would have been almost DEM 7 billion (EUR 3.6billion).
In 1995-1998, the German government spent on average EUR 5.1 mln per year on coalrelated R&D (IEA, 1999f). These spendings have been decreasing substantially over the past15 years (in 1987, they amounted to more than EUR 150 mln).
Oil and gas
Gas and oil used in combined heat and power (CHP) installations with an operating time of70% or more, and power plants achieving an electrical efficiency of at least 57.5% areexempted from the mineral oil tax. Furthermore, the increases in the mineral oil tax that areintroduced under the ecological tax reform are reduced by 80 to 100% for industry andagriculture. The loss of tax income for the federal government in the year 2000 was estimatedat DEM 1 billion (EUR 511 million) (Subventionsbericht, 1999).
Individual enterprises can get a tax refund if the additional tax burden brought about by theecological tax reform (i.e. the introduction of the electricity tax and the increase in the taxrates for oil products and gas) exceeds the reduction in social security and pensioncontributions (which was included in the tax reform as a compensatory measure) by a factorof 1.2 or more. The amount of implicit subsidy involved is unknown, but it is probablyalready included in the above mentioned amount.
Natural gas or liquid petrol gas used as a propellant in public transport vehicles is taxed at areduced rate. The subsidy involved amounted to DEM 4 million in 1998 and was expected toincrease to DEM 30 million (EUR 15 mln) in 1999 (Subventionsbericht, 1999).
As in other countries, the own use of oil products by manufacturers of these products isexempted from the mineral oil tax. The implicit subsidy is estimated at DEM 310 mln (EUR159 mln) in 1999 (Subventionsbericht, 1999).
34
Since 1974, the federal government has built a crude oil reserve in salt caverns nearWilhelmshaven. This reserve (amounting to 7.3 Megatonnes) is financed and controlled bythe federal government (IEA, 1998d). The amount of public money involved is unknown.Tentatively, it could be estimated by assuming that the value of the reserve is at least EUR 1billion and that the annual costs in terms of storage and interest amount to 10% of this value,i.e. EUR 100 mln. In 1997, it was decided to sell the total amount of the reserve (IEA,1998d).
In 1995-1998, the German government spent less than EUR 1 mln per year on oil and gasrelated R&D (IEA, 1999f).
Germany is a member of the 1992 International Oil Pollution Compensation Fund. Thisimplies a maximum compensation for oil spills of EUR 175 mln.
Nuclear energy
Reserves set aside by the Association of German Utilities (VDEW) for future reactor closuresand nuclear waste disposal costs amounted to DEM 54 billion at the end of 1996. Thesereserves are tax exempt (IEA, 1998d). The amount of implicit subsidy is unknown. Thefederal government is considering setting up a tax on a portion of the reserves to financefuture end-storage facility operating costs (IEA, 1998d).
The federal government’s budget for R&D in the area of nuclear energy (fission and fusion)in the period 1996-2000 amounted to an average of DEM 390 mln (EUR 200 mln) per year(IEA, 1998d).
Renewables
Since 1991, electricity from renewables can be fed into the grid at a guaranteed price underthe ‘Stromeinspeisungsgesetz’. These prices are set at a percentage of final user prices,depending on the type of renewable: wind and solar electricity are paid 90% of the averageconsumer end price, small hydro facilities and biomass/waste are paid 80%, and large hydroschemes are paid 65% (IEA, 1998a). The cost of this scheme was estimated at DEM 780 mln(EUR 400 mln) in 1996 (EC, 2000b). The system is currently under revision. Future supportwill depend on the type of renewable and location. The total costs of the new system areestimated to be in the range of DEM 1.5 billion (EUR 770 million) in the first year,increasing to DEM 4 billion (EUR 2.05 billion) in 2005 (ENDS, 1999c). In March 2001, theEuropean Court of Justice has ruled that this type of support does not constitute state aidunder the EU Treaty (ENDS, 2001).
Electricity from renewables that is fed into the public grid is not exempted from the new taxon electricity that was introduced in 1999. However, as a compensatory measure thegovernment has increased the direct subsidies for renewables (ENDS, 1999a,b;Bundesfinanzministerium, 2000b). In 1999, they amounted to DEM 230.8 mln (EUR 118mln) per year (Subventionsbericht, 1999).
The Deutsche Ausgleichsbank, a public bank, grants low-interest loans to specifiedrenewable energy projects. About DEM 4 billion of loans was granted between 1990 and1997 (IEA, 1998a). A quantification of the subsidy involved in the interest rebate is lacking.
35
The German Government promotes use of liquid biofuels for use in motor vehicles throughtax exemptions amounting to DEM 1.5 per litre for rapeseed methyl ester (RME) (IEA,1998a). The total amount of subsidy involved is unknown.
Expenditure on renewable energy R&D amounted to EUR 103 mln in 1996, almost 30% ofthe government's total energy R&D budget. The majority of funds are devoted to solarapplications, particularly PV, although significant expenditure is also allocated to windenergy. Biomass and geothermal energy receive a much lower level of funding (IEA, 1998a).The average government budget for renewables related R&D in the period 1995-1998amounted to EUR 85.8 mln per year (IEA, 1999f).
Subsidies for renewable energy also exist at the Länder level. Some examples which haverecently been approved by the European Commission include8:- Niedersachsen: investment support for renewables of some EUR 7.5 mln per year;- Niedersachsen: aid for innovative pilot projects for the use of solar energy (EUR 1 mln
per year);- Thüringen: subsidies for renewable energy and energy conservation amounting to EUR 7
mln per year;- Rheinland-Pfalz: a program for investment support covering various types of renewables,
with a budget of EUR 1.7 mln per year.
Electricity
The electricity tax (normal rate in 1999: DEM 20 per MWh) is levied at reduced rates of:- 50% for nighttime heat storage systems (installed before 1 April 1999) and railway
operations;- 20% for industry and agriculture, to the extent that the payable tax exceeds DEM 1000
per year.The latter tax reduction is estimated to lead to a loss of tax income for the German federalgovernment of DEM 3.5 billion (EUR 1.8 billion) in the year 2000 (Subventionsbericht,1999).
Furthermore (as stated above under ‘oil and gas’), individual enterprises can get a tax refundif the additional tax burden brought about by the ecological tax reform (i.e. the introductionof the electricity tax and the increase in the tax rates for oil products and gas) exceeds thereduction in social security and pension contributions (which was included in the tax reformas a compensatory measure) by a factor of 1.2 or more. The amount of implicit subsidyinvolved is unknown.
In 1995-1998, the German government spent on average EUR 16.3 mln per year onelectricity related R&D (IEA, 1999f).
8 State aid cases N531/99, N533/99, N709/99 and N759/99, respectively.

36
Table 2.7.1. Germany: Summary TableFinal energy consumption (1998): 223.6 MtoeGross electricity generation (1998): 556.7 TWh
coal oil & gas nuclear renewables electricityshare in gross electricity generation (1998) 53% 12% 29% 6%quantifiable subsidies (mln EUR per year) 8,500 800 200 > 200 1,800quantifiable subsidies, incl. attributedelectricity subsidies (mln EUR per year) 9,500 1,000 > 700 > 300Source: Energy statistics: Eurostat (2000a); other figures: this section.

37
2.8 GREECE
Solid fuels
Lignite is an important domestic fuel in Greece. It is mainly produced by the state powercompany PPC and therefore it is impossible to identify any implicit subsidies.
In 1995-1997, the Greek government spent on average EUR 1.2 mln per year on coal relatedR&D (IEA, 1999f).
Oil and gas
In order to encourage the development of small oil and gas fields and to improve theeconomics of fields located in deep waters, Greece introduced a new hydrocarbonsexploration law in 1995. The law contains, among others, a number of tax incentives (IEA,1998c):- 40% income tax;- no other taxes;- exemption from customs duties;- 50% of exploration expenses from a different concession area are creditible against
production.The amounts of implicit subsidy involved are unknown.
Greece is currently expanding its natural gas grid. The total cost involved is estimated at EUR2 billion, largely to be financed by the European Investment Bank (Government of Greece,1997).
The Greek CO2 abatement Action Plan, which covers the period 1995 through 1999, reportsan amount of EUR 184 mln (EUR 37 mln per year) of public expenditure for the conversionto natural gas in electricity generation. However, this money is invested by the Public PowerCorporation (PPC) and should probably not be regarded as a subsidy.
Since 1995, 75% of the cost of household appliances using natural gas can be deducted froma person's taxable income. The amount of subsidy (tax foregone) involved is unknown. Toassess the order of magnitude it could be assumed that 100,000 households per year spend anaverage EUR 200 on such appliances. At a marginal tax rate of 45% this would imply asubsidy of EUR 6.75 million per year.
Natural gas is subject to the standard VAT rate (currently 18%), but is exempted from othertaxes up to 31 December 2010 (IEA, 1998e). As Greece does not (yet) apply a general energytax, this can not be considered as a subsidy.
During the heating season, the excise tax on fuel oil for space heating is reduced from GRD83 to GRD 42 per litre (EC, 1999b). The use of gas oil in the services and households sectoramounted to 3.1 mln tonnes in 1998 (Eurostat, 2000a). Assuming that the main part of this(say, 2 mln tonnes) related to fuel oil for space heating, purchased during the heating season,the implicit subsidy can be estimated at some GRD 80 bln (EUR 242 mln).
38
In 1995-1997, the Greek government spent on average EUR 1.4 mln per year on oil and gasrelated R&D (IEA, 1999f).
Greece is a member of the 1992 International Oil Pollution Compensation Fund. This impliesa maximum compensation for oil spills of EUR 175 mln.
Nuclear energy
Greece does not have any nuclear power plants.
Public funding for R&D in the area of nuclear energy amounts to less than EUR 1 mln peryear (cf. IEA, 1998e, 1999f).
Renewables
The Public Power Corporation (PPC) is required by law to purchase electricity from smallrenewable electricity plants at 70 to 90 percent of the retail electricity price. As of March1998, 37 projects totalling some 100 MWe had received construction or operating licensesunder this law (IEA, 1998e). In March 2001, the European Court of Justice has ruled that thistype of support does not constitute state aid under the EU Treaty (ENDS, 2001).
Subsidies of up to 40 per cent, reduced interest rates, accelerated depreciation and tax creditsare available for the promotion of investments in renewable energy production. It wasestimated that a total amount of GRD 44 billion in public funds would be involved in theperiod 1995-1999, i.e. about EUR 27 mln per year (Government of Greece, 1997; IEA,1998a,e).
75% of the cost of renewable appliances for households, such as solar water heating systems,can be deducted from a person's taxable income (IEA, 1998a). The amount of subsidy (taxforegone) involved is unknown.
The Operational Energy Programme of the Ministry of Industry, Energy and Technology,which ran from 1994 through 1999, allocated EUR 20 mln of public funds (almost EUR 4mln per year) for the development of renewable energy sources (in addition to EU andprivate funds) (Government of Greece, 1997; IEA, 1998a).
In 1995-1997, the Greek government spent on average EUR 4.3 mln per year on renewablesrelated R&D (IEA, 1999f).
In the Greek CO2 abatement Action Plan, which covers the period 1995 through 1999, thevarious elements in the available public budget for renewable energy add up to EUR 203.5mln, or EUR 41 mln per year, including public R&D funding and spending by localgovernments (Government of Greece, 1997).
Electricity
Electricity pricing is affected by national policies, for social and development reasons. Inrecent years, the government has tended to restrain price rises as an instrument to control

39
inflation. Furthermore, there are uniform tariffs throughout Greece, implying substantialcross-subsidies from users of the interconnected systems to users of isolated systems (IEA,1998e).
In 1995-1997, the Greek government spent less than EUR 1 mln per year on electricityrelated R&D (IEA, 1999f).
Table 2.8.1. Greece: Summary TableFinal energy consumption (1998): 18.2 MtoeGross electricity generation (1998): 46.3 TWh
coal oil & gas nuclear renewables electricityshare in gross electricity generation (1998) 70% 21% 0% 9%quantifiable subsidies (mln EUR per year) > 1 > 250 < 1 > 35 > 1quantifiable subsidies, incl. attributedelectricity subsidies (mln EUR per year) > 1 > 250 < 1 > 35Source: Energy statistics: Eurostat (2000a); other figures: this section.
40
2.9 IRELAND
Solid fuels
Peat production is supported through the use of peat (which is some 50% more expensivethan imported coal) in five power plants. IEA (1999c) estimates the Producer SubsidyEquivalent (PSE) for peat production at IEP 15.3 mln (EUR 19.4 mln) per year in 1997/98.Furthermore, the EU (q.v.) has provided a subsidy of IEP 20 mln for a new peat fired powerplant and the Irish government has given a capital injection of IEP 108 mln to the Irish PeatBoard to restructure its debt.
Households pay a reduced VAT rate on coal (12.5% instead of the standard rate of 21%).Given a coal consumption of 847,000 tonnes by services and households in 1998 (Eurostat,2000a), an average price (excluding VAT) for households of IEP 170.91 per tonne in 1994(the latest available year – IEA, 1999d), and assuming that half of the given consumption wasby households, the implicit subsidy can be estimated at IEP 6.2 mln or EUR 7.9 mln.
Oil and gas
Since 1992, Ireland has had a comprehensive regime of fiscal and non-fiscal measuresapplicable to hydrocarbon exploration, development and production. The Irish upstreamfiscal regime is considered to be one of the most attractive in the world. Corporation tax at25% applies where production of oil and gas takes place under leases issued before certainspecified dates (2003, 2007 or 2013, depending on location) (IEA, 1999c). The standardcorporation tax rate is 32% (for company income exceeding IEP 50,000).
Furthermore, taxation allowances of 100% are available for exploration, development andoperating expenses with a provision for allowance of unsuccessful exploration expenditurefor 25 years. There is also a provision for an allowance with respect to expenditure on theabandonment of fields and dismantling of pipelines. There is no provision for royaltypayments or State participation in the current licensing terms. In the case of two gas fields,production is carried out under an earlier agreement and a royalty of 12.5% applies. (IEA,1999c).
Oil importers are obliged to purchase 20% of their supplies from an Irish refinery at pricesdetermined by the Minister. The cost to consumers of this arrangement is estimated at IEP 5mln (EUR 6 mln) per year (IEA, 1999c).
Households pay a reduced VAT rate on fuel oil and gas (12.5% instead of the standard rate of21%). Given an oil products consumption of 1.7 mln tonnes by the ‘services and households’sector in 1998 (Eurostat, 2000a), an average price (excluding VAT) for households of IEP207 per tonne in 1998 (IEA, 1999d), and assuming that half of the given consumption was byhouseholds, the implicit subsidy for oil can be estimated at IEP 15.0 mln or EUR 19.0 mln.Similarly, given a natural gas consumption of 15.7 PJ by households in 1998 (Eurostat,2000a) and an average price (excluding VAT) for households of IEP 6.97 per GJ in 1998(IEA, 1999d), the implicit subsidy for gas can be estimated at IEP 9.3 mln or EUR 11.8 mln.
Ireland is a member of the 1992 International Oil Pollution Compensation Fund. This impliesa maximum compensation for oil spills of EUR 175 mln.

41
Nuclear energy
Ireland does not have any nuclear power plants and no subsidies for nuclear R&D arereported.
Renewables
Government support has concentrated on renewable electricity generation, via the‘Alternative Energy Requirement’ (AER): a competitive tendering process wherebyelectricity from selected renewable energy projects is guaranteed a market. Until 1998,approximately 300 MW of renewable electricity-generating capacity (wind, hydro, waste-to-energy and landfill) had bid successfully for projects under AER. In the first round of AER,an amount of IEP 70 mln was budgeted for 15 years of price support for successful projects(IEA, 1998a); this is equivalent to EUR 5.9 mln per year. Assuming that subsequent roundshave yielded comparable results, it is likely that AER support now exceeds EUR 10 mln peryear.
In 1998, a new tax relief was introduced for private investment in approved wind energy andbiomass projects. This relief was to apply to up to 50% of a project's cost (capped at IEP 7.5mln per project and IEP 10 mln per year per company) (IEA, 1999c).
Public R&D funds for renewables amounted to IEP 87,000 (EUR 0.1 mln) in 1992 (IEA,1998a). More recent figures on these (and other) energy R&D subsidies are lacking.
Electricity: EUR 45 mln
Households pay a reduced VAT rate on electricity (12.5% instead of the standard rate of21%). Given an electricity consumption of 5.5 TWh by households in 1998 (Eurostat, 2000a),an average price (excluding VAT) for households of IEP 77 per MWh in 1998 (IEA, 1999d),the implicit subsidy for electricity can be estimated at IEP 36.0 mln or EUR 45.7 mln.
Table 2.9.1. Ireland: Summary TableFinal energy consumption (1998): 9.2 MtoeGross electricity generation (1998): 21.2 TWh
coal oil & gas nuclear renewables electricityshare in gross electricity generation (1998) 40% 53% 0% 7%quantifiable subsidies (mln EUR per year) 25 > 30 0 > 10 45quantifiable subsidies, incl. attributedelectricity subsidies (mln EUR per year) 40 > 50 0 > 10Source: Energy statistics: Eurostat (2000a); other figures: this section.

42
2.10 ITALY
Solid fuels
Coal is subject to a reduced VAT rate of 10%, whereas the standard rate is 20%. Coal use byhouseholds in Italy is, however, negligible, so the effective implicit subsidy is close to zero.
Until 1999, when a CO2 tax was introduced, coal was the only fossil fuel that was exemptfrom energy taxes.
There are plans to re-open a coal mine on Sardinia, which will supply coal to a gasificationplant, which in turn will feed an electricity power plant. Electricity company ENEL willpurchase the electricity generated at a preferential price. Total investment is expected toamount to ITL 2,000 billion (EUR 1 billion), part of which will be funded by the EuropeanUnion (IEA, 1999a). The (national) subsidy for coal implied in this arrangement is unknown.
Oil and gas
Natural gas is subject to a reduced VAT rate of 10%, whereas the standard rate is 20%. In1998, households used 952.4 PJ of natural gas (Eurostat, 2000a). Given a natural gas price forhouseholds (excluding VAT) of ITL 17,863 per GJ, the implicit subsidy can be estimated atITL 1.7 trillion or EUR 879 million.
Excise tax rates for natural gas differ by category of user, by type of use and by region. It isimpossible to calculate the implicit subsidy, but it is obvious that a substantial amount isinvolved if one takes the highest rate (in 1998: ITL 332 per m3 for gas used outside industry,in the centre or north of the country, for other purposes than cooking or water heating – IEA,1999a) as the baseline.
The normal royalty rate on onshore hydrocarbons production and offshore gas is 7%,although there are exemptions for small quantities. Royalties on offshore net oil productionare 4% (IEA, 1999a).
Italy is a member of the 1992 International Oil Pollution Compensation Fund. This implies amaximum compensation for oil spills of EUR 175 mln.
Nuclear energy
Italy has abandoned the use of nuclear power for energy production since 1987. Four nuclearpower plants were closed and the construction of two others was stopped. Substantialamounts of public money are involved in compensatory payments for the early closure, fordecommissioning and for nuclear waste storage. As it is unknown to what extent publicmoney for decommissioning and waste storage would also have been needed if nuclear powerproduction would have continued, it is impossible to say whether any ‘subsidies’ are involvedin terms of this report.

43
In 1995-1998, the Italian government spent on average EUR 114.0 mln per year on nuclear(fission and fusion) related R&D (IEA, 1999f).
Renewables
Since 1991, renewable energy has been stimulated by allowing certain authorised plants tosell electricity to ENEL at a regulated price. These prices differ by type of renewable and insome cases also by time of delivery (peak hours or off-peak hours). In 1997, the price paid inItaly for renewable energy was estimated by the European Commission at EUR 0.083 perkWh, the second highest (after Germany) among the countries considered (IEA, 1998a,1999a). In March 2001, the European Court of Justice has ruled that this type of support doesnot constitute state aid under the EU Treaty (ENDS, 2001).
Another 1991 law provided for investment subsidies for renewables based capacity, but thislaw has never come into effect (IEA, 1998a).
Limited support for liquid biofuels has been available since 1993. A fixed annual quota of125 ktons of diester is exempt from excise tax (IEA, 1998a). In 1998, the regulation has beenrenewed (Barra et al., 1999). Assuming that the quotum is completely used to substitute forgas oil (used as propellant), and that 1 kg of diester is equivalent to 1 litre of gas oil, then(given an excise tax rate of ITL 780.731 per litre for gas oil in 1999) the amount of implicitsubsidy can be estimated at ITL 97.6 billion or EUR 50.4 million. In addition to this,subsidies of ITL 15 billion (EUR 7.7 million) were allocated by the government for theproduction of diester from set-aside land (IEA, 1998a).
Solar (PV and heating) systems are encouraged by reducing their VAT rate from 20% to 10%(IEA, 1998a; Barra et al., 1999). The amount of subsidy involved is unknown.
Of the revenues from the CO2 tax, which was introduced in 1999, EUR 52 million isearmarked for renewable energy subsidies. Recently, it was decided to spend another EUR150 million of these revenues on various projects, including not only renewables but alsoemission reduction, transport projects and energy saving (ENDS 2000a).
District heating based upon biomass qualifies for a tax rebate of ITL 20 per kWh in specifiedclimatic zones (Barra et al., 1999). The amount of subsidy implied is unknown.
In 1995-1998, the Italian government spent on average EUR 39.3 mln per year on renewablesrelated R&D (IEA, 1999f).
Electricity
Capital subsidies to the electricity sector (taking the form of equity participation, loans atpreferential rates, loan guarantees and debt forgiveness) were estimated at EUR 700 mln in1994, with a downward trend (Tosato, 1997).
Electricity is subject to a reduced VAT rate of 10%, whereas the standard rate is 20%.Electricity use by Italian households amounted to 59.3 TWh in 1998 (Eurostat, 2000a). Givenan average price of ITL 246.7 per kWh (excluding VAT) (IEA, 1999d), the implicit subsidyis about ITL 1,463 billion or EUR 756 mln.
44
Household consumption of electricity is subject to an excise tax of ITL 9.1 per kWh, but thefirst 150 kWh per month remains untaxed. Assuming there are some 20 mln households inItaly, and that they use on average 100 kWh of untaxed electricity per month, the annualimplicit subsidy can be estimated at ITL 218 billion or EUR 113 mln.
For industry, the electricity tax rate is ITL 4.1 per kWh for the first 200 MWh per month, andITL 2.45 per kWh for additional consumption. The amount of implicit subsidy cannot becalculated due to lack of adequate data.
In 1995-1998, the Italian government spent on average EUR 16.2 mln per year on electricityrelated R&D (IEA, 1999f).
Table 2.10.1. Italy: Summary TableFinal energy consumption (1998): 123.5 MtoeGross electricity generation (1998): 259.1 TWh
coal oil & gas nuclear renewables electricityshare in gross electricity generation (1998) 9% 71% 0% 20%quantifiable subsidies (mln EUR per year) > 0 900 100 > 150 > 850quantifiable subsidies, incl. attributedelectricity subsidies (mln EUR per year) > 75 > 1,500 100 > 300Source: Energy statistics: Eurostat (2000a); other figures: this section.

45
3.11 LUXEMBOURG
Solid fuels
Coal is subject to a VAT rate of 12%, whereas the standard VAT rate is 15%. However, coaluse by households in Luxembourg is negligible, and therefore the effective implicit subsidy isclose to zero.
Oil and gas
Gas and oil products for domestic use are subject to VAT rates of 6% and 12% respectively,whereas the standard VAT rate is 15%. Natural gas use by households amounted to 10 PJ in1998 (Eurostat, 2000a). Given a gas price for households of LUF 265 per GJ (excludingVAT) in 1997 (the latest available year – IEA, 1999d), the implicit subsidy for gas is LUF238.5 mln or EUR 5.9 mln. The use of oil products by the services & households sector was356 TJ in 1998, which implies that the implicit subsidy for oil products is negligible (lessthan EUR 1 mln).
Land-locked Luxembourg is not a member of an International Oil Pollution CompensationFund.
Nuclear energy
Luxembourg has no nuclear power plants and no subsidies for nuclear R&D are reported.
Renewables
On 1 January 2001, government support for renewable energy was to be expandedconsiderably. The available subsidies include (Umweltministerium, 2000):- 50% of investment costs in PV systems in residential and other buildings;- a premium of up to LUF 25 (EUR 0.62) per kWh for electricity from PV;- 40% of investment costs in passive solar systems (for water and space heating);- up to LUF 3,025 (EUR 75) per kW for investments in wind turbines;- a premium of LUF 4.1 (EUR 0.10) per kWh for electricity from (small scale) wind;- 25 to 50% of investment costs in biomass and biogas installations;- a premium of LUF 1 (EUR 0.02) per kWh for electricity from (small scale) hydropower,
biomass and biogas.The amounts involved in the investment subsidies will of course depend upon the actualvolume of investment. The amounts involved in the premiums for renewables basedelectricity can be estimated as follows. If we assume that of the hydro based electricity (1049GWh in 1998 – Eurostat, 2000a) 20% qualifies for the premiums, and 100% of otherrenewable electricity (11 GWh wind and 45 GWh biomass - ibidem), the total subsidy isabout LUF 300 mln or EUR 7.4 mln.

46
Electricity
Electricity is subject to a reduced VAT rate of 6%, whereas the standard VAT rate is 15%.Electricity consumption by households amounted to 752 GWh in 1998 (Eurostat, 2000a).Given an electricity price for households of LUF 4,179 per MWh (excluding VAT), theimplicit subsidy can be estimated at LUF 283 mln or EUR 7.0 mln.
Since 1 January 2001, connections to the public electricity grid are eligible to a subsidy of50% of the investment costs, up to a maximum of EUR 100,000 (Umweltministerium, 2000).The amount of subsidy involved is unknown.
Table 2.11.1. Luxembourg: Summary TableFinal energy consumption (1998): 3.2 MtoeGross electricity generation (1998): 1.3 TWh
coal oil & gas nuclear renewables electricityshare in gross electricity generation (1998) 0% 16% 0% 84%quantifiable subsidies (mln EUR per year) 0 6 0 7 > 7quantifiable subsidies, incl. attributedelectricity subsidies (mln EUR per year) 0 > 7 0 > 10Source: Energy statistics: Eurostat (2000a); other figures: this section.
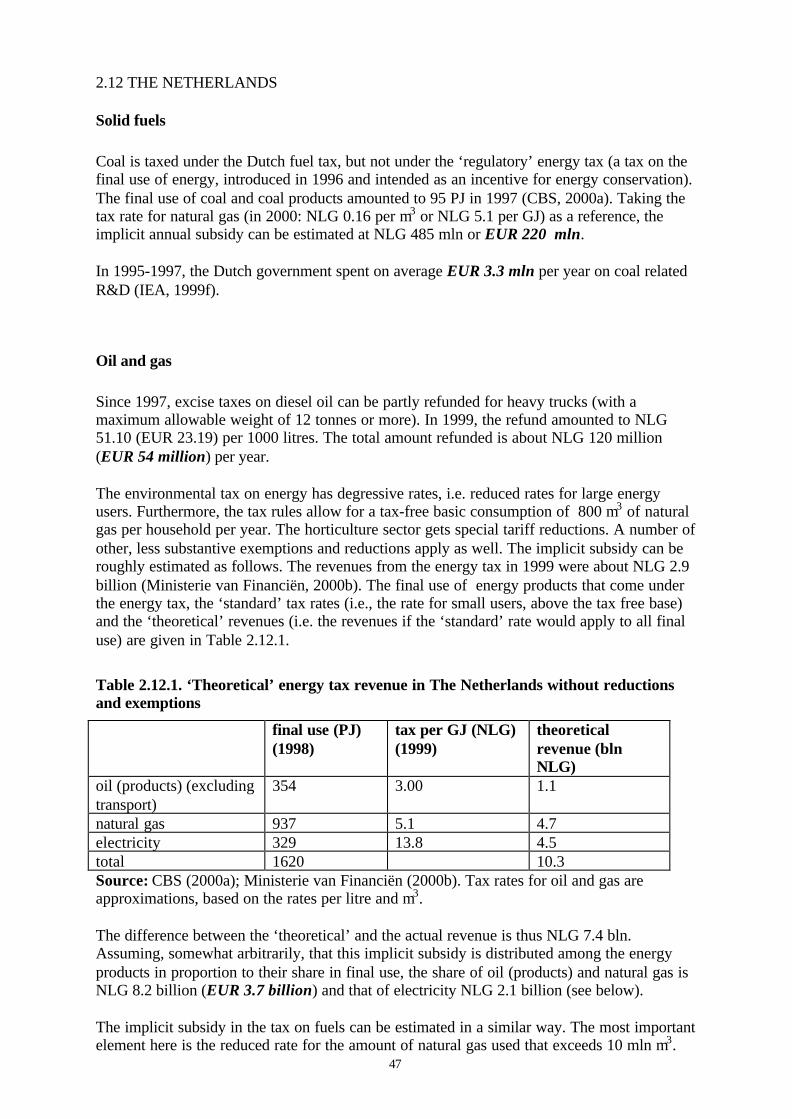
47
2.12 THE NETHERLANDS
Solid fuels
Coal is taxed under the Dutch fuel tax, but not under the ‘regulatory’ energy tax (a tax on thefinal use of energy, introduced in 1996 and intended as an incentive for energy conservation).The final use of coal and coal products amounted to 95 PJ in 1997 (CBS, 2000a). Taking thetax rate for natural gas (in 2000: NLG 0.16 per m3 or NLG 5.1 per GJ) as a reference, theimplicit annual subsidy can be estimated at NLG 485 mln or EUR 220 mln.
In 1995-1997, the Dutch government spent on average EUR 3.3 mln per year on coal relatedR&D (IEA, 1999f).
Oil and gas
Since 1997, excise taxes on diesel oil can be partly refunded for heavy trucks (with amaximum allowable weight of 12 tonnes or more). In 1999, the refund amounted to NLG51.10 (EUR 23.19) per 1000 litres. The total amount refunded is about NLG 120 million(EUR 54 million) per year.
The environmental tax on energy has degressive rates, i.e. reduced rates for large energyusers. Furthermore, the tax rules allow for a tax-free basic consumption of 800 m3 of naturalgas per household per year. The horticulture sector gets special tariff reductions. A number ofother, less substantive exemptions and reductions apply as well. The implicit subsidy can beroughly estimated as follows. The revenues from the energy tax in 1999 were about NLG 2.9billion (Ministerie van Financiën, 2000b). The final use of energy products that come underthe energy tax, the ‘standard’ tax rates (i.e., the rate for small users, above the tax free base)and the ‘theoretical’ revenues (i.e. the revenues if the ‘standard’ rate would apply to all finaluse) are given in Table 2.12.1.
Table 2.12.1. ‘Theoretical’ energy tax revenue in The Netherlands without reductionsand exemptions
final use (PJ)(1998)
tax per GJ (NLG)(1999)
theoreticalrevenue (blnNLG)
oil (products) (excludingtransport)
354 3.00 1.1
natural gas 937 5.1 4.7electricity 329 13.8 4.5total 1620 10.3Source: CBS (2000a); Ministerie van Financiën (2000b). Tax rates for oil and gas areapproximations, based on the rates per litre and m3.
The difference between the ‘theoretical’ and the actual revenue is thus NLG 7.4 bln.Assuming, somewhat arbitrarily, that this implicit subsidy is distributed among the energyproducts in proportion to their share in final use, the share of oil (products) and natural gas isNLG 8.2 billion (EUR 3.7 billion) and that of electricity NLG 2.1 billion (see below).
The implicit subsidy in the tax on fuels can be estimated in a similar way. The most importantelement here is the reduced rate for the amount of natural gas used that exceeds 10 mln m3.

48
Furthermore, for ‘residual’ fuels (such as blast furnace gas and refinery gas) that are used inthe same plant where they originate, a zero tax rate will apply until 2003. Table 2.12.2 showsthe calculation of the ‘theoretical’ tax revenue if all fuels were taxed at their standard rate.The actual revenue in 1999 amounted to NLG 1,345 mln (Ministerie van Financiën, 2000b).The difference with the actual revenue is about NLG 660 mln or EUR 300 mln. As there areno exemptions or reductions for coal, this implicit subsidy can be completely attributed to oiland gas.
Table 2.12.2. ‘Theoretical’ revenue from the tax on fuels without reductions andexemptions, 1999
use (PJ) tax per GJ (NLG) theoreticalrevenue (mlnNLG)
coal 351 0.81 284oil (products) 1055 0.67 707natural gas 1452 0.70 1016total 2858 2007Source: CBS (2000b); Ministerie van Financiën (2000b). Tax rates are approximations,based on the rates per litre, kg and m3. Tax rates for different oil products have beenaveraged.
Investments in oil and gas production on the Dutch part of the Continental Shelf can be freelydepreciated. The tax expenditures involved in this arrangement are estimated at NLG 45 mln(EUR 20 mln) in 2000 (Ministerie van Financiën, 2000a).
As in other countries, the own use of mineral oil products by refineries is exempted fromexcise tax. Since 1 January 2000, this exemption also applies to the fuel tax and the energytax. The amount of implicit subsidy involved is unknown.
The strategic oil reserves are financed by a specific levy on oil products and should thereforenot be regarded as being ‘subsidised’.
In 1995-1997, the Dutch government spent on average EUR 54.3 mln per year on oil and gasrelated R&D (IEA, 1999f).
The Netherlands are a member of the 1992 International Oil Pollution Compensation Fund.This implies a maximum compensation for oil spills of EUR 175 mln.
Nuclear energy
Presently, there is only one nuclear power plant operating in The Netherlands, which is due tobe closed in 2004.
All costs of the Central Organisation for Radioactive Waste (COVRA) have to be covered byfees paid for the waste it receives. Funds for the decommissioning of the nuclear power plantsare collected by the operators via an internal scheme (EC, 1999d).
The maximum amount for which the operator of a nuclear plant is obliged to have a financialsecurity to cover his legal liability for a nuclear accident is NLG 750 mln (EUR 340 mln).

49
In 1995-1997, the Dutch government spent on average EUR 26.3 mln per year on nuclearrelated R&D (IEA, 1999f).
Renewables
The budget for renewable energy of the Ministry of Economic Affairs contained in 1999 and2000 an average amount of NLG 168.5 mln (EUR 76.5 mln) per year (Ministerie vanEconomische Zaken, 1999). This includes investment subsidies as well as R&D programmes.
Within the framework of the ‘CO2 reduction plan’, which started in 1996, subsidiesamounting to more than NLG 900 mln are available for projects contributing to CO2 emissionreduction. In the first four years, about NLG 100 mln (EUR 11 mln per year) has been madeavailable for projects involving renewable energy (Projectbureau CO2-reductieplan, 2000).
Electricity from renewables is exempted from the energy tax. In 1998, when the EuropeanCommission granted approval for this exemption, the amount of subsidy involved wasestimated at NLG 30 mln (EUR 14 mln) (ENDS, 1998c). Meanwhile, the tax rates as well asthe production and use of ‘green’ electricity have increased considerably. Therefore, theannual subsidy might currently be several times higher.
For specific investments in energy conservation and renewable energy, companies can deduct40 to 52% of the investment costs from their fiscal profit. The amount of tax expenditureinvolved is NLG 360 mln in 2000 (Ministerie van Financiën, 2000b). It is unknown whichpart of this amount is related to renewables. In 1999, the largest investments under thisscheme were in various energy conservation measures and in wind turbines (Senter, 2000).Assuming that 50% of the tax expenditure benefits renewables, the implicit subsidy is EUR82 mln. For non-commercial institutions a comparable scheme applies, with subsidiesamounting to NLG 35 mln. per year. Assuming once again that 50% of this relates torenewable energy, this means a subsidy of EUR 8 mln per year.
Another fiscal facility is the ‘VAMIL’ scheme, allowing enterprises to determine themselveswhen they want to depreciate investments in certain environmentally benign investments,which are on a list that is updated annually. In 2000, tax expenditures under VAMIL areestimated to amount to NLG 250 mln (Ministerie van Financiën, 2000b). In 1999, 47% ofinvestments under the VAMIL scheme were related to energy (Ministerie van VROM, 2000).Assuming that half of this (23.5%) relates to renewables, the implied subsidy is EUR 27 mln.
Interest and dividend on “green” investments are tax-exempt. The total tax expendituresunder this scheme amounted to NLG 50 mln in 2000 (Ministerie van Financiën, 2000b). Thepart accruing to renewable energy can be estimated as follows. In the period 1995-1999, 273projects have been declared eligible for the “Green investment” scheme. The total amount ofinvestment involved was NLG 735 mln. Assuming an average interest/dividend on suchinvestments of 4%, and a marginal income tax rate of 50%, the tax expenditure involvedamounts to some NLG 15 mln or EUR 7 mln per year.
Bio-ethanol for pilot projects is exempted from the excise tax on mineral oils. An annualamount of NLG 13.5 mln (EUR 6 mln) is available for this tax expenditure scheme.

50
Electricity
The energy tax has reduced rates for large electricity users. Furthermore, the energy taxallows for a tax-free basic consumption of 800 kWh of electricity per dwelling per year.Some other, less substantial reductions and exemptions apply as well (including theexemption for electricity from renewables, see above). The amount of implicit subsidy wasroughly calculated above (under ‘oil and gas’ at NLG 2.1 billion (EUR 1.0 billion). The shareof the exemption for renewables (calculated at some EUR 50 mln above) disappears in themargin of error of this amount.
In 1995-1997, the Dutch government spent on average EUR 17.1 mln per year on electricityrelated R&D (IEA, 1999f).
Table 2.12.3. The Netherlands: Summary TableFinal energy consumption (1998): 49.2 MtoeGross electricity generation (1998): 90.9 TWh
coal oil & gas nuclear renewables electricityshare in gross electricity generation (1998) 27% 64% 4% 4%quantifiable subsidies (mln EUR per year) 225 > 4,000 25 > 230 1,000quantifiable subsidies, incl. attributedelectricity subsidies (mln EUR per year) 250 > 4,500 65 > 250Source: Energy statistics: Eurostat (2000a); other figures: this section.

51
2.13 PORTUGAL
Solid fuels
Portugal’s coal production and the associated subsidies were terminated in 1994.
Public R&D expenditure for coal amounts to less than EUR 1 mln per year (IEA, 1999f,2000c).
Oil and gas
Public R&D expenditure for oil and gas amounts to less than EUR 1 mln per year (IEA,1999f, 2000c).
During the period 1994-1999, the Portuguese state has funded a total amount of EUR 6 mlnfor the promotion of natural gas (EUR 1 mln per year on average) (IEA, 2000c).Substantially higher amounts have been funded by the EU (a total of 194 mln; see Section2.1) and by public enterprises (EUR 286 mln). The latter, however, cannot be regarded as asubsidy as it may be expected that this investment will be recovered from gas consumers.
Heating oil used to be subject to a reduced VAT rate of 5%, but in 1997 it was raised to thestandard rate of 17% whereas at the same time the VAT rate for natural gas was reduced to5%. Natural gas consumption by households amounted to 358 TJ in 1998 (Eurostat, 2000a),which means that the implicit subsidy is less than EUR 1 mln.
Portugal is a member of the 1971 International Oil Pollution Compensation Fund. Thisimplies a maximum compensation for oil spills of EUR 78 mln.
Nuclear energy
There is no nuclear power production in Portugal.
Public R&D expenditure for nuclear energy amounts to less than EUR 1 mln per year (IEA,1999f).
Renewables
The 1994 Energy Programme provides, among others, for support to renewable energy. Thetypes of support include capital grants, ‘soft’ loans and guaranteed prices for electricity fromrenewables (IEA, 1998a). Public funding for renewables amounted to a total of EUR 159 mlnin the period 1995-1999, of which 69 mln came from the EU (see Section 2.1) and EUR 90mln (EUR 18 mln per year) from national sources (IEA, 2000c). As it is unclear to whatextent this funding consists of subsidies, the said amount is an upper limit for the subsidyestimate.

52
Purchases of renewable energy equipment (such as solar panels for residential use) benefitfrom the reduced VAT rate of 5% under the 1992 Budget Law. It is also possible to deductthe investment cost in renewable end-use technology from personal taxable income (subjectto a ceiling) (IEA, 1998a). The amounts of implicit subsidy involved in these fiscal incentivesare unknown.
Public R&D spending on renewable energy amounted to PTE 253 mln or EUR 1.3 mln in1999 (IEA, 2000c). In 1995-1997, the annual average was below EUR 1 mln (IEA, 1999f).
Electricity
Electricity is subject to a reduced VAT rate of 5%, whereas the standard rate is 17%.Electricity consumption by households amounted to 8.8 TWh in 1998 (Eurostat, 2000a).Given an average price (excluding VAT) for households of PTE 26.4 per kWh, the implicitsubsidy can be calculated at PTE 27.5 billion or EUR 137 million.
Table 2.13.1. Portugal: Summary TableFinal energy consumption (1998): 15.6 MtoeGross electricity generation (1998): 39.0 TWh
coal oil & gas nuclear renewables electricityshare in gross electricity generation (1998) 31% 33% 0% 37%quantifiable subsidies (mln EUR per year) < 1 < 3 < 1 20 135quantifiable subsidies, incl. attributedelectricity subsidies (mln EUR per year) 40 45 < 1 70Source: Energy statistics: Eurostat (2000a); other figures: this section.
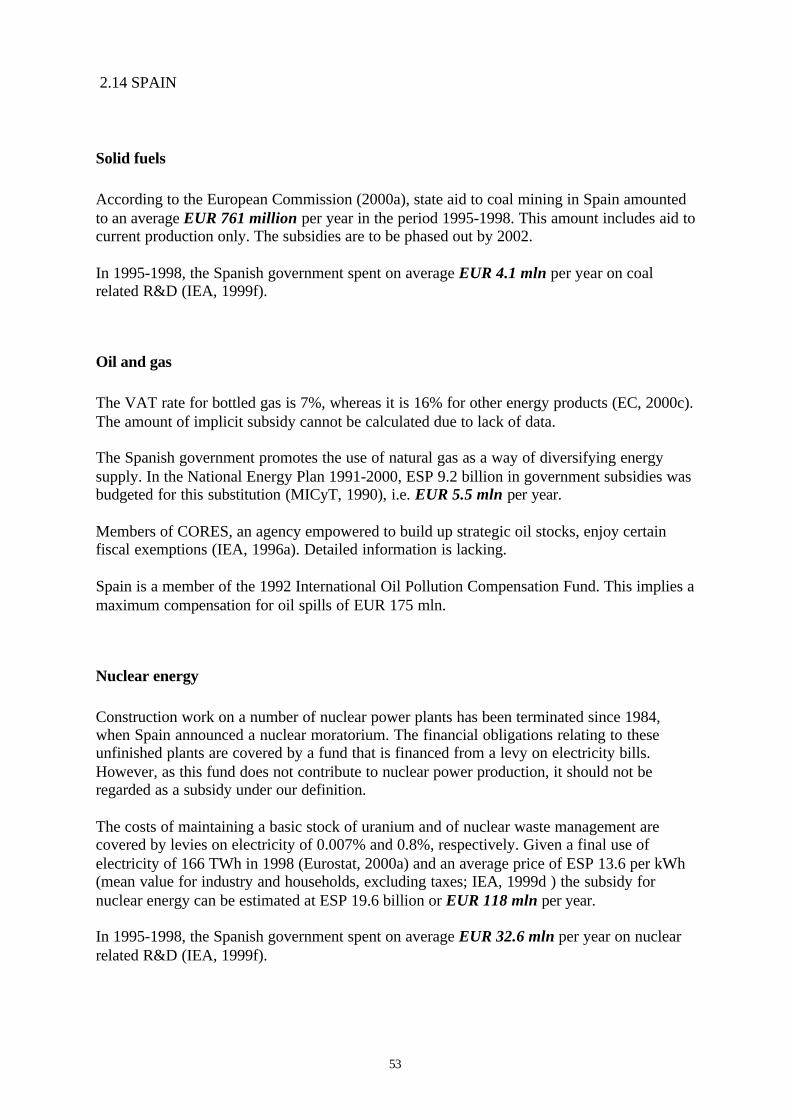
53
2.14 SPAIN
Solid fuels
According to the European Commission (2000a), state aid to coal mining in Spain amountedto an average EUR 761 million per year in the period 1995-1998. This amount includes aid tocurrent production only. The subsidies are to be phased out by 2002.
In 1995-1998, the Spanish government spent on average EUR 4.1 mln per year on coalrelated R&D (IEA, 1999f).
Oil and gas
The VAT rate for bottled gas is 7%, whereas it is 16% for other energy products (EC, 2000c).The amount of implicit subsidy cannot be calculated due to lack of data.
The Spanish government promotes the use of natural gas as a way of diversifying energysupply. In the National Energy Plan 1991-2000, ESP 9.2 billion in government subsidies wasbudgeted for this substitution (MICyT, 1990), i.e. EUR 5.5 mln per year.
Members of CORES, an agency empowered to build up strategic oil stocks, enjoy certainfiscal exemptions (IEA, 1996a). Detailed information is lacking.
Spain is a member of the 1992 International Oil Pollution Compensation Fund. This implies amaximum compensation for oil spills of EUR 175 mln.
Nuclear energy
Construction work on a number of nuclear power plants has been terminated since 1984,when Spain announced a nuclear moratorium. The financial obligations relating to theseunfinished plants are covered by a fund that is financed from a levy on electricity bills.However, as this fund does not contribute to nuclear power production, it should not beregarded as a subsidy under our definition.
The costs of maintaining a basic stock of uranium and of nuclear waste management arecovered by levies on electricity of 0.007% and 0.8%, respectively. Given a final use ofelectricity of 166 TWh in 1998 (Eurostat, 2000a) and an average price of ESP 13.6 per kWh(mean value for industry and households, excluding taxes; IEA, 1999d ) the subsidy fornuclear energy can be estimated at ESP 19.6 billion or EUR 118 mln per year.
In 1995-1998, the Spanish government spent on average EUR 32.6 mln per year on nuclearrelated R&D (IEA, 1999f).
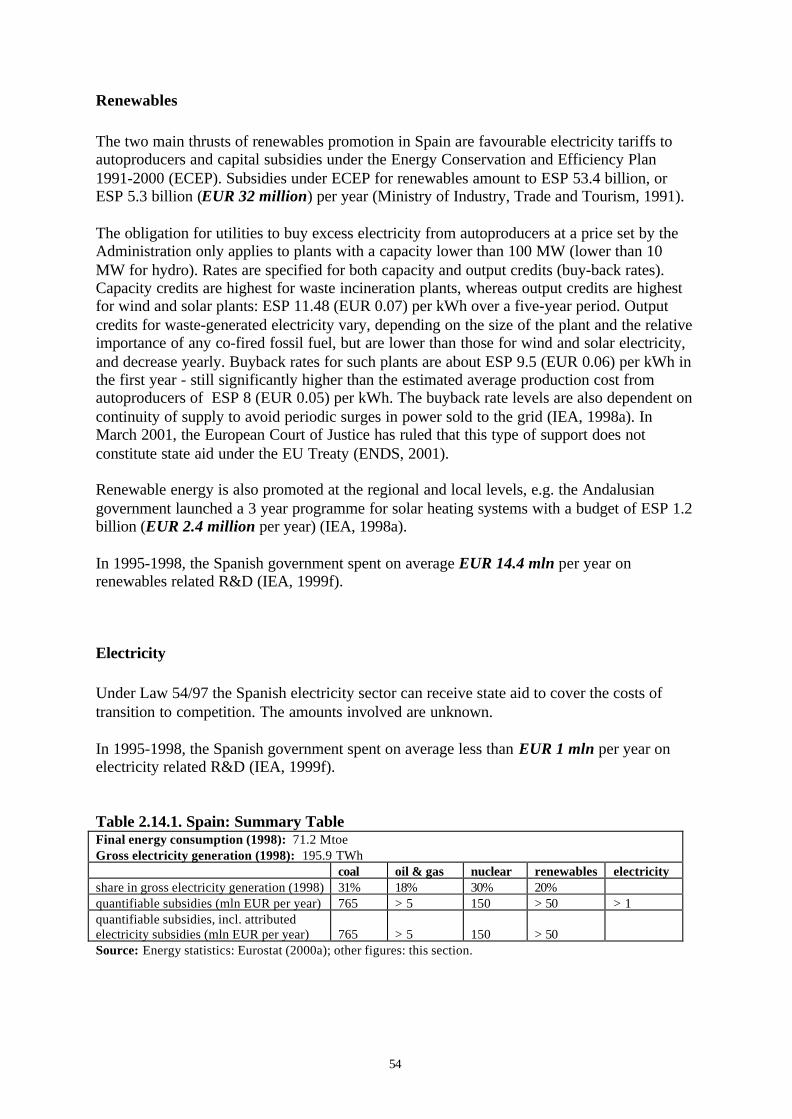
54
Renewables
The two main thrusts of renewables promotion in Spain are favourable electricity tariffs toautoproducers and capital subsidies under the Energy Conservation and Efficiency Plan1991-2000 (ECEP). Subsidies under ECEP for renewables amount to ESP 53.4 billion, orESP 5.3 billion (EUR 32 million) per year (Ministry of Industry, Trade and Tourism, 1991).
The obligation for utilities to buy excess electricity from autoproducers at a price set by theAdministration only applies to plants with a capacity lower than 100 MW (lower than 10MW for hydro). Rates are specified for both capacity and output credits (buy-back rates).Capacity credits are highest for waste incineration plants, whereas output credits are highestfor wind and solar plants: ESP 11.48 (EUR 0.07) per kWh over a five-year period. Outputcredits for waste-generated electricity vary, depending on the size of the plant and the relativeimportance of any co-fired fossil fuel, but are lower than those for wind and solar electricity,and decrease yearly. Buyback rates for such plants are about ESP 9.5 (EUR 0.06) per kWh inthe first year - still significantly higher than the estimated average production cost fromautoproducers of ESP 8 (EUR 0.05) per kWh. The buyback rate levels are also dependent oncontinuity of supply to avoid periodic surges in power sold to the grid (IEA, 1998a). InMarch 2001, the European Court of Justice has ruled that this type of support does notconstitute state aid under the EU Treaty (ENDS, 2001).
Renewable energy is also promoted at the regional and local levels, e.g. the Andalusiangovernment launched a 3 year programme for solar heating systems with a budget of ESP 1.2billion (EUR 2.4 million per year) (IEA, 1998a).
In 1995-1998, the Spanish government spent on average EUR 14.4 mln per year onrenewables related R&D (IEA, 1999f).
Electricity
Under Law 54/97 the Spanish electricity sector can receive state aid to cover the costs oftransition to competition. The amounts involved are unknown.
In 1995-1998, the Spanish government spent on average less than EUR 1 mln per year onelectricity related R&D (IEA, 1999f).
Table 2.14.1. Spain: Summary TableFinal energy consumption (1998): 71.2 MtoeGross electricity generation (1998): 195.9 TWh
coal oil & gas nuclear renewables electricityshare in gross electricity generation (1998) 31% 18% 30% 20%quantifiable subsidies (mln EUR per year) 765 > 5 150 > 50 > 1quantifiable subsidies, incl. attributedelectricity subsidies (mln EUR per year) 765 > 5 150 > 50Source: Energy statistics: Eurostat (2000a); other figures: this section.
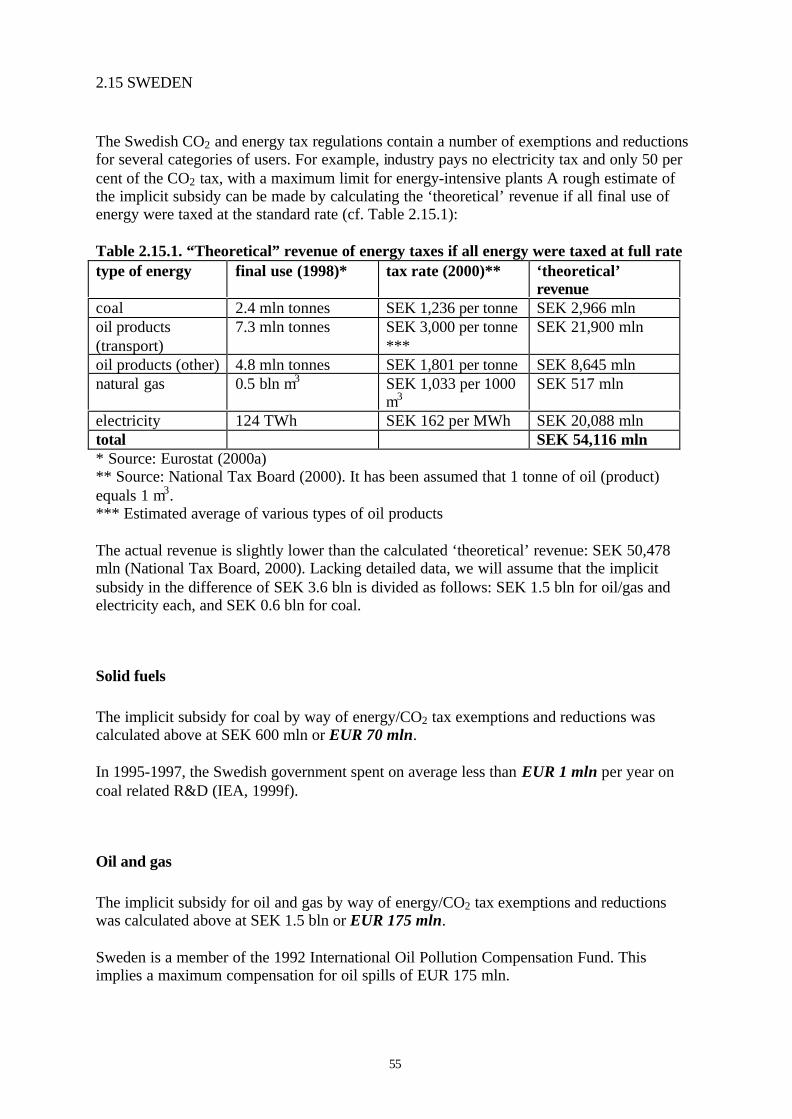
55
2.15 SWEDEN
The Swedish CO2 and energy tax regulations contain a number of exemptions and reductionsfor several categories of users. For example, industry pays no electricity tax and only 50 percent of the CO2 tax, with a maximum limit for energy-intensive plants A rough estimate ofthe implicit subsidy can be made by calculating the ‘theoretical’ revenue if all final use ofenergy were taxed at the standard rate (cf. Table 2.15.1):
Table 2.15.1. “Theoretical” revenue of energy taxes if all energy were taxed at full ratetype of energy final use (1998)* tax rate (2000)** ‘theoretical’
revenuecoal 2.4 mln tonnes SEK 1,236 per tonne SEK 2,966 mlnoil products(transport)
7.3 mln tonnes SEK 3,000 per tonne***
SEK 21,900 mln
oil products (other) 4.8 mln tonnes SEK 1,801 per tonne SEK 8,645 mlnnatural gas 0.5 bln m3 SEK 1,033 per 1000
m3SEK 517 mln
electricity 124 TWh SEK 162 per MWh SEK 20,088 mlntotal SEK 54,116 mln* Source: Eurostat (2000a)** Source: National Tax Board (2000). It has been assumed that 1 tonne of oil (product)equals 1 m3.*** Estimated average of various types of oil products
The actual revenue is slightly lower than the calculated ‘theoretical’ revenue: SEK 50,478mln (National Tax Board, 2000). Lacking detailed data, we will assume that the implicitsubsidy in the difference of SEK 3.6 bln is divided as follows: SEK 1.5 bln for oil/gas andelectricity each, and SEK 0.6 bln for coal.
Solid fuels
The implicit subsidy for coal by way of energy/CO2 tax exemptions and reductions wascalculated above at SEK 600 mln or EUR 70 mln.
In 1995-1997, the Swedish government spent on average less than EUR 1 mln per year oncoal related R&D (IEA, 1999f).
Oil and gas
The implicit subsidy for oil and gas by way of energy/CO2 tax exemptions and reductionswas calculated above at SEK 1.5 bln or EUR 175 mln.
Sweden is a member of the 1992 International Oil Pollution Compensation Fund. Thisimplies a maximum compensation for oil spills of EUR 175 mln.

56
Nuclear energy
Nuclear power, now responsible for half of Sweden’s electricity production, is to be phasedout by 2010.
All costs for the back-end of the nuclear fuel cycle, including decommissioning, are borne bythe reactor operators via fees paid into state funds (EC, 1999d).
In 1995-1997, the Swedish government spent on average EUR 6.6 mln per year on nuclearrelated R&D (IEA, 1999f).
Renewables
A government programme set up to encourage increased use of renewables has been runningsince July 1997. This programme supports renewable energy investments in order toencourage increased production of renewable electricity, particularly from biomass and wind(IEA, 1998a). The programme includes grants of:
• 25% for investments in CHP plants based on biomass (up to SEK 3000 per kWe), witha 5-year budget of SEK 450 mln;
• 15% for wind turbines over 200 kW, with a 5-year budget of SEK 300 mln;• 15% for environmentally friendly, small-scale (<1.5 MW) hydro plants, with a 5-year
budget of SEK 150 mln.The annual budget of this programme can be calculated at EUR 21 mln.
In addition to the 1997 investment support programme, the government set up a 5-yeartechnology procurement programme for renewable electricity production from January 1998.Total funds for the procurement programme are SEK 100 mln, or EUR 2.3 mln per year(IEA, 1998a).
The obligatory purchase of renewable electricity was abolished in November 1999. In 2000, aprocurement price for electricity from renewables was established in the range of SEK 0.13-0.14 per kWh (IEA, 2000e). The amount of subsidy involved is unknown. As from 2001, amarket-oriented scheme will replace the former support schemes for renewable energy.
Electricity produced by wind power is exempted from the energy tax (‘environmentalbonus’). The amount of implicit subsidy in the year 2000 was estimated at SEK 91 mln (EUR11 mln)9.
In 1995-1997, the Swedish government spent on average EUR 10.2 mln per year onrenewables related R&D (IEA, 1999f). Since then, this amount is likely to have increasedsubstantially, as the energy policy programme that has been adopted in 1997 includes, amongothers, a seven years research, development and demonstration programme of SEK 5.6billion (EUR 93 mln per year) for renewable energy sources and new energy technology. Themain target of the programme is to reduce the costs of the use of renewables so as to makethem economically more viable alternatives to nuclear power and fossil fuels (IEA, 2000e).
9 cf. letter from the European Commission dated 02.12.1999, state aid case NN 143/96.
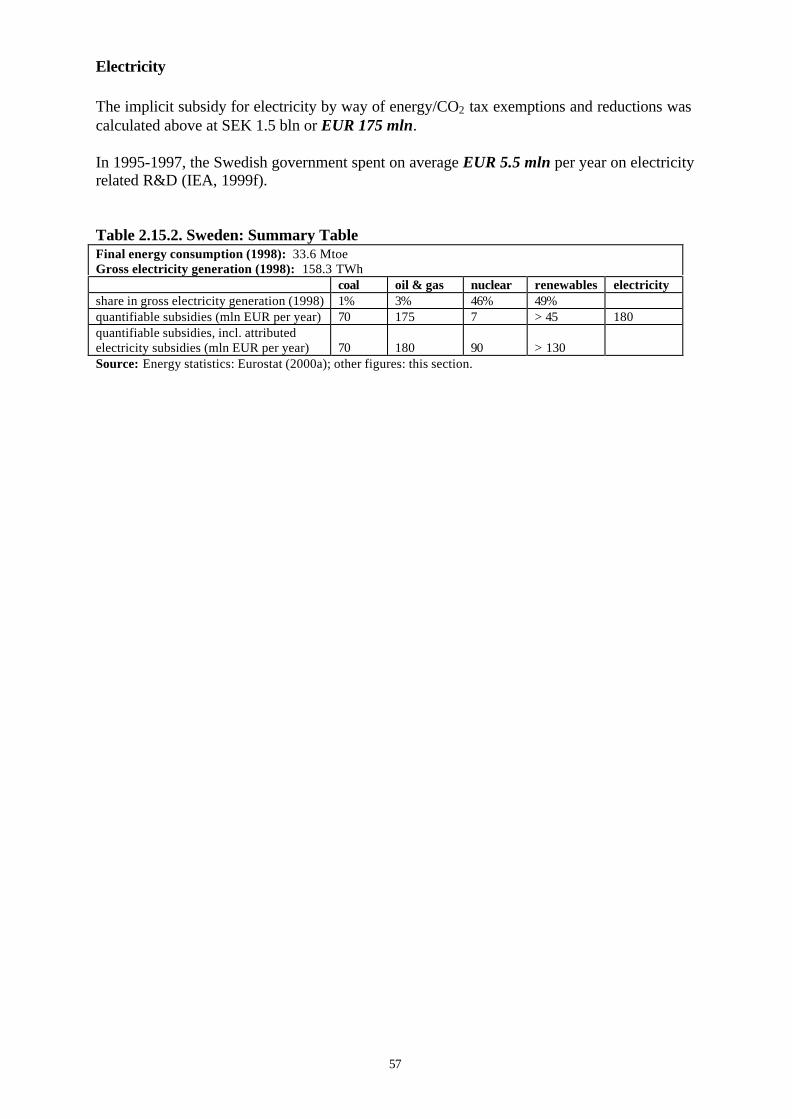
57
Electricity
The implicit subsidy for electricity by way of energy/CO2 tax exemptions and reductions wascalculated above at SEK 1.5 bln or EUR 175 mln.
In 1995-1997, the Swedish government spent on average EUR 5.5 mln per year on electricityrelated R&D (IEA, 1999f).
Table 2.15.2. Sweden: Summary TableFinal energy consumption (1998): 33.6 MtoeGross electricity generation (1998): 158.3 TWh
coal oil & gas nuclear renewables electricityshare in gross electricity generation (1998) 1% 3% 46% 49%quantifiable subsidies (mln EUR per year) 70 175 7 > 45 180quantifiable subsidies, incl. attributedelectricity subsidies (mln EUR per year) 70 180 90 > 130Source: Energy statistics: Eurostat (2000a); other figures: this section.
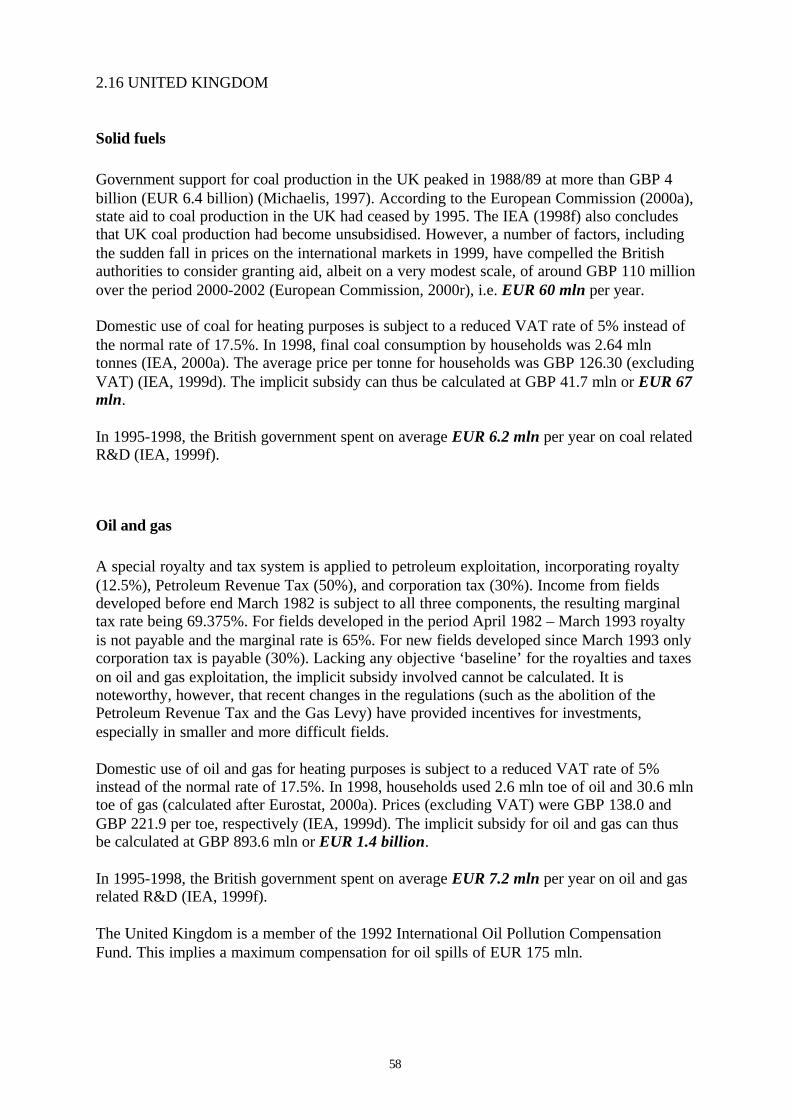
58
2.16 UNITED KINGDOM
Solid fuels
Government support for coal production in the UK peaked in 1988/89 at more than GBP 4billion (EUR 6.4 billion) (Michaelis, 1997). According to the European Commission (2000a),state aid to coal production in the UK had ceased by 1995. The IEA (1998f) also concludesthat UK coal production had become unsubsidised. However, a number of factors, includingthe sudden fall in prices on the international markets in 1999, have compelled the Britishauthorities to consider granting aid, albeit on a very modest scale, of around GBP 110 millionover the period 2000-2002 (European Commission, 2000r), i.e. EUR 60 mln per year.
Domestic use of coal for heating purposes is subject to a reduced VAT rate of 5% instead ofthe normal rate of 17.5%. In 1998, final coal consumption by households was 2.64 mlntonnes (IEA, 2000a). The average price per tonne for households was GBP 126.30 (excludingVAT) (IEA, 1999d). The implicit subsidy can thus be calculated at GBP 41.7 mln or EUR 67mln.
In 1995-1998, the British government spent on average EUR 6.2 mln per year on coal relatedR&D (IEA, 1999f).
Oil and gas
A special royalty and tax system is applied to petroleum exploitation, incorporating royalty(12.5%), Petroleum Revenue Tax (50%), and corporation tax (30%). Income from fieldsdeveloped before end March 1982 is subject to all three components, the resulting marginaltax rate being 69.375%. For fields developed in the period April 1982 – March 1993 royaltyis not payable and the marginal rate is 65%. For new fields developed since March 1993 onlycorporation tax is payable (30%). Lacking any objective ‘baseline’ for the royalties and taxeson oil and gas exploitation, the implicit subsidy involved cannot be calculated. It isnoteworthy, however, that recent changes in the regulations (such as the abolition of thePetroleum Revenue Tax and the Gas Levy) have provided incentives for investments,especially in smaller and more difficult fields.
Domestic use of oil and gas for heating purposes is subject to a reduced VAT rate of 5%instead of the normal rate of 17.5%. In 1998, households used 2.6 mln toe of oil and 30.6 mlntoe of gas (calculated after Eurostat, 2000a). Prices (excluding VAT) were GBP 138.0 andGBP 221.9 per toe, respectively (IEA, 1999d). The implicit subsidy for oil and gas can thusbe calculated at GBP 893.6 mln or EUR 1.4 billion.
In 1995-1998, the British government spent on average EUR 7.2 mln per year on oil and gasrelated R&D (IEA, 1999f).
The United Kingdom is a member of the 1992 International Oil Pollution CompensationFund. This implies a maximum compensation for oil spills of EUR 175 mln.

59
Nuclear energy
Subsidies to nuclear power producers from the Fossil Fuel Levy (introduced in 1990 toenable them to compete on the liberalised electricity market) have been ended in 1996.
BNFL, a state owned company, is responsible for the processing of nuclear waste fromnuclear power plants in the UK. The producers and owners of the radioactive waste areresponsible for bearing the cost of its management and disposal, including regulatory costs(EC, 1999d).
In 1995-1998, the British government spent on average EUR 31.2 mln per year on nuclear(fission and fusion) related R&D (IEA, 1999f).
Renewables
The production of electricity from renewable energy is stimulated by means of the ‘NonFossil Fuel Obligation’ (NFFO), which requires electricity suppliers to secure specifiedamounts of renewable energy generation capacity and to provide certain specified amounts ofelectricity from renewables to their customers. Renewable capacity is contracted under aseries of competitive bidding processes, known as ‘NFFO Orders’. NFFO orders are financedthrough the ‘fossil fuel levy’ on electricity bills. NFFO support for 1997/98 was around GBP120 mln (EUR 193 mln) (IEA, 1998a).
In 1995-1998, the British government spent on average EUR 10.1 mln per year onrenewables related R&D (IEA, 1999f).
Electricity
Domestic use of electricity is subject to a reduced VAT rate of 5% instead of the normal rateof 17.5%. In 1998, households used 9.43 mln toe of electricity (calculated after Eurostat,2000a). The average price (excluding VAT) was GBP 807.0 per toe (IEA, 1999d). Theimplicit subsidy for electricity can thus be calculated at GBP 951 mln or EUR 1.5 billion.
In 1995-1998, the British government spent on average EUR 2.9 mln per year on electricityrelated R&D (IEA, 1999f).
Table 2.16.1. United Kingdom: Summary TableFinal energy consumption (1998): 148.9 MtoeGross electricity generation (1998): 358.2 TWh
coal oil & gas nuclear renewables electricityshare in gross electricity generation (1998) 34% 34% 28% 3%quantifiable subsidies (mln EUR per year) 130 > 1,400 30 200 1,500quantifiable subsidies, incl. attributedelectricity subsidies (mln EUR per year) 650 > 1,900 450 250Source: Energy statistics: Eurostat (2000a); other figures: this section.

60
3. THE ACCESSION COUNTRIES
The description of energy subsidies in the accession countries is more concise than for theEU member states in the previous chapter. Due to incomplete information, no attempt hasbeen made to attain aggregate quantifications by country and by type of energy.
3.1 BULGARIA
Solid fuelsPrices of domestic coal and briquettes for household consumption are still state controlled(Klarer et al., 1999). The amount of subsidy involved is unknown. Production subsidies willbe phased out by the end of 2001 (EC, 2000e).
Oil and gasCross-subsidies in the gas sector in Bulgaria have been eliminated (EC, 2000e).
Bulgaria is not a member of an International Oil Pollution Compensation Fund.
Nuclear energyEarly closure of the Kozloduy nuclear power plant units 1-4 will be supported from the EU’sPhare funds (see Section 2.1).
Since 1999, funds for the management of radioactive waste and for the decommissioning ofnuclear power plants are in place. They are financed by the operators of the plant (EC,1999e).
Electricity
In 1991, electricity subsidies in Bulgaria were estimated to amount to USD 943 million(CNT, 2001). At present, prices of electricity are still state controlled (Klarer et al., 1999).The objective is to liberalise electricity prices by the end of 2001 (EC, 2000e).
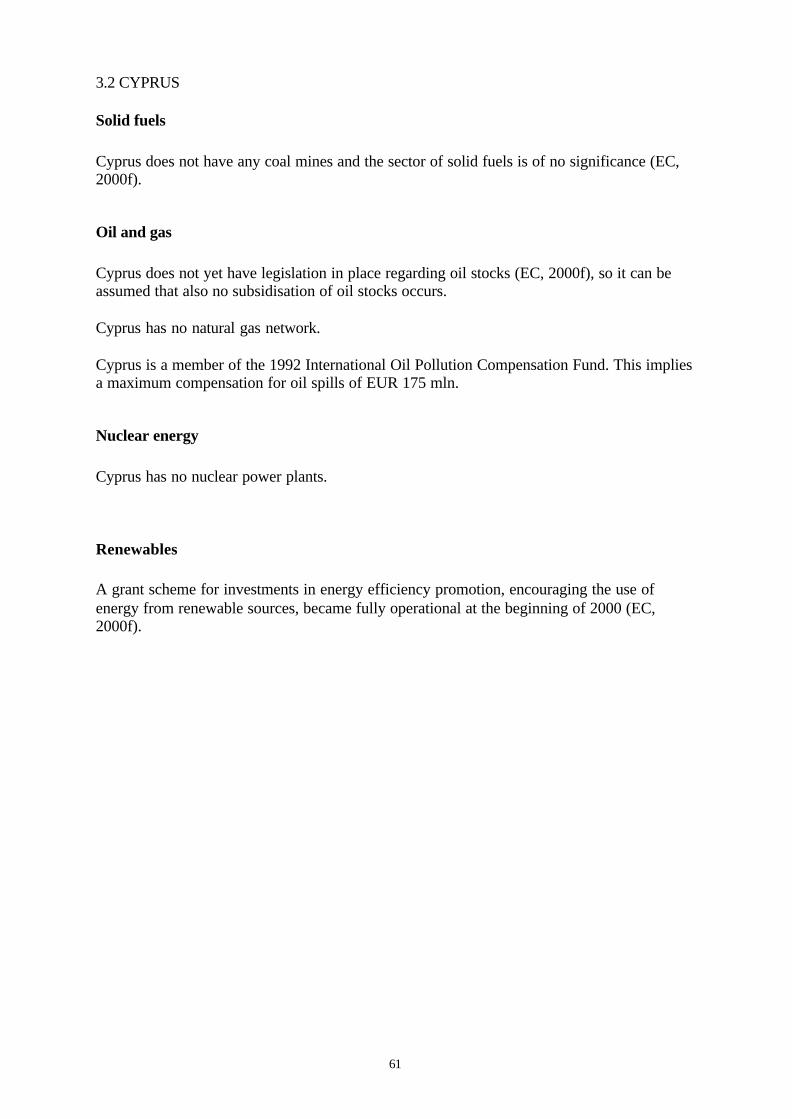
61
3.2 CYPRUS
Solid fuels
Cyprus does not have any coal mines and the sector of solid fuels is of no significance (EC,2000f).
Oil and gas
Cyprus does not yet have legislation in place regarding oil stocks (EC, 2000f), so it can beassumed that also no subsidisation of oil stocks occurs.
Cyprus has no natural gas network.
Cyprus is a member of the 1992 International Oil Pollution Compensation Fund. This impliesa maximum compensation for oil spills of EUR 175 mln.
Nuclear energy
Cyprus has no nuclear power plants.
Renewables
A grant scheme for investments in energy efficiency promotion, encouraging the use ofenergy from renewable sources, became fully operational at the beginning of 2000 (EC,2000f).
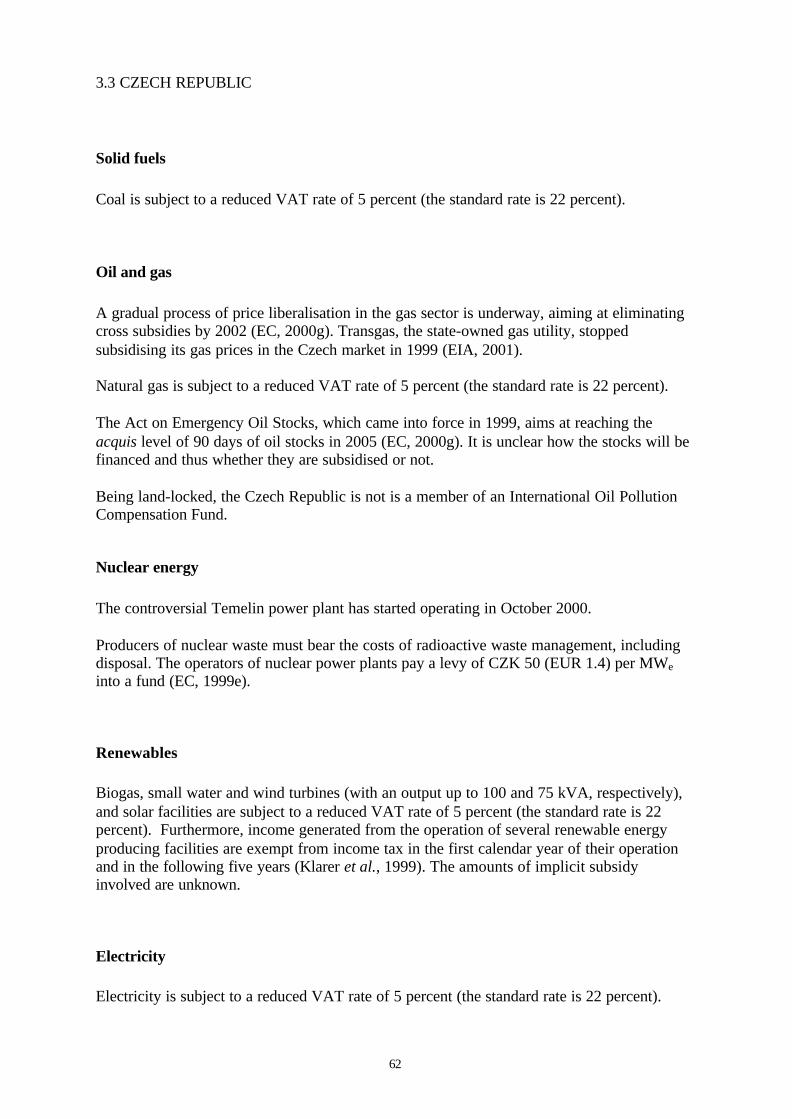
62
3.3 CZECH REPUBLIC
Solid fuels
Coal is subject to a reduced VAT rate of 5 percent (the standard rate is 22 percent).
Oil and gas
A gradual process of price liberalisation in the gas sector is underway, aiming at eliminatingcross subsidies by 2002 (EC, 2000g). Transgas, the state-owned gas utility, stoppedsubsidising its gas prices in the Czech market in 1999 (EIA, 2001).
Natural gas is subject to a reduced VAT rate of 5 percent (the standard rate is 22 percent).
The Act on Emergency Oil Stocks, which came into force in 1999, aims at reaching theacquis level of 90 days of oil stocks in 2005 (EC, 2000g). It is unclear how the stocks will befinanced and thus whether they are subsidised or not.
Being land-locked, the Czech Republic is not is a member of an International Oil PollutionCompensation Fund.
Nuclear energy
The controversial Temelin power plant has started operating in October 2000.
Producers of nuclear waste must bear the costs of radioactive waste management, includingdisposal. The operators of nuclear power plants pay a levy of CZK 50 (EUR 1.4) per MWeinto a fund (EC, 1999e).
Renewables
Biogas, small water and wind turbines (with an output up to 100 and 75 kVA, respectively),and solar facilities are subject to a reduced VAT rate of 5 percent (the standard rate is 22percent). Furthermore, income generated from the operation of several renewable energyproducing facilities are exempt from income tax in the first calendar year of their operationand in the following five years (Klarer et al., 1999). The amounts of implicit subsidyinvolved are unknown.
Electricity
Electricity is subject to a reduced VAT rate of 5 percent (the standard rate is 22 percent).

63
A gradual process of price liberalisation in the electricity sector is underway, aiming ateliminating (cross) subsidies by 2002 (EC, 2000g; EIA, 2001).
64
3.4 ESTONIA
Oil and gas
Estonia is a member of the 1971 International Oil Pollution Compensation Fund. This impliesa maximum compensation for oil spills of EUR 78 mln.
Nuclear energy
Although there are no nuclear power plants in Estonia, there is a substantial nuclear legacyfrom former Soviet military installations. Obviously, no subsidies for nuclear energy areinvolved in dealing with this legacy.

65
3.5 HUNGARY
Direct government subsidies to energy consumption in Hungary were terminated in 1991, butnatural gas, electricity and heat prices have remained regulated. After several years of priceincreases, prices are now nearing cost covering levels (IEA, 1999e).
Solid fuels
Some coal mines in regions with high unemployment receive government support, partlythrough direct subsidies and partly through purchase contracts from the power industry,concluded under government pressure. The direct support amounted to HUF 2.5 billion (EUR10 million) in 1998. Most of these mines were to be closed by 2000 (IEA, 1999e).
Coal use by households is exempted from VAT since 1995 (the standard VAT rate is 25percent).
In the corporation tax, an accelerated amortisation rate of 33 percent is in force for fluidisedcoal-fired equipment (Klarer et al., 1999).
Oil and gas
Gas prices are being increased stepwise (in July 2000 by 12%), contributing to theelimination of price distortions (EC, 2000i).
Since 1995, natural gas is subject to a VAT rate of 12 percent, whereas the standard rate is 25percent. Propane and propane-butane gas are also taxed at 12 percent. The use of light fuel oilby households is exempted from VAT.
Mineral oil used for the production of electricity is exempted from the excise tax.
Oil stocks in Hungary exceed the level of 90 days internal consumption, as required by theacquis (EC, 2000i), but it is unclear whether and to what extent they are being subsidised.
Land-locked Hungary is not a member of an International Oil Pollution Compensation Fund.
Nuclear energy
The work of the Hungarian Atomic Energy Authority is partly financed from the centralbudget (EC, 2000i). The amount of subsidy involved is unknown.
With the 1996 Nuclear Energy Act, nuclear operators were made liable for all damages theycaused, and indemnities were fixed in accordance with Hungary’s obligations under theVienna Convention in this respect. In order to comply with these requirements, the PaksNuclear Power Plant Company and Hungarian insurers established an insurance pool with theintention of seeking re-insurance in international pools (IEA, 1999e).
66
The costs of decommissioning and of nuclear waste disposal are covered by a CentralNuclear Financial Fund, which was set up in January 1998. It is financed through a levy onelectricity use (EC, 1999e; 2000i).
Renewables
The reduced VAT rate of 12 percent applies to solar cells, wood for heating purposes andwood briquettes. In the corporation tax, an accelerated amortisation rate of 33 percent is inforce for solar cells and for boilers burning agricultural by-products. No corporate tax has tobe paid for services connected to renewable energy carried out by public utility companies(Klarer et al., 1999).
Electricity
Electricity prices are being increased stepwise (in January 2000 by 6%), contributing to theelimination of price distortions (EC, 2000i).
Since 1995, electricity is subject to a VAT rate of 12 percent, whereas the standard rate is 25percent.

67
3.6 LATVIA
Oil and gas
Fuel oil for heat production and oil products used in technological and refining processes areexempt from the excise tax on oil products, which was introduced in 1998 (Klarer et al.,1999).
In February 2000, a strategy document on the establishment of oil stocks was adopted,confirming that energy supply companies would become responsible for the establishmentand maintenance of oil stocks (EC, 2000j). The oil stocks are thus likely to remainunsubsidised.
Latvia is a member of the 1992 International Oil Pollution Compensation Fund. This impliesa maximum compensation for oil spills of EUR 175 mln.
Nuclear energy
There are no nuclear plants in Latvia, nor are there plans to build any.
Renewables
Surplus electricity from small hydro power stations (with a capacity up to 2 MW) and windfarms has to be purchased on the national grid at higher tariffs (Klarer et al., 1999). Theamount of subsidy involved is unknown.

68
3.7 LITHUANIA
Solid fuels
Lithuania does not produce coal, and the small amounts of coal that it imports are notsubsidised.
Under the natural resource tax, peat for domestic use is taxed at LTL 1.1 per tonne, whereasthe tax for exported peat is LTL 5.1 per tonne (Klarer et al., 1999).
Oil and gas
In 1999, the Mazeikiu Oil Company (one of the largest enterprises in Lithuania) was sold to aprivate foreign investor. The deal involved a large public cost (the government promised tocover USD 350 mln of capital deficit), leading to the fall of the government. Furthermore, inOctober 2000 the Constitutional Court ruled that the promise by the government to cover thedebt was illegal (EC, 2000k; EIA, 2001).
On 27 June 2001, Lithuania will become a member of the 1992 International Oil PollutionCompensation Fund. This implies a maximum compensation for oil spills of EUR 175 mln.
Nuclear energy
The Ignalina nuclear power plant (the world’s largest) will be decommissioned, starting withUnit 1 in 2005. A Decommissioning Support Fund (of about EUR 195 million, mainly frominternational financing sources) was established in June 2000 and is managed by the EBRD.Unit 2 is subject to a EUR 10 mln modernisation project, guaranteed by the government (EC,2000k).
A new fund for radioactive waste management will be partly financed by the state budget(EC, 1999e).

69
3.8 MALTA
Solid fuels
There is no market for solid fuels in Malta.
Oil and gas
Malta does not yet have legislation on minimum oil stocks compatible with the acquis (EC,2000l). It can be assumed that subsidies for such stocks are also absent.
There is no market for natural gas in Malta.
Malta is a member of the 1992 International Oil Pollution Compensation Fund. This implies amaximum compensation for oil spills of EUR 175 mln.
Nuclear energy
Malta has no nuclear power plants.
70
3.9 POLAND
Solid fuels
The Polish coal mining industry has huge debts (over EUR 5 billion) and is currently in aprocess of restructuring. In total, 30 of Poland’s 53 mines will be closed by the end of therestructuring programme. Government assistance to the industry led the United Kingdom tocharge Poland with "dumping" its coal on world markets in violation of World TradeOrganization rules, but the British coal producers withdrew their complaint in 2000. InFebruary 2000, the average price of one tonne of coal was for the first time above productioncosts (EC, 2000m; EIA, 2001).
Oil and gas
Oil stocks in Poland fall considerably short of the acquis requirement of 90 days of nationalconsumption. A schedule of increasing oil security stocks that meet EC requirements hasbeen developed (EC, 2000m). Information on the financing of these stocks is lacking, so it isunclear whether subsidies are involved.
Poland is a member of the 1992 International Oil Pollution Compensation Fund. This impliesa maximum compensation for oil spills of EUR 175 mln.
Nuclear energy
Poland has no nuclear power plants and does not intend to build any.
Renewables
Income tax allowances are extended to farmers who invest in renewable energy sources(Klarer et al., 1999). The amount of subsidy involved is unknown.
71
3.10 ROMANIA
State subsidies on goods and services (including those for the mining industry) were expectedto be totally eliminated by the year 2000 (Klarer et al., 1999).
Solid fuels
In recent years, after years of subsidising the coal mining industry, the government has beenshutting down unprofitable state-owned companies (EIA, 2001).
Household use of coal is exempted from VAT (Klarer et al., 1999). The current standardVAT rate is 19%.
Oil and gas
Household use of oil and gas is exempted from VAT (Klarer et al., 1999). The current VATrate is 19%.
Furthermore, fuels used for household consumption are exempted from the excise tax onmineral oil products.
Cross subsidies between industrial and domestic use of gas have been completely removed(EC, 2000n).
Romania is not a member of an International Oil Pollution Compensation Fund.
Nuclear energy
Romania’s only nuclear power plant, at Cernavoda, has started operations in 1996 with theactivation of the first reactor. The second reactor is 40% complete, but financing remains aproblem. In an effort to complete work on the reactor, the Romanian government has grantedthe plant profit tax-exempt status until 2010 and has suspended its debts to the FinanceMinistry until the plant is commissioned at the end of 2006. Investments and credits areexpected from foreign investors and from Euratom (EIA, 2001).
A law for the establishment of a fund for the management of radioactive waste anddecommissioning has been drafted (EC, 1999e).
ElectricityHousehold use of electricity is exempted from VAT (Klarer et al., 1999). The current VATrate is 19%.
Cross subsidies between industrial and domestic use of electricity have been completelyremoved (EC, 2000n).

72
3.11 SLOVAKIA
Solid fuels
From 1990 to 1996, state support for the lignite mining sector declined from EUR 54 millionto EUR 4.3 million. Indirect subsidies, by way of obligatory lignite purchases by powerplants, were estimated to amount to EUR 14 million in 1996 (IEA, 1997c).
Klarer et al. (1999) state that the use of solid fuel is still subsidised in Slovakia, but do notgive any details.
Oil and gas
In February 2000 the Slovak government approved an increase of gas prices. This measurewas taken in the context of an overall policy to ensure cost recovery by energy producers(EC, 2000o). Cross-subsidies (especially from industry households) were considerable in the1990s. There was also evidence that gas prices for domestic customers (industry, householdsand other groups) were subsidised by the highly profitable transit business (IEA, 1997c).
Land-locked Slovakia is not a member of an International Oil Pollution Compensation Fund.
Nuclear energy
Production costs of electricity from Slovak nuclear power plants are lower than in WesternEurope, due to, among others, asset values that are based on low historic costs (IEA, 1997c).
A fund for the decommissioning of nuclear power stations and the management ofradioactive waste is funded by a 10 percent surcharge on the sales price of electricitygenerated by nuclear power plants. It is estimated that this fund will yield some SKK 30.8billion (EUR 723 million) by 2010. According to the government this sum will be sufficient(Klarer et al., 1999). If that is correct, nuclear energy is not being subsidised in Slovakia byway of insufficient decommissioning and waste management cost coverage.
In April 2000, the government made clear that no state guarantees or any form of state aidwill be provided for the completion and operation of units 3 and 4 at the Mochovce nuclearpower plant (EC, 2000o).
Renewables
Biogas, fire wood and wood chips are subject to the reduced VAT rate of 6 percent (thenormal rate is 23 percent). Operations of small hydropower plants, wind electricitygeneration, solar equipment, biogas generating equipment and geothermal productionfacilities are excluded from income tax for the first five years of operation (Klarer et al.,1999).
73
Domestically produced ‘ecological fuel’ is subject to a preferential excise duty rate (EC,2000o).
Electricity
In February 2000 the Slovak government approved an increase of electricity prices (anaverage of 40% for households and 5% for businesses). As with gas prices, this measure wastaken in the context of an overall policy to ensure cost recovery by energy producers (EC,2000o). There used to be considerable cross-subsidisation, especially from industry tohouseholds (IEA, 1997c).
74
3.12 SLOVENIA
Solid fuels
Direct budget subsidies for the coal industry were expected to end in 1996 (IEA, 1996b).Nevertheless, state aid to the coal mining sector has grown in recent years, although in 1999such aid was solely devoted to the closing down of mines and entailed no operating aid (EC,2000p).
Until 2004, coal for electricity generation will be exempted from the CO2 tax, which wasintroduced in 1997. The rate of the tax is SIT 1.00 per kg CO2 (Klarer et al., 1999).
Oil and gas
A recent decree foresees the collection of a special fee on petroleum products aimed atfinancing the creation of obligatory oil stocks (EC, 2000p). This would mean that nosubsidies will be involved.
Slovenia produces small amounts of oil (2,000 toe per year), which remain untaxed (IEA,1996b).
Slovenia is currently a member of the 1971 International Oil Pollution Compensation Fund,but will move to the 1992 Fund on 19 July 2001. This implies an increase of the maximumcompensation for oil spills from EUR 78 mln to EUR 175 mln.
Nuclear energy
The Krško nuclear power plant (which is owned jointly by Slovenia and Croatia) has to pay alevy of SIT 0.61 for every kWh of electricity that it supplies to the Slovenian or Croatianpower grid. The recipient of this charge is a fund which is to finance the decommissioning ofthe plant and the disposal of nuclear waste (Klarer et al., 1999). To what extent this fundingwill be sufficient is unclear. Therefore it is not possible to judge whether and to what extentnuclear energy is being subsidised in Slovenia by way of insufficient decommissioning andwaste management cost coverage.
Renewables
From 1990 to 1995, the Slovenian government has provided interest subsidies and grants forrenewable energy totalling EUR 8.1 million for 211 projects, mostly small hydro plants (IEA,1996b).

75
3.13 TURKEY
Solid fuels
Subsidies to coal production in Turkey amounted to EUR 267 mln in 1995, according to thePSE estimate by the IEA (IEA, 1997a).
In the period 1996-1998, the Turkish government increased its budget for coal related R&Dfrom EUR 0.1 mln to EUR 7.1 mln (IEA, 1999f).
Oil and gas
Natural gas is subject to a VAT rate of 8%, while the standard rate is 15%.
To ensure the penetration of natural gas into the market, natural gas prices are mostly setbelow the level of competing fuels. In some sectors such as residential, the price of naturalgas is too low to reflect the full cost of supply (IEA, 1997a).
Oil stocks amounted to 87-90 days of consumption in 1998. The Directorate General forPetroleum Affairs is responsible for monitoring and controlling these stocks (EC, 2000q). Itis unknown whether and to what extent subsidies are involved.
To enhance domestic oil exploration and production, the government was planning (in 1997)to adapt the royalty taxes, which amounted to 12.5% of production in 1996. The new royaltyshould decrease proportionally with the production and should be lower for smaller fields(IEA, 1997a).
Turkey is not a member of an International Oil Pollution Compensation Fund.
Nuclear energy
There are currently no nuclear power plants in Turkey, and plans to build one have beenabandoned in July 2000.
In 1997, the budget of the Turkish Atomic Energy Authority (in charge of nuclear R&D,regulatory issues and control of all nuclear activities) was TRL 1,600 billion (EUR 2.9million) (IEA, 1997a).
Renewables
The Ministry of Environment promotes the development of geothermal heat and otherenvironmentally-friendly investments via low-interest loans on up to 45% of the capital cost.
Independent electricity producers, including those using renewable energy sources, are givena power purchase guarantee by the Turkish Electricity Generation and TransmissionCorporation.

76
Total expenditure of renewable energy R&D for 1996 was reported to the IEA as EUR 0.15mln (IEA, 1998a).
Electricity
The selling prices of electricity are too low for the power suppliers to be able to make thenecessary investments (IEA, 1997a).

77
4. CONCLUSIONS
Lacking an internationally agreed definition of the term ‘subsidy’, identifying andquantifying energy subsidies is a delicate operation. A study like this one has to draw certaindemarcation lines and unavoidably arbitrary choices have to be made when deciding to labelcertain arrangements as energy subsidies or not. The problem is that the outcome, especiallyin quantitative terms, is very dependent upon such choices.
Having said this, it can be concluded that energy subsidies in the European Union and theaccession countries are numerous and involve substantial amounts of money. For the EU andits Member States, Table 4.1 indicates the estimated amounts of money transfers and taxreliefs that are benefiting the different types of energy, to the extent that they could bequantified. It can be concluded that the total amount of quantifiable subsidy (in terms ofmoney transfers and tax reliefs) going to renewable energy is substantially lower than theamount of subsidy to fossil fuels, and in the same order of magnitude as nuclear energysubsidies.
A major part of the identified subsidies relates to tax exemptions and reductions. There aretwo major groups: those which have been introduced for social reasons (usually reducedVAT rates for households) and those intended to protect industry against the loss ofinternational competitiveness. The latter are often accompanying the introduction of specificenergy and/or CO2 taxes. Renewable energy is subsidised directly as well as by means ofvarious fiscal arrangements. R&D subsidies play a particularly important role in the case ofnuclear energy.
Direct subsidies to coal production are declining throughout Europe, although the Germancoal subsidies remain one of the largest single subsidy items. The subsidies to oil, gas andelectricity tend to increase as more countries are introducing energy tax schemes withprovisions for exemptions and reductions. Support for renewables is also increasing, whereassubsidies to nuclear energy do not show a clear trend.
In the accession countries, especially the former centrally planned economies, subsidies aregenerally decreasing. In particular, cross subsidies from industry to households are graduallybeing phased out.
In addition to these direct and indirect subsidies, there are three important factors favouringcertain types of energy over others. Firstly, energy producers and users often do not pay forthe (full) external costs and damage (such as pollution, accidents and risks). In some cases(oil spills, nuclear accidents), international conventions provide for limited liability of theperpetrators. Secondly, ‘traditional’ energy continues to benefit from support that it hasreceived in the past, e.g. in the form of below-commercial rates of return on investments.Finally, legal arrangements provide for preferential treatment of specific types of energy(especially renewables). Although these kinds of support are much harder to translate intomoney terms, some attempts to do so have been made in Sections 1.2 through 1.4. Acomparison with the amounts involved in money transfers and tax reliefs is given in Table4.2. This shows that the bias in favour of ‘traditional’ sources of energy is even stronger ifthese factors are taken into account.
A more precise and reliable estimate of the bias against renewable energy might be achievedby means of a study to answer the question: “If energy producers and users were fully liablefor the damage and risks caused by their activities, and if this liability had to be (and couldbe) covered by insurance, how much would the insurance premium be?”.

78
Table 4.1. Amounts of energy subsidies in EU and Member States (millions of Euros peryear) (money transfers and tax reliefs)
solid fuels oil and gas nuclear renewablesEU 60 260 380 180Austria > 15 > 95 2 > 150Belgium 8 1 > 40 5Denmark 600 1,000 2 > 180Finland > 25 30 45 240France 500 > 30 > 600 > 300Germany 9,500 1,000 > 700 > 300Greece > 1 > 250 < 1 > 35Ireland 40 > 50 - > 10Italy > 75 > 1,500 100 > 300Luxembourg - > 7 - > 10The Netherlands > 250 > 4,500 65 > 250Portugal 40 45 < 1 70Spain 765 > 5 150 > 50Sweden 70 180 90 > 130United Kingdom 650 > 1,900 450 250EU + Member States > 12,000 > 10,000 > 2,600 > 2,400
Note: Subsidies for electricity have been attributed to primary energy sources using shares inelectricity production as weights.
Table 4.2. Tentative estimates of subsidies and other kinds of support in the EU (mlnEUR per year)
fossil fuels nuclear renewablesmoney transfers and tax reliefs > 22,000 > 2,600 > 2,400uninternalised external costs ± 50,000 > 700 – > 20,000 ± 600inheritance of past subsidies PM ± 8,500 PMpreferential treatment ± 1,000total > 70,000 > 10,000 > 4,000

79
REFERENCES
Barra, L., et al. (1999), Italian White Paper for the Valorisation of Renewable EnergySources. ENEA,Rome.
Bonduelle, A., F. Tuille, and S. Fenet (1998), Soutiens et subventions de l’état aux énergiesen France. Institut d’Evaluation des Stratégies sur l’Energie et l’Environnement en Europe(INESTENE), Paris, December 1998.
BMLFUW (2000), information from website: http://www.bmu.gv.at. Bundesministerium fürLand- und Forstwirtschaft, Umwelt und Wasserwirtschaft, Wien.
Bundesfinanzministerium (2000a), untitled document.http://www.bundesfinanzministerium.de/finwiber/berichte/umwelt.pdf
Bundesfinanzministerium (2000b), Die Förderung des Umweltschutzes im deutschenAbgabenrecht – einschließlich der ökologischen Steuerreform. Berlin.
Bundesministerium für Finanzen (2000), information from website: http://www.bmf.gv.at.Vienna.
CBS (2000a), information from website: www.cbs.nl. Centraal Bureau voor de Statistiek,Voorburg/Heerlen.
CBS (2000b), Energiemonitor. Centraal Bureau voor de Statistiek, Voorburg/Heerlen.
CNT (2001), information from website: www.hhh.umn.edu/centers/cnt. Center for Nations inTransition, University of Minnesota.
De Moor, A., and P. Calamai. Subsidizing Unsustainable Development. Undermining theEarth with public funds. The Earth Council, San José, Costa Rica.
Dreicer, M., V. Tort, and P. Manen (1994), Nuclear Fuel Cycle. Estimation of PhysicalImpacts and Monetary Valuation for Priority Impact Pathways. ‘ExternE’ Project Report nr.3. Brussels.
ECJ (2000), Le Tribunal délimite les possibilités d’instaurer des régimes de défiscalisationen faveur des biocarburants. European Court of Justice, Press release no 69/2000, 27September 2000. Luxembourg.
EDF (1999), Rapport annuel 1998. Electricité de France, Paris.
EIA (2001), information from website: http://www.eia.doe.gov. Energy InformationAdministration, Washington DC.
ENDS (1998a), Danish firms get subsidies to go solar. ENDS Daily, 30 January 1998.
ENDS (1998b), Jospin maintains French nuclear waste options. ENDS Daily, 5 February1998.
ENDS (1998c), Dutch green power subsidy gets EU approval. ENDS Daily, 8 May 1998.
ENDS (1999a), German renewables funding fixed for 1999. ENDS Daily, 27 April 1999.
80
ENDS (1999b), Germany plans more alternative energy support. ENDS Daily, 19 August1999.
ENDS (1999c), Germany aims to give renewables a tail wind. ENDS Daily, 17 December1999.
ENDS (2000a), Italian carbon tax revenue spending approved. ENDS Daily, 9 November2000.
Energistyrelsen (1999), Wind Power in Denmark. Technology, Policies and Results.Copenhagen, September 1999.
Energistyrelsen (2000a), Green Taxes for Trade and Industry – description and evaluation.Copenhagen, June 2000.
Energistyrelsen (2000b), VE-Tilskudsstatistik.http://www.energioplysningen.dk/statistik/ve.htm#oversigt
Energistyrelsen (2000c), Produktion og forbrug af el.http://www.ens.dk/statistik/99_detal/tab2_konvert.htm
ERM (1999), An Evaluation of Phare-financed Energy and Environment Programmes.Inventory Report. Environment Resources Management, September 1999.
European Commission (EC) (1997), Tax provisions with a potential impact on theenvironment. Luxembourg.
European Commission (EC) (1998a), 9th Annual Report of the Structural Funds (1997).Brussels.
European Commission (EC) (1998b), COM(1998)391 final.
European Commission (EC) (1999a), 1999 Annual Energy Review. Brussels.
European Commission (EC) (1999b), Excise Duty Tables. Directorate General Taxation andCustoms Union, Brussels, July 1999.
European Commission (EC) (1999c), Energy for the Future: Renewable Sources of Energy(Community Strategy and Action Plan). Campaign for Take-Off. Directorate General XVII,Brussels.
European Commission (EC) (1999d), Fourth Report from the Commission on the PresentSituation and Prospects for Radioactive Waste Management in the European Union. COM(1998) 799 final, 11.01.1999. Brussels.
European Commission (EC) (1999e), Radioactive Waste Management in the Central andEastern European Countries. DG Environment, Nuclear Safety and Civil Protection,Brussels, July 1999.
European Commission (EC) (1999f), ExternE, Externalities of Energy. Vol. 7: Methodology1998 Update. Luxembourg.
81
European Commission (EC) (1999g), ExternE, Externalities of Energy. Vol. 10: NationalImplementation. Luxembourg.
European Commission (EC) (2000a), Eighth Survey on State Aid in the European Union.COM(2000)205 final. Brussels, 11.4.2000.
European Commission (EC) (2000b), Database on environmental taxes in the EuropeanUnion Member States, plus Norway and Switzerland.http://europa.eu.int/comm/environment/enveco/env_database/database.htm
European Commission (2000c), VAT rates applied in the Member States of the EuropeanCommunity. Situation at 1st May 2000. Directorate-General Taxation and Customs Union.DOC/2206/2000-EN. Brussels.
European Commission (2000d), Commission authorises an aid scheme for renewable energyin France. Press release IP/00/1447, Brussels, 13 December 2000.
European Commission (2000e), 2000 Regular Report from the Commission on Bulgaria’sProgress towards Accession. Brussels, 8 November 2000.
European Commission (2000f), 2000 Regular Report from the Commission on Cyprus’sProgress towards Accession. Brussels, 8 November 2000.
European Commission (2000g), 2000 Regular Report from the Commission on the CzechRepublic’s Progress towards Accession. Brussels, 8 November 2000.
European Commission (2000h), 2000 Regular Report from the Commission on Estonia’sProgress towards Accession. Brussels, 8 November 2000.
European Commission (2000i), 2000 Regular Report from the Commission on Hungary’sProgress towards Accession. Brussels, 8 November 2000.
European Commission (2000j), 2000 Regular Report from the Commission on Latvia’sProgress towards Accession. Brussels, 8 November 2000.
European Commission (2000k), 2000 Regular Report from the Commission on Lithuania’sProgress towards Accession. Brussels, 8 November 2000.
European Commission (2000l), 2000 Regular Report from the Commission on Malta’sProgress towards Accession. Brussels, 8 November 2000.
European Commission (2000m), 2000 Regular Report from the Commission on Poland’sProgress towards Accession. Brussels, 8 November 2000.
European Commission (2000n), 2000 Regular Report from the Commission on Romania’sProgress towards Accession. Brussels, 8 November 2000.
European Commission (2000o), 2000 Regular Report from the Commission on Slovakia’sProgress towards Accession. Brussels, 8 November 2000.
European Commission (2000p), 2000 Regular Report from the Commission on Slovenia’sProgress towards Accession. Brussels, 8 November 2000.

82
European Commission (2000q), 2000 Regular Report from the Commission on Turkey’sProgress towards Accession. Brussels, 8 November 2000.
European Commission (2000r), Green Paper: Towards a European strategy for the securityof energy supply. Brussels.
European Commission (2000s), Phare Annual Report 1998. Brussels.
European Commission (EC) (2000t), 11th Annual Report of the Structural Funds (1999).Brussels.
European Commission (2000u), Commission support to nuclear safety in the NewlyIndependent States and Central and Eastern Europe. COM(2000) 493 final, Brussels.
European Commission (2000v), Proposal for a Directive of the European Parliament and ofthe Council on the promotion of electricity from renewable energy sources in the internalenergy market. COM(2000)279 final, Brussels, 10.5.2000.
European Commission (2001), information from website: http://inforegio.cec.eu.int/erdf
Eurostat (2000a), Energy: Yearly statistics 1998. Luxembourg.
Eurostat (2000b), Structures of the taxation systems in the European Union 1990-1997.Luxembourg.
Federaal Planbureau (1999), Federaal Rapport – Duurzame ontwikkeling – Op weg naarduurzame ontwikkeling? Brussels.
Federal Government of Belgium (2000), Federaal Plan inzake Duurzame Ontwikkeling2000-2004. Brussels.
Finansministeriet (2001), information from website: www.fm.dk.
Government of Greece (1997), Second National Communication of Greece to the UnitedNations Framework Convention on Climate Change. Athens.
Greenpeace (1997), Energy Subsidies in Europe. How governments use taxpayers’ money topromote climate change and nuclear risk. Greenpeace International Climate Campaign,Amsterdam.
IEA (1996a), Energy Policies of IEA Countries. Spain 1996 Review. OECD, Paris.
IEA (1996b), Energy Policies of Slovenia. OECD, Paris.
IEA (1997a), Energy Policies of IEA Countries. Turkey 1997 Review. OECD, Paris.
IEA (1997b), Energy Policies of IEA Countries. Belgium 1997 Review. OECD, Paris.
IEA (1997c), Energy Policies of Slovakia. OECD, Paris.
IEA (1998a), Renewable Energy Policy in IEA Countries. Volume II: Country Reports.OECD, Paris.
IEA (1998b), Energy Policies of IEA Countries. Austria 1998 Review. OECD, Paris.
83
IEA (1998c), Energy Policies of IEA Countries. Denmark 1998 Review. OECD, Paris.
IEA (1998d), Energy Policies of IEA Countries. Germany 1998 Review. OECD, Paris.
IEA (1998e), Energy Policies of IEA Countries. Greece 1998 Review. OECD, Paris.
IEA (1998f), Energy Policies of IEA Countries. United Kingdom 1998 Review. OECD, Paris.
IEA (1999a), Energy Policies of IEA Countries. Italy 1999 Review. OECD, Paris.
IEA (1999b), Energy Policies of IEA Countries. Finland 1999 Review. OECD, Paris.
IEA (1999c), Energy Policies of IEA Countries. Ireland 1999 Review. OECD, Paris.
IEA (1999d), Energy Prices and Taxes, 1st Quarter 1999. OECD, Paris.
IEA (1999e), Energy Policies of IEA Countries. Hungary 1999 Review. OECD, Paris.
IEA (1999f), Energy Policies of IEA Countries 1999. OECD, Paris.
IEA (2000a), Coal Information (2000 Edition). OECD, Paris.
IEA (2000b), Natural Gas Information (2000 Edition). OECD, Paris.
IEA (2000c), Energy Policies of IEA Countries. Portugal 2000 Review. OECD, Paris.
IEA (2000d), Energy Policies of IEA Countries. France 2000 Review. OECD, Paris.
IEA (2000e), Energy Policies of IEA Countries. Sweden 2000 Review. OECD, Paris.
IEA (2000f), Energy Policies of IEA Countries. Netherlands 2000 Review. OECD, Paris.
IEA (2000g), CO2 emissions from fuel combustion, 1971-1998. OECD, Paris.
IOPC Funds (2001), information from website: www.iopcfund.org. The International OilPollution Compensation Funds, London.
Klarer, J., J. McNicholas, and E.-M. Knaus (eds., 1999), Sourcebook on EconomicInstruments for Environmental Policy. Central and Eastern Europe. Sofia Initiative onEconomic Instruments, Regional Environmental Center for Central and Eastern Europe,Szentendre, Hungary, April 1999.
Michaelis, L. (1997), Electricity-Related Supports in the United Kingdom. In: OECD (1997),pp. 129-136.
MICyT (1990(?)), National Energy Plan 1991-2000. Ministry of Industry, Trade an Tourism,Secretary General of Energy and Mineral Resources, Madrid.
Ministerie van Economische Zaken (1999), Duurzame energie in opmars -voortgangsrapportage 1999. The Hague.
Ministerie van Financiën (2000a), Miljoenennota 2001. The Hague.
84
Ministerie van Financiën (2000b), information from website: www.minfin.nl
Ministerie van VROM (2000), Milieuprogramma 2001-2004. The Hague.
Ministry of Industry, Trade and Tourism (1991), National Energy Plan 1991-2000. Madrid.
Myers, N., and J. Kent (1998), Perverse Subsidies. Tax $s Undercutting Our Economies andEnvironments Alike. International Institute for Sustainable Development, Winnipeg.
National Tax Board (2000), Excise duties. Stockholm.
Novem (2001), information from website: www.novem.org/biofinance
OECD (1997), Reforming Energy and Transport Subsidies. Environmental and EconomicImplications. Organisation for Economic Co-operation and Development, Paris.
OECD (1999a), Environmental Performance Reviews: Denmark. Organisation for EconomicCo-operation and Development, Paris.
OECD (1999b), Improving the Environment through Reducing Subsidies. Organisation forEconomic Co-operation and Development, Paris.
OECD (1999c), Consumption Tax Trends. 1999 Edition. Organisation for Economic Co-operation and Development, Paris.
Roodman, D.M. (1996), Paying the Piper: Subsidies, Politics, and the Environment.Worldwatch Paper 133. Worldwatch Institute, Washington DC.
Senter (2000), information from website: www.senter.nl
Statistik Österreich (2000), Statistisches Jahrbuch 1999-2000. Vienna.
Subventionsbericht (1999), Bericht der Bundesregierung über die Entwicklung derFinanzhilfen des Bundes und der Steuervergünstigungen gemäß § 12 des Gesetzes zurFörderung der Stabilität und des Wachstums der Wirtschaft (StWG) vom 8. Juni 1967 für dieJahre 1997 bis 2000 (17. Subventionsbericht). Deutscher Bundestag, Drucksache 14/1500, 13August 1999.
Tosato, G. (1997), Environmental Implications of Supports to the Electricity Sector in Italy.In: OECD (1997), pp. 115-123.
Umweltministerium (2000), Förderung von Massnahmen zur rationellen Nutzung derEnergie und zur Nutzung erneuerbarer Energien. Luxembourg. http://www.mev.etat.lu/

85
APPENDIX: ABBREVIATIONS
ADEME Agence de l’Environnement et de la Maîtrise de l’EnergieATS Austrian SchillingBEF Belgian Franc/FrankCEA Commissariat à l’énergie atomiqueCHP combined heat and powerCO2 carbon dioxideDEM German MarkDKK Danish KroneEC European CommunityEDF Electricité de FranceERDF European Regional Development FundETBE ethyl tertiary butyl etherESP Spanish PesetaEU European UnionEUR EuroFACE Fonds d’Amortissement des Charges d’ElectrificationFIM Finnish MarkkaFRF French FrancGBP British PoundGJ GigaJoule (109 Joule)GRD Greek DrachmeGW Gigawatt (106 kilowatt)GWh Gigawatt hourIEA International Energy AgencyIEP Irish PoundIOPC Funds International Oil Pollution Compensation FundsITL Italian LirakW kilowattkWh kilowatt hourMtoe megatonne oil equivalentMW Megawatt (1000 kW)MWh Megawatt hourNFFO Non Fossil Fuel ObligationNLG Dutch GuldenPJ Petajoule (1015 Joule)PSE producer subsidy equivalentPTE Portuguese EscudoPV photo-voltaic (electricity from sunlight)R&D Research and DevelopmentRME rapeseed methyl esterSDR Special Drawing RightSEK Swedish KroneTJ Terajoule (1012 Joule)toe tonne oil equivalentTW Terawatt (109 kW)TWh Terawatt hourVAT value added tax