Energy Subsidies in Bangladesh: A profile of groups ... Subsidies in Bangladesh: ... Energy...
33
www.iisd.org/gsi © 2013 The International Institute for Sustainable Development Energy Subsidies in Bangladesh: A profile of groups vulnerable to reform Mustafa K. Mujeri Tahreen Tahrima Chowdhury Siban Shahana Bangladesh Institute of Development Studies August 2013
-
Upload
nguyenlien -
Category
Documents
-
view
246 -
download
1
Transcript of Energy Subsidies in Bangladesh: A profile of groups ... Subsidies in Bangladesh: ... Energy...

www.iisd.org/gsi © 2013 The International Institute for Sustainable Development
Energy Subsidies in Bangladesh: A profile of groups vulnerable to reformMustafa K. Mujeri Tahreen Tahrima Chowdhury Siban Shahana Bangladesh Institute of Development Studies August 2013

© 2013 The International Institute for Sustainable DevelopmentRESEARCH REPORT AUGUST 2013Energy Subsidies in Bangladesh: A profile of groups vulnerable to reform iiii
© 2013 The International Institute for Sustainable DevelopmentPublished by the International Institute for Sustainable Development.
About IISDThe International Institute for Sustainable Development (IISD) contributes to sustainable development by advancing policy recommendations on international trade and investment, economic policy, climate change and energy, and management of natural and social capital, as well as the enabling role of communication technologies in these areas. We report on international negotiations and disseminate knowledge gained through collaborative projects, resulting in more rigorous research, capacity building in developing countries, better networks spanning the North and the South, and better global connections among researchers, practitioners, citizens and policy-makers.
IISD’s vision is better living for all—sustainably; its mission is to champion innovation, enabling societies to live sustainably. IISD is registered as a charitable organization in Canada and has 501(c)(3) status in the United States. IISD receives core operating support from the Government of Canada, provided through the International Development Research Centre (IDRC), from the Danish Ministry of Foreign Affairs and from the Province of Manitoba. The Institute receives project funding from numerous governments inside and outside Canada, United Nations agencies, foundations and the private sector.
Head Office161 Portage Avenue East, 6th Floor, Winnipeg, Manitoba, Canada R3B 0Y4 Tel: +1 (204) 958-7700 | Fax: +1 (204) 958-7710 | Website: www.iisd.org
About GSIGSI is an initiative of the International Institute for Sustainable Development (IISD). GSI is headquartered in Geneva, Switzerland and works with partners located around the world. Its principal funders have included the governments of Denmark, the Netherlands, New Zealand, Norway, Sweden and the United Kingdom. The William and Flora Hewlett Foundation have also contributed to funding GSI research and communications activities.
International Institute for Sustainable DevelopmentGlobal Subsidies InitiativeInternational Environment House 2, 9 chemin de Balexert, 1219 Châtelaine, Geneva, SwitzerlandTel: +41 22 917-8373 | Fax: +41 22 917-8054
Energy Subsidies in Bangladesh: A profile of groups vulnerable to reform August 2013
Mustafa K. Mujeri Tahreen Tahrima Chowdhury Siban Shahana
Bangladesh Institute of Development Studies

© 2013 The International Institute for Sustainable DevelopmentRESEARCH REPORT AUGUST 2013Energy Subsidies in Bangladesh: A profile of groups vulnerable to reform iii
Table of Contents1.0 Introduction .................................................................................................................................................................................................1
1.1 Objectives of the Study ....................................................................................................................................................................1
1.2 Data and Methodology ...................................................................................................................................................................1
2.0 Estimates of Energy Subsidies in Bangladesh ................................................................................................................................3
2.1 Total Subsidies in Bangladesh .....................................................................................................................................................3
2.2 Energy Subsidies in Bangladesh ................................................................................................................................................4
2.2.1 Crude Oil and Petroleum Products ................................................................................................................................5
2.2.2 Electricity .............................................................................................................................................................................. 11
2.2.2.1 Estimates of Electricity Subsidies ................................................................................................................... 15
2.2.3 Natural Gas ......................................................................................................................................................................... 17
3.0 A Profile of Population Groups and Production Sectors Most Vulnerable to Subsidy Reforms ............................... 19
3.1 The Energy Consumption Intensity of Occupational Groups.......................................................................................... 19
3.2 Energy Intensity of Production Sectors ..................................................................................................................................22
4.0 Concluding Remarks .............................................................................................................................................................................25
References .........................................................................................................................................................................................................27

© 2013 The International Institute for Sustainable DevelopmentRESEARCH REPORT AUGUST 2013Energy Subsidies in Bangladesh: A profile of groups vulnerable to reform iv
AcknowledgementsThis report is the joint effort of the Bangladesh Institute of Development Studies (BIDS) and the Global Subsidies Initiative of the International Institute for Sustainable Development.
The authors would like to offer special thanks to Masami Kojima of the World Bank and Peter Wooders of IISD for peer reviewing the report and providing valuable feedback. Any mistakes or omissions relating to the report are the responsibility of the authors.
This work could not have been undertaken without the generous support of the governments of Sweden, Denmark and Norway. The views expressed in this study do not necessarily reflect those of the GSI’s funders, nor should they be attributed to them.

© 2013 The International Institute for Sustainable DevelopmentRESEARCH REPORT AUGUST 2013Energy Subsidies in Bangladesh: A profile of groups vulnerable to reform 1
1.0 IntroductionBangladesh’s average per capita consumption is 160 kilograms of oil equivalent (kgoe), as compared to 530 kgoe in India, 340 kgoe in Nepal and 640 kgoe in Asia as a whole (Planning Commission, 2011). However, Bangladesh faces a serious crisis due to an inadequate supply of energy resources. Due to poor pricing policies, state-owned energy enterprises have maintained deficits and have been unable to attract the private investment required. This lack of investment is a major ongoing contributing factor to the energy crisis.
Fossil fuels and power are vital for economic growth and a key ingredient to improving the socioeconomic condition of the population and reducing poverty. In Bangladesh, electricity is one of the most widely used forms of energy. However, since Independence more than 40 years ago, the country has had trouble generating adequate electricity for national demand. As a result, consumers still do not have access to an uninterrupted, quality supply.
The present government has committed to energy security and to providing access to affordable and reliable electricity for all citizens by 2021. This commitment aims to accelerate growth and development and raise the welfare of the country’s population (Planning Commission, 2012, p. 55). At present, only about half of the population has access to electricity, although the supply is not reliable even to them.
The government has adopted a comprehensive energy development strategy for exploring supply-side options along with demand management that conserves energy and discourages its inefficient use. The thrust of the government’s policy is to treat electricity as a private good such that its price reflects the cost of production and a fair return is generated on the electricity investment. The policy maintains that “social objectives like reaching out to the poor and rural community could be achieved through cross-subsidization as well as explicit budget subsidies” (Planning Commission, 2011, p. 129). As such, a key policy reform for the government is to ensure proper pricing of electricity and power based on international best practices.
1.1 Objectives of the StudyThis study aims to: (i) develop transparent estimates of fossil-fuel subsidies for financial years (FY) 2010, 2011 and 2012; (ii) undertake a mapping exercise to identify key stakeholders (population groups and production sectors) likely to be affected by subsidy reform for each fuel type and electricity; and (iii) based on the summary analysis, identify vulnerable groups for further analysis. The present study provides the initial inputs for developing a framework for assessing the economic impacts of fossil-fuel subsidies and their reform at both macro and micro levels and identifying options for supporting low-income households and vulnerable groups.
1.2 Data and MethodologyThe study mainly involves descriptive analyses based on available secondary data provided by the Government of Bangladesh about energy-sector subsidies in Bangladesh. The direct and indirect impacts of subsidies are identified across different income groups and sectors based on qualitative analyses using the 2010 Household Income and Expenditure Survey (HIES) and other relevant data. The latest Input-Output Table of the Bangladesh economy for 2006–2007 was used to analyze the backward and forward linkages of the energy sector. The study also undertook key informant interviews with stakeholders, government officials and civil societies to capture concerns and plausible outcomes relating to subsidy reforms in Bangladesh.

© 2013 The International Institute for Sustainable DevelopmentRESEARCH REPORT AUGUST 2013Energy Subsidies in Bangladesh: A profile of groups vulnerable to reform 2
The relevant data and information were collected from different ministries and agencies, including the Bangladesh Bureau of Statistics and the Ministries of Finance, Planning, and Energy and Power. For a better understanding of the figures expressed in Bangladesh Taka (BDT), the local currency unit, the average nominal exchange rate between the Taka and the U.S. dollar in recent years is given in Table 1.
TABLE 1: AVERAGE NOMINAL EXCHANGE RATE BETWEEN THE BANGLADESH TAKA AND U.S. DOLLAR
FISCAL YEAR FY2007 FY2008 FY2009 FY2010 FY2011 FY2012
Taka per U.S. dollar 69.03 68.60 68.80 69.18 71.17 77.72
Source: MoF (2012)

© 2013 The International Institute for Sustainable DevelopmentRESEARCH REPORT AUGUST 2013Energy Subsidies in Bangladesh: A profile of groups vulnerable to reform 3
2.0 Estimates of Energy Subsidies in BangladeshThis section provides estimates of energy subsidies in Bangladesh for the last three fiscal years—2009–2010, 2010–2011 and 2011–2012 (referred to as FY2010, FY2011 and FY2012, respectively).1 The term “energy” is used to cover all commercial sources (e.g., electricity), petroleum products (e.g., octane,2 diesel, kerosene, furnace oil and other products) and natural gas, that the government subsidizes.
Following the internationally accepted definition of “subsidy,” one can identify two major types of subsidies that are provided by the government: subsidies designed to reduce the cost of consuming energy and subsidies aimed at supporting domestic production (Ellis, 2010). Similarly, subsidies in the energy sector may encompass various forms, such as direct financial transfers; retail prices set at below-market prices; providing credit at below-market interest rates; government loan guarantees; preferential tax treatments; accelerated depreciation on energy machineries and equipment; provision of energy-related services at less than full cost; imposing trade restrictions (e.g., tariff and nontariff barriers); and imposing regulatory regimes on the energy sector, such as price controls, purchase guarantees and preferential market access. A major problem, however, relates to the transparency of these items, which often are not included in the government’s financial statements (including the budget). In view of the above constraints, the present study focuses on the financial cost of energy subsidies, as documented by the relevant ministries of the Government of Bangladesh.
2.1 Total Subsidies in Bangladesh Bangladesh’s total on-budget subsidies for the last four fiscal years are given in Table 2. Total on-budget subsidies are expected to rise to BDT298.1 billion in FY2013 from BDT107.7 billion in FY2010, an increase of 177 per cent in three years.
TABLE 2: SUBSIDIES IN THE GOVERNMENT BUDGET, FY2010-FY2013
FY2010 FY2011 FY2012 FY2013 (ESTIMATED)Total subsidy, billion BDT 107.7 95.3 162.9 298.1By broad sector, billion BDT
Agriculture 58.2 41.9 50.5 65.6Fossil fuels 15.1 8.6 40.7 89.4Electricity 9.7 12.4 40.7 65.6Others 24.7 32.4 31.0 77.5
Memorandum item: Total subsidy as % of GDP 1.8 1.4 2.0 3.3Total subsidy as % of government’s total budgetary expenditure 12.2 9.4 12.7 18.5
Total subsidy as % of government’s total development expenditure 55.6 37.3 48.9 72.4
Total subsidy as % of government’s total tax revenue 20.5 15.4 20.6 30.9
Source: MoF (2009, 2010, 2011, 2012a, 2012b)
1 The fiscal year starts from July 1 of the first year and runs up to June 30 of the second year. For example, FY2010 runs from July 1, 2009 to June 30, 2010.
2 All references to “octane” refer to gasoline with a research octane number of 95 (RON 95).

© 2013 The International Institute for Sustainable DevelopmentRESEARCH REPORT AUGUST 2013Energy Subsidies in Bangladesh: A profile of groups vulnerable to reform 4
As a share of GDP, the total subsidy cost rose from 1.8 per cent to 3.3 per cent over the three-year period, while its share in total budgetary expenditure increased from 12.2 per cent to 18.5 per cent. Between FY2010 and FY2013, the share of total subsidy in the government’s total development expenditure shot up from 55.6 per cent to 72.4 per cent, while its share in total tax revenue rose from 20.5 per cent to 30.9 per cent. Table 2 shows how quickly subsidy costs have been escalating over the past four years.
Table 2 also shows a substantial shift in the sectoral composition of subsidies. In FY2010, agriculture accounted for 54 per cent of the total subsidy, while the shares of fossil fuels and electricity were 14 per cent and 9 per cent respectively. The share of agriculture declined to 22 per cent of the total in FY2013, while the shares of fossil fuels and electricity rose to 30 per cent and 22 per cent respectively. Thus, the energy sector as a whole now accounts for 52 per cent of the total budgetary subsidy of the government compared with only 23 per cent three years ago. These figures indicate how fast energy subsidies are rising and the urgent need for energy subsidy reform in Bangladesh.
It may be noted here that the above figures relate to budgetary subsidies only and do not include off-budget subsidies (e.g., loans with favourable terms and conditions to energy-sector public institutions like the Bangladesh Power Development Board [BPDB] and Bangladesh Petroleum Corporation [BPC]). This study is intended to estimate the overall energy subsidies (both budgetary and off-budget) that are discussed in the following sections of the study.
A summary of the estimates of overall energy subsidies (including both on-budget and off-budget subsidies) by different energy products is given in Table 3. It shows that total energy subsidies increased sharply to BDT126billion in FY2011 from BDT9.8billion in FY2010 and further increased to BDT149billion in FY2012. Total subsidies have escalated due to a rapid increase in energy consumption levels and rising import prices for energy products, especially in FY2012.
TABLE 3: ENERGY SUBSIDIES IN BANGLADESH IN FY2010, FY2011 AND FY2012
ENERGY PRODUCTS FY2010 FY2011 FY2012
Subsidies on electricity (million BDT)Generation level 5,952 47,187 64,108Distribution level 2,056 5,488 16,032
Total 8,008 52,675 80,140Subsidies on petroleum products (million BDT) Total 1,839 73,277 68,714Total energy subsidies (million BDT) Total 9,847 125,952 148,854GDP at current price (million BDT) Total 6,943,240 7,967,040 9,147,840Energy subsidies (on-budget and off budget) as a percentage of GDP Total 0.14182 1.58091 1.627208
Source: Calculated from tables 6, 12 and 13
2.2 Energy Subsidies in Bangladesh In Bangladesh, the government imports most fossil fuel and petroleum products. The Bangladesh Energy Regulatory Commission periodically fixes the prices of these products in the market. Thus, all petroleum products, including electricity, are sold under an administered price regime, which is controlled by the government. As such, energy subsidies in Bangladesh mostly result from setting retail prices for fuel and electricity at lower than their “true market prices.” Although the government periodically adjusts energy prices to bring them closer to world market prices, subsidies remain substantial due to the government’s policy of subsidizing energy to support access for the poor. Energy subsidies are also considered important for several key production sectors of the economy, including agriculture (e.g., using subsidized diesel for irrigation by small and marginal farmers). This section examines the volume of subsidies to different fossil fuels and electricity.

© 2013 The International Institute for Sustainable DevelopmentRESEARCH REPORT AUGUST 2013Energy Subsidies in Bangladesh: A profile of groups vulnerable to reform 5
2.2.1 Crude Oil and Petroleum ProductsBangladesh is fully dependent on imported crude oil and also imports refined petroleum products. Furnace oil, lubricant oil (lube), high-speed diesel, kerosene and petrol are some of the imported refined products.
TABLE 4: TOTAL IMPORT AND IMPORT COST OF PETROLEUM PRODUCTS IN BANGLADESH
CRUDE OIL REFINED PRODUCTS LUBE-BASED OIL FURNACE OIL
YEARIMPORT
(MILLION LITRES)
IMPORT COST PER
LITRE (BDT)
IMPORT (MILLION LITRES)
IMPORT COST PER
LITRE (BDT)
IMPORT (MILLION LITRES)
IMPORT COST PER
LITRE BDT)
IMPORT (MILLION
LITRES)
IMPORT COST PER
LITRE (BDT)
FY2004 1252.42 14.76 2262.35 17.75 6.52 28.21 0.00 n/aFY2005 1063.21 21.28 2691.75 26.80 10.19 37.43 39.86 15.44FY2006 1253.29 29.93 2380.53 39.41 5.14 69.16 0.00 n/aFY2007 1211.04 32.91 2536.54 41.18 4.29 58.62 0.00 n/aFY2008 1040.08 48.97 2273.26 63.09 5.01 59.81 0.00 n/aFY2009 860.88 39.86 2507.82 43.64 4.83 48.94 29.92 20.18FY2010 1136.57 41.37 2634.21 45.66 7.26 71.65 … …FY2011 1409.30 49.93 3259.34 62.22 4.75 92.20 230.43 48.74FY2012 1083.47 65.10 3409.93 79.51 4.98 106.65 680.98 56.08
Source: Authors’ calculations using BPC data on Quantity of Imported Products and Its Value (BPC, 2007, 2008, 2009, 2001, 2011, 2012).
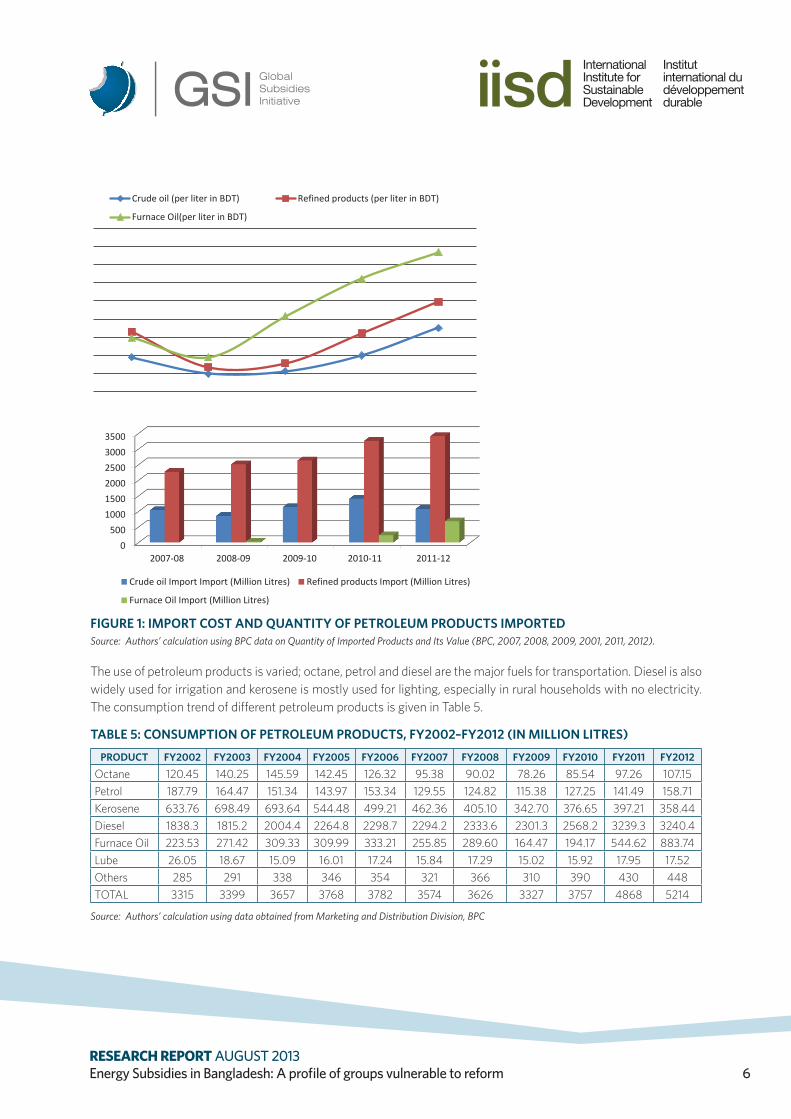
Although the domestic prices of petroleum products follow the general trend of world prices, prices in the domestic market are much less volatile than those in the world market. The government absorbs significant portions of the price volatility by providing subsidies on petroleum products. As expected, rising trends in international prices result in a higher import cost for petroleum products in Bangladesh (Table 4). The quantity of imports has, however, continued to rise (Figure 1). In Figure 1, the first panel shows the per-litre import cost across different petroleum products in recent years, while the second panel gives the total quantity of import during the period.
The world financial crisis in 2008 led to a sharp fall in petroleum prices in FY2009. Since then, petroleum prices have risen continuously in the world market, leading to an increasing import cost for Bangladesh.
© 2013 The International Institute for Sustainable DevelopmentRESEARCH REPORT AUGUST 2013Energy Subsidies in Bangladesh: A profile of groups vulnerable to reform 6
FIGURE 1: IMPORT COST AND QUANTITY OF PETROLEUM PRODUCTS IMPORTEDSource: Authors’ calculation using BPC data on Quantity of Imported Products and Its Value (BPC, 2007, 2008, 2009, 2001, 2011, 2012).
The use of petroleum products is varied; octane, petrol and diesel are the major fuels for transportation. Diesel is also widely used for irrigation and kerosene is mostly used for lighting, especially in rural households with no electricity. The consumption trend of different petroleum products is given in Table 5.
TABLE 5: CONSUMPTION OF PETROLEUM PRODUCTS, FY2002–FY2012 (IN MILLION LITRES)
PRODUCT FY2002 FY2003 FY2004 FY2005 FY2006 FY2007 FY2008 FY2009 FY2010 FY2011 FY2012
Octane 120.45 140.25 145.59 142.45 126.32 95.38 90.02 78.26 85.54 97.26 107.15Petrol 187.79 164.47 151.34 143.97 153.34 129.55 124.82 115.38 127.25 141.49 158.71Kerosene 633.76 698.49 693.64 544.48 499.21 462.36 405.10 342.70 376.65 397.21 358.44Diesel 1838.3 1815.2 2004.4 2264.8 2298.7 2294.2 2333.6 2301.3 2568.2 3239.3 3240.4Furnace Oil 223.53 271.42 309.33 309.99 333.21 255.85 289.60 164.47 194.17 544.62 883.74Lube 26.05 18.67 15.09 16.01 17.24 15.84 17.29 15.02 15.92 17.95 17.52Others 285 291 338 346 354 321 366 310 390 430 448TOTAL 3315 3399 3657 3768 3782 3574 3626 3327 3757 4868 5214
Source: Authors’ calculation using data obtained from Marketing and Distribution Division, BPC
Crude oil (per liter in BDT) Refined products (per liter in BDT)
Furnace Oil(per liter in BDT)
0500
100015002000250030003500
2007-08 2008-09 2009-10 2010-11 2011-12
Crude oil Import Import (Million Litres) Refined products Import (Million Litres)
Furnace Oil Import (Million Litres)

© 2013 The International Institute for Sustainable DevelopmentRESEARCH REPORT AUGUST 2013Energy Subsidies in Bangladesh: A profile of groups vulnerable to reform 7
Diesel consumption accounted for 69 per cent of total petroleum product sales in FY2009 and FY2010 and 65 per cent in FY2011 and FY2012 (Figure 2). Kerosene was the second dominant product in FY2009 and FY2010, but its position has been taken over by furnace oil during the last two years. The share of furnace oil has experienced a drastic increase, from 5 per cent in FY2009 and FY2009 to 11 per cent in FY2011 and then to 17 per cent in FY2012 because of increased electricity generation requirements.
FIGURE 2: SHARE OF CONSUMPTION OF DIFFERENT PETROLEUM PRODUCTSSource: Authors’ calculation using data obtained from Marketing and Distribution Division, BPC
The transport sector (both public and private) dominates in terms of petroleum product usage, consuming around 54 per cent of total sales in FY2010 and FY2011 (Figure 3). Agriculture is the second dominant sector. Sales of petroleum by sector depict almost similar patterns in FY2010 and FY2011. However, there have been some structural changes beginning in FY2012. The power sector has been rapidly increasing its share in total consumption, which increased from around 6 per cent to 8 per cent up to FY2011 but then rapidly to 19 per cent in FY2012. The use of furnace oil (as well as diesel) by the power sector, especially by the private rental power plants, is the major reason for this drastic upsurge in consumption.
0%10%20%30%40%50%60%70%80%90%
100%
2008-09 2009-10 2010-11 2011-12
Others
Lube
Furnace Oil
Diesel
Kerosene
Petrol
Octane

© 2013 The International Institute for Sustainable DevelopmentRESEARCH REPORT AUGUST 2013Energy Subsidies in Bangladesh: A profile of groups vulnerable to reform 8
FIGURE 3: SECTOR-WIDE SALES OF PETROLEUM PRODUCTS, FY2009–FY2010Note: “Communication” refers to the transport sector
Source: (BPC, 2007, 2008, 2009, 2001, 2011, 2012).
The subsidy on petroleum products can be residually estimated by the difference between the import price and the administrative price of different petroleum products in the domestic market. The subsidization of petroleum prices has resulted in significant losses for the BPC (the public sector oil company with a monopoly on imports) (Figure 4).
Agriculture24% Industry
4%
Power8%
Communication53%
Domestic & Others
11%
Sales of petroleum by sector,2008-2009
Agriculture24%
Industry5%
Power6%
Communication54%
Domestic & Others
11%
Sales of petroleum by sector,2009-2010
Agriculture21%
Industry6%
Power19%
Communication45%
Domestic & Others
9%
Sales of petroleum by sector, 2010-11

© 2013 The International Institute for Sustainable DevelopmentRESEARCH REPORT AUGUST 2013Energy Subsidies in Bangladesh: A profile of groups vulnerable to reform 9
FIGURE 4: LOSSES INCURRED BY THE BPCSource: BPC (2012b)
The BPC’s operational losses are covered by loans from state-owned commercial banks, direct budgetary transfers and net lending by the government. These loans are provided with an interest rate that is lower than the market rate. The government also allocates financial resources for the BPC in its annual budgets. These government subsidies enable the BPC to recover its losses resulting from selling petroleum products at prices lower than the import prices (Figure 4).
Bangladesh imports both refined petroleum products and crude oil, which is used to produce octane, petrol, diesel and some other products through the refinement process. The share of imported crude oil and refined products varies depending on factors such as the price differential between crude oil and processed products on the world market and the domestic processing capacity of crude petroleum. The estimation of total subsidies on petroleum products therefore involves two elements. The first is subsidies arising from the import of crude oil, which is processed in domestic refineries into various petroleum products for sale to the consumers at subsidized prices. The second is subsidies given directly to imported refined products as a difference between imported price and administered domestic price.
The difference between the import costs and selling revenues of imported petroleum products—namely, diesel, kerosene and furnace oil—has given rise to huge subsidies over the last three years. The subsidies on these three petroleum products were estimated at BDT1.84billion in FY2010, which then increased sharply to BDT73.28billion in FY2011, and decreased to BDT68.71 billion in FY2012 (Table 6). Two factors have contributed to the astronomical jump in subsidy in FY2011. First, unit costs were higher due to the higher import prices of different petroleum products in the world market; second, consumption of diesel and furnace oil rose rapidly, particularly for liquid fuel-based electricity generation from rental/quick rental power plants to meet the ongoing power crisis.
0
20000
40000
60000
80000
100000
120000
13112.27801.6
76.19589.3
23178.833377.8
23146.3
70503
10226.3
25712.2
91000
105517.6
Loss by BPC/Subsidy (Million BDT)
Loss by BPC (Million Tk)

© 2013 The International Institute for Sustainable DevelopmentRESEARCH REPORT AUGUST 2013Energy Subsidies in Bangladesh: A profile of groups vulnerable to reform 10
TABLE 6: SUBSIDIES FOR REFINED IMPORTED PETROLEUM PRODUCTS
SALES (MILLION LITRES)
PER-UNIT SUPPLY COST (BDT/LITRE)
SELLING PRICE (BDT/LITER)
PER-UNIT SUBSIDY (BDT/LITRE)
TOTAL SUBSIDIES (MILLION BDT)
2009–2010
Diesel 3045.894688 45.22 44 1.22 3715.992Kerosene 477.58586 46.95 44 2.95 1408.878Petrol 181.072481 50.53 74 -23.47 -4249.77Octane 117.020088 51.53 77 -25.47 -2980.5JET-1 363.837384 51.22 45 6.22 2263.069Furnace oil 210.08653 38.00 30 8.002583 1681.235Total 0 … 1838.92010–2011 0 0Diesel 3841.784894 62 46 16 61468.56Kerosene 503.661012 62.74 46 16.74 8431.285Petrol 201.341693 64.33 76 -11.67 -2349.66Octane 133.057152 65.33 79 -13.67 -1818.89JET-1 425.708176 62.12 67 -4.88 -2077.46Furnace oil 589.275594 58.33 42 16.33 9622.87Total 0 73276.712011–2012 0 Diesel 3843.053914 77.45 61 16.45 63218.24Kerosene 454.496848 74.65 61 13.65 6203.882Petrol 225.840061 79 91 -12 -2710.08Octane 146.5812 79 94 -15 -2198.72JET-1 395.47652 73.13 87 -13.87 -5485.26Furnace oil 956.20127 65.13 55 10.13 9686.319Total 68714.38
Source: Authors’ calculations using BPC data as follows: total sales are calculated using data from Marketing and Distribution Division (in metric tonnes) and per-unit cost, per unit selling price is provided by BPC to BIDS.
The government’s policy is to periodically adjust the administered prices of petroleum products to reduce the gap between the import prices and the domestic prices of petroleum products, and hence the volume of the subsidy. As a consequence, there have been significant adjustments in petroleum product prices in recent years (Table 7).
TABLE 7: RECENT ADJUSTMENTS IN PETROLEUM PRODUCT PRICES (BDT/LITRE)
PETROL OCTANE DIESEL KEROSENE FURNACE OILJan 2006 56 58 33 33 …Jul 2008 87 90 55 55 30Dec 2008 74 77 46 46 …Jan 2009 74 77 44 44 …May 2011 76 79 46 46 42Sep 2011 80 84 51 51 50Dec 2011 86 89 56 56 55Jan 2012 91 94 61 61 60Jan 2013 96 99 68 68 60
Source: BPC (2007, 2008, 2009, 2010, 2011, 2012) and data provided by BPC to BIDS
© 2013 The International Institute for Sustainable DevelopmentRESEARCH REPORT AUGUST 2013Energy Subsidies in Bangladesh: A profile of groups vulnerable to reform 11
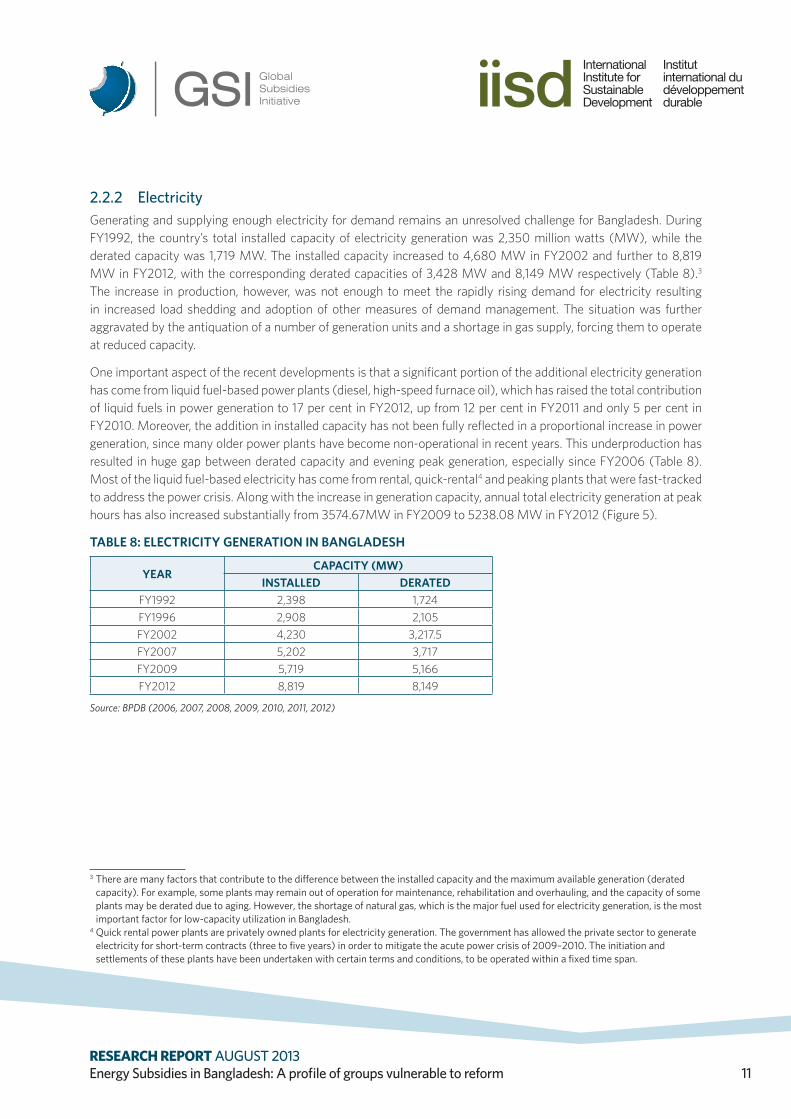
2.2.2 ElectricityGenerating and supplying enough electricity for demand remains an unresolved challenge for Bangladesh. During FY1992, the country’s total installed capacity of electricity generation was 2,350 million watts (MW), while the derated capacity was 1,719 MW. The installed capacity increased to 4,680 MW in FY2002 and further to 8,819 MW in FY2012, with the corresponding derated capacities of 3,428 MW and 8,149 MW respectively (Table 8).3 The increase in production, however, was not enough to meet the rapidly rising demand for electricity resulting in increased load shedding and adoption of other measures of demand management. The situation was further aggravated by the antiquation of a number of generation units and a shortage in gas supply, forcing them to operate at reduced capacity.
One important aspect of the recent developments is that a significant portion of the additional electricity generation has come from liquid fuel-based power plants (diesel, high-speed furnace oil), which has raised the total contribution of liquid fuels in power generation to 17 per cent in FY2012, up from 12 per cent in FY2011 and only 5 per cent in FY2010. Moreover, the addition in installed capacity has not been fully reflected in a proportional increase in power generation, since many older power plants have become non-operational in recent years. This underproduction has resulted in huge gap between derated capacity and evening peak generation, especially since FY2006 (Table 8). Most of the liquid fuel-based electricity has come from rental, quick-rental4 and peaking plants that were fast-tracked to address the power crisis. Along with the increase in generation capacity, annual total electricity generation at peak hours has also increased substantially from 3574.67MW in FY2009 to 5238.08 MW in FY2012 (Figure 5).
TABLE 8: ELECTRICITY GENERATION IN BANGLADESH
YEARCAPACITY (MW)
INSTALLED DERATEDFY1992 2,398 1,724FY1996 2,908 2,105FY2002 4,230 3,217.5FY2007 5,202 3,717FY2009 5,719 5,166FY2012 8,819 8,149
Source: BPDB (2006, 2007, 2008, 2009, 2010, 2011, 2012)
3 There are many factors that contribute to the difference between the installed capacity and the maximum available generation (derated capacity). For example, some plants may remain out of operation for maintenance, rehabilitation and overhauling, and the capacity of some plants may be derated due to aging. However, the shortage of natural gas, which is the major fuel used for electricity generation, is the most important factor for low-capacity utilization in Bangladesh.
4 Quick rental power plants are privately owned plants for electricity generation. The government has allowed the private sector to generate electricity for short-term contracts (three to five years) in order to mitigate the acute power crisis of 2009–2010. The initiation and settlements of these plants have been undertaken with certain terms and conditions, to be operated within a fixed time span.

© 2013 The International Institute for Sustainable DevelopmentRESEARCH REPORT AUGUST 2013Energy Subsidies in Bangladesh: A profile of groups vulnerable to reform 12
FIGURE 5: MONTHLY POWER GENERATION AT PEAK HOURSSource: BPDB (2008, 2009, 2010, 2011, 2012)
Electricity generation in Bangladesh is overwhelmingly natural gas-based (Figure 6). In FY2011, 82 per cent of the evening peak electricity was generated using natural gas, 12.6 per cent by liquid fuel, 2.5 per cent by coal and 2.8 per cent by hydro. In FY2010, the power generation mix was somewhat different in that the contribution of natural gas was 89 per cent while the share of liquid fuel was only 5 per cent. In FY2010, around 1,169.88 million kilowatt hours (MkWh) of electricity was generated using coal, whereas in FY2010, only 780.74 MkWh of electricity was generated from the coal-based power plants.
FIGURE 6: FUEL MIX OF ELECTRICITY GENERATION, FY2010, FY2011 AND FY2012Source: BPDB (2012)
3000
3500
4000
4500
5000
5500
6000
Jan Feb March April May June July Aug Sept Oct Nov Dec
2008 (MW) 2009 (MW) 2010 (MW) 2011 (MW) 2012 (MW)
Liquid fuel5%
Hydro2% Coal
4%
Natural Gas
89%
FY2011–2012: Electricity generation 33397 MkWh
FY2009–2010: Electricity generation 29,247 MkWh FY2010–2011: Electricity generation 31,355 MkWh
Natural Gas
78%
Liquid Fuel17%
Coal3%
Hydro 2%

© 2013 The International Institute for Sustainable DevelopmentRESEARCH REPORT AUGUST 2013Energy Subsidies in Bangladesh: A profile of groups vulnerable to reform 13
The change in the fuel mix of electricity generation has significant implications for the cost structure and total subsidy cost. The use of liquid fuel—high-speed diesel and furnace oil—has increased significantly in the last two years, which has, in turn, increased the per-unit generation cost of electricity in FY2011 and FY2012 (Table 9).
TABLE 9: PER-UNIT AVERAGE COST OF ELECTRICITY GENERATION IN BANGLADESH
YEAR FY2008 FY2009 FY2010 FY2011 FY2012
Per-unit cost (BDT/kWh) 2.33 2.53 2.58 4.20 5.36
Source: BPDB (2008, 2009, 2010, 2011, 2012)
In Bangladesh, households and industry are the two biggest consumers of electricity. The domestic sector accounts for 45 per cent of retail sales while the industry sector consumes around 35 per cent of the total (Figure 7).
FIGURE 7: SALES OF ELECTRICITY BY SECTORSource: BPDB (2006, 2007, 2008, 2009, 2010, 2011, 2012)
There are two types of electricity subsidies. The first type of subsidy lowers the production cost through subsidized fuel (e.g., natural gas, coal, diesel, furnace oil, etc.) in electricity generation. The second type offers electricity tariffs for groups of consumers (including residential customers and farmers) that are lower than the production costs. As a result, the BPDB, which generates around 60 per cent of the country’s total electricity, has persistently incurred losses due to selling electricity at prices lower than the break-even point. These losses are adjusted mainly through budgetary transfers by the government every year (Figure 8).
0.00
0.20
0.40
0.60
0.80
1.00
2005 2006 2007 2008 2009 2010 2011 2012
0.43 0.43 0.43 0.45 0.46 0.47 0.48 0.45
0.04 0.04 0.05 0.04 0.05 0.05 0.05 0.05
0.44 0.43 0.340.39
0.280.37 0.29 0.36
0.08 0.080.08
0.090.09
0.090.10 0.09
Domestic Agriculture Industry Commercial Others

© 2013 The International Institute for Sustainable DevelopmentRESEARCH REPORT AUGUST 2013Energy Subsidies in Bangladesh: A profile of groups vulnerable to reform 14
FIGURE 8: BUDGETARY TRANSFERS FROM THE BANGLADESH GOVERNMENT TO BPDBSource: BPDP (2006, 2007, 2008, 2009, 2010, 2011, 2012)
The electricity tariff structures differ across sectors and levels of consumption. Industrial and commercial sectors pay higher tariffs while domestic and agriculture sectors pay low, subsidized tariffs. Thus, the domestic and agriculture sectors are partially cross-subsidized by the industrial and commercial sectors.
Bangladesh imposes one of the lowest electricity tariffs of many of its neighbours when both domestic and agricultural usages are considered (Table 10).
TABLE 10: TARIFF RATES IN BANGLADESH AND ITS NEIGHBOURS
COUNTRY/REGION 0–100 UNIT RESIDENTIAL (BDT/KWH) AGRICULTURE (BDT/KWH)Bangladesh 3.68 (up to 75 unit: 3.33) 2.51
West Bengal, India 3.88 (rural) , 3.90 (urban) Off peak: 2.34., Peak: 9.06CESC (Kolkata) 6.00 (urban) …KESC (Karachi) 5.90 Flat:11.00
Nepal 6.79 (.50 unit: 8.00) …Sri Lanka 3.88 (.90 unit: 13.25) …
Source: BPDP (2012)
Bangladesh has adopted several tariff structures at various times to adjust its selling price with changes in the production cost of electricity (Table 11). The tariff rates have been changed five times since 2007.
2700127002270032700427005270062700
2006-07 2007-08 2008-09 2009-10 2010-11 2011-12
30006000 10070 9940
40000
63570
Government Provision (Million BDT)
Government Provision (Tk.Million)

© 2013 The International Institute for Sustainable DevelopmentRESEARCH REPORT AUGUST 2013Energy Subsidies in Bangladesh: A profile of groups vulnerable to reform 15
TABLE 11: ELECTRICITY TARIFF STRUCTURES IN BANGLADESH
CONSUMER CATEGORY RANGE (KWH)
BDT/KWH
MARCH 2007 MARCH 2010 FEB 2011 DEC 2011 MARCH 2012 SEPT 2012
Domestic
00–75 2.5 2.6 2.6 2.73 3.05 3.3376–100 2.5 2.6 2.6 2.73 3.05 4.73101–200 3.15 3.3 3.46 3.81 4.29 4.83201–300 3.15 3.3 3.46 3.81 4.29 4.93301–400 3.15 3.3 3.46 3.81 4.29 7.98401–600 5.25 5.65 5.93 6.88 7.89 9.38
Above 600 5.25 5.65 5.93 6.88 7.89 9.38Agricultural pumping Flat 1.93 1.93 1.93 2.03 2.26 2.51
Small industry categoryFlat 4.02 4.35 4.56 5.27 6.02 6.95Peak 5.62 5.95 6.28 6.75 7.33 8.47
Off peak 3.2 3.5 3.67 4.41 5.16 5.96Non-residential category 3.35 3.35 3.35 3.52 3.92 4.53
Commercial category
Flat 5.3 5.58 5.85 6.8 7.79 9
Peak 8.2 8.45 8.87 9.31 10.26 11.85
Off peak 3.8 4.05 4.25 5.23 6.25 7.22
Source: Bangladesh Energy Regulatory Commission (BERC)5
Note: “Non-residential category” includes public services such as street lighting and non-residential use such as water pumps.
2.2.2.1 Estimates of Electricity Subsidies Electricity subsidies can be both explicit and implicit. Explicit subsidies include the subsidies provided to electricity generation and distribution. Implicit subsidies can be calculated from BPDB’s interest payments to government. Estimating implicit subsidies involves two calculations: the subsidies at electricity generation and the subsidies at electricity distribution.
BPDB is responsible for generating electricity and selling it to different distribution companies, such as Dhaka Power Distribution Company Limited (DPDC), West Zone Power Distribution Company Limited (WZPDCL), Rural Electrification Board (REB) and Dhaka Electric Supply Company Limited (DESCO). BPDB sells electricity to these distribution companies at a rate that is lower than the generation cost, leading to huge losses for BPDB. The government provides loans to BPDB at interest rates lower than market interest rates to mitigate these losses. As these loans are provided at subsidized interest rates, the process involves the provision of implicit subsidies.6 The low selling price of BPDB to the distribution companies results in losses per unit of electricity generated. These costs are estimated in Table 12.
5 “Peak hours”occur when the demand for electricity is highest. “Off-peak hours”occur when demand for electricity is lowest. Flat rate is the average tariff rate for those hours when demand for electricity is average. Tariff rate for peak, off-peak hours and flat rate are expressed in BDT/KWh.
6 However, entire losses cannot be regarded as total subsidies, as the loans provided by the government must be repaid as per agreed terms. To estimate the actual subsidies provided by the government, the interest payment that is exempted through the subsidized interest rate should be calculated. Due to the complex nature of the process, this study excludes this calculation and leaves the issue open for future research.

© 2013 The International Institute for Sustainable DevelopmentRESEARCH REPORT AUGUST 2013Energy Subsidies in Bangladesh: A profile of groups vulnerable to reform 16
TABLE 12: ESTIMATED ELECTRICITY SUBSIDIES AT GENERATION
TOTAL BULK SALES (MKWH) (A)
PER-UNIT SUPPLY COST
(BDT/KWH) (B)
PER-UNIT SELLING PRICE TO DISTRIBUTION COMPANIES
(BDT/KWH)(C )
PER-UNIT SUBSIDY (D=B-C)
TOTAL SUBSIDIES (MILLION BDT)
(E=D*A)
FY2010 28,341 2.58 2.37 0.21 5,952FY2011 30,443 4.2 2.65 1.55 47,187FY2012 34,100 5.35 3.47 1.88 64,108
Source: BPDB (2010, 2011, 2012)
Despite the lower price paid to BPDB, the distribution companies also incur losses because electricity is provided to final consumers at subsidized rates. This per-unit subsidy can be estimated by calculating the difference between the per-unit supply cost of the distribution companies and the per-unit selling price to final consumers (Table 13).
TABLE 13: ESTIMATED SUBSIDIES IN THE ELECTRICITY SECTOR AT THE DISTRIBUTION LEVEL, FY2010–FY2012
TOTAL SALES (MKWH) (A)
PER-UNIT SUPPLY COST (BDT/KWH) (PER-UNIT PRICE PAID BY DISTRIBUTION COMPANIES TO BPDB+ TRANSMISSION CHARGE + DISTRIBUTION COST=TOTAL SUPPLY COST PER UNIT) (B)
PER-UNIT SELLING PRICE
(BDT /KWH) (C)
PER-UNIT SUBSIDY
(BDT/KWH) (D=B-C)
TOTAL SUBSIDIES
(MILLION BDT) (E=A*D)
TOTAL SUBSIDIES IN ELECTRICITY (SUM OF GENERATION AND DISTRIBUTION SUBSIDIES) (MILLION BDT)
FY2010
Domestic 11,623 3.93 3.19 0.74 8,601Agriculture 1,229 3.93 2.9 1.03 1,266Industry 9,002 3.93 4.35 -0.42 -3,781Commercial 2,336 3.93 5.61 -1.68 -3,925Others 406 3.93 4.19 -0.26 -106Total 24,596 3.93 … 2,056 8,008FY2011 Domestic 12,757 4.24 3.39 0.85 10,843Agriculture 1,269 4.24 2.88 1.36 1,725Industry 7,713 4.24 4.41 -0.17 -1,311Commercial 2,574 4.24 5.96 -1.72 -4,427Others 2,276 4.24 4.83 -0.59 -1,343Total 26,587 4.24 … 5,488 52,675FY2012 Domestic 14,678 5.15 3.9 1.25 18,348Agriculture 1,492 5.15 3.18 1.97 2,939Industry 10,579 5.15 5.11 0.04 423Commercial 2,751 5.15 7.14 -1.99 -5,474Others 473 5.15 5.58 -0.43 -203Total 29,974 5.15 … … 16,032 80,140
Source: Authors’ calculation from BPDB data

© 2013 The International Institute for Sustainable DevelopmentRESEARCH REPORT AUGUST 2013Energy Subsidies in Bangladesh: A profile of groups vulnerable to reform 17
The calculations show that the total subsidies for electricity distribution amounted to BDT8,008 million in FY2010, BDT52,675 million in FY2011, and jumped to BDT80,140million in FY2012. Despite the upward adjustments in electricity tariffs, total subsidies have risen due to sharp increases in the average generation cost resulting from the increased use of liquid fuel-based rental and quick-rental power plants.
2.2.3 Natural GasBangladesh’s natural gas resources were first exploited by the national public energy company, PETROBANGLA. More recently, international oil and gas companies (IOCs) have established exploration and production activities. Over the years, natural gas has emerged as the only major source of energy in Bangladesh. It is projected to grow by around 6 per cent over the next two decades (BIDS-IISD, 2012). Natural gas is used as a feedstock for petrochemicals, as compressed natural gas (CNG) for vehicles, power generation, for cooking and for fertilizer production. The power sector and industry are the two biggest consumers of natural gas (Figure 9).
FIGURE 9: SALES OF NATURAL GAS BY SECTORSource: PETROBANGLA (2011a)
Despite abundant reserves, Bangladesh does not have a self-reliant gas supply, and the country faces supply shortages in different sectors. The annual production of gas has increased from 391.53 billion cubic feet in FY2002 to 708.90 billion cubic feet in FY2011 (Figure 10). However, demand for natural gas is much higher than the available supply.
Power
18%
Fertilizer4%
Industry8%
Commercial1%CNG
2%Captive Power8%
Domestic59%
Sales of natural gas by sector, 2010-11
Power20%
Fertilizer3%
Industry8%
Commercial
CNG3%
Captive Power
8%
Domestic58%
Sales of natural gas by sector, 2011-12
Power18%
Fertilizer4%
Industry8%
Commercial1%CNG
2%Captive Power8%
Domestic59%
Sectorwise Sales of Gas 2010-11
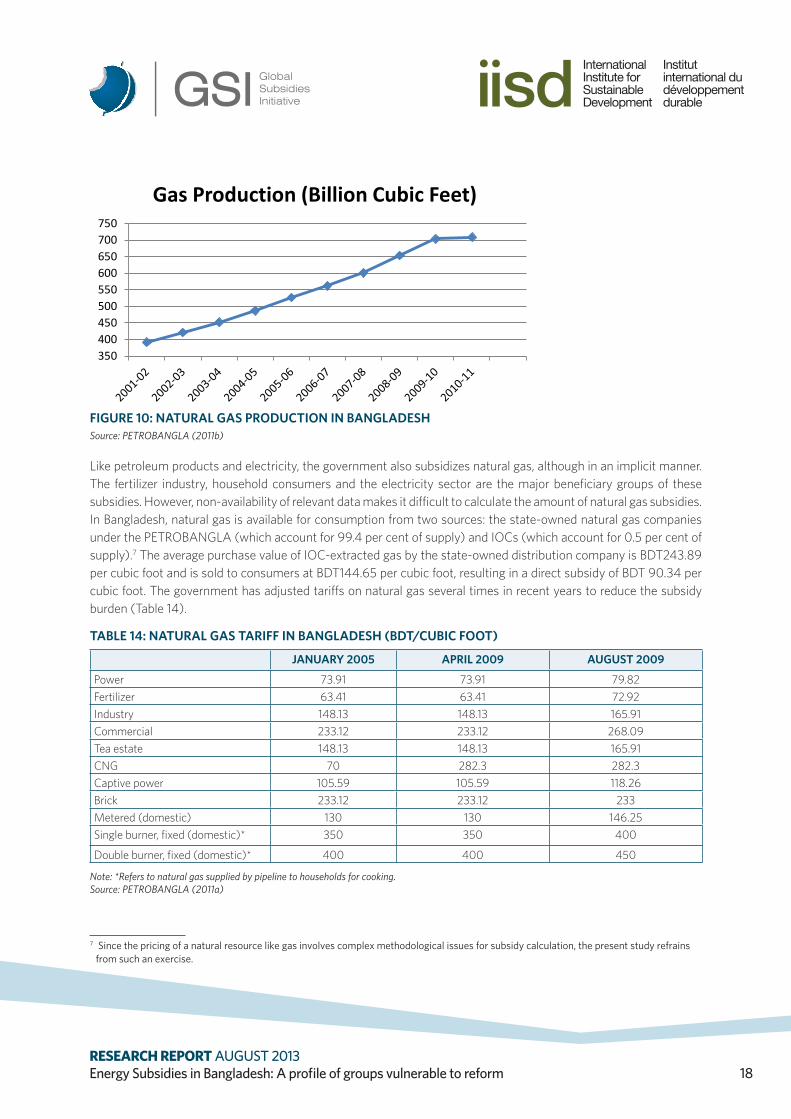
© 2013 The International Institute for Sustainable DevelopmentRESEARCH REPORT AUGUST 2013Energy Subsidies in Bangladesh: A profile of groups vulnerable to reform 18
FIGURE 10: NATURAL GAS PRODUCTION IN BANGLADESHSource: PETROBANGLA (2011b)
Like petroleum products and electricity, the government also subsidizes natural gas, although in an implicit manner. The fertilizer industry, household consumers and the electricity sector are the major beneficiary groups of these subsidies. However, non-availability of relevant data makes it difficult to calculate the amount of natural gas subsidies. In Bangladesh, natural gas is available for consumption from two sources: the state-owned natural gas companies under the PETROBANGLA (which account for 99.4 per cent of supply) and IOCs (which account for 0.5 per cent of supply).7 The average purchase value of IOC-extracted gas by the state-owned distribution company is BDT243.89 per cubic foot and is sold to consumers at BDT144.65 per cubic foot, resulting in a direct subsidy of BDT 90.34 per cubic foot. The government has adjusted tariffs on natural gas several times in recent years to reduce the subsidy burden (Table 14).
TABLE 14: NATURAL GAS TARIFF IN BANGLADESH (BDT/CUBIC FOOT)
JANUARY 2005 APRIL 2009 AUGUST 2009
Power 73.91 73.91 79.82Fertilizer 63.41 63.41 72.92Industry 148.13 148.13 165.91Commercial 233.12 233.12 268.09Tea estate 148.13 148.13 165.91CNG 70 282.3 282.3Captive power 105.59 105.59 118.26Brick 233.12 233.12 233Metered (domestic) 130 130 146.25Single burner, fixed (domestic)* 350 350 400
Double burner, fixed (domestic)* 400 400 450
Note: *Refers to natural gas supplied by pipeline to households for cooking.Source: PETROBANGLA (2011a)
7 Since the pricing of a natural resource like gas involves complex methodological issues for subsidy calculation, the present study refrains from such an exercise.
350400450500550600650700750
Gas Production (Billion Cubic Feet)
Gas Prodution (Billion Cubic Feet)
© 2013 The International Institute for Sustainable DevelopmentRESEARCH REPORT AUGUST 2013Energy Subsidies in Bangladesh: A profile of groups vulnerable to reform 19
3.0 A Profile of Population Groups and Production Sectors Most Vulnerable to Subsidy ReformsThe government’s policy of subsidizing energy products (diesel, kerosene, furnace oil and electricity) has significant consequences for the economy and for different population groups. The analysis in this paper shows that, among the energy products, only diesel, kerosene and furnace oil are subsidized along with electricity (see Table 6). The production and outputs of various sectors have different energy intensities and so will be affected by energy subsidy reform in different ways. The nature of the inflationary impact of reducing subsidies will depend partly on the type of the energy product subsidized. For example, reducing the subsidy on diesel is likely to have a larger impact on the production costs of different products through its effect on transport and other sectors; whereas reducing kerosene subsidies may not have a significant impact on inflation, but may have greater redistribution impacts through reducing the real incomes of poorer groups.
Reform in energy subsidies is also likely to change the real incomes of household groups, both directly and indirectly. Similarly, the distributional impact of subsidy reform is likely to be different for various fuel types. For instance, kerosene is mostly used by poor households for cooking and lighting, whereas the richer households are the largest consumers of gasoline.
3.1 The Energy Consumption Intensity of Occupational GroupsThis study undertook a mapping exercise to identify the key stakeholders likely to be affected by subsidy reforms in the energy sector. This preliminary exercise is limited to direct impacts resulting from the consumption share of energy products out of total consumption expenditure.
In the case of households, the adopted classification refers to occupational groups across different income levels, while their energy use is differentiated by fuel types. The relevant data have been collected from the latest round of the Household Income and Expenditure Survey (Bangladesh Bureau of Statistics, 2010) conducted by the Bangladesh Bureau of Statistics (BBS). For the present purpose, three different occupational groups have been identified: (i) agricultural households, who mostly depend on farming occupations in the rural areas; (ii) non-agricultural households comprising all the occupations (both fixed income and daily income) that are not engaged in farming; (iii) other households not included in the above categories (whose household head is not working and in which any other household members are working persons and their occupation could not be tracked). These households are again classified into four different income groups based on the monthly income of the households: (i) poor (<BDT1,180), (ii) lower middle (BDT1,181–BDT3,000), (iii) upper middle (BDT 3,001–4,000) and (iv) rich (>BDT 4,000).8
The expenditure pattern of these occupational groups is given in Table 15. It shows that total energy expenditure as a share of non-food expenditure varies across different income and occupational groups. For every occupational group, as well as agriculture, non-agriculture and other occupational households, the share of energy expenditure in total non-food expenditure is lowest for the poor and highest for the rich. For each income group, this share is higher for non-agricultural households than agricultural households.
8 The proportion of poor, lower middle, upper middle and rich in total households is 36.8 per cent, 38.3 per cent, 8.8 per cent and 15.1 per cent respectively.

© 2013 The International Institute for Sustainable DevelopmentRESEARCH REPORT AUGUST 2013Energy Subsidies in Bangladesh: A profile of groups vulnerable to reform 20
Considering energy expenditure as share of household income, non-agricultural households hold a higher share than agricultural households for each income group. On the other hand, for every occupational group, this share is highest for the poor (3.33 per cent for agricultural households, 3.91 per cent for non-agricultural and 5.44 per cent for other households).
One important aspect of these results is that the indirect impacts of energy price increases on food prices are likely to be significant (they could be potentially more significant than direct energy cost changes, at least for some household categories). The issue needs further elaboration in future work.
TABLE 15: EXPENDITURE PATTERN OF DIFFERENT HOUSEHOLD GROUPS ACROSS OCCUPATION AND INCOME
INCOME GROUP POOR LOWER MIDDLE UPPER MIDDLE RICH OCCUPATIONAL GROUP
Per capita BDT per month
Household income
Agricultural 783.65 1911.28 3446.84 7441.94Non-Agricultural 880.29 1982.63 3461.27 7772.45Other 772.31 2025.88 3487.58 8534.03
Non-food expenditure
Agricultural 571.18 745.49 1046.55 1741.60Non-Agricultural 580.32 943.41 1501.47 2851.52Other 704.43 1047.42 1490.53 2595.49
Energy expenditure
Agricultural 26.08 37.26 51.65 122.45Non-Agricultural 34.44 58.78 105.53 206.58Other 41.98 65.10 106.69 196.96
Energy expenditure as % of non-food expenditure
Agricultural 4.57 5.00 4.94 7.03Non-Agricultural 5.93 6.23 7.03 7.24Other 5.96 6.22 7.16 7.59
Energy expenditure as % of household income
Agricultural 3.33 1.95 1.50 1.65
Non-Agricultural 3.91 2.96 3.05 2.66Other 5.44 3.21 3.06 2.31
Source: Authors’ calculation from Bangladesh Bureau of Statistics, 2010
The shares of different energy products of total energy expenditure for different occupational and income groups are given in Table 16. The energy consumption of both poor and lower-middle agricultural households is overwhelmingly biased toward kerosene (58 per cent for poor and 42 per cent for lower middle), which they need mostly for irrigation in crop production. The second major item of energy consumption for these two groups is electricity; poor agricultural and lower-middle agricultural households spend around 36 per cent and 40 per cent of total energy expenditure on electricity, respectively. On the other hand, rich and upper-middle, non-agricultural households consume more electricity (53 per cent for upper middle and 47 per cent for rich) and natural gas (26 per cent for the upper middle and 30 per cent for the rich).

© 2013 The International Institute for Sustainable DevelopmentRESEARCH REPORT AUGUST 2013Energy Subsidies in Bangladesh: A profile of groups vulnerable to reform 21
TABLE 16: PER CAPITA EXPENDITURE OF DIFFERENT ENERGY PRODUCTS BY OCCUPATIONAL AND INCOME GROUPS
ENERGY PRODUCTSINCOME GROUP POOR LOWER MIDDLE UPPER MIDDLE RICH
OCCUPATIONAL GROUP % SHARE OF TOTAL ENERGY EXPENDITURE
KeroseneAgricultural 57.68 42.05 30.09 11.28
Non-Agricultural 37.20 18.88 8.26 3.76Other 37.14 23.80 9.74 6.23
Natural gas/LPGAgricultural 2.52 3.41 4.48 8.54Non-Agricultural 8.35 17.70 25.92 29.83Other 10.89 14.55 16.98 26.40
ElectricityAgricultural 35.87 40.74 40.94 32.87Non-Agricultural 48.92 56.86 53.11 47.19Other 50.59 58.00 52.32 48.16
PetrolAgricultural 1.99 3.90 22.49 21.50Non-Agricultural 1.76 5.39 10.21 13.78Other 1.25 1.48 4.24 4.14
DieselAgricultural 1.80 9.25 1.24 18.83Non-Agricultural 2.09 0.44 1.36 1.16Other 0.00 0.70 8.13 11.41
CNG/motor oil*Agricultural 0.15 0.66 0.77 6.99Non-Agricultural 1.68 0.73 1.15 4.28Other 0.12 1.47 8.58 3.66
Source: Authors’ calculation from Bangladesh Bureau of Statistics, 2010
*CNG is compressed natural gas; motor oil refers to octane in this table.
The division of transport expenditure between public and private modes is given in Table 17. It shows that private transport expenditure (for fuel consumption) is the dominant mode, with a high of 74 per cent for the skilled category households and a low of 54 per cent for the low-income households.
For agricultural households, the share of fuel transport expenditure increases across increased income level in public modes (97 per cent for the poor and 59 per cent for the rich) and decreases in private modes (3.3 per cent for poor and 41.3 person for rich). In a similar scenario with non-agricultural households, the share of fuel transport expenditure is 97 per cent for the poor and 59 per cent for the rich in public modes and 3.3 per cent for the poor and 41.3 per cent for the rich in private modes.

© 2013 The International Institute for Sustainable DevelopmentRESEARCH REPORT AUGUST 2013Energy Subsidies in Bangladesh: A profile of groups vulnerable to reform 22
TABLE 17: DIVISION OF TRANSPORT FUEL EXPENDITURE BETWEEN PUBLIC AND PRIVATE MODES
INCOME GROUP POOR LOWER MIDDLE UPPER MIDDLE RICH
OCCUPATIONAL GROUP
Per capita monthly fuel expenditure (in BDT) on transport
Agricultural 29.16 40.43 58.75 122.95
Non-Agricultural 28.87 45.78 74.04 130.95
Other 35.27 48.16 76.63 112.21
% of share in total fuel transport expenditure
Public
Agricultural 96.68 87.62 82.26 58.68
Non-Agricultural 93.62 92.15 85.49 71.18
Other 98.92 96.84 73.66 68.61
Private
Agricultural 3.32 12.38 17.74 41.32
Non-Agricultural 6.38 7.85 14.51 28.82
Other 1.08 3.16 26.34 31.39
Source: Authors’ calculation from Bangladesh Bureau of Statistics, 2010
3.2 Energy Intensity of Production SectorsChanges in the prices of energy products used as inputs in production processes affect the production costs of outputs in different sectors. This, in turn, has an impact on the profitability and competitiveness of the products in domestic and global markets. However, not all outputs may be affected by the same degree due to changes in energy prices. The impact, to a large extent, depends on the energy intensity of the specific output, both directly and indirectly.
This study analyzes the direct energy intensity of production sectors using the Input-Output Table of the Bangladesh Economy 2006–07 prepared by the Bangladesh Institute of Development Studies and the General Economics Division of the Planning Commission, under the Ministry of Planning.9 The 2006–07 Input-Output Table identifies economic relations through three accounts: (i) total domestic supply of 86 commodities, (ii) commodity demand accounts for 86 commodities and (iii) four factors of production—two labour types (skilled and unskilled) and two capital categories (capital and land). The commodity classification is the same as the activity classification and covers seven broad categories: (i) agriculture, forestry and fishing; (ii) mining and quarrying; (iii) manufacturing; (iv) construction; (v) electricity, gas and water supply; (vi) trade, hotels, transport and communication; and (vii) services. The energy-related commodities/activities include the following:
• Petroleum refining
• Power plant building
• Electricity and water generation
• Gas extraction and distribution
In the case of electricity and water generation, the share of electricity is taken at 93.7 per cent, while the rest is attributed to water supply. Based on the input-output flow data, the 10 most energy-intensive activities are given in Table 18. The numbers in the table refer to the value of electricity (or petroleum products) needed to produce BDT1,000 worth of the relevant sectoral output. In the case of electricity, service sectors in general require more 9 The Input-Output Table is published by Planning Ministry and is confidential. BIDS has access to it as it is involved in its preparation.

© 2013 The International Institute for Sustainable DevelopmentRESEARCH REPORT AUGUST 2013Energy Subsidies in Bangladesh: A profile of groups vulnerable to reform 23
inputs to produce outputs, although several manufacturing activities (e.g., printing and publishing, electricity and water generation, power plant building, pharmaceutical manufacturing and the paper industry) also fall within the top 10 electricity-intensive sectors.
TABLE 18: ENERGY INTENSITY OF PRODUCTION SECTORS
SECTOR/ACTIVITY COST (IN BDT) PER BDT1,000 OUTPUT VALUEA. Electricity
Education service 12.78
Public administration and defense 12.71
Printing and publishing 11.94
Electricity and water generation 9.36
Health service 8.62
Housing service 7.17
Power plant building 6.68
Pharmaceutical manufacturing 5.69
Wholesale trade 4.82
Paper industry 3.66
B. Petroleum products
Electricity and water generation 128.24
Railway transport 123.75
Basic chemicals 95.75
Rural road building 89.84
Air transport 85.09
Land transport 79.56
Water transport 49.78
Wholesale trade 48.85
Port, road, railway building 38.98
Power plant building 33.15
Source: BIDS-PC (2011).
Table 19 gives the energy intensity in terms of share of electricity and petroleum products in total input costs derived from the Input-Output Table representing the top 15 commodities/activities. The commodities/activities included in the list are very similar to the ones included in Table 18.

© 2013 The International Institute for Sustainable DevelopmentRESEARCH REPORT AUGUST 2013Energy Subsidies in Bangladesh: A profile of groups vulnerable to reform 24
TABLE 19: SHARE OF ENERGY INTENSITY IN TERMS OF TOTAL INTERMEDIATE INPUTS
SECTOR/ACTIVITY % OF ENERGY INPUT IN TOTAL INTERMEDIATE COSTA. Electricity
Education service 4.41Housing service 3.27Public administration and defense 3.25Electricity and water generation 2.92Health service 2.07Printing and publishing 2.01Gas extraction and distribution 1.83Wholesale trade 1.51Retail trade 1.34Pharmaceutical manufacturing 0.83Power plant building 0.82Saw and plane 0.73Wheat cultivation 0.58Cigarette industry 0.58Paper industry 0.54
B. Petroleum productsPetroleum refining 69.56Electricity and water generation 39.98Railway transport 28.06Land transport 26.1Air transport 23.62Wholesale trade 15.28Retail trade 12.48Basic chemicals 12.38Water transport 10.99Rural road building 10.95Health service 6.1Sugarcane cultivation 6.09Port road railway building 5.75Education service 4.89Wheat cultivation 4.06Power plant building 4.06Jute cultivation 3.74
Source: BIDS-PC (2011).
In Bangladesh, like many other developing countries, there are many justifications for providing energy subsidies, ranging from supporting the poor and improving equity to encouraging production for fostering growth and development. Energy subsidies, however, are often very costly and may run counter to the goal of sustainable development.

© 2013 The International Institute for Sustainable DevelopmentRESEARCH REPORT AUGUST 2013Energy Subsidies in Bangladesh: A profile of groups vulnerable to reform 25
4.0 Concluding RemarksThis analysis shows that energy subsidies in Bangladesh have been rising fast in recent years and are becoming increasingly difficult for the government to sustain with its limited fiscal resources. Analyzing how different occupational groups focus their resources on different forms of energy shows how to best benefit needy groups, while highlighting where subsidies are only lining the pockets of those who are better off. The share of household expenditure tends to rise with income for gasoline, CNG and LPG, while the share of expenditure on diesel declines with income. The share of expenditure on electricity does not show any uniformity in terms of variation with income, but the share of expenditure on electricity is very low.
Being exploratory in nature, this analysis has been limited to identifying the profiles of occupational groups and production sectors that are likely to be more vulnerable to subsidy reforms in the energy sector. The relative consumption of energy products across different occupational groups have been described, which provides the idea about the potential direct effects of subsidy removal on household welfare. Similarly, the more vulnerable production sectors are identified by the energy intensity of their production processes.
This analysis, however, does not take into account second-round and indirect effects working through price and other channels across different sectors of the economy that are caused by an initial adjustment in energy prices. The existing literature corroborates that such indirect effects could be important and, in some cases, could surpass the direct effects, especially if the impacts of subsidy reforms on food prices are taken into account. The analysis of such economy-wide effects across different sectors and over various occupational groups would require the use of an appropriately designed modelling framework capable of analyzing both direct and indirect effects, along with their distributional consequences, in an integrated manner.
The present analysis, which uses a household expenditure survey and an input-output framework, provides information on those who benefit from the existing subsidy and the potential effects of subsidy removal on various groups. Of course, there always remains the possibility of passing at least some of the cost increases through to the consumers. This can be an important reference point for conducting an in-depth analysis on the potential winners and losers of energy subsidy reforms and assess the adequacy of compensation measures that could be planned.
In the context of Bangladesh, energy subsidies can have benefits, such as support for the poor, job creation, industry protection and providing the poor greater access through reducing prices. But the fact remains that energy subsidies also carry significant costs that affect all groups, including the poor, by reducing resources available for financing priority investments like education, health, infrastructure and social protection measures for the poor. The policy dilemma is therefore bringing appropriate balance to these costs and benefits by designing a subsidy scheme that achieves the desired benefits with the lowest overall costs. The broad findings of this review suggest several points for consideration:
• Although the poor benefit more from diesel subsidies, it is not an efficient pro-poor expenditure because it is universal. Given the growing fiscal burden, it is desirable to reform the diesel subsidy system with the objective of providing more efficient, cost-effective support directed at the poor.
• A significant share of electricity subsidies arise from excessive losses or failure to collect bills, which cannot be economically justified and should be actively reduced.
• Electricity subsidies through generalized underpricing are likely to be regressive, and much better targeting may be achieved through a carefully designed tariff structure. Volume-differentiated tariffs appear to perform

© 2013 The International Institute for Sustainable DevelopmentRESEARCH REPORT AUGUST 2013Energy Subsidies in Bangladesh: A profile of groups vulnerable to reform 26
better in this respect than do increasing block tariffs. Cross-subsidies for tariffs and for connection charges between different classes of users can be an important instrument, but are of limited use where overall connection rates are low.
• Social safety nets can provide a more effective way of reaching the poor, but the degree of mistargeting and leakages are critical factors that determine the efficiency and effectiveness of these programs.
• As energy subsidies can result in a large fiscal burden, the design of subsidy schemes should include a time-bound phase-out strategy during their inception. Transparency is critical to ensuring the success of any subsidy reform program. There should be full public knowledge and awareness regarding the aims of providing subsidies, which groups benefit, by how much, how much it costs, how long the subsidy will be provided, how it will be phased out, and how the “saved” resources will be spent, such that a proper evaluation of the subsidy reform policies can be made by all concerned. These issues need further consideration in terms of how best to address them in policy contents and implementation designs.
It is often argued that, even when the net social benefits of energy subsidies are positive for specific consumer groups, such benefits are not likely to be positive for the economy as a whole. Moreover, energy subsidies may not be the most efficient way of achieving the social goals in a country like Bangladesh. On the other hand, subsidies to renewable energies may be considered an effective way of overcoming market barriers to their development and deployment and may be promoted in the country in a planned manner. Similarly, a case can be made for subsidizing clean fossil-fuel technologies, including those that improve the efficiency of fuel consumption. An important policy concern, however, is to recognize that large energy subsidies limit the scope for using scarce resources that could otherwise be used to deliver basic and essential services. Moreover, all energy subsidies are not likely to have perfect efficiency and they are likely to suffer from some “common diseases,” such as problem of capture, creating perverse incentives and gradually declining performance quality over time. More importantly, subsidy reform can help address the power crisis that Bangladesh is presently facing. It can help improve transparency and efficiency of electricity companies and free up resources to invest back into the system, for maintaining and expanding energy infrastructure, deploying renewable energy and undertaking energy efficiency initiatives, along with other development efforts.
A major priority of future research is therefore to explore the possibility of developing a system to review and adjust energy subsidies in an orderly and timely manner that considers alternative energy efficiency requirements and involves designing programs that take into account the wider impacts on different occupational groups and social parameters.

© 2013 The International Institute for Sustainable DevelopmentRESEARCH REPORT AUGUST 2013Energy Subsidies in Bangladesh: A profile of groups vulnerable to reform 27
ReferencesBangladesh Bureau of Statistics. (2011). Household Income & Expenditure Survey 2010. Dhaka: Ministry of Planning. Retrieved from http://www.bbs.gov.bd/PageWebMenuContent.aspx?MenuKey=320
Bangladesh Institute of Development Studies and Global Subsidies Initiative of the International Institute for Sustainable Development. (2012). A citizen’s guide to energy subsidies in Bangladesh. Dhaka and Geneva. Retrieved from http://www.bids.org.bd/files/ffs_bangladesh_czguide.pdf
Bangladesh Petroleum Corporation. (2007). Annual report. Dhaka: BPC.
Bangladesh Petroleum Corporation. (2008). Annual report. Dhaka: BPC.
Bangladesh Petroleum Corporation. (2009). Annual report. Dhaka: BPC.
Bangladesh Petroleum Corporation. (2010). Annual report. Dhaka: BPC.
Bangladesh Petroleum Corporation. (2011). Annual report. Dhaka: BPC.
Bangladesh Petroleum Corporation. (2012). Annual report. Dhaka: BPC.
Bangladesh Power Development Board. (2006). Annual report. Dhaka: BPDB.
Bangladesh Power Development Board. (2008). Annual report. Dhaka: BPDB.
Bangladesh Power Development Board. (2009). Annual report. Dhaka: BPDB.
Bangladesh Power Development Board. (2010). Annual report. Dhaka: BPDB.
Bangladesh Power Development Board. (2011). Annual report. Dhaka: BPDB.
Bangladesh Power Development Board. (2012). Annual report. Dhaka: BPDB.
Bangladesh Petroleum Corporation (2012) Statement of profit/(loss) and contribution to national exchequer 2011-12. Dhaka: BPC.
Ellis, J. (2010). The effects of fossil fuel subsidy reform: A review of modelling and empirical studies. Geneva: Global Subsidies Initiative of the International Institute for Sustainable Development. Retrieved fromhttp://www.iisd.org/gsi/sites/default/files/effects_ffs.pdf
GSI-IISD. (2010). Subsidy estimation: A survey of current practise. Geneva: Global Subsidies Initiative of the International Institute for Sustainable Development. Retrieved from http://www.iisd.org/gsi/sites/default/files/sub_manual.pdf
Koplow, D. (2010). Subsidy estimates: A review of assumptions and omissions. Cambridge: Earth Track.
Ministry of Finance, Government of the People’s Republic of Bangladesh. (2012a). Bangladesh Economic Review 2012. Dhaka: MOF.
Ministry of Finance. (2009). Budget. Dhaka: MOF, Government of the People’s Republic of Bangladesh.
Ministry of Finance. (2010). Budget. Dhaka: MOF, Government of the People’s Republic of Bangladesh.
Ministry of Finance. (2011). Budget. Dhaka: MOF, Government of the People’s Republic of Bangladesh.

© 2013 The International Institute for Sustainable DevelopmentRESEARCH REPORT AUGUST 2013Energy Subsidies in Bangladesh: A profile of groups vulnerable to reform 28
Ministry of Finance. (2012b). Budget. Dhaka: MOF, Government of the People’s Republic of Bangladesh.
PETROBANGLA. (2011a, June). Marketing: Category-wise annual gas sales. Retrieved from http://www.petrobangla.org.bd/data_marketing_category.php
PETROBANGLA. (2011b, June). Production: Production of gases in BFC per annum. Retrieved from http://www.petrobangla.org.bd/data_production_pgbpa.php
Planning Commission. (2011). 6th Five Year Plan FY2011–FY2015: Accelerating growth and reducing poverty, Part 2: Sectoral strategies, programmes and policies. Dhaka: General Economics Division, Planning Commission, Government of the People’s Republic of Bangladesh.
Planning Commission. (2012). Perspective plan of Bangladesh 2010–2021: Making Vision 2021 a reality. Dhaka: General Economics Division, Planning Commission, Government of the People’s Republic of Bangladesh.

www.iisd.org/gsi GSI is an initiative of the International Institute for Sustainable Development
Further details and contact informationFor further information contact Kerryn Lang at [email protected] or +41 22 917 8920 or email [email protected].
International Institute for Sustainable DevelopmentGlobal Subsidies InitiativeInternational Environment House 2, 9 chemin de Balexert, 1219 Châtelaine, Geneva, SwitzerlandTel: +41 22 917-8373 | Fax: +41 22 917-8054