Hawaii Energy Storage Seminar: Other Energy Storage Technologies

© 2018 QUANTA TECHNOLOGY, LLC
QUANTA TECHNOLOGY, LLC 4020 WESTCHASE BOULEVARD, SUITE 300, RALEIGH, NC 27607 USA
Toronto | Oakland | Chicago | Boston | San Clemente www.Quanta Technology-Technology.com
Quanta Technology, LLC is a wholly-owned subsidiary of Quanta Technology Services, Inc. (NYSE: )
PREPARED FOR: Puget Sound Energy (PSE)
REPORT DATE: April 23, 2019 (Version 4a)
PREPARED BY:
Abhishek Thurumalla [email protected]
(510) 272-2791
Hisham Othman [email protected]
919-744-5096
Energy Storage Planning To Support BAINBRIDGE ISLAND
Final Report

FINAL REPORT
ENERGY STORAGE PLANNING TO SUPPORT BAINBRIDGE ISLAND | PSE
© 2018 QUANTA TECHNOLOGY, LLC PAGE ii
Report Contributors:
• Abhishek Thurumalla • Hisham Othman
VERSION HISTORY:
Version Date Description
0.1 9/07/2018 Draft Report
0.2 10/5/2018 Updated Draft Report – Revised the planning criteria; Updated the analysis, and Report format per feedback received from PSE on 9/27/2018.
1 10/31/2018 Updated Draft Report – Corrected typo-graphical errors and enhanced the report readability in response to comments from received PSE on 10/25/2018.
2 2/19/2019 Updated Version 1 of the report to address new comments from PSE and included a stacked review analysis.
3 4/12/2019 Updated Version 2 of the report to address few editorial comments from PSE and to also include revenue stacking analysis of the Storage Only (Option) solution.
4 4/23/2019 Updated to address few editorial comments from PSE.
4a Scrutinized CEII data

FINAL REPORT
ENERGY STORAGE PLANNING TO SUPPORT BAINBRIDGE ISLAND | PSE
© 2018 QUANTA TECHNOLOGY, LLC PAGE iii
EXECUTIVE SUMMARY
Quanta Technology, LLC, was retained by Puget Sound Energy (PSE) to investigate the feasibility of designing an optimized energy storage solution to resolve three areas of known grid constraints in the Kitsap Peninsula, at the lowest cost. The three areas include Seabeck area, Bainbridge Island, and rest of Kitsap Peninsula.
The study findings are organized into three reports, one for each study area. This report focuses on Bainbridge Island and supports PSE’s transmission planning and engineering teams with identifying and designing competitive non-wire alternative (NWA) solutions using energy storage.
Quanta Technology has followed its proven three-phase process with evaluation and decision points in between: 1) screening of candidate projects, 2) detailed siting and sizing, and 3) detailed techno-economic evaluations of candidate projects. The study started by analyzing and quantifying the T&D grid challenges as the peak winter load forecast evolves over time. Candidate storage solutions were then postulated during the screening phase and evaluated for technical efficacy and cost effectiveness. The promising solutions were further analyzed and optimized using Quanta Technology’s customized siting and sizing tools, and simulated using industry standard tools such as Synergi.
This Bainbridge Island study focused on a 10 year planning horizon (2018 through 2027) using a baseline load forecast scenario that includes Demand Side Management (DSM) and a Ferry charging station starting its operation in 2021; and addressed three system needs1, namely:
- transmission reliability (Winslow Tap outages2) - substation capacity (group) - feeder reliability (Winslow-13)
The study concludes that these three system needs can be resolved using either a conventional T&D solution or an energy storage solution consisting of a group of 5 storage systems appropriately located and sized.
The conventional T&D solution was proposed by PSE planners and was analyzed in this study to ensure its technical efficacy in meeting the three system needs. The storage solution was also carefully designed to address each of the three system needs. The storage solution’s overall size was methodically optimized by exploiting the following levers: (1) existing PSE feeder switching schemes, (2) proposing modifications to the switching schemes to enable shifting more loads between feeders, and (3) finding sites where one storage solution can address two or three of the system needs
1 Based on Bainbridge Island Electric System Needs Assessment Report, PSE Strategic System Planning, May 14, 2018 draft 2 PSE Strategic System Planning identified a new system need in January, 2019 for replacing aging infrastructure on the Winslow 115kV Tap related to wishbone wood cross-arm construction of the line. This study does not recommend a battery storage solution to address the need of replacing Winslow tap aging infrastructure, as battery storage can provide only a limited period of backup for a system outage and cannot support prolonged outages from system failure.

FINAL REPORT
ENERGY STORAGE PLANNING TO SUPPORT BAINBRIDGE ISLAND | PSE
© 2018 QUANTA TECHNOLOGY, LLC PAGE iv
simultaneously. The detailed siting and sizing analysis in Task 3 (Section 6) details all the steps taken in this study to optimize the storage solution.
The optimized storage solution requires 5 storage systems to mitigate the capacity and reliability needs in the Bainbridge Island as tabulated below.
ID Location Storage-Only Solution System Need
1 PMA-13/WIN-12 3.2 MW/ 9 MWH Winslow Tap Reliability
2 WIN-13
4.4 MW/20 MWH 4.2 MW/12 MWH
Winslow Tap Reliability & Winslow-13 Feeder Reliability Winslow-13 Feeder Reliability (exclusive)
3 MUR-17/WIN-15 3.4 MW/ 15 MWH Winslow Tap Reliability 4 MUR-15 0.4 MW/ 0.4 MWH Winslow Tap Reliability
5 Murden Cove Distribution Station 13.7 MW/ 34.8 MWH Winslow Tap Reliability &
Substation Capacity Needs Total 29.3 MW / 91.2 MWH All 3 Needs
The lifetime economic analysis of the optimized storage-only solutions was compared against the conventional T&D solution over the 10 year planning horizon, and the results are tabulated below.
3 Conventional T&D solution asset life of 45 years 4 Storage-Only solution asset life of 15 years 5 Costs are July 2018 PSE cost estimate based on similar past projects in other areas of PSE service territory. Does not include site-specific engineering. 6 Costs do not include interconnection costs, land and permitting costs, and other costs associated with distribution automation
7 See Appendix A which describes the Levelized Real Cost Analysis Method
All Costs are Present Value ($M) Conventional T&D Solution3
Storage-Only Solution4
Storage-Only Solution (Option)4
Application Distribution Capacity & Reliability
Distribution Capacity & Reliability
Distribution Capacity & Reliability (Excluding
WIN-13 feeder reliability)
Project Need Date 2018 2018 2018
Storage Size MW/MWh Min Size to Meet System Needs
Upsized to Mitigate Degradation
- -
29.3MW / 91.2 MWh 29.3MW / 111 MWh
25.1MW / 79.2 MWh 25.1MW / 97 MWh
Capital Investment – Conventional Storage
$24.25
-
-
$43.26
-
$37.76

FINAL REPORT
ENERGY STORAGE PLANNING TO SUPPORT BAINBRIDGE ISLAND | PSE
© 2018 QUANTA TECHNOLOGY, LLC PAGE v
Quanta Technology utilized its detailed storage models and its expertise in benefit/cost modeling. The analysis included all the relevant cost components such as capital and O&M, taking into account storage lifecycles, efficiency, and capacity fading issues. However, it does not include interconnection costs, land and permitting costs and other costs associated with distribution automation. This study finds the storage-only solution to be over 3 times more expensive in meeting the system needs than the conventional T&D solution.
PSE requested an optional storage-only solution for meeting 2 needs – Winslow Tap Reliability & Substation Capacity Need. WIN-13 reliability need was determined to be met with a planned construction of conventional feeder undergrounding project in 2019-2020. Removing the WIN-13 feeder reliability need, reduces the size of the storage-only solution to 25.1 MW/79.2 MWH (97 MWH – upsized for battery degradation). The cost of the optional storage-only solution for meeting 2 needs is $37.7M (2018 dollars) and approximately 2.8 times of the conventional wire solution cost.
The study examined in detail the economic potential of the storage assets to provide additional service and thus offset their costs. Two potential services were analyzed, the system capacity service and the energy arbitrage. The additional revenues generated by the excess capacity of the storage assets after meeting the system needs were relatively small, with a 10 year present value of $2.4M for the Storage-Only solution, and $2.1M for the Storage-Only (Option) solution. Thus after accounting for the revenue stacking opportunities, the storage solutions were still around 3 times the cost of the conventional solution.
It is important to note that care should be exercised when comparing storage solutions to conventional T&D solutions. Each solution has additional attributes (e.g., benefits and risks) that have not been evaluated in this analysis. For example, the energy storage solution can address reliability needs for a finite amount of time (assumed 8 hours for transmission outages and 4 hours for distribution outages) whereas the conventional T&D solution provides a solution with an indefinite time. This analysis focused on the primary function of each solution in terms of grid capacity and/or reliability to accommodate projected load development for a period of 10 years beyond the installation date (2019-2029). It is challenging to procure and install the battery systems within 12 months, although it is not impossible. Beyond that period, the economics and ease of expanding each solution to accommodate further load development might be significantly different. Additionally, each type of solution might provide additional system, customer, or economic benefits that are not captured in this analysis. A comprehensive long-term comparative evaluation is beyond the scope of this study.
Total $24.25 $43.56 $37.76
Capital Levelized Real Cost7 (over 10 years) $10.0 $32.6 $28.2
O&M Cost (over 10 years) $0.4 $1.6 $1.4
Total Cost (over 10 years) $10.4 $34.1 $29.6
Cost Ratio 100% 328% 284%

FINAL REPORT
ENERGY STORAGE PLANNING TO SUPPORT BAINBRIDGE ISLAND | PSE
© 2018 QUANTA TECHNOLOGY, LLC PAGE vi
TABLE OF CONTENTS
EXECUTIVE SUMMARY .......................................................................................................... iii List of Figures .......................................................................................................................................... viii List of Tables ............................................................................................................................................. ix
1 INTRODUCTION .............................................................................................................. 1
2 STUDY METHODOLOGY ................................................................................................... 2
3 BAINBRIDGE ISLAND – BACKGROUND INFORMATION ..................................................... 5 3.1 Peak Load Forecast .......................................................................................................................... 5 3.2 Distribution System .......................................................................................................................... 6 3.3 Ferry Terminal Charging Station ...................................................................................................... 8 3.4 PSE Relevant Solution Criteria and System Needs ........................................................................... 8
4 TASK 1: REVIEW SYSTEM CONSTRAINTS .......................................................................... 9
5 TASK 2: REVIEW CONVENTIONAL SOLUTIONS ................................................................ 11
6 TASK 3: DETAILED SITING AND SIZING OF STORAGE SOLUTIONS .................................... 12 6.1 Storage Siting and Sizing Analysis for Winslow Transmission Tap Reliability Need ...................... 12
6.1.1 Storage Siting and Sizing to Mitigate Overloads in Distribution Feeders ............................ 12
6.1.2 Storage Siting and Sizing to Mitigate Overloads in Murden Cove Distribution Transformer ......................................................................................................................... 17
6.1.3 Storage Placement Options ................................................................................................. 19
6.2 Storage Siting and Sizing for Substation Group Capacity Need ..................................................... 24 6.2.1 Storage Sizing for Substation Group Capacity Need ............................................................ 24
6.3 Storage Siting and Sizing for Winslow 13 Reliability Needs ........................................................... 26 6.4 Summary of Storage Siting and Sizing Analysis.............................................................................. 28 6.5 Storage System Price Estimates ..................................................................................................... 28 6.6 Summary ........................................................................................................................................ 30
7 TASK 4: TECHNO-ECONOMIC EVALUATION .................................................................... 32 7.1 Analysis Methodology .................................................................................................................... 32 7.2 Economic Assumptions .................................................................................................................. 32
7.2.1 Utility Capital Structure ........................................................................................................ 32
7.2.2 Asset Depreciation Schedules .............................................................................................. 33
7.2.3 Capex and Opex ................................................................................................................... 33
7.2.4 Life Cycles and Capacity Degradation .................................................................................. 34
7.2.5 Storage Size .......................................................................................................................... 34
7.3 Economic Analysis Results Summary – Without Market Revenues .............................................. 34

FINAL REPORT
ENERGY STORAGE PLANNING TO SUPPORT BAINBRIDGE ISLAND | PSE
© 2018 QUANTA TECHNOLOGY, LLC PAGE vii
7.4 Economic Analysis Results Summary – With Market Revenues .................................................... 35 7.4.1 Revenue Stacking Potential of the Storage-Only Solution ................................................... 35
7.4.2 Revenue Stacking Potential of the Storage-Only (Option) Solution .................................... 35
7.4.3 Comparative Analysis with Market Revenues...................................................................... 35
8 CONCLUSIONS .............................................................................................................. 37
9 APPENDIX A – LEVELIZED REAL COST ANALYSIS ............................................................. 39
10 APPENDIX B – REVENUE STACKING POTENTIAL OF STORAGE-ONLY SOLUTION............... 40 10.1 Hourly Storage Requirements to Address Needs: ......................................................................... 40 10.2 System Capacity Service: ............................................................................................................... 42 10.3 Energy Price Arbitrage: .................................................................................................................. 43 10.4 Optimized Revenue Stacking: ........................................................................................................ 46
11 APPENDIX C – REVENUE STACKING POTENTIAL OF STORAGE-ONLY (OPTION) SOLUTION ..................................................................................................................... 47
11.1 Hourly Storage Requirements to Address Needs: ......................................................................... 47 11.2 System Capacity Service: ............................................................................................................... 49 11.3 Energy Price Arbitrage: .................................................................................................................. 50 11.4 Optimized Revenue Stacking: ........................................................................................................ 53

FINAL REPORT
ENERGY STORAGE PLANNING TO SUPPORT BAINBRIDGE ISLAND | PSE
© 2018 QUANTA TECHNOLOGY, LLC PAGE viii
List of Figures Figure 2-1. Study methodology. .................................................................................................................... 2 Figure 3-1. Bainbridge Island study area. ..................................................................................................... 5 Figure 3-2. Distribution feeders on Bainbridge Island. ................................................................................. 7 Figure 6-1 System Configuration and Feeder Loadings after Winslow outage .......................................... 13 Figure 6-2 Murden Cove 17 to 15 load shifting .......................................................................................... 15 Figure 6-3 Storage Sizing for Transmission Reliability Needs considering distribution feeder capacity limits ............................................................................................................................................................ 16 Figure 6-4 Murden Cove Transformer Loading without Ferry Load ........................................................... 17 Figure 6-5 Storage State of Charge Requirements - Without Ferry Load ................................................... 18 Figure 6-6 Bainbridge Island Storage Sizes and Sites to Address Transmission Reliability (Winslow Tap Outage) ....................................................................................................................................................... 19 Figure 6-7 Murden Cove - 16 Storage Siting .............................................................................................. 20 Figure 6-8 Murden Cove - 17 storage siting ................................................................................................ 21 Figure 6-9 Port Madison 13 storage siting .................................................................................................. 22 Figure 6-10 Murden Cove - 15 storage siting .............................................................................................. 23 Figure 6-11 Bainbridge Island - Load Profile Without Ferry ....................................................................... 24 Figure 6-12 Bainbridge Island - Load Profile with Ferry (constrained Period) ............................................ 25 Figure 6-13 Storage State of Charge ........................................................................................................... 26 Figure 6-14 Storage Output ........................................................................................................................ 26 Figure 6-15 Winslow 13 proposed upgrade to Underground Section ........................................................ 27 Figure 10-1: Storage Max Hourly Requirements for Substation Group Capacity Need by Month and Hour (taken as the higher of MW% or MWh%) ................................................................................................... 41 Figure 10-2: Storage Max Hourly Requirements for All 3 Needs by Month and Hour (taken as the higher of MW% or MWh%) .................................................................................................................................... 41 Figure 10-3: Available Storage Capacity after Meeting System Needs ...................................................... 42 Figure 10-4: Average Locational Marginal Prices (LMP) by Month and Hour ............................................ 44 Figure 10-5: Average Daily Profile (24 hours) ............................................................................................ 44 Figure 10-6: Cumulative Arbitrage Gross Profit for 1-4 Storage Capacity Hours ....................................... 45 Figure 10-7: Arbitrage Gross Annual Profit for 1-4 Storage Capacity Hours.............................................. 45 Figure 10-8: Annual Arbitrage Profit (2019 – 2037).................................................................................... 46 Figure 11-1: Storage Max Hourly (MW) Requirements for Substation Group Capacity Need by Month and Hour ............................................................................................................................................................ 48 Figure 11-2: Storage Max Hourly (MWH) Requirements for the 2 Needs by Month and Hour ................. 48 Figure 11-3: Available Storage Capacity after Meeting System Needs ...................................................... 49 Figure 11-4: Average Locational Marginal Prices (LMP) by Month and Hour ............................................ 51 Figure 11-5: Average Daily Profile (24 hours) ............................................................................................ 51 Figure 11-6: Cumulative Arbitrage Gross Profit for 1-4 Storage Capacity Hours ....................................... 52 Figure 11-7: Arbitrage Gross Annual Profit for 1-4 Storage Capacity Hours.............................................. 52 Figure 11-8: Annual Arbitrage Profit (2019 – 2037).................................................................................... 53

FINAL REPORT
ENERGY STORAGE PLANNING TO SUPPORT BAINBRIDGE ISLAND | PSE
© 2018 QUANTA TECHNOLOGY, LLC PAGE ix
List of Tables Table 3-1. Projected Normal Winter Peak Load (MVA) of Bainbridge Island ............................................... 6 Table 3-2. Projected Normal Winter Peak Load (MVA) of Bainbridge Island with 100% DSM and Ferry .... 6 Table 3-3 Normal and Emergency Limits of Distribution Transformers ....................................................... 8 Table 4-1 Downtown Winslow Feeder group capacity limits ..................................................................... 10 Table 5-1. Proposed Conventional Solution and its Estimated Cost ........................................................... 11 Table 6-1: Summary of Battery Solution Siting and Sizing Analysis ........................................................... 28 Table 6-2 Storage System Costs .................................................................................................................. 29 Table 6-3 Siting and Sizing of Storage-Only Solution .................................................................................. 30 Table 7-1. Techno-Economic Analysis Summary ........................................................................................ 34

FINAL REPORT
ENERGY STORAGE PLANNING TO SUPPORT BAINBRIDGE ISLAND | PSE
© 2018 QUANTA TECHNOLOGY, LLC PAGE 1
1 INTRODUCTION
Quanta Technology has collaborated with Puget Sound Energy (PSE) to investigate the feasibility of applying energy storage solutions to address three known areas of constraints in the Kitsap peninsula. The locations of the constraints are:
1. Town of Seabeck Area (West Kitsap) 2. Bainbridge Island (Supplied from Kitsap Peninsula) 3. Kitsap Peninsula (Whole Peninsula)
This report focuses on Bainbridge Island. Quanta Technology uses a three phase methodology: 1) Screening, 2) Detailed Siting and Sizing, and 3) Techno-economic analysis, which includes modeling and understanding the constraints, reviewing of conventional solutions, optimizing the siting and sizing of storage, benefit cost analysis, and life cycle cost analysis. Bainbridge Island was examined for standalone energy storage solutions.
The following sections describe in greater detail the energy storage planning methodology, describe the existing constraints and conventional solutions, assess the viability of energy storage as a technical and economical solution for the constraints, determine the storage site and size requirements, and perform a comparative economic study including the lifetime costs and benefits of the energy storage solutions as compared to the conventional solutions.

FINAL REPORT
ENERGY STORAGE PLANNING TO SUPPORT BAINBRIDGE ISLAND | PSE
© 2018 QUANTA TECHNOLOGY, LLC PAGE 2
2 STUDY METHODOLOGY
The Study methodology is performed in three major phases; Phase 1 - Review Conventional Solutions, System constraints and Need Years; Phase 2 - siting, sizing, and preliminary designs of energy storage solutions; and Phase 3 - detailed techno-economic evaluations of candidate projects (Figure 2-1 below).
Figure 2-1. Study methodology.
This study addresses the reliability and capacity needs of the Bainbridge Island transmission and distribution system for the 10 year period of 2018-2027 with storage-only solution. The projected system load assumes the implementation of DSM initiatives and addition of 10 MW ferry charging station in 2021. The study is organized into 4 tasks as follows:
• Task 1: Review System Constraints
The reliability and capacity needs of the Bainbridge Island’s grid that have been addressed in this study follow, along with a commentary on the implications for the storage siting and sizing:
o Winslow Tap reliability: Winslow substation experienced 22 outages over a 6 year period (2012-2017), an average of nearly 4 substation outages per year. Nearly 70% (15 out of 22) of the Winslow substation outages were caused by the loss of Winslow transmission tap due to tree related events. Therefore, the storage solution should be sized to securely serve the load that would have been interrupted after the outage of the Winslow substation, while accounting for any potential support from Murden Cove and Port Madison substations.
o Substation Capacity requirements: Considering PSE planning guidelines, the substation group capacity planning trigger of 85% (or 84 MVA) for Winslow, Murden Cove and Port Madison substations will be exceeded after the addition of ferry load at Murden Cove Distribution Station. Therefore, the storage solution should be sized to mitigate the overage of the substation group utilization capacity limit.
FINAL REPORT
ENERGY STORAGE PLANNING TO SUPPORT BAINBRIDGE ISLAND | PSE
© 2018 QUANTA TECHNOLOGY, LLC PAGE 3
o Winslow–13 feeder reliability: The storage solution should be sized to carry the entire load served by the feeder until the restoration work is completed, in order to improve the reliability indices of SAIDI and CMI.
• Task 2: Review Conventional Solutions:
The study assessed the technical efficacy of a conventional solution (that was developed by PSE planning team) in addressing the three system needs that were identified in Task 1.
• Task 3: Detailed Siting and Sizing of Storage Solutions
The storage systems were initially sited and sized to address each of the three system constraints, and then optimized to leverage their locational synergies to address multiple (i.e., two or three) system needs simultaneously. The following elaborates on the methodology used to address each system need.
Storage Siting and Sizing for Winslow Tap Reliability:
o Storage size (MW and MWh) is optimized to provide backup to Winslow substation load for up to 8 hours5 after outage of the Winslow transmission tap.
o Using PSE’s existing switching schemes, the feeders at Winslow Substation are first switched onto feeders at Murden Cove and Port Madison distribution stations and then the storage size requirements for each overloaded feeder is determined.
o The possibility of load shifting from the heavily loaded to lightly loaded feeders is investigated in order to optimize the storage size requirements.
o Due to the nature of the load profile of the ferry charging station served by the Murden Cove substation, which differs from the other system load profiles, the analysis of the storage sizes is taken in two steps. The initial step of the analysis quantifies the storage sizes without the ferry load, and then the second step increments the storage sizes to account for the ferry load.
o After the feeder switching scheme and the recommended load shifting operations, the storage size is further analyzed to mitigate any distribution transformer overloads above the winter emergency limit of 36 MVA.
o If a storage system is located on a feeder, its siting along a feeder is selected to mitigate overloads on all the sections of the feeder and to avoid reverse power flow as protection systems in the distribution grid generally have visibility only in one direction.
o The MW size of a storage system is determined using a snapshot of the system model at the highest peak load, while the storage capacity in MWh is determined using a “state of charge” simulation using time-series power flow analysis with an hourly-resolution (i.e., 8760 snapshots) over a whole year.
Storage Siting and Sizing for Substation Capacity needs:
5 PSE required 8-hour backup of substation load for a transmission outage to provide sufficient time for crews to restore transmission service. A 4-hour backup of feeder load was required for feeder outage restoration.

FINAL REPORT
ENERGY STORAGE PLANNING TO SUPPORT BAINBRIDGE ISLAND | PSE
© 2018 QUANTA TECHNOLOGY, LLC PAGE 4
o The storage size required to mitigate any violations of the substation group capacity utilization limit are investigated, considering the ferry load to be in service starting in the year 2021.
o Individual substation capacity utilization limits are expected to be resolved by load shifting from substations exceeding their capacity limit to relatively lightly loaded substations. Therefore, such needs are not considered in this analysis.
Storage Siting and Sizing for Winslow 13 Reliability Needs6:
o In order to have a comparable performance to the conventional solution, the storage size is optimized to back up the entire feeder’s load for 4 hours.
• Task 4: Techno-Economic Modeling. o The storage and conventional solutions are modeled side-by-side for the planning horizon of
10 years. o A Financial model of the storage solution and the conventional solution is developed to
capture all the pertinent costs (capital and O&M), leading to a comparative analysis between the two solutions.
6 Bainbridge Island Electric System Needs Assessment, PSE Strategic System Planning, May 14, 2018

FINAL REPORT
ENERGY STORAGE PLANNING TO SUPPORT BAINBRIDGE ISLAND | PSE
© 2018 QUANTA TECHNOLOGY, LLC PAGE 5
3 BAINBRIDGE ISLAND – BACKGROUND INFORMATION
The aggregate winter peaking load on Bainbridge Island is predominantly all-electric heating, and reached 77 MW in peak winter (2016/17) and 26 MW in peak summer (2017). The Bainbridge Ferry terminal has proposed a new 10 MW electric ferry charging station in 2021 at its terminal on Bainbridge Island.
The three 25 MVA substation transformers on the island approach and are projected to exceed the 85% group capacity threshold despite on-going demand side management (DSM) programs.
This study explores the application of energy storage to address the capacity and reliability needs of energy delivery in the Island for the 10 year period of 2018 through 2027.
Figure 3-1. Bainbridge Island study area.
3.1 Peak Load Forecast PSE forecasts (Table 3-1) the normal winter peak load to increase by 11 MVA (14%) for 2018 through 2027, and by an additional 13 MVA (14%) for 2027 through 2037, without DSM measures. However,

FINAL REPORT
ENERGY STORAGE PLANNING TO SUPPORT BAINBRIDGE ISLAND | PSE
© 2018 QUANTA TECHNOLOGY, LLC PAGE 6
with full implementation of all planned DSM measures, the winter peak is expected to decline by 1 MVA (-1%) 2018 through 2027, and to increase by 11 MVA (14%) 2028 through 2037.
The proposed Ferry charging station in 2021 will increase the projected peak load by 10-13 MVA over a 20 year forecast horizon. It is worth noting that the planning criteria sets the combined normal (N-0) loading limit of the 3 distribution substations at 84 MVA (i.e., 85% of the winter normal rating of 99 MVA), which will trigger a need for capacity upgrades by 2021 as shown in Table 3-2.
Table 3-1. Projected Normal Winter Peak Load (MVA) of Bainbridge Island
Load in Bainbridge Island 2017 2027 2037
Without Ferry Without DSM
80 91 104
With DSM 79 90
With Ferry Load (10 MW)
Without DSM 80
101 117
With DSM 89 101
The planning criteria for this study considers a base scenario that includes the Ferry charging station and 100% DSM. Under this planning scenario, the normal peak load forecast (MVA) is shown in Table 3-2.
Table 3-2. Projected Normal Winter Peak Load (MVA) of Bainbridge Island with 100% DSM and Ferry
Year 2017 2018 2019 2020 2021 2022 2023 2024 2025 2026 2027
MVA 80 83 82 81 90 89 90 92 91 91 89
Year 2028 2029 2030 2031 2032 2033 2034 2035 2036 2037
MVA 89 90 92 92 93 94 96 98 100 101
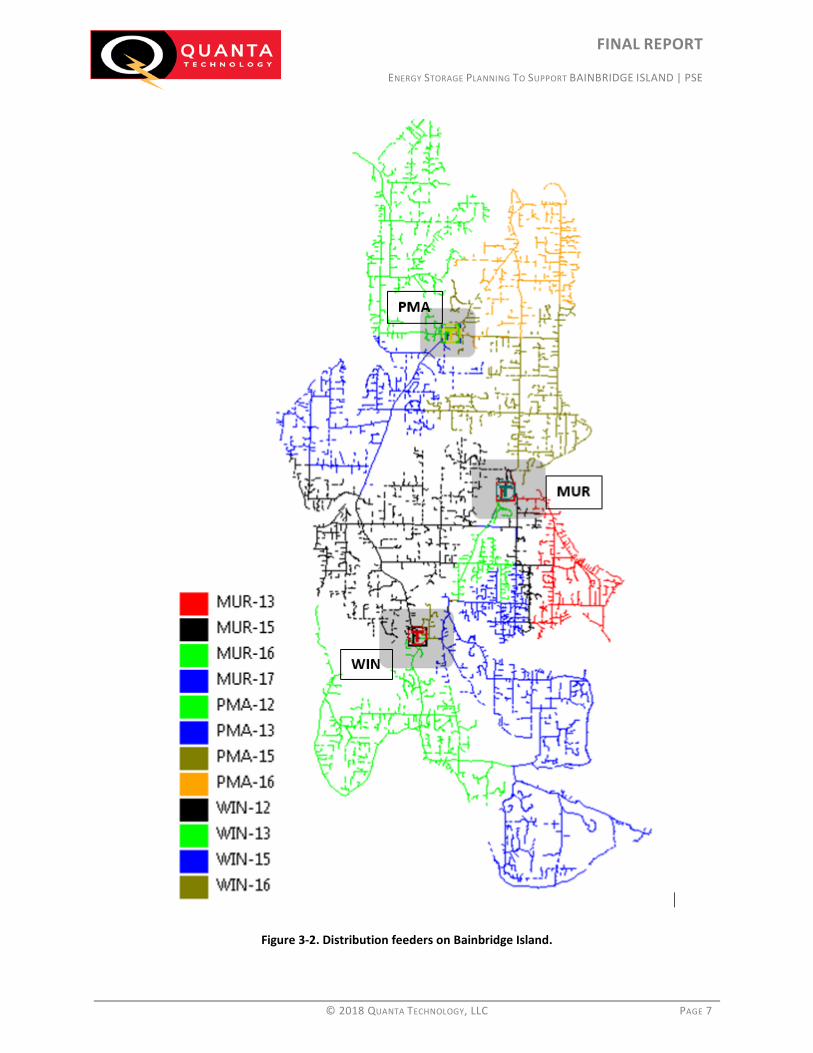
3.2 Distribution System Bainbridge Island load is served from 12 feeders:
- 4 feeders from Port Madison substation (PMA-12, PMA-13, PMA-15, PMA-16), - 4 feeders from Murden Cove substation (MUR-13, MUR-15, MUR-16, MUR-17), and - 4 feeders from Winslow substation (WIN-12, WIN-13, WIN-15, WIN-16).
All three substations utilize the PSE standard 115-12kV 25 MVA transformers. Table 3-3 shows the winter normal and emergency ratings for PSE distribution transformers.
For Bainbridge Island, all feeders have UG portions that parallel another feeder, so the ratings for two feeder running in a common trench of 486A or 10.5 MVA were used in the capacity analysis.
FINAL REPORT
ENERGY STORAGE PLANNING TO SUPPORT BAINBRIDGE ISLAND | PSE
© 2018 QUANTA TECHNOLOGY, LLC PAGE 7
Figure 3-2. Distribution feeders on Bainbridge Island.
FINAL REPORT
ENERGY STORAGE PLANNING TO SUPPORT BAINBRIDGE ISLAND | PSE
© 2018 QUANTA TECHNOLOGY, LLC PAGE 8
Table 3-3 Normal and Emergency Limits of Distribution Transformers
Distribution Transformers in Bainbridge Island
Substations Winter Normal Limit Winter Emergency Limit
PORT MADISON 33 MVA 36 MVA
MURDEN COVE 33 MVA 36 MVA
WINSLOW 33 MVA 36 MVA
3.3 Ferry Terminal Charging Station Washington State Ferries has proposed a new 10 MW electric ferry charging station at its terminal on Bainbridge Island. The charging station is assumed to be served by a new feeder out of the Murden Cove substation.
3.4 PSE Relevant Solution Criteria and System Needs The following are the key relevant criteria that were used in this study in assessing and designing solutions:
1. Planning Horizon: Within the ten year study period (2018 through 2027). However, the solution should address system needs for 10 years after the project is put in service.
2. Load Forecast: Normal winter and summer peak forecast with 100% conservation and with the Ferry charging station.
3. Distribution substation group utilization ≤ 85% of winter normal limit (i.e., 84 MVA). 4. Distribution substation individual utilization ≤ 100% of winter normal limit (i.e., 33 MVA). 5. Distribution overhead feeder loading ≤100% of normal limits (i.e., 600 A or 12.95 MVA at 12.47
kV nominal voltage) for N-0 and applicable N-1 scenarios. 6. Distribution underground feeder loading ≤100% of normal limits (i.e., 486 A or 10.5 MVA) for
N-0 and applicable N-1 scenarios. 7. Reliability: Must not increase non-MED SAIDI and non-MED SAIFI. For PSE worst performing
circuit, solution must reduce the top driver annually by 50%.
The three system needs that should be addressed by all solutions are: 1. Transmission reliability (loss of Winslow Tap) – required transmission backup for 8 hours. 2. Substation grouping capacity (N-0) 3. WIN-13 distribution reliability – required backup for 4 hours7
7 Bainbridge Island Electric System Needs Assessment, PSE Strategic System Planning, May 14, 2018 draft

FINAL REPORT
ENERGY STORAGE PLANNING TO SUPPORT BAINBRIDGE ISLAND | PSE
© 2018 QUANTA TECHNOLOGY, LLC PAGE 9
4 TASK 1: REVIEW SYSTEM CONSTRAINTS
The study reviewed the historical performance of the Bainbridge grid against the three identified system needs and summarized the following observations.
Transmission Reliability:
• Winslow substation had 22 outages over a 6 year period (2012-2017), an average of nearly 4 substation outages per year. Nearly 70% (15 out of 22) of the Winslow substation outages were caused by the loss of Winslow transmission tap due to tree related events. The remaining 7 Winslow substation outages were part of blackout events (6 out of 7 were tree related) impacting the entire Bainbridge Island.
• A 115 kV bus outage at a substation will simultaneously drop all substations on the island resulting in a blackout.
• Under N-1-1 contingencies resulting in loss of two of the three backbone transmission lines in Central Kitsap County, the third backbone transmission line gets overloaded. To prevent transmission line overload under N-1-1 contingency, PSE utilizes an Interim Operating Plan to shed load in North Kitsap County and/or Bainbridge Island.
• The loss of two of the three bulk transformers supplying Kitsap peninsula (N-1-1 contingency) results in overloading the third bulk transformer and voltage collapse on the peninsula, which impacts Bainbridge Island.
Distribution
• Station Capacity - The N-1 distribution station capacity is a concern, and not a system need. The system need is -
substation group capacity utilization exceeding 85% (or 84 MVA) in 2021 with the Ferry load addition. Additional substation capacity might be needed under normal conditions (N-0) as early as 2021 with the Ferry charging station load and with DSM.
• Feeder Capacity - Group of feeders supplying Downtown Winslow exceed 83% feeder group capacity utilization in
2021. - PMA-15 is currently over planning trigger, and WIN-12 & 13 will be the same. However,
considering 100% of feeder capacity as per PSE guidelines, there are no feeder capacity needs during the 2018-2027 study year.
Distribution Substation Group
The distribution substations each have a normal winter rating of 33 MVA and emergency winter rating of 36 MVA (Table 3-3). Therefore, under N-0, the substation group capacity is 99 MVA and under N-1, the substation group capacity is 72 MVA. Based on the projected load growth described in Table 3-1 and PSE planning guidelines of 85% of Substation Group capacity utilization, the need for additional capacity in the with DSM Scenario is in year 2021 upon commissioning of the ferry load fed from Murden Cove distribution substation. Without ferry load, there is no need for additional substation capacity in the 2018-2027 study period.

FINAL REPORT
ENERGY STORAGE PLANNING TO SUPPORT BAINBRIDGE ISLAND | PSE
© 2018 QUANTA TECHNOLOGY, LLC PAGE 10
Distribution Feeder Group Capacity Winslow Downtown Area
The Winslow area feeder group consists of WIN-15, WIN-16, MUR-13, MUR-16, and MUR-17. The feeders are comprised of both overhead and underground conductors. The ferry load addition is planned on a new dedicated feeder from the Murden Cove Distribution Station and this is not a part of Winslow downtown area feeder group. The feeder group planning trigger and capacity limits are shown in Table 4-1 below.
Table 4-1 Downtown Winslow Feeder group capacity limits
Limit Limit (Amps)
N-0 Planning Trigger UG 2015 N-1 Planning Trigger UG 1944
N-0 Capacity UG 2430
During the study period of 2018 through 2027, the maximum feeder group loading reaches 1540 Amps in the With DSM Scenario and 1692 Amps in the Without DSM Scenario. Therefore, there is no need for additional distribution feeder capacity in the Winslow downtown area during the study period.

FINAL REPORT
ENERGY STORAGE PLANNING TO SUPPORT BAINBRIDGE ISLAND | PSE
© 2018 QUANTA TECHNOLOGY, LLC PAGE 11
5 TASK 2: REVIEW CONVENTIONAL SOLUTIONS
The conventional solution provided by PSE is to build a new 115 KV transmission line connecting Winslow and Murden Cove substations, and a new distribution substation with a 115 kV/12.5 kV transformer. Table 5-1 below provides a detailed description and cost estimate of the proposed solution. This allows all substations to backup each other and to supply needed capacity for the future.
Table 5-1. Proposed Conventional Solution and its Estimated Cost
Scope of Work
2018 Unit Cost
Estimate1
2018 Cost Estimate1
2018 Cost Estimate w/ 25% contingency1
1. Build 3 miles of new overhead 115 kV line b/w Murden Cove and Winslow on public
ROW $2.5 M/mi. $7.5 M $9.4 M
2. Expand Winslow substation bus to bring
second 115 kV line. Install 2-115 kV breakers.
$1.5 M $1.9 M
3. Expand Murden Cove substation bus to bring second 115 kV line.
$0.8 M $1.0 M
4. Build new 115-13 kV distribution substation on transmission loop.
$8.0 M $10.0 M
5. Install 4-13 kV feeder getaways at new distribution substation. $1.0 M/mi. $1.0 M $1.25 M
6. Convert a section on Winslow 13 feeder to Under Ground $ 0.64 M $ 0.8 M
TOTAL Cost
$19.44 M1 $24.35 M1
1Costs are July 2018 Puget Sound Energy cost estimate based on similar past projects in other areas of PSE service territory. Does not include the site-specific engineering costs.

FINAL REPORT
ENERGY STORAGE PLANNING TO SUPPORT BAINBRIDGE ISLAND | PSE
© 2018 QUANTA TECHNOLOGY, LLC PAGE 12
6 TASK 3: DETAILED SITING AND SIZING OF STORAGE SOLUTIONS
The siting and sizing analysis considers the three system needs: transmission reliability, distribution group capacity, and WIN-13 distribution reliability. Each of the 3 system needs is analyzed to determine the corresponding storage capacity requirement, and then combined into an overall sizing recommendation.
6.1 Storage Siting and Sizing Analysis for Winslow Transmission Tap Reliability Need
Winslow substation had 22 outages over a 6 year period (2012-2017), an average of nearly 4 substation outages per year. Nearly 70% (15 out of 22) of the Winslow substation outages were caused by the loss of Winslow transmission tap due to tree related events.
A storage-only solution is investigated to address the low reliability of Winslow Tap, and to determine the storage capacity requirements under the outage of Winslow Substation. Upon switching of feeders from Winslow distribution station to Murden Cove and Port Madison distribution stations, storage capacity requirements to mitigate overloads on individual distribution feeders and transformers are determined. Storage size requirements for each of these elements are described below.
6.1.1 Storage Siting and Sizing to Mitigate Overloads in Distribution Feeders
The initial stage of the investigation assessed potential violations of the distribution feeder limits after the switching of Winslow feeders onto the other feeders under the outage of Winslow tap according to the switching schemes provided by PSE. The second stage of the analysis examined any potential overloads of the substation transformer.
The analysis revealed that switching of Winslow substation load to adjacent substations on loss of transmission, causes capacity violations on the system and that the need year is current. The installation year is assumed to be 2019 and the storage was designed to address system needs through year 2029. In the period of 2019-2029 With DSM Scenario, the load forecast in the year 2019 is the highest and is used to determine the storage size requirements.
Two strategies to optimize the storage capacity were investigated:
- Load shifting (from loaded feeders to under-loaded feeders). - Enhanced feeder switching scheme.
Under the outage of Winslow transmission tap, Winslow – 12, 13, 15 and 16 feeders are switched onto Murden Cove and Port Madison distribution station using PSE switching schemes as follows:
- Winslow 12 feeder is switched onto Port Madison 13 feeder by closing 17-282 switch. This switching operation ties Port Madison -13 and Winslow 12. WIN12-L switch at the Winslow Station is open to avoid loops in the system.
- Winslow 13 and 16 feeders are switched onto Murden Cove 16 feeder. Initially, Winslow 13 and 16 feeders are tied together by closing 17-1145-P4 switch. The Winslow 13 and 16 feeders are

FINAL REPORT
ENERGY STORAGE PLANNING TO SUPPORT BAINBRIDGE ISLAND | PSE
© 2018 QUANTA TECHNOLOGY, LLC PAGE 13
switched onto Murden Cove 16 by closing WE00511switch. WIN13-L and WIN16-L switches at the Winslow Distribution station are opened to avoid loops in the system.
- Winslow 15 feeder is switched onto Murden Cove – 17 by closing WE00512 switch. This switching operation ties Murden Cove -17 and Winslow 15. WIN15-L switch at the Winslow Station is open to avoid loops in the system.
Upon switching the feeders from Winslow to Murden Cove and Port Madison Distribution station with the above switching schemes, Murden Cove-16, 17 and Port Madison – 13 feeders are found to be overloaded. Figure 6-1 below shows the feeders’ loading and system configuration after applying the switching scheme.
Figure 6-1 System Configuration and Feeder Loadings after Winslow outage
Assuming an 8 hour restoration time for Winslow Tap, the following are the storage requirements for the 3 overloaded feeders.
• MUR 16 – 4.4 MW/20 MWH • MUR 17 – 8 MW/45 MWH • PMA 13 – 3.2 MW/9 MWH
Therefore the total storage requirements are 15.6 MW/74 MWH.
Possible reduction in storage size requirements is investigated next using different load shifting schemes by switching portions of load from the overloaded feeders to the feeders which are lightly loaded using the switches at existing tie points.
Feeders for MURDEN COVE Demand - MVAMUR-13 9.218MUR-15 5.959MUR-16 14.082MUR-17 17.788
MURDEN COVE Totals 47.029Feeders for PORT MADISON Demand - MVA
PMA-12 5.718PMA-13 13.444PMA-15 9.285PMA-16 5.446
PORT MADISON Totals 33.876

FINAL REPORT
ENERGY STORAGE PLANNING TO SUPPORT BAINBRIDGE ISLAND | PSE
© 2018 QUANTA TECHNOLOGY, LLC PAGE 14
Load Shifting:
Considering the lightly loaded feeders such as MUR – 15, PMA – 12, 16 from Figure 6-1, load shifting from these overloaded feeders is investigated to optimize the storage sizes required.
Shifting appropriate amount of load from Murden Cove – 17 to Murden Cove – 15 feeder without overloading Murden Cove – 15 greatly reduces the storage requirements for Murden Cove -17 feeder. This can be achieved by closing switch 17-811-P4 which ties MUR – 15 and 17 and opening switch 17-618. This switching operation does not create any loops and no load is unfed.
The storage requirement, post this switching operation, for Murden Cove – 17 reduces from 8 MW/45 MWH to 3.4 MW/15.2 MWH. However, this leads to an overload of MUR-15 feeder and a storage of 0.4 MW/0.4 MWH is required to mitigate this overload. Figure 6-2 below shows the configuration of Murden Cove 15 and 17 feeders and their loadings after the proposed load shifting operation. The final storage capacity requirements to address the Winslow tap outage are as follows:
• Site (1): PMA 13 – 3.2MW/ 9 MWH • Site (2)8: MUR 16 – 4.4 MW/20 MWH • Site (3)8: MUR 17 – 3.4 MW/15 MWH • Site (4): MUR 15 – 0.4 MW/ 0.4 MWH
Therefore, the total storage requirements considering load shifting is 11.4 MW/44.4 MWH. The possible storage sites are shown below in Figure 6-3 and is discussed in detail in Section 6.1.3.
8 Site (2) and Site (3) are possibly located on the WIN-13/ MUR-16 & WIN-15/ MUR-17 feeders to accommodate storage requirement for both MUR-16 and MUR-17.

FINAL REPORT
ENERGY STORAGE PLANNING TO SUPPORT BAINBRIDGE ISLAND | PSE
© 2018 QUANTA TECHNOLOGY, LLC PAGE 15
Figure 6-2 Murden Cove 17 to 15 load shifting

FINAL REPORT
ENERGY STORAGE PLANNING TO SUPPORT BAINBRIDGE ISLAND | PSE
© 2018 QUANTA TECHNOLOGY, LLC PAGE 16
Figure 6-3 Storage Sizing for Transmission Reliability Needs considering distribution feeder capacity limits
In Figure 6-3 above, preliminary recommendations on battery sites are shown and described below:
• The battery requirements for Port Madison 13 feeder of 3.2 MW/9 MWH is shown as site (1) in the figure above.
• The battery requirements for Murden Cove 16 feeder of 4.4 MW/20 MWH is shown as site (2) in the figure above. Site (2) can be located either on Winslow 13 or Murden Cove 16 feeders appropriately to mitigate thermal overloads on all sections of the feeder and avoid reverse power flow as detailed in Section 6.1.3.
• The battery requirements for Murden Cove 17 feeder of 3.4 MW/15 MWH is shown as site (3) in the figure above. Site (3) can be located either on Winslow 15 or Murden Cove 17 feeders appropriately to mitigate thermal overloads on all sections of the feeder and avoid reverse power flow as detailed in Section 6.1.3.
• The battery requirements for Murden Cove 15 feeder of 0.4 MW/0.4 MWH is shown as site (4) in the figure above.

FINAL REPORT
ENERGY STORAGE PLANNING TO SUPPORT BAINBRIDGE ISLAND | PSE
© 2018 QUANTA TECHNOLOGY, LLC PAGE 17
As observed from Figure 6-2 above, the Murden Cove Distribution transformer is loaded to 47 MVA which exceeds the 36 MVA capacity limit under Winter N-1 conditions. Storage needs for the distribution transformer is investigated in Section 6.1.2.
6.1.2 Storage Siting and Sizing to Mitigate Overloads in Murden Cove Distribution Transformer
Under the outage of Winslow transmission tap, the Murden Cove distribution transformer loading reaches 47 MVA, well above its emergency rating of 36 MVA9. A storage solution is investigated to mitigate this overload. The storage sizing is initially performed without the Ferry charging load, and then updated to reflect the base planning scenario with the Ferry load due the difference of the load profile of the ferry charging station from the system load.
Figure 6-4 shows the loading on Murden Cove distribution transformer without ferry load. The storage size required to mitigate the overload on Murden Cove distribution transformer for the most constraining 8 hour window is 11.3 MW/49 MWH. The storage state of charge is shown in Figure 6-5.
To reflect base planning scenario with the ferry load, storage requirements to accommodate ferry load at Murden Cove distribution station in addition to the existing load fed from the distribution station is described below.
Figure 6-4 Murden Cove Transformer Loading without Ferry Load 9 Based on the emergency rating standards of the transformer, the battery sizes may differ.
Transformer Emergency Rating (36 MVA)

FINAL REPORT
ENERGY STORAGE PLANNING TO SUPPORT BAINBRIDGE ISLAND | PSE
© 2018 QUANTA TECHNOLOGY, LLC PAGE 18
Figure 6-5 Storage State of Charge Requirements - Without Ferry Load
Considering the ferry load to be interconnected on a new feeder connected to the Murden Cove Substation, the storage size to mitigate the needs of Murden Cove Distribution Station needs to be upsized to accommodate the ferry load. In the year 2029, the ferry load is forecasted to be 10.2 MW. With one operation per hour and each operation lasting for 15 minutes at 10.2 MW, the energy consumption by the ferry load per hour is 2.55 MWH.
For the most constraining period of 23rd February 6 AM-2 PM, the loading on Murden Cove Transformer under Winslow Outage is shown above in Figure 6-4, with the threshold of 36 MVA (Transformer Limit). As observed from Figure 6-4 below, the load during the most constraining period of 6 AM – 2 PM is above the transformer limits almost all that time (6 AM – 1 PM). Therefore, there would not be a possibility of feeding the ferry load during this period from the Murden Cove distribution station.
Therefore to accommodate the ferry load additional storage capacity of 10.55 MW and 2.65 MWH for each constrained hour (considering 97% discharge efficiency) is required. Therefore, considering ferry load and a constrained period of 8 hours under Winslow tap outage, additional storage capacity needed is 10.55 MW/ 21.2 MWH for the Murden Cove distribution transformer.
Therefore considering ferry load, the total size requirement to mitigate the overloads on the Murden Cove Distribution Station Transformer for Winslow tap transmission outage is 21.85 MW/70.2 MWH i.e. aggregate of transformer storage need (11.3 MW/49 MWH) and ferry storage need (10.55 MW/21.2 MWH). The Bainbridge Island storage solution site and size requirements are shown in Figure 6-6.

FINAL REPORT
ENERGY STORAGE PLANNING TO SUPPORT BAINBRIDGE ISLAND | PSE
© 2018 QUANTA TECHNOLOGY, LLC PAGE 19
Figure 6-6 Bainbridge Island Storage Sizes and Sites to Address Transmission Reliability (Winslow Tap Outage)
In Figure 6-6 above, preliminary recommendations on battery sites are shown and described below:
• The battery requirements for Port Madison 13 feeder of 3.2 MW/9 MWH is shown as site (1) in the figure above.
• The battery requirements for Murden Cove 16 and 17 feeders of 4.4 MW/20 MWH and 3.4 MW/15 MWH respectively is shown as site (2) and site (3) in the figure above.
• Under outage of Winslow tap, the battery systems at site (2,3) are connected to the Murden Cove substation and can partially offset the Murden Cove substation requirements of 21.9 MW/ 70.2 MWH. Therefore, the remaining 14.1 MW/35.2 MWH is interconnected at the Murden Cove distribution station or its corresponding feeders to address the Murden Cove distribution station needs. This is represented as site (4,5) in the figure above.
• Site (4) (0.4 MW/0.4 MWH) needs to be interconnected to Murden Cove 15 feeder to mitigate the overloads observed and site(5) (13.7 MW/34.8 MWH) could be interconnected at Murden Cove substation and its corresponding feeders.
• Detailed siting of individual battery systems are discussed in the following section.
6.1.3 Storage Placement Options
Storage siting is investigated in detail in this section considering the loadings on different sections of the overloaded feeders. The storage site along the feeder is selected with the following objectives:

FINAL REPORT
ENERGY STORAGE PLANNING TO SUPPORT BAINBRIDGE ISLAND | PSE
© 2018 QUANTA TECHNOLOGY, LLC PAGE 20
- Mitigate feeder overloads. A storage will reduce overloads upstream of its location and thus should be located downstream of all overloaded segments of the feeder.
- Avoid reverse power flows. A storage should not be located too far downstream of the substation that it can create reverse power flow on sections of the feeder, when discharged.
In the following plots, the feeder sections highlighted in red are heavily loaded considering a 9.5 MVA threshold (Feeder limit is 10.5 MVA. 1 MVA margin is considered). Therefore, the batteries need to be sited downstream of such sections to mitigate overloads. The sections highlighted in Yellow are lightly loaded sections considering the storage size requirements on these feeders. The sections highlighted in pink are the recommended interconnection sites for the storage sizes determined.
Figure 6-7 Murden Cove - 16 Storage Siting
Considering a storage requirement of 4.4 MW/20 MWH for MUR-16 and the storage operation at 0.8 power factor, the rated power output from the storage is 5.5 MVA. The 0.8 power factor is selected because there is KVAr demand from the supply side. The reactive power injection from the battery reduces the MW requirements of the battery and mitigates the loadings to the prescribed MVA limits. The storage needs to be sited at a location such that after the Winslow Tap outage and feeder switching, overloads need to be mitigated on all feeder sections without any reverse power flow. Considering these limitations, it is recommended that the storage need of 4.4 MW/20 MWH for MUR-16 be sited on the sections highlighted in Pink where the power flow is between 9.5 MVA and 6 MVA. This is approximately at a distance of 1 mile to 3.5 miles from the Murden Cove substation along the MUR-16, WIN-16 and WIN-13 feeders after the switching of Winslow 13 and 16 feeders on to Murden Cove 16 feeder after the outage of Winslow Distribution station.
WIN

FINAL REPORT
ENERGY STORAGE PLANNING TO SUPPORT BAINBRIDGE ISLAND | PSE
© 2018 QUANTA TECHNOLOGY, LLC PAGE 21
Figure 6-8 Murden Cove - 17 storage siting
Considering a storage requirement of 3.4 MW/15 MWH for MUR-17 and the storage operation at 0.8 power factor, the rated power output from the storage is 4.25 MVA. The storage needs to be sited at a location such that after the Winslow Tap outage and feeder switching, overloads need to be mitigated on all feeder sections without any reverse power flow. Considering these limitations, it is recommended that the storage need of 3.4 MW/15 MWH for MUR-17 be sited on the sections highlighted in Pink where the power flow is between 9.5 MVA and 4.5 MVA. This is approximately at a distance of 2.2 mile to 4.8 miles from the Murden Cove substation along the MUR-17 and WIN-15 feeders after the switching of Winslow 15 feeders on to Murden Cove 17 feeder after the outage of Winslow Distribution station.

FINAL REPORT
ENERGY STORAGE PLANNING TO SUPPORT BAINBRIDGE ISLAND | PSE
© 2018 QUANTA TECHNOLOGY, LLC PAGE 22
Figure 6-9 Port Madison 13 storage siting
Considering a storage requirement of 3.2 MW/9 MWH for PMA-13 and the storage operation at 0.8 power factor, the rated power output from the storage is 4 MVA. The storage needs to be sited at a location such that after the Winslow Tap outage and feeder switching and load shifting, overloads need to be mitigated on all feeder sections without creating reverse power flow. Considering these limitations, it is recommended that the storage need of 3.2 MW/9 MWH for PMA-13 be sited on the sections highlighted in Pink where the power flow is between 9.5 MVA and 4.5 MVA. This is approximately at a distance of 1.2 mile to 2.8 miles from the Port Madison substation along the PMA-13 and WIN-12 feeders after the switching of Winslow 12 feeder on to Port Madison 13 feeder after the outage of Winslow Distribution station.
WIN
FINAL REPORT
ENERGY STORAGE PLANNING TO SUPPORT BAINBRIDGE ISLAND | PSE
© 2018 QUANTA TECHNOLOGY, LLC PAGE 23
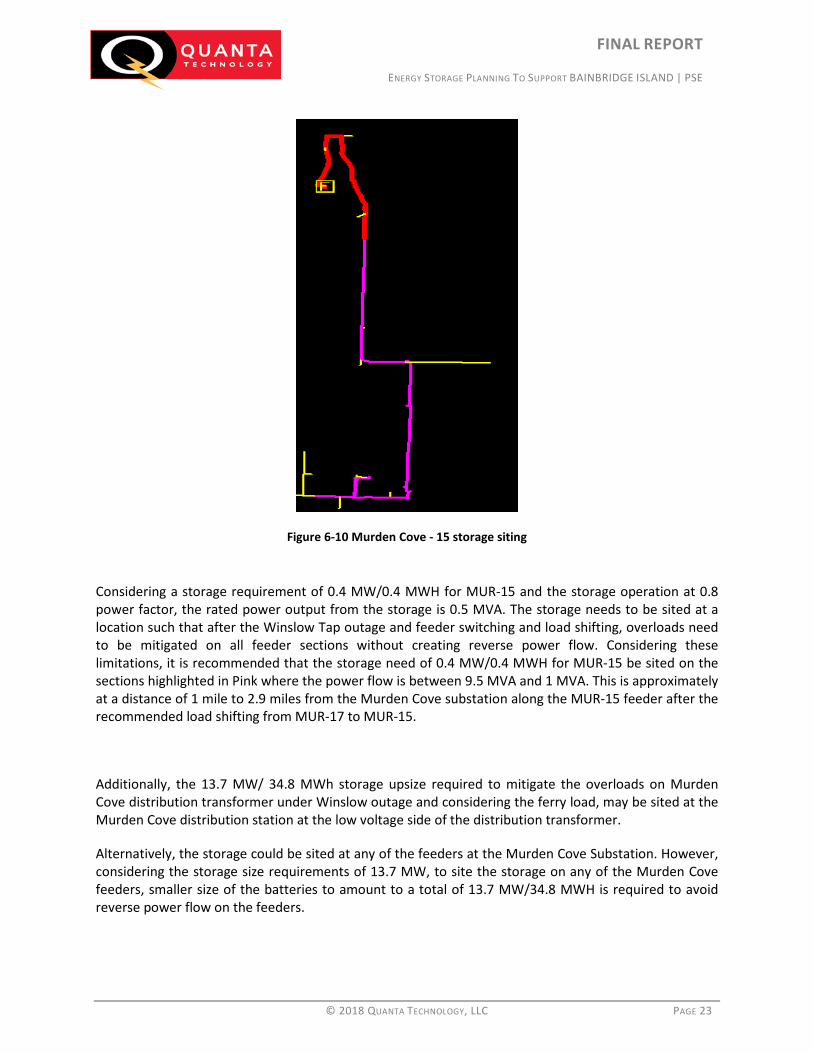
Figure 6-10 Murden Cove - 15 storage siting
Considering a storage requirement of 0.4 MW/0.4 MWH for MUR-15 and the storage operation at 0.8 power factor, the rated power output from the storage is 0.5 MVA. The storage needs to be sited at a location such that after the Winslow Tap outage and feeder switching and load shifting, overloads need to be mitigated on all feeder sections without creating reverse power flow. Considering these limitations, it is recommended that the storage need of 0.4 MW/0.4 MWH for MUR-15 be sited on the sections highlighted in Pink where the power flow is between 9.5 MVA and 1 MVA. This is approximately at a distance of 1 mile to 2.9 miles from the Murden Cove substation along the MUR-15 feeder after the recommended load shifting from MUR-17 to MUR-15.
Additionally, the 13.7 MW/ 34.8 MWh storage upsize required to mitigate the overloads on Murden Cove distribution transformer under Winslow outage and considering the ferry load, may be sited at the Murden Cove distribution station at the low voltage side of the distribution transformer.
Alternatively, the storage could be sited at any of the feeders at the Murden Cove Substation. However, considering the storage size requirements of 13.7 MW, to site the storage on any of the Murden Cove feeders, smaller size of the batteries to amount to a total of 13.7 MW/34.8 MWH is required to avoid reverse power flow on the feeders.

FINAL REPORT
ENERGY STORAGE PLANNING TO SUPPORT BAINBRIDGE ISLAND | PSE
© 2018 QUANTA TECHNOLOGY, LLC PAGE 24
6.2 Storage Siting and Sizing for Substation Group Capacity Need
6.2.1 Storage Sizing for Substation Group Capacity Need
Considering the planning limit of the substation group utilization as per PSE solution criteria, the substation group capacity reaches the 84 MVA limit by the year 2021. Once installed, the storage is required fulfil its purpose for 10 years from the installation date, and thus the storage system should be designed to meet the system needs until Year 2031. The load on Bainbridge Island in the year 2031 is 92.1 MVA as per the Winter Normal Peak Load Forecast and the ferry load addition, and is the highest in the 2021 through 2030 period. Solution designed for the year 2031 is expected to meet the requirements for the 10 year period.
Figure 6-11 shows the load profile from December through February that is considered in this analysis, except for the Ferry charging load. Without the Ferry charging, the load shape exhibits a peak of 81.8 MVA on Feb 23, 2018. The Ferry charging load of 10.3 MW operating for 15 minutes in each hour will be incremental to the load profile.
Storage size requirements are determined by adding the loadings of the three distribution transformers at Port Madison, Winslow and Murden Cove. In the year 2031 and without the ferry load, the peak load totals 83.6 MVA.
Considering the ferry load profile, the hourly load on Bainbridge Island shown in Figure 6-11 is expected to increase by 10.3 MVA which would persist for 15 minutes each hour. With ferry, the load on Bainbridge Island is expected to violate the 84 MVA substation group capacity during 7 AM – 10 AM on the peak load day of FEB 23-2018. Figure 6-12 below shows the peak load for the constrained period on a 15 minute resolution with the ferry load. This profile was used to determine the storage capacity needs for substation group capacity.
Figure 6-11 Bainbridge Island - Load Profile Without Ferry

FINAL REPORT
ENERGY STORAGE PLANNING TO SUPPORT BAINBRIDGE ISLAND | PSE
© 2018 QUANTA TECHNOLOGY, LLC PAGE 25
Figure 6-12 Bainbridge Island - Load Profile with Ferry (constrained Period)
Discharge is required from the storage if the load on the Island is greater than 84 MVA. As shown above (Figure 6-11) and from the calculated peak from the Synergi Electric Model, without the ferry load, there is no requirement for the storage until 2031. The storage discharge is required when the ferry load is operational during high load. Discharge from the storage is required when the load without the ferry exceeds 73.7 MVA, as hourly operation of ferry load would cause the load on the island to exceed 84 MVA.
Discharge from the storage would be required for 15 minutes in each hour when the ferry load is operational (Figure 6-12). The other 45 minutes of the hour, the storage can be charged back based on the available substation capacity considering 84 MVA threshold. The storage is assumed to be operated at 80% power factor.
The Storage State of Charge and storage MW output are shown in Figure 6-13, Figure 6-14 below for the most constraining period 23rd February (7 AM- 11 AM). The total Storage Size requirement is 9.7 MW/5 MWh, for substation group capacity needs, under the planning scenario with the ferry and with DSM.

FINAL REPORT
ENERGY STORAGE PLANNING TO SUPPORT BAINBRIDGE ISLAND | PSE
© 2018 QUANTA TECHNOLOGY, LLC PAGE 26
Figure 6-13 Storage State of Charge
Figure 6-14 Storage Output
6.3 Storage Siting and Sizing for Winslow 13 Reliability Needs The conventional project to address the Winslow 13 reliability need is to convert to underground a portion of the Winslow 13 feeder from the Winslow substation to the tie of Winslow 12 at an estimated cost of $643,000. Figure 6-15 below shows a portion of Winslow 12 and 13 feeders and the proposed upgrade is highlighted.

FINAL REPORT
ENERGY STORAGE PLANNING TO SUPPORT BAINBRIDGE ISLAND | PSE
© 2018 QUANTA TECHNOLOGY, LLC PAGE 27
Figure 6-15 Winslow 13 proposed upgrade to Underground Section
As this upgrade is at the beginning of the feeder, this provides reliability to the entire feeder. Therefore, an equivalent storage solution is considered to support the load on the entire Winslow 13 feeder for 4 hours, which is the estimated restoration time. During the period of 2019-2029, the maximum feeder forecasted load is 393 Amps for the year 2019. The peak demand is estimated to be 8.33 MW, 2.8 MVAR.
Considering the load profile and a maximum of 4 hour outage duration, the total storage size requirements to mitigate the WIN-13 reliability needs are 8.6 MW/32 MWh.
It is worth assessing if the batteries that have been previously selected to mitigate the Transmission Reliability in section 6.1 can also mitigate the reliability needs of WIN-13 feeder.
- The 4.4 MW/20 MWh storage at Site 2 was required to mitigate the overload on Murden Cove -16 feeder due to pick up of Winslow 13 and 16 feeders. As observed from Figure 6-7, the

FINAL REPORT
ENERGY STORAGE PLANNING TO SUPPORT BAINBRIDGE ISLAND | PSE
© 2018 QUANTA TECHNOLOGY, LLC PAGE 28
storage could be sited before/after the tie between Winslow 12 and 13 feeder and hence could be used to serve the reliability needs for Winslow 13 feeder.
- However, the 3.4 MW/15 MWh could not be sited on the Winslow 15 feeder at the tie point of Winslow 15 and 13 shown in Figure 6-8, and therefore, this storage cannot be used to serve the reliability needs of the Winslow 13 feeder.
- Therefore, an additional storage size of 4.2 MW/ 12 MWh is required on Winslow 13 feeder to carry the entire Winslow 13 feeder under an outage.
6.4 Summary of Storage Siting and Sizing Analysis The storage-only solution for the 3 system needs requires 5 battery systems. The sizes and locations of these storage systems is summarized in Table 6-1.
Table 6-1: Summary of Battery Solution Siting and Sizing Analysis
Battery Size <---------Needs --------------> <------------Overloads----------->
ID Site Location Size MW
Size MWh WIN-TAP Sub.
Group WIN-13 Feeder
MUR-16 MUR-17 PMA-13 MC Sub
Trafo Placement Options
1 1 PMA-13 /WIN-12 3.2 9 X X
1.2-2.8 Miles from PMA sub, along PMA-13 or WIN-12
2 2 WIN-13 4.4 20 X X X X
1.0-3.5 Miles from MC sub, along MUR-16, WIN-16, or WIN-13)
WIN-13 4.2 12 X WIN-13
3 3 MUR-17 /WIN-15 3.4 15 X X X
2.2-4.8 Miles from MC sub, along MUR-17 or WIN-15)
4 4 MUR-15 0.4 0.4 X X X 1.0-2.9 Miles from MC sub, along MUR-15
5 5 MC Sub 13.7 34.8 X X X MC sub
Total Battery
Size 29.3 91.2 25.1MW/
79.2MWh Included in WIN-TAP
8.6MW/ 32MWh
4.4MW/ 20MWh
3.8MW/ 15.4MWh
3.2MW/ 9MWh
21.9MW/ 70.2MWh
Note: MC is Murden Cove Substation
6.5 Storage System Price Estimates As the reliability needs for Winslow Tap is in the year 2018, storage is assumed to be installed in the year 2019. Additionally, the storage sizes for Winslow Tap Outage can be used to mitigate Substation capacity needs until the year 2031. The reliability need for Winslow 13 feeder could be addressed

FINAL REPORT
ENERGY STORAGE PLANNING TO SUPPORT BAINBRIDGE ISLAND | PSE
© 2018 QUANTA TECHNOLOGY, LLC PAGE 29
partially using the storage needs determined for Winslow Tap Reliability. An additional 4.2 MW/12 MWH storage is required on Winslow 13 feeder to carry the entire Winslow 13 feeder.
As each of these Storage systems are used to address multiple needs, it is assumed that the BESS is at an adequate State of Charge (SOC) when the need arises commensurate with the time of year and the nature of the system need. For example, for Winslow tap reliability, the storage is only required during specific periods of Winter Peak months; for substation capacity, the storage is only needed during specific hours of February; while for the Winslow 13 feeder reliability, the storage is expected to have a SOC based on the feeder loading at that time to ride through the 4 hour outage. The capacity of the storage systems beyond the system need can be exploited for additional benefits.
The storage costs are shown below for the storage-only solution to address the Winslow Tap Reliability needs, Substation Capacity needs and feeder reliability of Winslow 13. These are installed battery (Li-Ion) system costs and do not include additional interconnection costs, land and permitting costs and other costs associated with distribution automation.
Table 6-2 Storage System Costs10
10 Battery system costs are based on Quanta Technology’s bottom-up estimate methodology

FINAL REPORT
ENERGY STORAGE PLANNING TO SUPPORT BAINBRIDGE ISLAND | PSE
© 2018 QUANTA TECHNOLOGY, LLC PAGE 30
6.6 Summary The three system needs (transmission reliability, substation capacity, and Winslow-13 reliability) can be addressed using conventional T&D solutions, and alternatively using energy storage systems. The Storage solution will require the use of 5 storage systems as follows:
Table 6-3 Siting and Sizing of Storage-Only Solution
ID Location Storage-Only Solution Needs
1 PMA-13/WIN-12 3.2 MW/ 9 MWH Winslow Tap Reliability
2 WIN-13
4.4 MW/20 MWH 4.2 MW/12 MWH
Winslow Tap Reliability & Winslow-13 Feeder Reliability Winslow-13 Feeder Reliability (exclusive)
3 MUR-17/WIN-15 3.4 MW/ 15 MWH Winslow Tap Reliability 4 MUR-15 0.4 MW/ 0.4 MWH Winslow Tap Reliability
5 Murden Cove Distribution Station 13.7 MW/ 34.8 MWH Winslow Tap Reliability&
Substation Capacity Needs Total 29.3 MW / 91.2 MWH All 3 Needs
Table 6-4 summarizes the different needs for Bainbridge Island and the corresponding storage solutions and their corresponding capital investment levels.
Table 6-4 Summary of Conventional, Storage-Only Solution
Conventional T&D ALL-BESS Option
Need Driver Need Year
Solution Costs Storage Sizes (MW/MWH) Costs
Transmission Reliability – Winslow
Current Transmission Loop $12,300,000 25.1 MW/ 79.2 MWH $31,923,804
Substation Group N-0 Capacity 2021 New Distribution
Substation $11,250,000 9.7 MW/ 5 MWH $4,077,290*

FINAL REPORT
ENERGY STORAGE PLANNING TO SUPPORT BAINBRIDGE ISLAND | PSE
© 2018 QUANTA TECHNOLOGY, LLC PAGE 31
Feeder Reliability (WIN-13) Current
Conventional feeder reliability solution, $640k
underground conversion
$640,000 8.6 MW/ 32 MWH $12,550,531**
ALL ALL Above $24,190,000 29.3 MW/ 91.2MWh $36,909,791
Upsizing For Degradation
29.3MW / 111 MWh*** $43,500,000
*- The battery sizes for Transmission Reliability for Winslow Tap can be used for Substation Group Capacity need as well. Therefore, this cost is not included in the total.
**- 4.4 MW/20 MWh battery sized for Transmission Reliability for Winslow Tap is used for Feeder Reliability of WIN-13. This portion of the cost is not included in the total.
*** The capacity of the energy storage system is upsized to mitigate the anticipated degradation over the 10 year planning horizon. For a nominal 2% annual degradation in storage capacity, the storage MWh capacity is upsized by 22% from the level required to address the system needs.

FINAL REPORT
ENERGY STORAGE PLANNING TO SUPPORT BAINBRIDGE ISLAND | PSE
© 2018 QUANTA TECHNOLOGY, LLC PAGE 32
7 TASK 4: TECHNO-ECONOMIC EVALUATION
7.1 Analysis Methodology The economic evaluation of the storage solutions as compared to the conventional T&D solutions requires:
• Lifetime modeling of the cost of each project from inception to retirement inclusive of project development activities and timeline, EPC, O&M, capacity management, replacement, and disassembly and recycling.
• Modeling of relevant utility’s capital structure including debt and equity ratios and costs, and tax rate.
• Proper regulated asset base (RAB) accounting including treatment of depreciation for tax and book purposes.
• Useful life estimates: The conventional T&D solutions have an assumed book life of 45 years, while the energy storage technology is assumed to have a useful life of 15 years for Li-Ion technology (20 years for Flow technology).
We adopted the following methodology to compare the economics of the various solution alternatives:
1. The capacity of the energy storage system is upsized to mitigate the anticipated degradation over the 10 year planning horizon. For a nominal 2% annual degradation in storage capacity, the storage MWh capacity is upsized by 22% from the level required to address the system reliability needs.
2. The capital cost components of each solution alternative is calculated (conventional T&D, and energy storage).
3. However, because of the differences in asset life between the conventional component (45 years) and the storage component (15 years) of any solution, the cost of each component over the 10 year planning horizon is calculated and summed (using present value) to provide a total 10 year capital cost. This calculation utilizes a real economic carrying cost taking into account the company’s weighted average cost of capital and the inflation rate.
4. The present value of the O&M costs over the 10 year planning horizon are calculated and summed for each solution.
5. The overall (capital and O&M) present value costs of all solutions are calculated and compared.
7.2 Economic Assumptions
7.2.1 Utility Capital Structure
The capital structure (debt and equity) of PSE was utilized in the study. A key parameter was calculated from the capital structure, namely the WACC (weighted average cost of capital) to be 6.97%, and was utilized in discounting cash flows to compare investments.

FINAL REPORT
ENERGY STORAGE PLANNING TO SUPPORT BAINBRIDGE ISLAND | PSE
© 2018 QUANTA TECHNOLOGY, LLC PAGE 33
7.2.2 Asset Depreciation Schedules
The following summarizes the depreciation schedules for tax and book purposes for various asset classes:
Depreciation Schedule (Yrs)
Book Straight Line
MACRS for Tax Purposes
Conventional T&D 45 15 Storage Systems 10 7
7.2.3 Capex and Opex
The capital cost of a fully installed and commissioned Li-Ion energy storage system in 2019 was assumed to have two parts, one for the AC power block (inverter, transformers, interconnection) at $250/kW, and the other for the DC energy block (batteries, structures, cables, … etc.) at $325/kWh. These cost rates approximate very well the detailed installed cost of the storage bill of materials that was utilized in Section 6. The cost of storage losses was calculated based on the technology’s indicative roundtrip efficiency of 90%, and a prevailing average cost of energy of $30/MWh.
Conventional T&D solutions capex was estimated by PSE for each project. All estimates were assumed to be in 2018 dollars.
An inflation rate of 2.5% was taken to escalate the project cost. The annual O&M cost of conventional T&D projects was assumed to be 1.5% of the project’s initial capex. The annual O&M cost of Li-Ion storage systems was assumed to be $10/kWh plus 1% of initial capex.
All O&M costs were escalated by 2.5% annually.
For this comparative analysis, several typical cost items in energy storage systems were not considered because they either fell outside the 10 year planning horizon, or the expected storage use cycles is uncertain, including:
Financial Parameters ValueIncome Tax Rate 21.00%Sales Tax 4.76%Debt Ratio 51.50%ESS Debt Repayment Period Yrs 10T&D Debt Repayment Period Yrs 30Solar PV Debt Repayment Period Yrs 20Interest Rate 5.8100%After-Tax Equity Cost 9.50%Cost Escalation p.a. 2.50%Price Escalation p.a. 3.00%Inflation p.a. 2.50%WACC 6.97%Pre-Tax Cost of Capital 7.60%Pre-Tax Return on Rate Base 8.82%Pre-Tax Equity Cost 12.03%

FINAL REPORT
ENERGY STORAGE PLANNING TO SUPPORT BAINBRIDGE ISLAND | PSE
© 2018 QUANTA TECHNOLOGY, LLC PAGE 34
- Inverter replacement was assumed every 10 years and to cost $100/kW. - Cost of disassembly and recycling was assumed to be $50/kWh of storage capacity.
7.2.4 Life Cycles and Capacity Degradation
Storage capacity is assumed to fade with calendar and use, at a rate of 2% per year for a Li-Ion storage if utilized at an average rate of one full cycle per day. A lifecycle curve as a function of depth of discharge was assumed to have 4,500 for full cycles, and increases as the depth of discharge decreases.
7.2.5 Storage Size
The storage capacity is upsized at the installation time to account for the anticipated degradation over the 10 year planning horizon.
7.3 Economic Analysis Results Summary – Without Market Revenues The economics of the two project alternatives are analyzed and compared in Table 7-1 over the 10 year planning horizon, without consideration of any potential market revenues that can be generated by the Storage-Only solution.
Table 7-1. Techno-Economic Analysis Summary
All Costs are Present Value ($M) Conventional T&D Solution
Storage-Only Solution
Storage-Only Solution (Option)
Application Distribution Capacity & Reliability
Distribution Capacity & Reliability
Distribution Capacity & Reliability
(Excluding WIN-13 feeder reliability)
Project Need Date 2018 2018 2018
Storage Size MW/MWh Min Size to Meet System Needs
Upsized to Mitigate Degradation
- -
29.3MW / 91.2 MWh 29.3MW / 111 MWh
25.1MW / 79.2 MWh 25.1MW / 97 MWh
Capital Investment – Conventional Storage Total
$24.21
- $24.21
-
$43.5 $43.5
-
$37.7 $37.7
Capital Levelized Real Cost (over 10 years) $10.0 $32.6 $28.2
O&M Cost (over 10 years) $0.4 $1.6 $1.4
Total Cost (over 10 years) $10.4 $34.1 $29.6
Cost Ratio 100% 328% 284%
1Costs are July 2018 Puget Sound Energy cost estimate based on similar past projects in other areas of PSE service territory. Does not include site-specific engineering

FINAL REPORT
ENERGY STORAGE PLANNING TO SUPPORT BAINBRIDGE ISLAND | PSE
© 2018 QUANTA TECHNOLOGY, LLC PAGE 35
7.4 Economic Analysis Results Summary – With Market Revenues The storage solution was optimized to address the grid needs during peak load periods, and therefore it will have under-utilized capacity during all other periods that can potentially be monetized through participation in other grid services.
Appendix B provides a detailed analysis of the potential revenue streams of the Storage-Only solution from providing system capacity and participation in energy price arbitrage services; while Appendix C provides a detailed analysis of the potential revenue streams of the Storage-Only solution (Option) from providing system capacity and participation in energy price arbitrage services.
7.4.1 Revenue Stacking Potential of the Storage-Only Solution
The present value over 10 years of providing system capacity and participating in energy arbitrage after fulfilling the 3 system needs is estimated optimistically in Appendix B to be 2.4M ($1.66M for energy price arbitrage and $0.75M for system capacity).
7.4.2 Revenue Stacking Potential of the Storage-Only (Option) Solution
The present value over 10 years of providing system capacity and participating in energy arbitrage after fulfilling the 2 system needs is estimated optimistically in Appendix C to be 2.1M ($1.5M for energy price arbitrage and $0.6M for system capacity).
7.4.3 Comparative Analysis with Market Revenues
The analysis in Section 7.3 showed the cost over 10 year for the conventional solution to be $10.4M and for the storage-only solution to be $34.1M. Adjusting the storage-only solution cost with the market revenues will alter the comparison slightly as follows.
Solution Market Participation Level
Storage Solution Net
Cost (over 10 years)
Ratio of Cost of Storage Solution to
Conventional Cost
Storage-Only
Mitigate 3 System Needs: - Win-Tap Reliability - Substation Group Capacity - WIN-13 Feeder Reliability
None
System Capacity Only
Energy Price Arbitrage Only
System Capacity and Energy Price Arbitrage
$34.1M
$33.4M
$32.4M
$31.7M
328%
321%
311%
305%
Storage-Only (Option)
Mitigate 2 System Needs: - Win-Tap Reliability - Substation Group Capacity
None
System Capacity Only
Energy Price Arbitrage Only
System Capacity and Energy Price Arbitrage
$29.6M
$29.0M
$28.1M
$27.5M
284%
279%
270%
264%

FINAL REPORT
ENERGY STORAGE PLANNING TO SUPPORT BAINBRIDGE ISLAND | PSE
© 2018 QUANTA TECHNOLOGY, LLC PAGE 36
The opportunity to participate as well as the cost of participation and market prices of the ancillary services and capacity markets over a 10 year period can be highly uncertain. However, the above cursory analysis provides an indicative view of the potential market revenues and cost comparison between the two solution alternatives.

FINAL REPORT
ENERGY STORAGE PLANNING TO SUPPORT BAINBRIDGE ISLAND | PSE
© 2018 QUANTA TECHNOLOGY, LLC PAGE 37
8 CONCLUSIONS
This study explored the technical and economical efficacy of two alternative solutions to the Bainbridge capacity and reliability needs:
- Conventional T&D solution: The conventional solution proposed by PSE allows all substations to backup each other and supply the needed capacity for the future and includes 3 elements:
o Build a 3 mile 115kV line and tie Winslow and Murden Cove substations. o Build a new 115/13 kV distribution substation. o Convert a section of WIN-13 feeder to underground.
- Storage-Only Solution: Five (5) energy storage systems, with a minimum combined capacity of
29.3 MW/91.2 MWh as follows:
Location Storage-Only Solution
PMA-13/WIN-12 3.2 MW/9 MWH WIN-13 8.6 MW/32 MWH
MUR-17/WIN-15 3.4 MW/ 15 MWH MUR-15 0.4 MW/ 0.4 MWH
Murden Cove Distribution Station 13.7 MW/34.8 MWH
Total (minimum size) 29.3 MW / 91.2 MWH
The capital cost of the Conventional solution is estimated at $24.2M (estimate made by PSE in July 2018 based on similar past projects in other areas of PSE service territory – does not include site-specific engineering), while the capital cost of the Storage-Only solution is estimated at $43.5M. A detailed financial analysis shows the cost of the Storage-Only solution to be over 3 times that of the Conventional solution over the project planning horizon of 10 years.
Conventional T&D ALL-BESS Option
Need Driver Need Year
Solution Costs1 Storage Sizes (MW/MWH) Costs
Transmission Reliability – Winslow
Current Transmission Loop $12,300,000 25.1 MW/ 79.2MWH $31,923,804
Substation Group N-0 Capacity 2021 New Distribution
Substation $11,250,000 9.7 MW/ 5MWH $4,077,290
Feeder Reliability (WIN-13) Current
Conventional feeder reliability solution, $640k
underground conversion
$640,000 8.6 MW/ 32MWH $12,550,531
ALL ALL Above $24,190,0001 29.3 MW/ 91.2MWh $36,909,791 Upsizing For Degradation
29.3MW / 111 MWh $43,500,000

FINAL REPORT
ENERGY STORAGE PLANNING TO SUPPORT BAINBRIDGE ISLAND | PSE
© 2018 QUANTA TECHNOLOGY, LLC PAGE 38
1Costs are July 2018 Puget Sound Energy cost estimate based on similar past projects in other areas of PSE service territory. Does not include site-specific engineering.
The lifetime cost analysis of the Storage-Only solution shows it to be 3 times as expensive as the wire solution. Participation of the Storage-Only solution in the system capacity and energy price arbitrage services does not materially change its comparative cost to the wire solution.

FINAL REPORT
ENERGY STORAGE PLANNING TO SUPPORT BAINBRIDGE ISLAND | PSE
© 2018 QUANTA TECHNOLOGY, LLC PAGE 39
9 APPENDIX A – LEVELIZED REAL COST ANALYSIS
This section presents one method of comparing the costs of two assets that have different useful lives.
Take for example a conventional transmission asset with a useful life of 45 years. Assuming a capital cost of the asset of $1M, and an annual maintenance cost of $15K that escalates at an inflation rate of 2.5% per year. One might want to calculate the appropriate cost of this asset for the first 10 years of its life.
The methodology that has been used in this report, the levelized real cost, converts the capital cost of the asset to a 45 year annuity payment that escalates annually at the inflation rate. Thus, the cost of the asset for the first year of operation is the annuity payment in the first year, and the cost of the second year grows up with the inflation rate and so on. The cost of the asset in the first year is calculated based on the weighted average cost of capital (WACC) of the asset owner so that the present value of the annuity payments is equal to the asset capital cost.
This method is also called the real economic carrying cost method, and can be calculated using the following formulas using Capital Recovery Factors (CFR) for each year as follows:
𝐶𝐶𝐶𝐶𝐶𝐶1 = (𝑑𝑑 − 𝑔𝑔)(1 + 𝑑𝑑)𝑛𝑛
(1 + 𝑑𝑑)𝑛𝑛 − (1 + 𝑔𝑔)𝑛𝑛
𝐶𝐶𝐶𝐶𝐶𝐶𝑛𝑛 = 𝐶𝐶𝐶𝐶𝐶𝐶1 (1 + 𝑔𝑔)𝑛𝑛−1
Where:
d=discount rate (WACC); g=inflation rate; n=asset life
As an example, for the aforementioned $1M asset with $15k annual O&M, assuming a WACC of 6.97%, inflation rate of 2.5%, and asset life of 45 years, the CFR1 = 5.2%, and the present value of the first 10 years of asset capital cost is 41% of the asset capital cost, or $410K. The present value of the O&M cost is $120K for a total 10 year cost of $530k.
FINAL REPORT
ENERGY STORAGE PLANNING TO SUPPORT BAINBRIDGE ISLAND | PSE
© 2018 QUANTA TECHNOLOGY, LLC PAGE 40
10 APPENDIX B – REVENUE STACKING POTENTIAL OF STORAGE-ONLY SOLUTION
The storage-only solution consisting of five (5) battery systems totaling 29.3MW/91.2MWh was designed to address three needs, namely, the Winslow-Tap outage, the substation group loading limit, and the Win-13 feeder outage. The Bainbridge Island system needs vary throughout the year with the load level, and correspondingly, the percentage of the battery size (MW and MWh) that is required to address these system needs will also vary. This provides a commercial opportunity to monetize the excess capacity of the storage solution during periods when the needs are not at their highest levels, in order to offset the cost of the storage investment.
Two monetize-able services that are potentially available to this storage system are system capacity and energy price arbitrage. The Integrated Resource Plan (IRP) of 2017 provides a basis for the valuation of these two potential revenue streams. System capacity is a contracted service and thus has a lower risk as compared to energy price arbitrage which depends on the daily volatility of the locational marginal prices (LMP). The first priority of utilizing the storage system is to address the local needs. Any excess capacity will be utilized to provide system capacity services, and finally any remaining excess capacity will be used to provide energy price arbitrage.
The analysis methodology that was followed in this study to quantify and optimize the revenue streams is summarized in the following 3 steps:
1. Determine the required storage capacity (MW and MWh) for each hour in a year to address the three local needs.
2. Assess the storage availability to provide the system capacity service. 3. Optimize the operating profits from energy price arbitrage.
10.1 Hourly Storage Requirements to Address Needs: The storage solution consisting of five (5) storage systems was designed to address three needs. Two of which (Winslow-Tap outage and WIN-13 feeder outage) are contingent services that are only triggered after the onset of a defined grid outage, while the third need (substation group) is triggered whenever the load level exceeds a prescribed level and thus is not contingent. To address the two types of needs, the storage systems will have to discharge to address the substation group trigger while keeping enough energy (MWh) in reserve to potentially address a subsequent defined outage. Both the discharged MW and the reserve MWh vary hourly throughout the year depending on the load level on specific feeders and substations in the area, as was detailed in Chapter 6.
Figure 10-1 shows the percentage of the storage solution size that is required to address the substation group capacity requirement, while Figure 10-2 shows the required storage solution size (expressed as a percentage of the total planned solution size) that is required to address all three needs. The percentage size is conservatively computed as the higher of either MW rating percentage or MWh rating percentage. The analysis was conducted using the 2019 data which corresponds to the highest peak in the study horizon. The data is tabulated in columns corresponding to each of the 24 hours in a day, and

FINAL REPORT
ENERGY STORAGE PLANNING TO SUPPORT BAINBRIDGE ISLAND | PSE
© 2018 QUANTA TECHNOLOGY, LLC PAGE 41
in rows corresponding to each of the 12 months in a year. For example, at hour ending 8, the maximum discharge for all days in December to address the substation group capacity need will be 22% of the storage solution rating, and at the same time, the storage solution will have to maintain 65% of its rated energy capacity in reserve in anticipation of an outage in accordance with the Winslow-Tap or the Win-13 outage scenarios. Similarly, during June-Sept, the storage solution is not required to address any needs.
Figure 10-1: Storage Max Hourly Requirements for Substation Group Capacity Need by Month and Hour (taken as the higher of MW% or MWh%)
Figure 10-2: Storage Max Hourly Requirements for All 3 Needs by Month and Hour (taken as the higher of MW% or MWh%)
Hourly Max of Battery Requirements for Substation Group (N-0) : MW/MWh (%)Max Colu Row 1 2 3 4 5 6 7 8 9 10 11 12 13 14 15 16 17 18 19 20 21 22 23 24 All1 5% 5%2 31% 33% 20% 5% 33%3456789101112 12% 22% 19% 10% 22%All 31% 33% 20% 10% 33%
Hourly Max of Battery Requirements MW/MWh (%)Max of Colum Row Lab 1 2 3 4 5 6 7 8 9 10 11 12 13 14 15 16 17 18 19 20 21 22 23 24 All1 12% 17% 18% 20% 22% 30% 42% 47% 49% 45% 43% 39% 33% 26% 26% 26% 29% 38% 41% 41% 37% 33% 17% 11% 49%2 26% 37% 49% 61% 69% 83% 84% 79% 69% 58% 51% 49% 47% 47% 72% 71% 66% 61% 63% 59% 53% 48% 36% 22% 84%3 10% 11% 12% 13% 15% 16% 30% 44% 46% 44% 35% 30% 17% 15% 13% 13% 14% 17% 20% 23% 19% 15% 10% 10% 46%4 9% 9% 10% 12% 14% 16% 27% 45% 44% 30% 15% 11% 10% 10% 10% 16% 11% 11% 11% 11% 10% 9% 9% 9% 45%5 8% 8% 8% 10% 11% 13% 21% 46% 49% 44% 40% 30% 17% 9% 10% 14% 16% 18% 29% 29% 28% 23% 9% 8% 49%6 7% 7% 7% 7% 7% 7% 8% 8% 8% 8% 7% 7% 7% 7% 7% 7% 7% 8% 8% 8% 7% 7% 7% 7% 8%7 7% 7% 7% 7% 7% 7% 7% 7% 7% 7% 7% 7% 7% 7% 7% 7% 7% 7% 7% 7% 7% 7% 7% 7% 7%8 6% 6% 6% 6% 6% 6% 6% 6% 6% 6% 6% 6% 6% 7% 7% 7% 7% 8% 8% 8% 7% 7% 6% 6% 8%9 5% 5% 5% 5% 7% 8% 9% 9% 9% 8% 7% 7% 7% 7% 7% 7% 8% 8% 9% 9% 8% 7% 6% 5% 9%10 7% 7% 7% 9% 10% 12% 13% 25% 33% 25% 10% 10% 10% 10% 10% 10% 11% 11% 11% 10% 10% 9% 8% 7% 33%11 12% 14% 16% 18% 20% 23% 39% 47% 47% 46% 44% 42% 40% 40% 35% 35% 34% 41% 39% 38% 35% 32% 20% 12% 47%12 19% 26% 33% 40% 46% 56% 65% 65% 61% 55% 50% 47% 45% 42% 40% 41% 43% 44% 45% 45% 44% 42% 37% 25% 65%All 26% 37% 49% 61% 69% 83% 84% 79% 69% 58% 51% 49% 47% 47% 72% 71% 66% 61% 63% 59% 53% 48% 37% 25% 84%

FINAL REPORT
ENERGY STORAGE PLANNING TO SUPPORT BAINBRIDGE ISLAND | PSE
© 2018 QUANTA TECHNOLOGY, LLC PAGE 42
Figure 10-3: Available Storage Capacity after Meeting System Needs
10.2 System Capacity Service: The Puget Sound IRP in 2017 shows the system capacity price in 2018 through 2024 to be $3.79/kW-yr, and then jumps in 2025 to $78.19/kW-yr and stays at that level through 2037. The system capacity requirements are exclusively during December for each of the 10 hours between 6AM-11AM and 5PM-10PM.
An analysis of the local requirements in Figure 10-1 and Figure 10-2 and the hourly profile of the load in Bainbridge Island reveals the following observations:
• The load peaks in December during HE 8-11AM. • The energy required to shave the peak load in December increases with the level of MW
shaving. A 5 MW peak load shaving requires 3 hours of energy, while a 10MW peak shaving requires 4 hours, and further peak shaving beyond 15MW requires 10 hours.
• During December, the maximum MW discharge of the storage solution during the system capacity hours is 22% of the storage solution rating, while the maximum energy requirement is 65% of the storage rating. At any hour, the MW discharge in addition to the excess storage capacity above the requirement is available to provide the system capacity service. The minimum available percentage of the storage rating for system capacity services is 35%.
• During the 10 system capacity hours in December, the availability of the storage solution to provide system capacity service rises, as a percent of the storage solution rating, from 35% at 7AM to 58% at 10PM.
• The storage solution rating of 29.3MW and 91.2MWh provides only 3.11 hours of continuous discharge capability.
• If the storage aims to provide an equal level of system capacity at each of the 10 hours for each of the days in December, then the maximum level of participation in the system capacity service will be (3.11hr/10hr)x(35%)x(29.3MW) = 3.2MW, earning the full system capacity price. The present value of the system capacity service over 10 year is $0.63M.
• On the other hand, if the storage solution is viewed as a component of a portfolio of capacity solutions, and thus allowed to provide partial capacity for each hour, the storage can maximize
1 2 3 4 5 6 7 8 9 10 11 12 13 14 15 16 17 18 19 20 21 22 23 241 88% 83% 82% 80% 78% 70% 58% 53% 51% 55% 57% 61% 67% 74% 74% 74% 71% 62% 59% 59% 63% 67% 83% 89%
2 74% 63% 51% 39% 31% 17% 16% 21% 31% 42% 49% 51% 53% 53% 28% 29% 34% 39% 37% 41% 47% 52% 64% 78%
3 90% 89% 88% 87% 85% 84% 70% 56% 54% 56% 65% 70% 83% 85% 87% 87% 86% 83% 80% 77% 81% 85% 90% 90%
4 91% 91% 90% 88% 86% 84% 73% 55% 56% 70% 85% 89% 90% 90% 90% 84% 89% 89% 89% 89% 90% 91% 91% 91%
5 92% 92% 92% 90% 89% 87% 79% 54% 51% 56% 60% 70% 83% 91% 90% 86% 84% 82% 71% 71% 72% 77% 91% 92%
6 93% 93% 93% 93% 93% 93% 92% 92% 92% 92% 93% 93% 93% 93% 93% 93% 93% 92% 92% 92% 93% 93% 93% 93%
7 93% 93% 93% 93% 93% 93% 93% 93% 93% 93% 93% 93% 93% 93% 93% 93% 93% 93% 93% 93% 93% 93% 93% 93%
8 94% 94% 94% 94% 94% 94% 94% 94% 94% 94% 94% 94% 94% 93% 93% 93% 93% 92% 92% 92% 93% 93% 94% 94%
9 95% 95% 95% 95% 93% 92% 91% 91% 91% 92% 92% 93% 93% 93% 93% 92% 92% 92% 91% 91% 92% 93% 94% 95%
10 93% 93% 93% 91% 90% 88% 87% 75% 67% 75% 90% 90% 90% 90% 90% 90% 89% 89% 89% 90% 90% 91% 92% 93%
11 88% 86% 84% 82% 80% 77% 61% 53% 53% 54% 56% 58% 60% 60% 65% 65% 66% 59% 61% 62% 65% 68% 80% 88%
12 81% 74% 67% 60% 54% 44% 35% 35% 39% 45% 50% 53% 55% 58% 60% 59% 57% 56% 55% 55% 56% 58% 63% 75%

FINAL REPORT
ENERGY STORAGE PLANNING TO SUPPORT BAINBRIDGE ISLAND | PSE
© 2018 QUANTA TECHNOLOGY, LLC PAGE 43
its participation by focusing on the last 3 hours in the day where it can participate by an average of 70% of its rating, or (56%)x(29.3) = 16.4MW, earning only 30% of the system capacity value (due to its limited energy capacity of 3hrs). The present value of providing system capacity over 10 year is $0.86M.
• Taking the average of the above two methods, to provide an estimated capacity value of $0.75M.
10.3 Energy Price Arbitrage: During the hours when the storage is not required for reliability or not providing system capacity service, it has the potential to arbitrage the energy price by charging during periods of low prices and discharging during periods of high energy prices. The arbitrage potential is analyzed on a day-by-day basis, and only once a day at most to avoid excessive utilization of the storage life cycles. For a storage system with 3 hours of energy capacity, the first storage hour has the potential to generate the most profits because it can discharge at the highest price hour in a day and charge at the lowest price hour in the same day. The second hour of energy capacity will have to settle for the second best discharge and charge hours and thus generate less revenues. Adding all the arbitrage profits after deducting the cost of roundtrip losses provides an estimate of the maximum potential revenue from participation in this service.
The hourly locational energy prices (provided by Puget Sound according to the 2017 IRP) between 2018 and 2037 are averaged and summarized in Figure 10-4 by month and hour of the day, and color coded with red being highest and green being lowest. The average LMP is $56/MWh across the period with a high of $155/MWh and a low of $14/MWh. The average daily profile of the hourly prices is displayed in Figure 10-5 for a 5 individual years between 2019 and 2037 along with the average over all the years. The daily price profile shows a rising LMP level year over year, and a daily peak around hour-ending 19.
The daily arbitrage profit potential for each of the storage capacity hours is shown in Figure 10-6 in cumulative format for an average year between 2018 and 2037. The maximum arbitrage gross profit potential of the first storage capacity hour reaches as high as $70/MWh and can only be profitable during 290 days of the year, while the gross profit of the 4th storage capacity hour reaches a high of $50/MWh and stays profitable for only 200 days in a year. The annual potential profit from participating in energy arbitrage is shown in Figure 10-7. The maximum profit potential is $3.8/kW-yr for the first storage hour and drops to $1.9 for the 4th hour. The rise in arbitrage profits over time is shown in Figure 10-8 as the LMPs rise. The profits are organized into two groups, one when the storage is allowed to participate every day in the year while the second group restricts participation to only 200 days per year.
The Storage-Only solution, being a 3 hour battery, has the potential to earn $6.6/kW-yr ($2.6+$2.2+$1.8) in 2019, which increases to $10.6/kW-yr in 15 years. This totals an average of $252,000 annually, and a present value of $1.66M over 10 years.

FINAL REPORT
ENERGY STORAGE PLANNING TO SUPPORT BAINBRIDGE ISLAND | PSE
© 2018 QUANTA TECHNOLOGY, LLC PAGE 44
Figure 10-4: Average Locational Marginal Prices (LMP) by Month and Hour
Figure 10-5: Average Daily Profile (24 hours)
Average LMP ($/MWh)M/H 1 2 3 4 5 6 7 8 9 10 11 12 13 14 15 16 17 18 19 20 21 22 23 24 Monthly
1 53 51 50 50 50 53 58 59 58 57 56 56 56 55 55 55 57 63 67 67 65 62 59 56 57.02 54 52 50 50 51 53 57 58 58 58 58 57 57 55 55 55 56 61 66 68 67 64 61 57 57.33 50 49 49 49 49 52 54 55 55 56 55 55 54 53 52 52 53 55 60 62 62 60 55 51 54.14 48 47 47 47 47 48 49 50 52 52 52 51 51 50 49 49 50 53 58 59 60 58 53 50 51.25 46 45 45 45 46 45 45 45 45 46 46 47 47 47 48 48 50 53 56 56 55 53 49 47 48.16 45 45 45 45 46 45 45 45 45 47 47 48 49 50 52 54 56 57 57 55 53 50 49 46 49.17 49 47 47 47 47 47 47 47 48 50 51 54 56 58 61 64 69 71 70 65 60 58 56 52 55.18 55 52 51 51 50 51 50 50 51 52 54 57 60 62 66 73 79 81 81 75 69 64 60 58 60.49 57 55 53 52 53 55 54 54 56 57 58 59 60 61 64 68 73 79 80 77 72 65 62 60 61.9
10 54 53 52 52 53 56 58 58 58 59 60 60 60 60 60 61 64 69 71 71 68 64 61 57 59.911 56 54 53 53 53 56 59 58 58 58 59 59 58 58 58 59 62 66 68 69 67 64 62 58 59.412 57 54 53 53 53 55 59 58 58 57 57 57 57 57 57 58 61 67 70 69 67 65 62 59 59.2
AVG 52 50 50 49 50 51 53 53 53 54 55 55 55 56 56 58 61 65 67 66 64 61 57 54 56Min 14 14 14 14 15 15 16 18 20 20 20 20 21 21 21 22 21 20 20 20 20 20 16 16 14
Max 97 99 95 95 95 100 108 108 103 100 100 99 105 108 121 131 142 155 155 145 133 113 108 101 155

FINAL REPORT
ENERGY STORAGE PLANNING TO SUPPORT BAINBRIDGE ISLAND | PSE
© 2018 QUANTA TECHNOLOGY, LLC PAGE 45
Figure 10-6: Cumulative Arbitrage Gross Profit for 1-4 Storage Capacity Hours
Figure 10-7: Arbitrage Gross Annual Profit for 1-4 Storage Capacity Hours

FINAL REPORT
ENERGY STORAGE PLANNING TO SUPPORT BAINBRIDGE ISLAND | PSE
© 2018 QUANTA TECHNOLOGY, LLC PAGE 46
Figure 10-8: Annual Arbitrage Profit (2019 – 2037)
10.4 Optimized Revenue Stacking: Beyond the reliability and capacity requirements, the analysis reveals that the storage solution has the potential to earn $2.4M, at most, in additional revenues when optimized using historical data (in present value over 15 years):
- System capacity $0.75M - Energy Price Arbitrage $1.66M
Even if the revenue stacking could be optimized for system capacity services and energy price arbitrage, this revenue amount is not guaranteed and would be dependent on many other factors including perfect knowledge of market forward price curves, perfect equipment performance, and wholesale price growth in line with the IRP assumption.
0.0
1.0
2.0
3.0
4.0
5.0
6.0
7.0
1st Hr365Days
2nd Hr365Days
3rd Hr365Days
4th Hr365Days
1st Hr200Days
2nd Hr200Days
3rd Hr200Days
4th Hr200Days
Arbitrage Value $/kW-Yr
2019 2022 2025 2029 2033 2035 2037 All

FINAL REPORT
ENERGY STORAGE PLANNING TO SUPPORT BAINBRIDGE ISLAND | PSE
© 2018 QUANTA TECHNOLOGY, LLC PAGE 47
11 APPENDIX C – REVENUE STACKING POTENTIAL OF STORAGE-ONLY (OPTION) SOLUTION
The storage-only (option) solution consisting of five (5) battery systems totaling 25.1MW/79.2MWh was designed to address two needs, namely, the Winslow-Tap outage, and the substation group loading limit. The Bainbridge Island system needs vary throughout the year with the load level, and correspondingly, the percentage of the battery size (MW and MWh) that is required to address these system needs will also vary. This provides a commercial opportunity to monetize the excess capacity of the storage solution during periods when the needs are not at their highest levels, in order to offset the cost of the storage investment.
In a similar manner to the analysis in Appendix B, two monetize-able services that are potentially available to this storage system are system capacity and energy price arbitrage. The Integrated Resource Plan (IRP) of 2017 provides a basis for the valuation of these two potential revenue streams. System capacity is a contracted service and thus has a lower risk as compared to energy price arbitrage which depends on the daily volatility of the locational marginal prices (LMP). The first priority of utilizing the storage system is to address the local needs. Any excess capacity will be utilized to provide system capacity services, and finally any remaining excess capacity will be used to provide energy price arbitrage.
The analysis methodology that was followed in this study to quantify and optimize the revenue streams is summarized in the following 3 steps:
4. Determine the required storage capacity (MW and MWh) for each hour in a year to address the two local needs.
5. Assess the storage availability to provide the system capacity service. 6. Optimize the operating profits from energy price arbitrage.
11.1 Hourly Storage Requirements to Address Needs: The storage solution consisting of four (4) storage systems was designed to address two needs. One of which (Winslow-Tap outage) is a contingent service that is only triggered after the onset of a defined grid outage, while the second need (substation group) is triggered whenever the load level exceeds a prescribed level and thus is not contingent. To address the two types of needs, the storage systems will have to discharge to address the substation group trigger while keeping enough energy (MWh) in reserve to potentially address a subsequent defined outage. Both the discharged MW and the reserve MWh vary hourly throughout the year depending on the load level on specific feeders and substations in the area, as was detailed in Chapter 6.
Figure 11-1 shows the percentage of the storage solution size that is required to address the substation group capacity requirement, while Figure 11-2 shows the required storage solution size (expressed as a percentage of the total planned solution size) that is required to address both needs. The analysis was conducted using the 2019 data which corresponds to the highest peak in the study horizon. The data is tabulated in columns corresponding to each of the 24 hours in a day, and in rows corresponding to each

FINAL REPORT
ENERGY STORAGE PLANNING TO SUPPORT BAINBRIDGE ISLAND | PSE
© 2018 QUANTA TECHNOLOGY, LLC PAGE 48
of the 12 months in a year. For example, at hour ending 8, the maximum discharge for all days in December to address the substation group capacity need will be 14% of the storage solution rating, and at the same time, the storage solution will have to maintain 29% of its rated energy capacity in reserve in anticipation of an outage in accordance with the Winslow-Tap need. Similarly, during June-Sept, the storage solution is not required to address either need.
Figure 11-1: Storage Max Hourly (MW) Requirements for Substation Group Capacity Need by Month and Hour
Figure 11-2: Storage Max Hourly (MWH) Requirements for the 2 Needs by Month and Hour
Hourly Max of Battery Requirements for Substation Group (N-0) : MW/MWh (%)Max of Colum Row Lab 1 2 3 4 5 6 7 8 9 10 11 12 13 14 15 16 17 18 19 20 21 22 23 24 All1 6% 6%2 36% 38% 23% 6% 38%3456789101112 14% 26% 23% 12% 26%All 36% 38% 23% 12% 38%
Hourly Max of Battery Requirements MW/MWh (%)Max o Colum Row L 1 2 3 4 5 6 7 8 9 10 11 12 13 14 15 16 17 18 19 20 21 22 23 24 All1 6% 14% 15% 16% 16% 23% 36% 46% 50% 42% 37% 33% 25% 18% 18% 18% 21% 31% 34% 34% 29% 24% 8% 50%2 24% 42% 57% 70% 79% 95% 96% 89% 74% 58% 51% 47% 44% 42% 63% 61% 57% 52% 57% 53% 48% 41% 27% 12% 96%3 2% 3% 4% 4% 4% 4% 21% 40% 43% 38% 27% 23% 8% 4% 1% 3% 6% 12% 14% 10% 5% 43%4 1% 2% 2% 2% 2% 2% 19% 39% 38% 22% 7% 1% 10% 39%5 12% 41% 44% 39% 35% 24% 11% 4% 6% 10% 22% 22% 20% 15% 44%678910 17% 25% 17% 25%11 5% 9% 10% 12% 13% 13% 31% 44% 45% 44% 39% 36% 33% 33% 27% 27% 26% 34% 32% 29% 27% 23% 11% 45%12 13% 26% 36% 45% 51% 61% 70% 71% 66% 56% 51% 46% 41% 37% 34% 35% 38% 41% 41% 41% 39% 38% 29% 17% 71%All 24% 42% 57% 70% 79% 95% 96% 89% 74% 58% 51% 47% 44% 42% 63% 61% 57% 52% 57% 53% 48% 41% 29% 17% 96%

FINAL REPORT
ENERGY STORAGE PLANNING TO SUPPORT BAINBRIDGE ISLAND | PSE
© 2018 QUANTA TECHNOLOGY, LLC PAGE 49
Figure 11-3: Available Storage Capacity after Meeting System Needs
11.2 System Capacity Service: The Puget Sound IRP in 2017 shows the system capacity price in 2018 through 2024 to be $3.79/kW-yr, and then jumps in 2025 to $78.19/kW-yr and stays at that level through 2037. The system capacity requirements are exclusively during December for each of the 10 hours between 6AM-11AM and 5PM-10PM.
An analysis of the local requirements in Figure 11-1 and Figure 11-2 and the hourly profile of the load in Bainbridge Island reveals the following observations:
• The load peaks in December during Hour-Ending (HE) 8-11AM. • The energy required to shave the peak load in December increases with the level of MW
shaving. A 5 MW peak load shaving requires 3 hours of energy, while a 10MW peak shaving requires 4 hours, and further peak shaving beyond 15MW requires 10 hours.
• During December, the maximum MW discharge of the storage solution during the system capacity hours is 26% of the storage solution rating, while the maximum energy requirement is 71% of the storage rating. At any hour, the MW discharge in addition to the excess storage capacity above the requirement is available to provide the system capacity service. The minimum available percentage of the storage rating for system capacity services is 29%.
• During the 10 system capacity hours in December, the availability of the storage solution to provide system capacity service rises, as a percent of the storage solution rating, from 30% at 7AM to 62% at 10PM.
• The storage solution rating of 25.1MW and 79.2MWh provides only 3.16 hours of continuous discharge capability.
• If the storage aims to provide an equal level of system capacity at each of the 10 hours for each of the days in December, then the maximum level of participation in the system capacity service will be (3.16/10)x(29%)x(25.1) = 2.3MW, earning the full system capacity price. The present value of the system capacity service over 10 year is $0.45M.
1 2 3 4 5 6 7 8 9 10 11 12 13 14 15 16 17 18 19 20 21 22 23 241 94% 86% 85% 84% 84% 77% 64% 54% 50% 58% 63% 67% 75% 82% 82% 82% 79% 69% 66% 66% 71% 76% 92% 100%
2 76% 58% 43% 30% 21% 5% 4% 11% 26% 42% 49% 53% 56% 58% 37% 39% 43% 48% 43% 47% 52% 59% 73% 88%
3 98% 97% 96% 96% 96% 96% 79% 60% 57% 62% 73% 77% 92% 96% 100% 99% 97% 94% 88% 86% 90% 95% 100% 100%
4 99% 98% 98% 98% 98% 98% 81% 61% 62% 78% 93% 99% 100% 100% 100% 90% 100% 100% 100% 100% 100% 100% 100% 100%
5 100% 100% 100% 100% 100% 100% 88% 59% 56% 61% 65% 76% 89% 100% 100% 96% 94% 90% 78% 78% 80% 85% 100% 100%
6 100% 100% 100% 100% 100% 100% 100% 100% 100% 100% 100% 100% 100% 100% 100% 100% 100% 100% 100% 100% 100% 100% 100% 100%
7 100% 100% 100% 100% 100% 100% 100% 100% 100% 100% 100% 100% 100% 100% 100% 100% 100% 100% 100% 100% 100% 100% 100% 100%
8 100% 100% 100% 100% 100% 100% 100% 100% 100% 100% 100% 100% 100% 100% 100% 100% 100% 100% 100% 100% 100% 100% 100% 100%
9 100% 100% 100% 100% 100% 100% 100% 100% 100% 100% 100% 100% 100% 100% 100% 100% 100% 100% 100% 100% 100% 100% 100% 100%
10 100% 100% 100% 100% 100% 100% 100% 83% 75% 83% 100% 100% 100% 100% 100% 100% 100% 100% 100% 100% 100% 100% 100% 100%
11 95% 91% 90% 88% 87% 87% 69% 56% 55% 56% 61% 64% 67% 67% 73% 73% 74% 66% 68% 71% 73% 77% 89% 100%
12 87% 74% 64% 55% 49% 39% 30% 29% 34% 44% 49% 54% 59% 63% 66% 65% 62% 59% 59% 59% 61% 62% 71% 83%

FINAL REPORT
ENERGY STORAGE PLANNING TO SUPPORT BAINBRIDGE ISLAND | PSE
© 2018 QUANTA TECHNOLOGY, LLC PAGE 50
• On the other hand, if the storage solution is viewed as a component of a portfolio of capacity solutions, and thus allowed to provide partial capacity for each hour, the storage can maximize its participation by focusing on the last 3 hours in the day where it can participate by an average of 70% of its rating, or (61%)x(25.1) = 15.3MW, earning only 30% of the system capacity value. The present value of providing system capacity over 10 year is $0.75M.
• Taking the average of the above two methods, to provide an estimated capacity value of $0.6M.
11.3 Energy Price Arbitrage: During the hours when the storage is not required for reliability or not providing system capacity service, it has the potential to arbitrage the energy price by charging during periods of low prices and discharging during periods of high energy prices. The arbitrage potential is analyzed on a day-by-day basis, and only once a day at most to avoid excessive utilization of the storage life cycles. For a storage system with 3 hours of energy capacity, the first storage hour has the potential to generate the most profits because it can discharge at the highest price hour in a day and charge at the lowest price hour in the same day. The second hour of energy capacity will have to settle for the second best discharge and charge hours and thus generate less revenues. Adding all the arbitrage profits after deducting the cost of roundtrip losses provides an estimate of the maximum potential revenue from participation in this service.
The hourly locational energy prices (provided by Puget Sound according to the 2017 IRP) between 2018 and 2037 are averaged and summarized in Figure 11-4 by month and hour of the day, and color coded with red being highest and green being lowest. The average LMP is $56/MWh across the period with a high of $155/MWh and a low of $14/MWh. The average daily profile of the hourly prices is displayed in Figure 11-5 for 5 individual years between 2019 and 2037 along with the average over all the years. The daily price profile shows a rising LMP level year over year, and a daily peak around hour-ending 19.
The daily arbitrage profit potential for each of the storage capacity hours is shown in Figure 11-6 in cumulative format for an average year between 2018 and 2037. The maximum arbitrage gross profit potential of the first storage capacity hour reaches as high as $70/MWh and can only be profitable during 290 days of the year, while the gross profit of the 4th storage capacity hour reaches a high of $50/MWh and stays profitable for only 200 days in a year. The annual potential profit from participating in energy arbitrage is shown in Figure 11-7. The maximum profit potential is $4.1/kW-yr for the first storage hour and drops to $2.1 for the 4th hour. The rise in arbitrage profits over time is shown in Figure 11-8 as the LMPs rise. The profits are organized into two groups, one when the storage is allowed to participate every day in the year while the second group restricts participation to only 200 days per year.
The Storage-Only solution, being a 3 hour battery, has the potential to earn $6.9/kW-yr ($2.7+$2.3+$1.9) in 2019, which increases to $11.4/kW-yr in 15 years. This totals an average of $230,000 annually, and a present value of $1.5M over 10 years.

FINAL REPORT
ENERGY STORAGE PLANNING TO SUPPORT BAINBRIDGE ISLAND | PSE
© 2018 QUANTA TECHNOLOGY, LLC PAGE 51
Figure 11-4: Average Locational Marginal Prices (LMP) by Month and Hour
Figure 11-5: Average Daily Profile (24 hours)
Average LMP ($/MWh)M/H 1 2 3 4 5 6 7 8 9 10 11 12 13 14 15 16 17 18 19 20 21 22 23 24 Monthly
1 53 51 50 50 50 53 58 59 58 57 56 56 56 55 55 55 57 63 67 67 65 62 59 56 57.02 54 52 50 50 51 53 57 58 58 58 58 57 57 55 55 55 56 61 66 68 67 64 61 57 57.33 50 49 49 49 49 52 54 55 55 56 55 55 54 53 52 52 53 55 60 62 62 60 55 51 54.14 48 47 47 47 47 48 49 50 52 52 52 51 51 50 49 49 50 53 58 59 60 58 53 50 51.25 46 45 45 45 46 45 45 45 45 46 46 47 47 47 48 48 50 53 56 56 55 53 49 47 48.16 45 45 45 45 46 45 45 45 45 47 47 48 49 50 52 54 56 57 57 55 53 50 49 46 49.17 49 47 47 47 47 47 47 47 48 50 51 54 56 58 61 64 69 71 70 65 60 58 56 52 55.18 55 52 51 51 50 51 50 50 51 52 54 57 60 62 66 73 79 81 81 75 69 64 60 58 60.49 57 55 53 52 53 55 54 54 56 57 58 59 60 61 64 68 73 79 80 77 72 65 62 60 61.9
10 54 53 52 52 53 56 58 58 58 59 60 60 60 60 60 61 64 69 71 71 68 64 61 57 59.911 56 54 53 53 53 56 59 58 58 58 59 59 58 58 58 59 62 66 68 69 67 64 62 58 59.412 57 54 53 53 53 55 59 58 58 57 57 57 57 57 57 58 61 67 70 69 67 65 62 59 59.2
AVG 52 50 50 49 50 51 53 53 53 54 55 55 55 56 56 58 61 65 67 66 64 61 57 54 56Min 14 14 14 14 15 15 16 18 20 20 20 20 21 21 21 22 21 20 20 20 20 20 16 16 14
Max 97 99 95 95 95 100 108 108 103 100 100 99 105 108 121 131 142 155 155 145 133 113 108 101 155

FINAL REPORT
ENERGY STORAGE PLANNING TO SUPPORT BAINBRIDGE ISLAND | PSE
© 2018 QUANTA TECHNOLOGY, LLC PAGE 52
Figure 11-6: Cumulative Arbitrage Gross Profit for 1-4 Storage Capacity Hours
Figure 11-7: Arbitrage Gross Annual Profit for 1-4 Storage Capacity Hours

FINAL REPORT
ENERGY STORAGE PLANNING TO SUPPORT BAINBRIDGE ISLAND | PSE
© 2018 QUANTA TECHNOLOGY, LLC PAGE 53
Figure 11-8: Annual Arbitrage Profit (2019 – 2037)
11.4 Optimized Revenue Stacking: Beyond the reliability and capacity requirements, the analysis reveals that the storage solution has the potential to earn $2.1M, at most, in additional revenues when optimized using historical data (in present value over 15 years):
- System capacity $0.6M - Energy Price Arbitrage $1.5M
Even if the revenue stacking could be optimized for system capacity services and energy price arbitrage, this revenue amount is not guaranteed and would be dependent on many other factors including perfect knowledge of market forward price curves, perfect equipment performance, and wholesale price growth in line with the IRP assumption.