
Energy Storage Cost effectiveness Methodology and … Rick, Michael Kleinberg, Warren Katzenstein,...
83
Energy Research and Development Division FINAL PROJECT REPORT Energy Storage Cost ‐ effectiveness Methodology and Results Prepared for: California Energy Commission Prepared by: DNV KEMA Energy & Sustainability AUGUST 2013 CEC ‐ 500 ‐ 2014 ‐ 068
-
Upload
truonghuong -
Category
Documents
-
view
214 -
download
1
Transcript of Energy Storage Cost effectiveness Methodology and … Rick, Michael Kleinberg, Warren Katzenstein,...

Energy Research and Development Div is ion FINAL PROJECT REPORT
Energy Storage Cost‐effectiveness Methodology and Results
Prepared for: California Energy Commission Prepared by: DNV KEMA Energy & Sustainability
AUGUST 2013CEC ‐500 ‐2014 ‐068

Prepared by: Primary Author(s): Richard Fioravanti Michael Kleinberg, Ph.D. Warren Katzenstein, Ph.D. Sudipta Lahiri, Ph.D. Nellie Tong Alicia Abrams Jessica Harrison Charlie Vartanian DNV KEMA Energy & Sustainability 155 Grand Avenue, Suite 500 Oakland, CA 94412 510-891-0446 www.dnvkema.com Contract Number: 500-11-029 (WA #003) Prepared for: California Energy Commission Tiffany Solorio Contract Manager Avtar Bining, Ph.D. Project Manager Fernando Pina Office Manager Energy Systens Research Office Laurie ten Hope Deputy Director ENERGY RESEARCH AND DEVELOPMENT DIVISION Robert P. Oglesby Executive Director
DISCLAIMER This report was prepared as the result of work sponsored by the California Energy Commission. It does not necessarily represent the views of the Energy Commission, its employees or the State of California. The Energy Commission, the State of California, its employees, contractors and subcontractors make no warranty, express or implied, and assume no legal liability for the information in this report; nor does any party represent that the uses of this information will not infringe upon privately owned rights. This report has not been approved or disapproved by the California Energy Commission nor has the California Energy Commission passed upon the accuracy or adequacy of the information in this report.

ACKNOWLEDGEMENTS
This report utilized a weekly stakeholder process to review approaches to the analysis and inputs into the study. DNV KEMA would like to acknowledge the following individuals who took the time to participate in that process:
• Chris Edgette, California Energy Storage Alliance
• Giovanni Damato, California Energy Storage Alliance
• Avtar Bining, Ph.D, California Energy Commission
• Aloke Gupta, California Public Utility Commission
• Charlie Vartanian, UniEnergy Technologies
i

PREFACE
The California Energy Commission Energy Research and Development Division supports public interest energy research and development that will help improve the quality of life in California by bringing environmentally safe, affordable, and reliable energy services and products to the marketplace.
The Energy Research and Development Division conducts public interest research, development, and demonstration (RD&D) projects to benefit California.
The Energy Research and Development Division strives to conduct the most promising public interest energy research by partnering with RD&D entities, including individuals, businesses, utilities, and public or private research institutions.
Energy Research and Development Division funding efforts are focused on the following RD&D program areas:
• Buildings End‐Use Energy Efficiency
• Energy Innovations Small Grants
• Energy‐Related Environmental Research
• Energy Systems Integration
• Environmentally Preferred Advanced Generation
• Industrial/Agricultural/Water End‐Use Energy Efficiency
• Renewable Energy Technologies
• Transportation
Energy Storage Cost‐effectiveness Methodology and Results is the final report for the Technical Support on Energy Storage Use Case and Cost‐effectiveness Analysis project (contract number 500‐11‐029, work authorization number 003, conducted by DNV KEMA Energy and Sustainability for $250,217.00. The information from this project contributes to Energy Research and Development Division’s Energy Systems Integration Program.
For more information about the Energy Research and Development Division, please visit the Energy Commission’s website at www.energy.ca.gov/research/ or contact the Energy Commission at 916‐327‐1551.
ii

ABSTRACT
The California Legislature enacted Assembly Bill 2514 in 2010 directing the California Public Utilities Commission to consider a variety of possible policies encouraging cost‐effective deployment of energy storage systems. In response to the Assembly Bill, the Public Utilities Commission is conducting Phase 2 Analysis of energy storage systems and one of its foci is assessing cost‐effectiveness of Energy Storage based on a “Use Case” approach. This report describes a model‐based methodology to quantitatively evaluate energy storage cost‐effectiveness and apply that methodology to five Use Cases examples: Frequency Regulation, Comparative Portfolio, Distribution Substation Capacity Deferral, Distribution Connected Photovoltaic Integration, and Demand‐side Customer Bill Reduction. For each of the five Use Cases evaluated, the results indicate energy storage is cost effective for a subset of assumptions for a range of benefits versus range of costs. These results can provide valuable information to the California Public Utilities Commission in the Assembly Bill 2514 proceedings, and to the California Energy Commission for future research and development activities. The study showed that modeling the cost‐effectiveness of energy storage is not a limitation to examining the benefits and cost of energy storage on the California electricity grid. The results will also support future Integrated Energy Policy Report workshops, which can use this study’s results regarding energy storage to support more renewables on the California grid.
Keywords: energy storage, cost‐effectiveness, use cases, energy markets, ancillary services markets, T&D deferral, demand charge reduction, PV integration
Please use the following citation for this report:
Fioravanti, Rick, Michael Kleinberg, Warren Katzenstein, Sudipta Lahiri, Nellie Tong, Alicia Abrams, Jessica Harrison, Charlie Vartanian. (DNV KEMA Energy & Sustainability). 2013. Energy Storage Cost‐effectiveness Methodology Results. Publication number: CEC‐500‐2014‐068.
iii

TABLE OF CONTENTS
Acknowledgements ................................................................................................................................... i
PREFACE ................................................................................................................................................... ii
ABSTRACT .............................................................................................................................................. iii
TABLE OF CONTENTS ......................................................................................................................... iv
LIST OF FIGURES ................................................................................................................................. vii
List of Tables .......................................................................................................................................... viii
EXECUTIVE SUMMARY ........................................................................................................................ 1
Project Purpose ................................................................................................................................... 2
Project Results ..................................................................................................................................... 2
Conclusions ......................................................................................................................................... 6
Benefits to California Ratepayers ..................................................................................................... 6
CHAPTER 1: Introduction ...................................................................................................................... 8
1.1 California Public Utilities Commission Energy Storage Proceeding ................................ 10
1.1.1 Energy Storage Proceeding Phase 1 and Phase 2 Output ................................................. 11
1.2 Study Scope ............................................................................................................................... 12
CHAPTER 2: Cost‐Effectiveness Methodology ................................................................................. 13
2.1 Use Cases for Model Based Evaluation ................................................................................. 13
2.2 Energy Storage Applications’ Benefits Basis ........................................................................ 14
2.2.1 Market Revenues .............................................................................................................. 14
2.2.2 Transmission and Distribution Avoided Costs ........................................................... 15
2.2.3 Customer Savings ............................................................................................................ 16
2.2.4 System Benefits ................................................................................................................. 16
2.3 Energy Storage Technologies’ Costs Basis ............................................................................ 17
CHAPTER 3: Transmission Energy Storage – Frequency Regulation .......................................... 18
3.1 Modeling the Use Case ............................................................................................................ 18
3.2 Storage Services Modeled ....................................................................................................... 19
3.3 Implementing the Use Case in PLEXOS and KERMIT ....................................................... 20
iv

3.4 Summary of Inputs .................................................................................................................. 21
3.4.1 Financial and Market Assumptions Inputs .................................................................. 21
3.4.2 Energy Storage Technology Assumptions Inputs ....................................................... 22
3.4.3 Sensitivity Alternatives ................................................................................................... 23
3.4.4 Battery Technology Scenario .......................................................................................... 23
3.4.5 Flywheel Technology Scenario ....................................................................................... 23
3.5 Use Case Modeling Results .................................................................................................... 23
3.5.1 Unit Specific Results ........................................................................................................ 23
CHAPTER 4: Transmission Energy Storage‐Comparative Portfolio ............................................ 26
4.1 Use Case Overview .................................................................................................................. 26
4.2 Modeling the Use Case ............................................................................................................ 26
4.2.1 Energy Storage Services Modeled ................................................................................. 26
4.2.2 Implementing the Use Case in PLEXOS ....................................................................... 27
4.3 Portfolio Models ....................................................................................................................... 28
4.3.1 CT and CCGT, Portfolio Case A .................................................................................... 28
4.3.2 CT, CCGT, and Energy Storage, Portfolio Case B ....................................................... 29
4.4 Sensitivities ............................................................................................................................... 30
4.5 System Impacts Results ........................................................................................................... 30
CHAPTER 5: Distribution Energy Storage‐Substation Capacity Deferral .................................. 35
5.1 Use Case Overview .................................................................................................................. 35
5.2 Modeling the Use Case ............................................................................................................ 36
5.2.1 Electric System Model ..................................................................................................... 36
5.2.2 Energy Storage Controls Model ..................................................................................... 37
5.3 Summary of Inputs .................................................................................................................. 37
5.4 Use Case Modeling Results .................................................................................................... 40
5.4.1 Engineering Results ......................................................................................................... 40
5.4.2 Financial Results ............................................................................................................... 41
5.4.3 Summary of Results ......................................................................................................... 44
v
CHAPTER 6: Distribution Energy Storage‐PV Integration Use Case ........................................... 45
6.1 Use Case Overview .................................................................................................................. 45
6.2 Modeling the Use Case ............................................................................................................ 47
6.2.1 PV Model ........................................................................................................................... 47
6.2.2 Electric System Model ..................................................................................................... 48
6.2.3 Energy Storage Controls Model ..................................................................................... 48
6.3 Summary of Inputs .................................................................................................................. 48
6.4 Use Case Modeling Results .................................................................................................... 51
6.4.1 Engineering Results ......................................................................................................... 51
6.4.2 Financial Results ............................................................................................................... 52
6.5 Summary of Results ................................................................................................................. 54
CHAPTER 7: Demand Side Customer Bill Reduction ..................................................................... 56
7.1 Use Case Overview .................................................................................................................. 56
7.2 Modeling the Use Case ............................................................................................................ 56
7.2.1 Energy Storage Services Modeled ................................................................................. 56
7.2.2 Implementing the Use Case in Microgrid Optimization Tool ................................... 57
7.3 Summary of Inputs .................................................................................................................. 57
7.3.1 Financial and Rates Inputs .............................................................................................. 58
7.3.2 Energy storage and PV Technology Assumptions Inputs ......................................... 59
7.3.3 Customer Load Assumptions Inputs ............................................................................ 60
7.4 Scenario and Sensitivity Alternatives .................................................................................... 61
7.4.1 Common Area Load for Multi‐unit Residential Building .......................................... 61
7.4.2 School ................................................................................................................................. 61
7.5 Use Case Modeling Results .................................................................................................... 62
CHAPTER 8: Generation Co‐Located Energy Storage ..................................................................... 64
8.1 Turbine Inlet Cooling with Thermal Energy Storage.......................................................... 64
8.1.1 TIC‐TES Co‐Located Generation & Storage Resource Description ........................... 64
8.1.2 How Turbine Inlet Cooling Works ................................................................................ 64
vi

8.1.3 Impact of Adding Energy Storage ................................................................................. 64
8.2 Concentrated Solar Power with Thermal Energy Storage ................................................. 66
8.2.1 CSP‐TES Co‐Located Generation & Energy Storage Resource Description ............ 67
8.2.2 Impact of Adding Energy Storage to CSP .................................................................... 67
CHAPTER 9: Conclusions and Recommended Future Research ................................................... 69
9.1 Cost‐effectiveness Evaluation Conclusions .......................................................................... 69
9.1.1 Benefits to California Ratepayers ................................................................................... 69
9.2 Limitations to Evaluation Energy Storage Cost‐effectiveness ........................................... 70
9.3 Suggestions for Additional Research .................................................................................... 70
GLOSSARY .............................................................................................................................................. 71
LIST OF FIGURES
Figure 1: Benefits‐Costs Ratios for Substation‐sited Energy Storage ............................................. 3
Figure 2: Benefits‐Costs for Substation‐sited Distributed Energy Storage for PV Integration . 4
Figure 3: Internal Rate of Return for Multifamily and School Applications ................................ 5
Figure 4: Representation of which Tools Map Specific Locations on the Grid ............................ 9
Figure 5: Mapping of Time Fidelity Required with Current Tools ............................................... 10
Figure 6: Overview of Frequency Regulation Use Case Modeling Approach............................. 19
Figure 7: Yearly Revenues and Costs for the Energy Storage Device ........................................... 24
Figure 8: Modified Net Load Profile ................................................................................................... 27
Figure 9: Dispatch of CCGT and CT Assets for Case A for the First Week of September ........ 31
Figure 10: Hourly Dispatch of CCGT and Energy Storage Assets for Case B for Sept., Week 1 .................................................................................................................................................................... 32
Figure 11: Substation‐sited Energy Storage ....................................................................................... 35
Figure 12: IEEE 123 Node Test Feeder with Energy Storage placed at Substation ..................... 37
Figure 13: Benefits, Costs and NPV for Scenarios 178 and 205 ...................................................... 42
Figure 14: Benefits, Costs and NPV for Scenarios 178 and 179 ...................................................... 42
Figure 15: Cash Flow for Scenario 175: Single Site, Stationary Energy Storage Deferral Case 43
vii

Figure 16: Cash Flow for Scenario 175: Multiple Site, Mobile Energy Storage Deferral Case . 44
Figure 17: Charging Energy Storage Reduces Power Flow from PV Generation Site ............... 46
Figure 18: Substation Peak Load is Reduced through Time‐Shift of the PV Generation ......... 46
Figure 19: IEEE 123 Node Test Feeder with Downstream PV and Co‐located Energy Storage 47
Figure 20: Cost, Benefits and NPV for Scenarios 150 and 177 ........................................................ 53
Figure 21: Cost, Benefits and NPV for Scenarios 138 and 153 ........................................................ 53
Figure 22: Cash Flow for Scenario 144, A Break‐Even Example ..................................................... 54
Figure 23: Demand Profiles for School and Common Area Meter ................................................ 60
Figure 24: Schematic of CSP‐TES modeled in KERMIT .................................................................. 67
LIST OF TABLES
Table 1: Summary Table of the Benefits‐Costs of Energy Storage for Regulation Markets ............ 3
Table 2: Energy Storage Costs from DNV KEMA’s ES‐Select ........................................................... 17
Table 3: List of Days and Regulation Costs for Base Case ................................................................. 21
Table 4: Primary Financial Assumptions .............................................................................................. 22
Table 5: Primary Operational Assumptions for Energy Storage Device .......................................... 22
Table 6: Operational and Financial Specifications ............................................................................... 23
Table 7: Summary of Benefit to Cost Ratios Results for Scenarios .................................................... 25
Table 8: Operational Specifications of a LMS100 and CCGT Base Turbine ..................................... 28
Table 9: Type of Energy Storage and Operational Parameters .......................................................... 29
Table 10: Listing of Use Cases Examined ............................................................................................. 30
Table 11: Summary Results for the Four Months Simulated and Estimated Annual Results ....... 32
Table 12: Scenario Analysis Results ....................................................................................................... 33
Table 13: Financial Assumptions Use in Analysis ............................................................................... 39
Table 14: Key Sensitivity Values ............................................................................................................ 40
Table 15: Summary Results With and Without Energy Storage ........................................................ 41
Table 16: Sample of Financial Results ................................................................................................... 41
Table 17: Financial Assumptions Used in Analysis ........................................................................... 50
viii

ix
Table 18: Key Sensitivity Values ............................................................................................................ 51
Table 19: Summary Results for Distribution System Performance with PV and Energy Storage 52
Table 20: Select Financial Results ........................................................................................................... 52
Table 21: Customer Use Case Energy Storage Simulation Assumptions ......................................... 57
Table 22: Input Tariff Rates in 2013 for Customer Use Case .............................................................. 58
Table 23: Cost, Financial and Incentive Inputs for Customer Use Case ........................................... 59
Table 24: Characteristics of Solar PV and Energy Storage ................................................................. 59
Table 25: Customer Facility Assumptions ............................................................................................ 60
Table 26: Main Input Parameters for Customer Use Case Scenarios ................................................ 62
Table 27: Input Parameters and Financial Results for Different Customer Use Case Scenarios .. 63
Table 28: Potential Benefits of CSP‐TES ................................................................................................ 68

EXECUTIVE SUMMARY Energy storage involves storing excess electricity and delivering this stored electricity to the electric grid or an end‐user when it is needed. The energy storage systems are used to support integrating renewable generation and improve power quality by correcting voltage sags, flickers and surges, or to correct for frequent imbalances. California Assembly Bill 2514 (AB 2514) recognized that energy storage must be included as part of a well‐functioning grid. Under AB 2514, the California Public Utilities Commission (CPUC) was required to open a proceeding to consider developing energy storage procurement targets for California utilities to integrate grid‐scale storage into the stateʹs electrical power system if determined to be viable and cost‐effective. By considering and including energy storage, California is moving its electricity system towards something smarter, more reliable and more sustainable.
In this report, DNV KEMA Energy and Sustainability (DNV KEMA) describes methodology and results from a study supporting the CPUC staff in their assessment of the cost‐effectiveness of energy storage for Phase 2 of the AB 2514 proceedings.
CPUC requirements as specified in AB 2514, included:
(1) Open a proceeding to determine appropriate targets, if any, for each load‐serving entity to procure viable and cost‐effective energy storage systems.
(2) By October 1, 2013, adopt energy storage procurement targets, if determined to be appropriate, to be achieved by each Load Serving Entitiy by December 31, 2015, and a 2nd target to be achieved by December 31, 2020.
(3) Ensure that the energy storage system procurement targets and policies that are established are technologically viable and cost effective.
As noted, cost‐effectiveness is one of two tests that must be met to establish any energy storage procurement target. DNV KEMA, working in collaboration with CPUC staff, Energy Commission staff, and Energy Storage Order Instituting Rulemaking proceeding (ES OIR) Stakeholder representatives, (1) developed methodologies to evaluate energy storage’s cost‐effectiveness and (2) performed example cost‐effectiveness evaluations on a subset of the priority Use Cases identified in Phase 1 of the ES OIR.
To support the proceedings, the cost‐effectiveness of energy storage was evaluated across numerous scenarios by (1) Transmission Connected Energy Storage, (2) Distribution Level Energy Storage, and (3) Demand Side (Customer Side) Energy Storage. DNV KEMA developed the necessary modeling tools to assess such scenarios and energy storage applications.
Assessing the viability of energy storage technologies presents a unique set of challenges. “Energy Storage” is comprised of technologies that vary in stages of development from traditional to advanced systems. Also, the performance characteristics of these multiple technologies vary from power (short duration) to energy (long duration), and also have differences in efficiencies, costs, as well as the number of discharge cycles specific technologies
1

can perform. Finally, when sited at certain locations on the grid, the devices can often perform multiple tasks or solve multiple problems. Each of these issues presents a unique set of challenges when assessing the technology. As Federal and State agencies continue to assess these difficulties, it is clear that simplified approaches to valuing energy storage are not adequate and, in fact, may lead to incorrect results.
It is for these reasons that DNV KEMA developed the set of tools used for this study. For each area of the grid – wholesale, transmission, distribution, and end‐use ‐ the models are based on tools that run simulations of actual applications and grids to evaluate the potential of the application. Each of the tools DNV KEMA developed to evaluate the specific Use Cases is governed by these guidelines:
(1) Assessments must be reliabily conducted to ensure energy storage is accurately assessed from all perspectives. Accuracy and fidelity are essential for the results to be accepted by the broad, diverse stakeholder groups participating in the valuation processes.
(2) All energy storage benefits must be taken into account. Limiting the benefits streams or not accounting for the multiple‐application potential of energy storage technologies may lead to false conclusions.
(3) Benefits Assessments must be realistic. Real world constraints, non‐linearities, and points of diminishing returns must be recognized and factored into calculations.
Project Purpose This study supported the CPUC’s Phase 2 evaluation effort, focusing on cost‐effectiveness. Methodologies were established examining the potential benefits of energy storage on the grid, and then applied the proposed methodologies to specific Use Case examples providing additional insight for the CPUC to use in their evaluation process.
Methodology
The Phase 2 Interim Report identified seven Priority Use Cases, choosing five to evaluate in this study covering the transmission, distribution, and customer levels.
The evaluation was conducted through an interactive, iterative process, where stakeholder representatives were updated on a weekly basis to discuss “data”, the numbers and assumptions used in the analysis effort. Stakeholder team members including Electric Power Research Institute (EPRI), California Energy Storage Alliance (CESA), the Energy Commission, and the CPUC provided comments throughout the process.
Each of the Use Cases evaluated required model‐based insight to adequately address cost‐effectiveness.
Project Results Results indicate that energy storage is cost effective for each of the five Use Cases evaluated under a subset of assumptions for a range of benefits versus range of costs. The value basis for these findings are market revenue potential versus storage cost, avoided transmission and
2

distribution (T&D) investment versus storage cost, and customer bill savings versus storage cost. In each case that was evaluated, the cost‐effectiveness cross over, or breakeven point, depended on the value side of the equation being at the upper end of the assumed value range, and the storage cost being at the lower end of the assumed cost range.
Table 1: Summary Table of the Benefits-Costs of Energy Storage for Regulation Markets
Scenario Asset TypeCapex ($/kW)
Regulation Price Multiplier
Performance Multiplier
Benefit to Cost
Battery $750 1 1 1.09Flywheel $1,500 1 1 0.66Battery $750 2 1 2.18Flywheel $1,500 2 1 1.33Battery $750 1 0.9 0.98Flywheel $1,500 1 0.9 0.6
Base Case
2x Regulation Price
P4P Performance Score (Pay for Performance)
Source: DNV KEMA Energy & Sustainability
For substation sited energy storage (Figure 1) in the benefit to cost chart, upgrade deferral is the primary value benefit when other applications, such as ancillary services and/or renewable integration are not considered. All 270 cases were examined in the simulation of the Use Case.
Figure 1: Benefits-Costs Ratios for Substation-sited Energy Storage
0.0
0.5
1.0
1.5
2.0
2.5
3.0
3.5
4.0
4.5
5.0
0 2
Bene
fit Cost R
atio
Case Runs 70
Stationary Storage
Mobile Storage Higher deferral value Slower load growthLower storage costMinimal storage sizing
Source: DNV KEMA Energy & Sustainability
3
Higher deferral costs, lower battery costs, and the ability to move across multiple sites in sequence can result in positive net values for this application. Larger sizes can allow for longer deferral periods, but add cost without much value if duration or capacity is in excess of system load management needs. Additional benefits not valued in this study include improved power quality potential and potential improvements to system reliability.
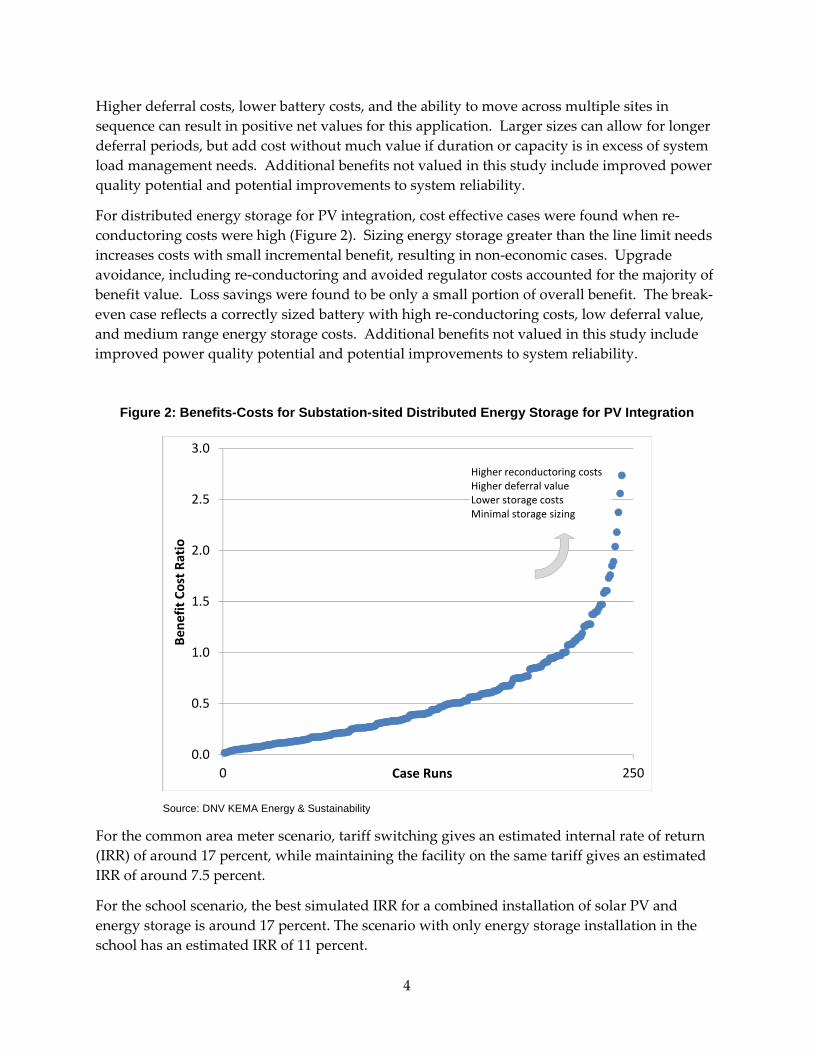
For distributed energy storage for PV integration, cost effective cases were found when re‐conductoring costs were high (Figure 2). Sizing energy storage greater than the line limit needs increases costs with small incremental benefit, resulting in non‐economic cases. Upgrade avoidance, including re‐conductoring and avoided regulator costs accounted for the majority of benefit value. Loss savings were found to be only a small portion of overall benefit. The break‐even case reflects a correctly sized battery with high re‐conductoring costs, low deferral value, and medium range energy storage costs. Additional benefits not valued in this study include improved power quality potential and potential improvements to system reliability.
Figure 2: Benefits-Costs for Substation-sited Distributed Energy Storage for PV Integration
0.0
0.5
1.0
1.5
2.0
2.5
3.0
0 250
Bene
fit Cost R
atio
Case Runs
Higher reconductoring costsHigher deferral valueLower storage costsMinimal storage sizing
Source: DNV KEMA Energy & Sustainability
For the common area meter scenario, tariff switching gives an estimated internal rate of return (IRR) of around 17 percent, while maintaining the facility on the same tariff gives an estimated IRR of around 7.5 percent.
For the school scenario, the best simulated IRR for a combined installation of solar PV and energy storage is around 17 percent. The scenario with only energy storage installation in the school has an estimated IRR of 11 percent.
4

A summary of the results from the Demand‐Side Use case evaluation is shown in Figure 3. The primary findings from the customer Use Case analysis are as follows:
Customer owned and operated energy storage is cost‐effective for facilities with high peak demand to base load ratio, under tiered time‐of‐use (TOU) tariffs with high demand charges. In these cases, the current Self Generation Incentive Program (SGIP) incentives played a significant role in energy storage cost‐effectiveness.
Figure 3: Internal Rate of Return for Multifamily and School Applications
0%
5%
10%
15%
20%
25%
30%
35%
40%
1 2 3 4 5 6 7 8 9 10 11 12 13 14
Internal Rate of Return
Case Runs
Multifamily Application
School Application
Source: DNV KEMA Energy & Sustainability
Limitations to Evaluation Energy Storage Cost-effectiveness
Some non modeling constraints prevented quantified model‐based cost‐effectiveness evaluation of several prioritized Use Case scenarios identified in the ES OIR Phase 2 prioritization of Use Cases and include:
(1) Multiple‐use Use Case scenarios with applications that bridged customer and utility side of the meter
(2) Generator co‐located Use Case scenarios where the energy storage modifies attributes of a generator’s output and the energy storage is not directly delivering services to the grid.
5

Conclusions This effort began the process establishing a methodology to assess energy storage on the grid and to use that methodology to evaluate specific Use Case examples. These results are intended as additional information for the CPUC to use in their decision making process for the CPUC ES OIR.
In the Interim report for Phase 2, the CPUC Staff’s Phase 2 discussed and noted the potential “limitation of existing cost‐effectiveness methodologies relative to the complexity of energy storage, and thus the current limited ability to address the question of the cost‐effectiveness of energy storage in specific applications.” Tools, however, do exist to accurately assess the cost effectiveness of energy storage technologies at each area of the electricity grid.
For this effort, there are two basic conclusions from the analysis and process:
(1) Tools are available that can allow stakeholders to accurately assess energy storage technologies for single and multiple applications at specific areas of the electricity grid. Tool availability is not a limitation to the analysis of energy storage benefits
(2) For each of the Use Cases, energy storage was found to be cost‐effective in some of the cases where energy storage technologies are applied to specific applications
The basis of the methodology used industry accepted simulation tools customized or coupled with unique models to assess the impact of energy storage in each of the evaluated Use Cases.
When applying the tools to the Use Case examples, for each of the main Use Case Areas examined, which included (1) Energy storage regulation only, (2) Substation sited energy storage for deferral, (3) Distribution sited energy storage for photovoltaic, and (4) Demand Side Customer sited energy storage, energy storage was found to be cost‐effective in some of the cases where the technologies are applied to specific applications.
The analysis also leveraged a consensus driven process where stakeholders contributed to forming the inputs and variables used in the analysis. The remaining sections of this report outline the processes, methodology, description of the tools used, and detailed explanations of the specific Use Cases for the effort as well as the results and drivers to the results.
Benefits to California Ratepayers Energy Storage is considered to be a technology that can potentially increase reliability of the California electricity grid and reduce emissions by allowing more variable renewable generation to be added into the California generation portfolio. Also, as the performance characteristics of energy storage continue to be leveraged, the devices may help reduce costs to the California ratepayers.
As the State of California assesses the potential benefits of energy storage, the modeling methodology and evaluation of Use Case examples developed in this process will serve as additional insight for the potential applications being proposed. This also begins the process to establish a methodology for evaluating energy storage systems deployed on the electricity grid.
6

For the Phase 2 of the California Assembly Bill AB 2514 proceedings itself, the effort showed that the potential benefits of energy storage technologies can be properly assessed and even customized for California. Evaluating energy storage technologies can be complex, however, tools are available to ensure that “accurate evaluation” will not be a limitation to the Phase 2 process.
7

CHAPTER 1: Introduction DNV KEMA Energy and Sustainability (DNV KEMA) conducted a study supporting the California Public Utility Commission (CPUC) staff in their assessment of the cost‐effectiveness of energy storage for Phase 2 of the California Assembly Bill 2514 (AB 2514) proceedings.
DNV KEMA applied a model‐based analytic methodology to quantitatively evaluate energy storage cost‐effectiveness for five Use Cases: Frequency Regulation, Comparative Portfolio, Distribution Substation Capacity Deferral, Distribution Connected Photovoltaic (PV) Integration, and Demand‐side Customer Bill Reduction. The basis for evaluating cost‐effectiveness, the methodology applied, the assumptions used, and cost‐effectiveness findings for the five Use Cases are presented in this report.
Each of the Use Cases evaluated by DNV KEMA required model‐based insight to adequately address the question of cost‐effectiveness. For example:
(1) For bulk energy storage market‐based Use Cases, the market revenue‐based value for providing frequency regulation under a pay for performance regime cannot be quantified without a means to estimate the benefit‐factor associated with sub‐hourly energy storage system performance, requiring a sub‐hourly resolution. High resolution production simulation modeling using PLEXOS, a unit commitment and production costing software program developed and marketed by Energy Exemplar, with the DNV KEMA Renewable Market Integration Tool (KERMIT) tool was used to estimate the potential revenue stream in a future market scenario that includes pay for performance.
(2) For distribution capacity deferral energy storage Use Cases, the effectiveness of a given energy storage system to mitigate a distribution level overload or voltage control issue depends on the interaction between the energy storage system and the attributes of the electric power system to which it will connect. Load flow simulation modeling using DNV KEMA’s Distribution Storage Valuation Tool (ES‐Grid), with Electric Power Research Institute’s (EPRI’s) Open Distribution System Simulator (OpenDSS) tool, was used to quantify the amount of electric system overload mitigation and/or voltage support provided by a given energy storage system, and thus act as an effective wires‐solution upgrade deferral/avoidance measure to establish a project‐specific avoided cost value.
(3) For demand‐side Use Cases, the customer savings from bill reduction required calculating the specific amount of demand reduced and energy shifted against a sample demand shape that has enough detail to adequately estimate the electric bill impacts. When other customer‐side assets such as PV are introduced, the control of energy storage within the model also required substantial controls logic (implemented via linear programing optimization) to answer the deceptively simple question ‐ by how
8

much can electric bill charges be reduced through a given energy storage system? DNV KEMA’s Microgrid Optimization (MGO) tool optimized energy storage use against an annualized demand shape to lower customer electric bill charges.
Energy Storage systems are capable of performing multiple applications that can accrue numerous benefits. Also, these benefits can vary depending where the device is located on the grid, or are revealed when the proper time scale and fidelity are used when assessing the application. For this analysis, the study group used multiple models to evaluate the five Use Cases (Figure 8). The DNV KEMA Energy Storage‐Select Tool (ES‐Select) is referenced, as it was used to guide the pricing employed in the analysis.
Figure 4: Representation of which Tools Map Specific Locations on the Grid
Source: DNV KEMA Energy & Sustainability
Time dimension factors are required in modeling certain locations on the grid, such as wholesale applications, where common tools used today have a gap in the times between one minute and one hour (Figure 9).
9

Figure 5: Mapping of Time Fidelity Required with Current Tools
Source: DNV KEMA Energy & Sustainability
The modeling tools the study team used for this study are discussed in detail in the evaluation of the five Use Cases which are described and discussed in the chapters that describe each Use Case.
The five Use Cases, and developing and demonstrating cost‐effectiveness evaluation methodologies, were products of the CPUC Energy Storage Order Instituting Rulemaking proceeding R.10‐12‐007 (ES OIR).
1.1 California Public Utilities Commission Energy Storage Proceeding The CPUC initiated the Energy Storage Order Initiating Rulemaking proceeding R.10‐12‐0071 to satisfy the terms of California Assembly Bill (AB) 2514. The ES OIR is to,”… establish a record for decision making in R.10‐12‐007 to satisfy the terms of AB 2514 (PUC Section 2836) with regard to establishing potential energy storage procurement targets for load‐serving entities (LSEs).”2
California Assembly Bill AB 2514, Skinner Energy Storage, was signed into law September 29, 2010, and states, “The Legislature finds and declares all of the following:
(a) Expanding the use of energy storage systems can assist electrical corporations, electric service providers, community choice aggregators, and local publicly owned electric utilities in integrating increased amounts of renewable energy resources into the electrical transmission and distribution grid in a manner that minimizes emissions of greenhouse gases.
1 http://www.cpuc.ca.gov/PUC/energy/electric/storage.htm
2 Agenda for Energy Storage Procurement Workshop, CPUC, January 14, 2013
10

(b) Additional energy storage systems can optimize the use of the significant additional amounts of variable, intermittent, and off‐peak electrical generation from wind and solar energy that will be entering the California power mix on an accelerated basis.
(c) Expanded use of energy storage systems can reduce costs to ratepayers by avoiding or deferring the need for new fossil fuel‐powered peaking powerplants and avoiding or deferring distribution and transmission system upgrades and expansion of the grid.
(d) Expanded use of energy storage systems will reduce the use of electricity generated from fossil fuels to meet peak load requirements on days with high electricity demand and can avoid or reduce the use of electricity generated by high carbon‐emitting electrical generating facilities during those high electricity demand periods. This will have substantial cobenefits from reduced emissions of criteria pollutants.
(e) Use of energy storage systems to provide the ancillary services otherwise provided by fossil‐fueled generating facilities will reduce emissions of carbon dioxide and criteria pollutants.
(f) There are significant barriers to obtaining the benefits of energy storage systems, including inadequate evaluation of the use of energy storage to integrate renewable energy resources into the transmission and distribution grid through long‐term electricity resource planning, lack of recognition of technological and marketplace advancements, and inadequate statutory and regulatory support.”
The requirements to be met by the CPUC, as specified in AB 2514, include:
(1) Open a proceeding to determine appropriate targets, if any, for each load‐serving entity to procure viable and cost‐effective energy storage systems.
(2) By October 1, 2013, adopt energy storage procurement targets, if determined to be appropriate, to be achieved by each LSE by December 31, 2015, and a second target, to be achieved by December 31, 2020.
(3) Ensure the energy storage system procurement targets and policies that are established are technologically viable and cost effective.
1.1.1 Energy Storage Proceeding Phase 1 and Phase 2 Output Cost‐effectiveness is one of two tests that must be met to establish any energy storage procurement target. DNV KEMA, working in collaboration with CPUC staff, Energy Commission staff, and ES OIR Stakeholder representatives, 1) developed methodologies to evaluate energy storage’s cost‐effectiveness and 2) performed example cost‐effectiveness evaluations on a subset of the priority Use Cases identified in Phase 1 of the ES OIR. ES OIR Phase 1 and 2 provide the framework for assessing cost‐effectiveness, and the specific applications of Use Cases to be considered for determining cost‐effectiveness. The ES OIR phases are described in the ES OIR Scoping Memo.
The stakeholder‐process information developed during ES OIR Phase 1 and 2 are inputs for DNV KEMA’s task to develop a cost‐effectiveness evaluation methodology and apply the
11

methodology to a subset of the stakeholder‐prioritized Energy Storage Use Cases. This report outlines the five Use Cases evaluated by DNV KEMA, describes the basis for evaluating cost‐effectiveness, defines the methodology applied to quantitatively evaluate cost‐effectiveness, and summarizes the cost‐effectiveness findings from the using the methodology. The Appendices to this report include detailed Input and Results spreadsheets from the modeling performed for the example cost‐effectiveness evaluations discussed in this report.
1.2 Study Scope The technical studies described in this report address the first of the several policy topics identified in the ES OIR Scoping Memo,
(1) Cost‐effectiveness [emphasis added]
(2) Market Needs
(3) Barriers
(4) Ownership model
(5) Procurement target, if necessary
CPUC Staff’s Phase 2 Interim Report further discussed and noted the limitation of existing cost‐effectiveness methodologies relative to the complexity of energy storage, and thus the current limited ability to address the question of cost‐effectiveness of energy storage in specific applications. The CPUC Staff’s Phase 2 report further proposed the use of DNV KEMA modeling tools to support the development of a methodology to support the evaluation of energy storage cost‐effectiveness, “The DNV KEMA model is called Energy Storage Select (ES‐Select), but it would be used in combination with other KEMA models or programs (KERMIT, Storage Distribution Tool, and Storage Peaker Tool, in particular). Based on input from various parties, staff proposes that Energy Storage Valuation Tool ESVT and ES‐Select models may provide useful – if not determinative – analysis for certain Use Cases, or for an assessment of system level impacts of a portfolio of energy storage resource additions.”
12

CHAPTER 2: Cost-Effectiveness Methodology3 2.1 Use Cases for Model Based Evaluation The Phase 2 Interim Report identified seven Priority Use Cases. From those Use Cases, several were selected for study by DNV KEMA, with the goal of implementing a model‐based cost‐effectiveness evaluation process using the above noted DNV KEMA analytic tools. The five Use Cases evaluated in this study, and the related general categories (bolded text below) under which the five Use Cases fall are:
(1) Transmission Connected Energy Storage
a. Ancillary services energy storage, frequency regulation only
b. Comparative portfolio of energy storage resource additions (for evaluating system level impacts)
(2) Distribution Level Energy Storage
c. Substation sited energy storage, for substation capacity upgrade deferral
d. Distribution circuit sited energy storage, for PV related circuit upgrade avoidance and load growth related substation capacity deferral
(3) Demand Side (Customer Side) Energy Storage
e. Customer bill reduction
In each case, the ability to evaluate the potential cost‐effectiveness of Energy Storage is limited by the:
(1) inability to estimate market based revenue streams for an energy storage project (merchant or utility self‐provided asset), including the new pay for performance market rules
(2) failure to quantify energy storage’s potential T&D capacity upgrade deferral or avoidance impact
(3) challenge to estimate energy storage’s potential to deliver customer savings for a load shape and onsite generator (PV) output modified and managed by an energy storage asset
3 3 The basic description of the Use Case Methodology for cost‐effectiveness is listed at the CPUC site, http://www.cpuc.ca.gov/PUC/energy/electric/storage.htm, under the heading Energy Division Staff Phase 2 Interim Report and Use Case documents. The data worksheets for each of the Use Cases are located provided in each of the individual Use Case chapters
13

To overcome these limitations, DNV KEMA applied three software tools that mapped to the location of the energy storage systems Use Cases listed. The mapping of the DNV KEMA tools to the general categories is:
(1) Transmission Connected Energy Storage
PLEXOS with KERMIT, for production simulation and market simulation
(2) Distribution Level Energy Storage
ES‐Grid with EPRI’s OpenDSS, for electrical distribution performance (loading and voltage) impacts
(3) Demand Side Energy Storage
MGO for estimating energy storage use‐based customer bill savings through load shape management for demand charge reduction, plus energy storage for shaping PV output to minimize customer energy costs
These software tools were described at the December 3, 2012 ES OIR Workshop4. These models are described further in this report in the context of their use to evaluate the cost‐effectiveness of energy storage for the Use Cases studied.
2.2 Energy Storage Applications’ Benefits Basis The measure of cost‐effectiveness for the Use Cases that are project‐specific (all but the Comparative Portfolio Use Case) is: the ratio of benefit versus cost is larger than 1, for the net present value (NPV) of the positive (benefits) and negative (costs) cash flows for a 20‐year project life. The following sections of this Chapter discuss the major components of benefit and cost for the general categories of Use Cases. The following Chapters present the specific details on the assumed or derived benefits and costs, and the resulting NPV of whether the benefits versus cost ratio is smaller than, larger than, or equal to 1.
2.2.1 Market Revenues For the Transmission Connected category Use Case, the primary benefit used in the cost‐effectiveness modeling and evaluation is market revenue. For the Frequency Regulation Only Use Case modeled, the form of market revenue quantified as a benefit is market‐based payment for the provision of Regulation Up (RegUp) and Regulation Down (RegDown) services sold into the California Independent System Operator (CAISO) market. For the timeframe modeled (first project year is 2020), pay for performance was added to the compensation model for the Frequency Regulation services revenues. The modeling challenge solved by DNV KEMA in this study was the calculation of the market revenue $/Megawatt‐hour (MWh) hourly payment stream. Production simulation was used to determine the dispatch and related hourly base
4 http://www.cpuc.ca.gov/NR/rdonlyres/B2251C13‐57AF‐4443‐A826‐76D85D43E579/0/CPUCDNVKEMAModelAssessment12032012WorkshopFinal.pdf
14

clearing price for RegUp and RegDown payments for a sample set of days that were then extrapolated for a representative year’s 8760 market hours.
The KERMIT tool was then used for the inter‐hour resolution needed to estimate the associated pay for performance Benefit Factor applied to the Production Simulation (production cost based) RegUp and RegDown base clearing prices. While there are other compensation schemes proposed and present within energy storage‐based Power Purchase Agreement (PPA) term sheets today, we did not include any supplemental revenue streams for which there are not yet clear investment recovery mechanisms. These potential additional services not considered in modeling the Frequency Only Use Case include: provision of volt‐ampere reactive (VAR) to the local Participating Transmission Owner (PTO), blackstart capability, or fixed revenue streams via PPA to an LSE who wants to hedge market risk for their Ancillary Services costs. The specific modeling implemented to quantify this benefit, and the modeling results, are discussed in Chapter 3.
For the Comparative Portfolio analysis use case, the metric of benefits was the overall system production cost encompassing the effects of load following and ancillary service requirements on system production cost. Substituting large levels of energy storage for peaking units allows energy to be supplied by more efficient generators than Combined Cycle Gas Turbines (CCGT) and allowing energy storage to provide load following and ancillary services allows more efficient scheduling of the conventional resources. Against these benefits is the energy costs required to make up lost energy in the energy storage charge –discharge cycle. PLEXOS was used to perform monthly production cost simulations for the baseline and energy storage portfolio cases. Benefits are expressed in terms of $Millions saved overall in production cost and then translated to $/MWh benefit where the MWh refers to the energy stored and discharged.
2.2.2 Transmission and Distribution Avoided Costs For the Distribution Level Energy Storage category Use Cases, the primary benefits used in the cost‐effectiveness modeling and evaluation are transmission and distribution (T&D) upgrade deferral (annual carrying charge for the upgrade deferral period) and T&D upgrade avoidance (first‐year T&D installed cost avoided). A range of T&D unit costs for several industry references are cited in the detailed discussion in Chapters 5 and 6. The modeling challenge solved by DNV KEMA in this study was the verification of the mitigation of 1) substation overload (deferral benefit) and the years that an assumed energy storage system size would be effective and 2) mitigation and permanent removal of circuit section overload (full avoided cost of upgrade) due to a non‐load‐growth caused circuit overload. In this study, the circuit overload was caused by the installation of a relatively large 1.5 megawatt (MW) PV system installed on a primary distribution circuit lateral. To solve this modeling challenge, load flow simulation was applied to an 8,760 hour load shape to test the efficacy of a range of assumed energy storage system sizes. Load flow was needed to verify that the assumed energy storage sizing solved the problem for which it was intended. There are several secondary benefits calculated in terms of system performance, but which are not carried forward as part of the financial benefits due to no existing clear means to monetize these benefits. These secondary
15

benefits (‘with’ versus ‘without’ energy storage performance benefits) calculated in the load flow solution include, energy (I^2R and I^2X) loss reduction, reduction in voltage regulation device switching, and reduction in the steady state voltage range. While hourly resolution for the load flow simulations was adequate for assessing steady state voltage performance, the transient voltage concern per the Distribution Level Energy Storage PV Integration Use Case would require a higher time resolution and dynamic‐capable electric system model to 1) capture the PV intermittency‐related impact on transient voltages and 2) test the efficacy of a transient‐response‐speed (10’s ms) capable energy storage system.
2.2.3 Customer Savings For the Demand Energy Storage category Use Cases, the primary benefit used in the cost‐effectiveness modeling and evaluation is customer electric bill reduction through removal or reduction of Demand Charges applicable to some general commercial and industrial rate categories, and shifting PV output to reduce energy related bill charges. The modeling challenge solved by DNV KEMA in this study was the ability to quantify the amount of demand reduction feasible and associated cost savings for an assumed energy storage system modifying 1) a given customer demand load profile against 2) a specific electric rate Tariff. On‐site PV was also included in several sensitivities and was added to the bill minimization optimization scheme by using available energy storage capacity to shift PV output for energy savings and account for any coincident reduction in net load demand. Given that the benefits for this Use Case are strictly from the perspective of the retail customer, retail customer incentives also enter into the benefits calculation as a reduction in capital expenditure (CAPEX) initial investment cost. Three incentive programs are included in the cost‐effectiveness NPV of benefit‐cost calculation:
(1) The California Self Generation Incentive Program (SGIP), applicable to energy storage
(2) The California Solar Initiative (CSI), applicable to PV, for the Use Case sensitivities that include customer‐sited PV
(3) The Federal Investment Tax Credit (FITC), applicable to energy storage and PV, for the Use Case sensitivities that include customer‐sited PV
The specific modeling implemented to quantify this benefit, and the modeling results, are discussed in Chapter 7.
2.2.4 System Benefits This Use Case’s benefit is not related to a specific energy storage asset or project, but rather the benefit basis is the impact to system level metrics as solved in a production simulation. The modeled system benefits estimated through comparing a portfolio without energy storage and a portfolio with energy storage include:
(1) Total quantity of monitored emittants, including nitrogen oxide (NOx) and carbon dioxide (CO2)
(2) Total cost of serving energy ($) and the average cost of energy ($/MWh)
16

(3) Number of conventional gas‐fired unit starts
(4) Total fuel used to serve load
2.3 Energy Storage Technologies’ Costs Basis ES‐Select was the basis for CAPEX and operating expenditure (OPEX) assumptions for the energy storage technologies used in the modeled Use Cases. Note that dollar per kilowatt ($/kW) and stated duration is how the cost is characterized. $/kWh can be calculated from these two metrics.
Table 2 summarizes the costs that were used in the analysis. First, convention is to describe the energy storage technologies in terms of $/kW over how many hours. It is understood that some stakeholders prefer to view energy storage cost in terms of $/kWh. In the analysis, this number was simply derived from the duration that was assigned to each of the technologies.
Table 2: Energy Storage Costs from DNV KEMA’s ES-Select
High
Lithium‐Ion (Energy) ‐ 2 hours 4,200
Lithium‐Ion (Power) ‐ 1 hour 1,050
Advanced Lead Acid ‐ 4 hours 4,850
High
Lithium‐Ion (Energy) ‐ 2 hours 1,350 1,750 2,100
Lithium‐Ion (Power) ‐ 1 hour 675 875 1,050
Advanced Lead Acid ‐ 4 hours 750 975 1,212
Low Medium
2,700 3,500
875675
3,000 3,900
Cost ($/kW)
Cost ($/kW)
Low MediumTechnology Type
Technology Type
Source: DNV KEMA Energy & Sustainability
The numbers came from data from the ES‐Select tool. This tool was selected because it is also used by Sandia National Laboratories and is listed, open to the public on their Energy Storage webpage, and the numbers are accepted by the Department of Energy. Also, ES‐Select uses a range of public data on each of the technologies that is in its database. The team gratefully acknowledges the stakeholder teams that also provided cost data for the analysis. The study team compared and weighed all information that was brought to the process and, in some cases, used that information to select the cost of the technologies from the ES‐Select range to conduct the analysis.
17

CHAPTER 3: Transmission Energy Storage – Frequency Regulation The Regulation Use Case5 examines the cost‐effectiveness and breakeven costs of a single 20 MW, 5 MWh energy storage device participating in CAISO frequency regulation markets. The CPUC 2020 Long Term Procurement Plan (LTPP) 33 percent Renewable Portfolio Standard (RPS) Trajectory case PLEXOS model is used to estimate the annual revenue stream for an energy storage device in the year 2020. The 2020 annual revenue stream is then used as the basis for a 20 year pro forma evaluation of the 20 MW energy storage device installed in the year 2015.
3.1 Modeling the Use Case An overview of the modeling approach for the Regulation Only Use Case is shown in Figure 10. PLEXOS, described in more detail below, was used to produce hourly energy and ancillary service commitments that minimize system production costs from the set of assets in the LTPP Trajectory case. The hourly commitments were fed into KERMIT to simulate second‐to‐second operation of the 20 MW battery providing regulation. The PLEXOS model is then used to estimate the hourly costs of energy and regulation. KERMIT is used to estimate how well the energy storage unit performed in providing regulation and the MW‐miles of work the energy storage did while providing regulation (two new market elements required by Federal Energy Regulatory Commission Order 755). Also, KERMIT simulates and estimates the imbalance energy required for the energy storage unit to maintain its state of charge (SOC) at 50 percent according to CAISO specifications.
The benefit cost analysis is a pro‐forma style analysis that estimates break‐even capital costs for the 20 MW, 5 MWh energy storage device based on a 20 year revenue stream from CAISO regulation market and listed project financing assumptions. Also, system benefits are estimated by determining the change in California production costs estimated by PLEXOS for the simulations with and without the energy storage device. Sensitivity analyses examining the influence of the primary factors are reported as well.
5 Transmission Connected ES Use Case(s), http://www.cpuc.ca.gov/NR/rdonlyres/3E556FDB‐400D‐4B24‐84BC‐CD91E8F77CDA/0/TransmissionConnectedStorageUseCase.pdf. The data worksheet for the analysis can be found at, http://websafe.kemainc.com/CPUC/Ch3_AS_Use_Case_Results_Summary.xlsx
18

Figure 6: Overview of Frequency Regulation Use Case Modeling Approach
PLEXOS
• Add 20 MW storage unit to LTPP Trajectory case • Up & down regulation costs• Hourly regulation capacity awards• Hourly generator commitments
KERMIT
• Use PLEXOS results to initialize KERMIT• Up and down regulation mileage• Regulation performance• Net hourly regulation energy required to maintain state of charge
Benefit Cost Analysis
• Estimate mileage bids• Calculate total regulation payments• Breakeven pro forma analysis for storage device
Source: DNV KEMA Energy & Sustainability
3.2 Storage Services Modeled The energy storage unit modeled is a fast responding energy storage device appropriate for providing regulation. The specific parameters and the behavior of the plant can be considered representative of a battery device (detailed later in this chapter) although the operating characteristics are also representative of a flywheel, pumped hydro, or other fast acting energy storage device. The battery is assumed to be able to participate in both up and down regulation markets, but not in any other revenue markets. CAISO requires energy storage devices participating as a regulation energy‐managed device to maintain their state of charge at 50 percent every 5 minutes. This is because the real time energy market is supposed to clear the regulation market by re‐dispatching the system, so the energy procured in the energy markets is equal to load. In doing so, all regulation capacity is available each time the real time energy dispatch for CAISO is executed.
The roundtrip efficiency of an energy storage device is less than 100 percent, meaning that some amount of energy is lost when a battery is charged and discharged. Ideally, regulation signals are zero net energy over a long time frame (hours) and, in reality, they tend to be unless an abnormal event occurs (such as a generator tripping offline). As a result, energy storage devices participating in regulation markets will regularly need to procure and sell energy in the real time market to maintain a 50 percent SOC. Over a period of a day to a year this results in a net cost born by the energy storage device, because an energy storage device typically needs to buy more energy than it sells in the real time market.
19

3.3 Implementing the Use Case in PLEXOS and KERMIT PLEXOS is a unit commitment and production costing software program developed and marketed by Energy Exemplar. Every two years the CPUC reviews the Investor Owned Utilities’ (IOUs’) procurement plans through an LTPP proceeding. For the 2010 LTPP, the CPUC coordinated with CAISO, Energy Commission, Pacific Gas and Electric (PG&E), San Diego Gas and Electric (SDG&E), Southern California Edison (SCE), major California stakeholders, and Energy and Environmental Economics (E3) to develop detailed production cost models of California. These models were based on the IOUs’ proposed procurement plans, with the purpose to examine reliability and resource needs for California under five major scenarios for future growth and policy development under a 33 percent RPS. The LTPP 33 percent Trajectory case serves as the model framework for the Frequency Regulation Use Case. More information about this model can be found on the CPUC LTPP website and downloaded from CAISO’s website.
The purpose of using PLEXOS is to simulate the operation of California’s grid in future years and estimate the following:
(1) Hourly energy production from the portfolio of generators in the Trajectory case
(2) Hourly assignments of ancillary services based on avoided opportunity costs
(3) Hourly energy imports / exports to other Western Energy Coordinating Council (WECC) entities and regions
(4) Hourly energy and ancillary service costs for each utility and municipality within California
(5) Hourly energy and ancillary service costs for the major WECC regions outside of California
The CPUC LTPP 33 percent RPS Trajectory Case PLEXOS model has 2,492 generators distributed among 46 nodes that represent the WECC. Modeling most of the intricacies of WECC is required due to the high dependence of California on imports (and exports under certain future scenarios). As a result, the CAISO system and municipal utilities comprise a subsystem of this model. No changes were made to the model, except one energy storage device was added as a non‐marginal unit to provide regulation.
KERMIT is an analysis tool used to simulate sub‐hourly system operations, as well as system frequency and interchange deviations. Each generator within CAISO is modeled using either Institute of Electrical and Electronics Engineers (IEEE)‐approved non‐linear dynamic system models or proprietary non‐linear dynamic system models developed by DNV KEMA when IEEE models were non‐existent.
KERMIT has been used either for or by five Independent System Operators (ISOs) / Regional Transmission Owners (RTOs) in the United States, plus three in Europe, as well as numerous islands and utilities. KERMIT is calibrated for each system to ensure the system dynamics are appropriately modeled and representative. Part of the calibration process is to compare the
20

output of KERMIT versus actual observed system behavior for key metrics in the seconds and minutes after a large generator has tripped offline.
The hourly data produced by PLEXOS is an input to KERMIT to simulate a 24‐hour period on a second‐by‐second time resolution. A subset of days was then selected and simulated in PLEXOS and KERMIT and the results were extrapolated to produce an annual estimate. Ideally, the subset of days is selected to statistically represent the distribution of results of the primary metric of importance. In this instance, the LTPP Trajectory Case was simulated for the entire 2020 year and the daily regulation costs for CAISO were calculated. The distribution of daily regulation costs provided the initial distribution for the sampling to produce the subset of days to examine in higher fidelity. In total, 15 days were selected from the distribution and their average daily regulation costs are within 1 percent of the average daily regulation costs simulated for CAISO using the LTPP Trajectory Case. The list of days can be found in Table 3.
Table 3: List of Days and Regulation Costs for Base Case
Day SelectedBase Case
Regulation Cost
8‐Jan $216,6569‐Mar $209,396
24‐May $172,6297‐Jun $196,05221‐Jun $218,97924‐Jun $596,7459‐Jul $272,402
13‐Aug $168,47231‐Oct $183,73419‐Dec $194,781
Source: DNV KEMA Energy & Sustainability
3.4 Summary of Inputs 3.4.1 Financial and Market Assumptions Inputs The primary inputs assumed for the financial and market analyses are listed in Table 4. The values are consistent with the values used by the Electric Power Research Institute (EPRI) in their analyses and compiled by the California Energy Storage Alliance (CESA).
21

Table 4: Primary Financial Assumptions
Financial Variable ValueOvernight CAPEX ($/kW) $750
Debt 50%Replacement Costs ($/kWh) $250Replacement Cost Reduction 2%
Variable O&M ($/kWh) $0.25Fixed O&M ($/kW‐yr) $15.00AS Price Escalation 3%Inflation Rate 3%Discount Rate 8%
Source: DNV KEMA Energy & Sustainability
3.4.2 Energy Storage Technology Assumptions Inputs The primary inputs and characteristics assumed for the energy storage technology are listed in Table 5. They represent a fast‐acting battery energy storage device. The following assumptions were also made:
(1) A pay for performance regulation market exists as it is implemented today
(2) Energy storage devices participating as a regulation energy‐managed device must procure or sell energy to maintain a 50 percent SOC
(3) The energy storage device provides regulation as a non‐marginal unit
Table 5: Primary Operational Assumptions for Energy Storage Device
Operational Variable ValuePower Capacity (MW) 20Energy Capacity (MWh) 5
Efficiency (%) 83%Yearly Degredation 2%
Up Regulation Performance 91%Down Regulation Performance 97%Replacement Schedule (years) 10
Source: DNV KEMA Energy & Sustainability
22

3.4.3 Sensitivity Alternatives A number of sensitivities analyses were conducted to examine the influence of the energy storage and financial inputs assumed. An additional scenario with flywheel specific financial and operational parameters was also examined.
3.4.4 Battery Technology Scenario Sensitivity analyses were performed for the following parameters: efficiency, discount rate, replacement costs, and energy capacity. Each sensitivity analysis involved varying the specific input parameter by the following percentages: 50 percent, 75 percent, 150 percent, and 200 percent. Note that 100 percent represents the base value listed in the respective table.
Another sensitivity also examined in the evaluation is the doubling of CAISO regulation costs to examine how influential regulation costs are to the analysis.
3.4.5 Flywheel Technology Scenario The performance data of the battery device was used as the basis of the flywheel technology scenario. To represent a flywheel instead of a battery, the operating and financial input parameters of the pro forma analysis were changed to reflect a flywheel specific device. The operational and financial specifications are listed in Table 6.
Table 6: Operational and Financial Specifications
Operational Variable ValuePower Capacity (MW) 20Energy Capacity (MWh) 5
Efficiency (%) 81%Yearly Degredation 2%
Up Regulation Performance 95%Down Regulation Performance 98%Replacement Schedule (years) 20
Financial Variable ValueOvernight CAPEX ($/kW) $1,500
Debt 50%Replacement Costs ($/kWh) $0Replacement Cost Reduction 0%
Variable O&M ($/kWh) $0.00Fixed O&M ($/kW‐yr) $43.00AS Price Escalation 3%Inflation Rate 3%Discount Rate 8%
Source: DNV KEMA Energy & Sustainability
3.5 Use Case Modeling Results 3.5.1 Unit Specific Results For the base case of values listed in Table 2, the breakeven cost (a benefit‐cost ratio of 1) for a 20 MW, 5MWh energy storage device participating in CAISO regulation markets from 2015 to 2035 is $17.6 million. This represents an $882/kW ($3528/kWh) cost for the device. Any energy storage devices with costs below this level are even more cost competitive and any devices with costs higher are estimated to not be cost effective. For example, a battery energy storage device
23

with a capital cost of $600 per kW is estimated to have a 20 NPV of $7.50 million, whereas a battery energy storage device with a capital cost of $1,000 per kW is estimated to have a 20 NPV of ($3.14), where the parenthesis represent a negative value.
The 20‐year annual pretax revenues and costs for the energy storage device are graphed in Figure 11. A large capital expenditure in year 1 is the construction and installation of the energy storage device using 50 percent debt. Annual loan payments are then made to pay down the remaining principal on the loan at an interest rate of 6.18 percent over the 20‐year life. Operations and maintenance (O&M) costs and imbalance energy costs represent the other two annual costs incurred by the energy storage device. Every 10 years the entire battery stack is replaced because of the annual reduction in energy capacity due to cycle life degradation. Depicted in green are the annual revenues generated by providing regulation capability grown or reduced by 3 percent from the 2020 estimate.
Figure 7: Yearly Revenues and Costs for the Energy Storage Device
Source: DNV KEMA Energy & Sustainability
The breakeven cost, that is benefit cost ratio (BCR) of 1, for a flywheel energy storage device, is $6.44 million ($965/kW or $3,860/kWh) and the BCR for a flywheel with a capital cost of $1,500 is 0.66. This is a 9.4 percent increase in breakeven capital cost compared to the battery energy storage device, indicating higher capital cost projects are feasible. This is because the flywheel device has lower variable O&M costs and does not need to replace a battery stack every 10 years. A summary of the benefit to cost ratios for the Use Case is shown in Table 7.
($6)
($4)
($2)
$0
$2
$4
$6
1 2 3 4 5 6 7 8 9 10 11 12 13 14 15 16 17 18 19 20
Yearly Reven
ues an
d Co
sts
Millions
Year
A/S Regulation
CAPEX
O&MReplacement Costs
24

Table 7: Summary of Benefit to Cost Ratios Results for Scenarios
Scenario Asset TypeCapex ($/kW)
Regulation Price Multiplier
Performance Multiplier
Benefit to Cost
Battery $750 1 1 1.09Flywheel $1,500 1 1 0.66Battery $750 2 1 2.18Flywheel $1,500 2 1 1.33Battery $750 1 0.9 0.98Flywheel $1,500 1 0.9 0.60
Base Case
2x Regulation Price
P4P Performance Score (Pay for Performance)
Source: DNV KEMA Energy & Sustainability
If regulation costs are twice what they were estimated to be using the LTPP Trajectory Case model, then the breakeven cost for a battery energy storage device participating in the CAISO regulation market is $40.78 million ($2,039/MW or $8,156/MWh). This is a 232 percent increase, compared to the base case results. Using the capital costs CESA provides, the BCR for a battery is 2.18 and 1.33 for a flywheel.
From an operations point of view, the most important factor determining the breakeven cost is the performance of the energy storage device. That determines what fraction of the approximately $3 million the energy storage device is able to obtain. If the performance of the energy storage device is reduced by 10 percent (from 98 percent to 88 percent for up regulation performance and from 95 percent to 86 percent for down regulation performance) then the BCR decreases by 0.11 for a battery and 0.06 for a flywheel. The break‐even cost decreases by 14 percent.
25
CHAPTER 4: Transmission Energy Storage-Comparative Portfolio 4.1 Use Case Overview The comparative portfolio Use Case 6 examines two simplified future resource portfolio scenarios by comparing and contrasting the differences in electricity production (for example, commitment decisions, imports, renewable curtailment, emissions) and production costs (for example, net cost to load, California generation cost, import/export prices, ancillary service prices) of each scenario in meeting a modified net load profile.
4.2 Modeling the Use Case Two resource portfolios built to meet future capacity needs are examined. The two scenarios examined are:
(1) Only new, fast acting gas combined cycle gas turbines (CCGTs) and combustion turbines (CTs) are built to meet future capacity needs
(2) Combination of fast acting gas plants (CCGTs and CTs) and energy storage plants (medium and short duration) are built to meet future capacity needs
Scenario A is a reasonable representation of the current trajectory of new capacity additions in California and the United States, given the recent steep decline in gas prices and the relatively cheap capital costs of gas plants and reduced permitting lag times as compared to the capital costs of other conventional generators. Scenario B represents an alternative option to Scenario A, in that it represents a future trajectory of new capacity additions of new, fast‐acting gas plants and fast energy storage devices/plants.
The National Renewable Energy Laboratory (NREL) 7 recently released a report of a similar study using PLEXOS that examined the value of energy storage to the Western Interconnection including the same applications as in this use case. While the methodology and baselines in the NREL study and this study are similar, there are significant differences in the assumptions made and energy storage portfolios evaluated.
4.2.1 Energy Storage Services Modeled In this analysis, hourly energy and ancillary service costs for Scenarios A and B are modeled using PLEXOS. Each resource portfolio (Scenarios A and B) are used to meet a modified net load profile. The modified net load profile for hour “x” is defined as follows:
6 See mini‐summary of use cases posted to the CPUC website, http://www.cpuc.ca.gov/PUC/energy/electric/storage.htm
The data worksheet for the analysis can be found at, http://websafe.kemainc.com/CPUC/Ch4_Comparative_Results_Summary.xlsx
7 Technical Report NREL/TP‐6A20‐58465 May 2013
26
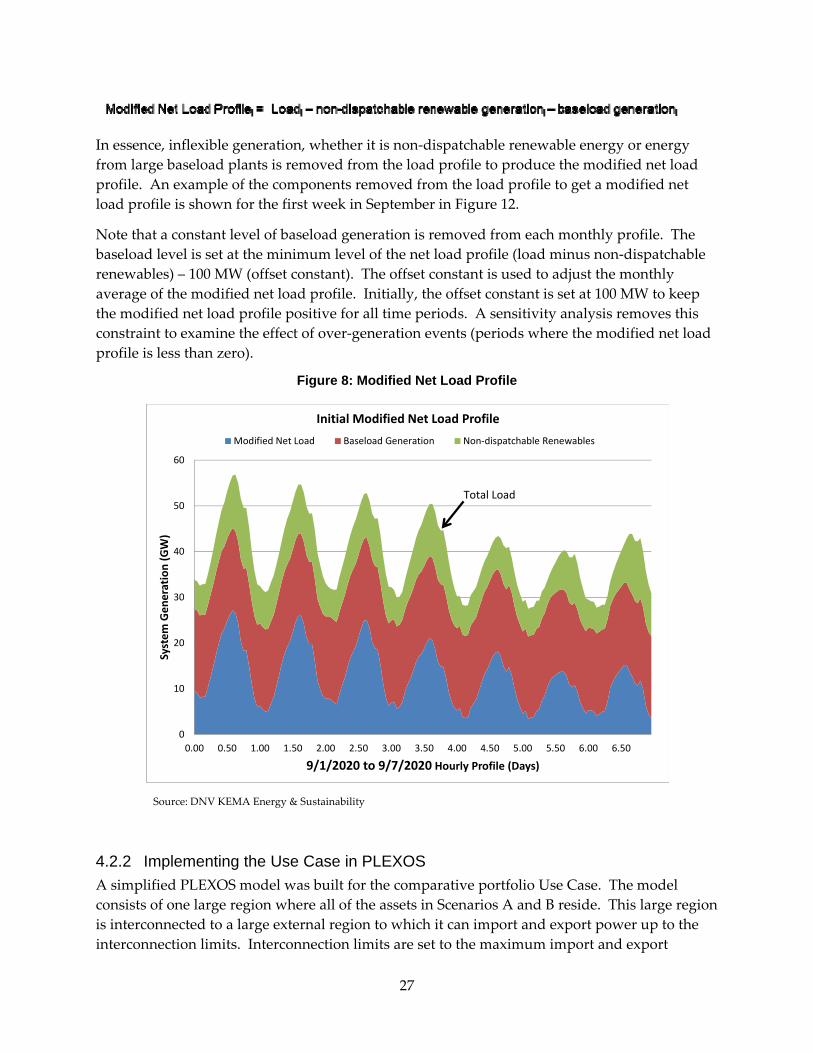
In essence, inflexible generation, whether it is non‐dispatchable renewable energy or energy from large baseload plants is removed from the load profile to produce the modified net load profile. An example of the components removed from the load profile to get a modified net load profile is shown for the first week in September in Figure 12.
Note that a constant level of baseload generation is removed from each monthly profile. The baseload level is set at the minimum level of the net load profile (load minus non‐dispatchable renewables) – 100 MW (offset constant). The offset constant is used to adjust the monthly average of the modified net load profile. Initially, the offset constant is set at 100 MW to keep the modified net load profile positive for all time periods. A sensitivity analysis removes this constraint to examine the effect of over‐generation events (periods where the modified net load profile is less than zero).
Figure 8: Modified Net Load Profile
0
10
20
30
40
50
60
0.00 0.50 1.00 1.50 2.00 2.50 3.00 3.50 4.00 4.50 5.00 5.50 6.00 6.50
System
Gen
eration (GW)
9/1/2020 to 9/7/2020 Hourly Profile (Days)
Initial Modified Net Load Profile
Modified Net Load Baseload Generation Non‐dispatchable Renewables
Total Load
Source: DNV KEMA Energy & Sustainability
4.2.2 Implementing the Use Case in PLEXOS A simplified PLEXOS model was built for the comparative portfolio Use Case. The model consists of one large region where all of the assets in Scenarios A and B reside. This large region is interconnected to a large external region to which it can import and export power up to the interconnection limits. Interconnection limits are set to the maximum import and export
27

capabilities of California in the LTPP Trajectory Case. A stacked import and export cost curve is used to value imports and exports each hour and the values used are representative of import and export costs estimated for California using the LTPP Trajectory Case.
The ancillary services included in each scenario are load following, regulation, and spinning reserve. The hourly ancillary service requirements for each ancillary service product are determined in a manner consistent with CAISO’s procurement of each product type. It is assumed the energy storage devices can provide any ancillary service product.
Four months of modified net load profile were used to compare portfolios A and B. The four months examined are January, March, July, and September. The modified net load profiles were developed using the load and renewable profiles used in the LTPP Trajectory Case model.
4.3 Portfolio Models 4.3.1 CT and CCGT, Portfolio Case A For Scenario A, only two types of gas plants are considered. One is a highly flexible CT plant, such as a LMS100, and the other is a CCGT, representing a highly flexible CCGT plant, such as a Siemens Flex‐Plant CCGT. Table 8 summarizes the operational specifications for the LMS100 and CCGT units8. The amount of LMS100 and CCGT capacity added to Scenario A is equal to the maximum modified net load value divided by the nameplate capacity of each generator and rounded up to the nearest integer. The reasoning behind this formula is that the model should not be capacity constrained in order to find the lowest production cost value for a given net load profile and set of asset characteristics.
Table 8: Operational Specifications of a LMS100 and CCGT Base Turbine
Variable Value UnitNameplate Capacity 100 MWHeat Rate 8,628 BTU/kWhEfficiency 40% %Ramp Rate 4 MW/minTotal Overnight CAPEX $1,535 $/kWVariable O&M $4.17 $/MWhFixed O&M $17.40 $/kW‐yrStart‐up Fuel Requirement 2.8 MMBtu/MWStart‐up Cost $1,725 $/startMinimum Operating Level 40% % of Nameplate CapacityFuel Cost $6.16 $/MMBtuGHG Adder $36.65 $/Short Ton
LMS100 Base Specifications
8 Values were generated through the Stakeholder process
28
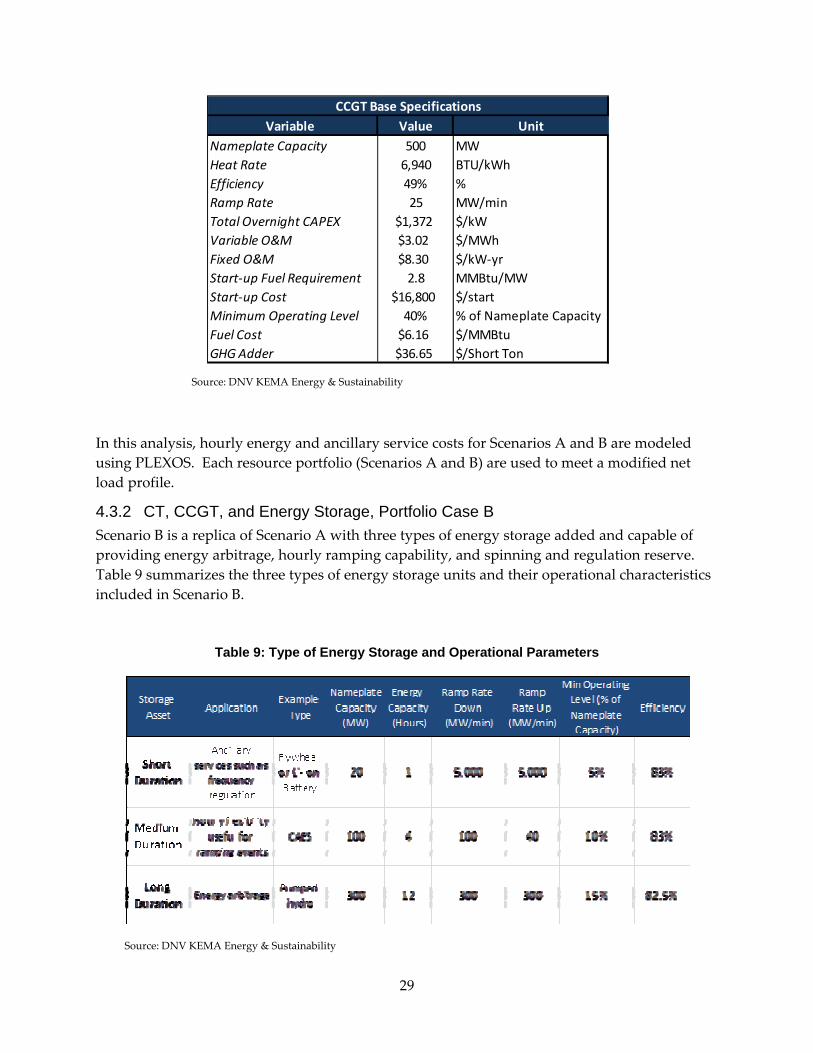
Variable Value UnitNameplate Capacity 500 MWHeat Rate 6,940 BTU/kWhEfficiency 49% %Ramp Rate 25 MW/minTotal Overnight CAPEX $1,372 $/kWVariable O&M $3.02 $/MWhFixed O&M $8.30 $/kW‐yrStart‐up Fuel Requirement 2.8 MMBtu/MWStart‐up Cost $16,800 $/startMinimum Operating Level 40% % of Nameplate CapacityFuel Cost $6.16 $/MMBtuGHG Adder $36.65 $/Short Ton
CCGT Base Specifications
Source: DNV KEMA Energy & Sustainability
In this analysis, hourly energy and ancillary service costs for Scenarios A and B are modeled using PLEXOS. Each resource portfolio (Scenarios A and B) are used to meet a modified net load profile.
4.3.2 CT, CCGT, and Energy Storage, Portfolio Case B Scenario B is a replica of Scenario A with three types of energy storage added and capable of providing energy arbitrage, hourly ramping capability, and spinning and regulation reserve. Table 9 summarizes the three types of energy storage units and their operational characteristics included in Scenario B.
Table 9: Type of Energy Storage and Operational Parameters
Source: DNV KEMA Energy & Sustainability
29

The energy storage devices capable of energy arbitrage are 300 MW energy storage devices with 12 hours of stored energy capacity. The ramping units are 100 MW storage devices with 4 hours of energy capacity. The spinning and regulation reserve units are 20 MW energy storage devices with 1 hour of energy capacity. The number of energy arbitrage devices added was calculated by the following formula:
# of 300 MW energy storage devices = (max value of the net load - the min ave daily modified net load value)/300 + 1
The number of 100 MW storage devices for ramping was calculated by the following formula:
# of 100 MW energy storage devices = maximum 3 hour ramp observed during the 4 month period / 100 + 1
The number of 20 MW energy storage devices for regulation and spinning reserve was calculated by the following formula:
# of 20 MW energy storage devices = (max of hourly spinning capacity + max of regulation capacity) / 20 + 1
4.4 Sensitivities Table 10 lists the six sensitivity cases examined for the comparative portfolio Use Case. The six cases examine the six key variables that critically determine the results.
Table 10: Listing of Use Cases Examined
Source: DNV KEMA Energy & Sustainability
4.5 System Impacts Results Figure 13 and Figure 14 are stacked area graphs detailing the hourly production from the class of asset (CCGT and CT for Case A; CCGT, CT, and energy storage for Case B). As seen in Figure 13, CCGTs produce the majority of the hourly energy and the CT assets operate as peaker units. The CTs operate for 1‐ to 3‐hours a day and at most 7 CTs operate at once, whereas at most 279 CCGTs operate at once. CCGTs provide 99.91 percent of the energy to meet the annual modified net load, while CTs provide the remaining 0.09 percent energy.
30

Figure 9: Dispatch of CCGT and CT Assets for Case A for the First Week of September
0
5
10
15
20
25
30
9/1/2020 9/2/2020 9/3/2020 9/4/2020 9/5/2020 9/6/2020 9/7/2020
Hou
rly ESystem Ene
rgy Prod
uction
(GWhs)
Hour (for first week in September)
CCGT MWh Production
CT MWh Production
Source: DNV KEMA Energy & Sustainability
As seen in Figure 14, adding energy storage to Case A eliminates the use of the CTs for the month of September. In fact, energy storage eliminated the use of CTs for the June, September, and December simulations and reduced the use of CTs for March. In March, CTs provided 333 MWh of energy, which is reduced from 5,517 MWhs that CTs provided in March in Case B. In total, CCGTs provide 99.48 percent of the total energy, energy storage provides 0.52 percent, and CTs provides less than 0.01 percent.
31

Figure 10: Hourly Dispatch of CCGT and Energy Storage Assets for Case B for Sept., Week 1
0
5
10
15
20
25
30
9/1/2020 9/2/2020 9/3/2020 9/4/2020 9/5/2020 9/6/2020 9/7/2020
Hou
rly ESystem Ene
rgy Prod
uction
(GWhs)
Hour (for first week in September)
CCGT MWh Production
Storage MWh Production
Source: DNV KEMA Energy & Sustainability
Table 11 reports the monthly and annual results for the base case implementations of Case A and Case B. The annual benefit estimated by introducing energy storage into an all gas portfolio is $0.37 per MWh and the range of monthly benefits is $0.26 to $0.46 per MWh. This translates to a total benefit of $8.64 million. The source of the majority of the benefits is due to reduced fuel costs of the CTs. The second leading cause of reduction is a reduced number of startups (more efficient utilization of generation). Introducing energy storage does not only produce benefits. There are costs associated with introducing energy storage, namely increased generation from the CCGT assets to charge the energy storage assets and to true up lost energy due to inefficiencies.
Table 11: Summary Results for the Four Months Simulated and Estimated Annual Results
Difference DifferenceCase A Case B ($Mlns) ($/MW
March $330.62 $329.96h)
June $378.30 $377.92September $359.62 $359.08December $282.58 $282.00Annual $5,404 $5,396
Month and Annual TotalBase Case Results ($Mlns)
($0.66) ($0.45)($0.38) ($0.26)($0.54) ($0.34)($0.58) ($0.46)($8.64) ($0.37)
Source: DNV KEMA Energy & Sustainability
32

The spring and winter months realize the highest benefit savings of the four months simulated. This corresponds with the months with the steepest modified net load shapes (low daily load factors), indicating that the production cost benefits of energy storage increase as the modified net load becomes peakier (or load factor declines).
Table 12 lists the range of results for the sensitivity analyses. The factor with the most influence is fuel costs, as varying fuel costs from 50 percent to 200 percent produced the widest range in results. Estimated benefits ranged from $0.20 per MWh to $0.64 per MWh by adjusting fuel costs. The second most important factor affecting the results is the heat rate of the generators. More benefits can be realized when energy storage is introduced to systems with more inefficient generators. The least contributing factor to the results is the slope of the generators heat rate.
Table 12: Scenario Analysis Results
Low Base HighRegulation Adjustment ($0.39) ($0.37) ($0.36)
($0.31) ($0.37) ($0.41)($0.40) ($0.37) ($0.35)($0.20) ($0.37) ($0.64)($0.35) ($0.37) ($0.39)
Generator Maximum Heat RateStartup CostsFuel CostsGenerator Heat Rate Slope
Sensitivity Results ($/MWh)Scenario
Source: DNV KEMA Energy & Sustainability
Emissions turn out not to be significantly impacted by replacing peaking generation with energy storage. This has been borne out in prior studies9 and is not surprising. The major reasons for this outcome in this case are:
(1) There are emissions savings by substituting energy from more efficient CCGT for energy from peaking CT. However, these are offset by the energy losses in the energy storage charge‐discharge cycle. Achieving emissions savings from energy storage requires more efficient energy storage technologies.
(2) Older CT plants experienced degraded heat rate and increased NOx emissions while ramping rapidly. Modern CT technologies are much less subject to this effect and can ramp and provide regulation services without increased emissions
(3) If the energy storage were enabling increased utilization of renewable resources there would be emissions savings. However, the LTPP baseline did not contemplate
9 US Dept of Energy Sandia National Labs Project 96362 “Emission Study of Advanced Storage used for Frequency Regulation,” KEMA Inc Dec 2012
33

curtailment of renewables at night, for instance, so the opportunity for energy storage to increase renewable production was eliminated in the use case assumptions.
34

CHAPTER 5: Distribution Energy Storage-Substation Capacity Deferral 5.1 Use Case Overview Substation‐sited distributed energy storage 10can be employed by a utility for:
(1) deferring substation equipment upgrades by shaving system peak demand
(2) providing Volt/VAR (volt‐ampere reactive)
(3) reducing substation transformer losses
Figure 15 illustrates how energy storage is sited in this Use Case. The energy storage device is located on the secondary side of the substation transformer. Therefore, real and reactive output power from the energy storage device reduces power flow through the substation transformer to serve the distribution circuit. This, in turn, also reduces the voltage drop and losses across the substation.
Figure 11: Substation-sited Energy Storage
Substation -Sited
Storage
5
Source: DNV KEMA Energy & Sustainability
10 See mini‐summary of use cases posted to the CPUC website, http://www.cpuc.ca.gov/NR/rdonlyres/85723CE4‐A503‐499F‐804F‐DC7BA8E9B991/0/DistributedEnergyStorageUseCaseSubstation.pdf
The data worksheet for the analysis can be found at, http://websafe.kemainc.com/CPUC/Ch5_DeferralUseCase_Inputs‐Results.xlsx
35

Of the above applications, substation upgrade deferral is the primary application for this Use Case. The substation upgrade deferral reflected here is the delayed investment of additional substation transformer capacity. Energy storage enables this deferral by reducing substation transformer peak loading during the hours of the years for which the respective equipment would have been overloaded without energy storage. In addition to peak shaving, the energy storage device can output reactive power to reduce voltage drops and losses across the substation transformer. Finally, by reducing peak demand overloads on the substation transformer, its useful life can be extended.
5.2 Modeling the Use Case 5.2.1 Electric System Model The cost‐effectiveness of energy storage for this Use Case is evaluated based on engineering modeling. In particular, the costs and benefits account for system‐wide impacts, observed via time series power flow simulation. Also, the modeling results guide assumptions and evaluate the degree to which energy storage can meet the needs of the stated applications (at different energy storage sizes, for example). For this Use Case, the model simulates power flow over a sample multi‐phase distribution test feeder, publicly available from the Institute of Electrical and Electronics Engineers (IEEE) as IEEE 123 Node Test Feeder.11 Simulation results for these systems are obtained using DNV KEMA’s distribution energy storage valuation tool, ES‐GRID.
In the IEEE 123 Node Test Feeder, system loads are specified as peak real and reactive demand. To create hourly load profiles from these spot loads, each load in the network was assigned to one of three load classes and assigned an hourly planning load profile. The three load classes included residential, commercial, and industrial. Loads were assigned to classes based on their connection, single‐ versus three‐phase, and their magnitude. Lastly, the substation transformer was rated at 5,000 kilavolt‐ampere (kVa) and the load profiles were set such that the simulation year’s peak demand represented 90 percent of maximum nameplate loading of the substation.
The energy storage device is sited at the substation. Figure 16 illustrates the placement of the energy storage device on the IEEE 123 Node Test Feeder.
11 “IEEE 123 Note test Feeder,” IEEE Power Engineering Society, Power System Analysis, Computing and Economics Committee, Distribution System Analysis Subcommittee.
36

Figure 12: IEEE 123 Node Test Feeder with Energy Storage placed at Substation
Source: DNV KEMA Energy & Sustainability
5.2.2 Energy Storage Controls Model The objective of real power storage dispatch controls for this Use Case is a reduction of peak substation demand. Although the real power controls are not designed specifically to target voltage effects, they can mitigate some voltage issues by reducing the voltage drop over the substation transformer. The problem is formulated as a discretized deterministic dynamic programming model. Using base case simulation results, as well as battery specifications and constraints, the model computes hourly dispatch of the energy storage device. Energy storage reactive power controls are implemented using a controller which regulates energy storage reactive power output as a proportion of the total substation reactive power demand and the real power output of the energy storage. Reactive power controls further improve circuit voltage by providing Volt/VAR (volt‐ampere reactive) support and mitigating low voltage constraint violations.
5.3 Summary of Inputs To evaluate the financial impact of energy storage in this Use Case, the following benefit and cost elements are evaluated:
(1) Substation upgrade deferral. This benefit represents the ability to delay substation transformer upgrades for one or more years. An annual fixed charge rate is calculated and applied to the total installed cost of the upgrade and valued as a benefit for the number of years deferral is possible with energy storage. The number of years that the substation upgrade is deferred is calculated by counting the number of years between
37

the time that peak demand exceeds 90 percent of circuit capacity in the base and test cases.
(2) Distribution loss reduction. Changes in system losses are calculated via engineering simulations. Annual time series data for electricity wholesale prices are used to estimate the value of loss changes. Some configurations slightly increase losses, though others decrease losses.
Energy storage costs considered in the analysis include:
(1) Investments cost of energy storage. The energy storage unit’s capital cost is calculated as a function of the size of the unit and the battery type. During the analysis period, storage units are replaced based on estimated actual life. Energy storage actual life is calculated as a function of the number of charge/discharge half‐cycles and the amount of energy that is charged/discharged in each half‐cycle, and its calendar life. (The engineering simulation tracks storage charges and discharges). A fixed charge rate is used to levelize the total cost.
(2) Cost of replacement. The cost of replacing energy storage at the end of its actual life is assumed to be a fraction of initial investment cost. The number of replacements during the project analysis period depends on the energy storage actual life.
(3) Operation and maintenance cost. Annual operation and maintenance costs are assumed to be proportional to energy storage power capacity.
(4) Cost of electricity. This cost element is defined as the cost of energy to charge the battery. A set of electricity wholesale price time series data is used to approximate the cost of electricity.
(5) Moving cost. This cost reflects the cost to move a mobile energy storage unit to another circuit for additional deferral benefit, but at a new circuit.
Additional financial input assumptions reflect common values used across the analyses associated with ES OIR study effort. Table 13 identifies the financial assumptions used in this Use Case.
38

Table 13: Financial Assumptions Use in Analysis
Variable Value
General inflation rate* (prior to and post 2020) 2.00%
Electricity price escalation rate (prior to 2020) 1.00%
Electricity price escalation rate (post 2020) 2.00%
Percent financed with equity 50.00%
Percent financed by debt 50.00%
Cost of equity 11.47%
Cost of debt 6.18%
Property tax rate 1.10%
Insurance 0.40%
Weighted average cost of capital 7.57%
Federal income tax rate 35%
State income tax rate 8.84%
*All prices are inflated from 2013 to 2020 and from 2020 to 2040 with a 2 percent inflation rate.
Source: DNV KEMA Energy & Sustainability
To evaluate the cost‐effectiveness of energy storage under a range of scenarios, varying cost and benefit values were assigned to key financial parameters and scenarios were developed by taking a combination of these values. Table 14 presents key sensitivity values.
39
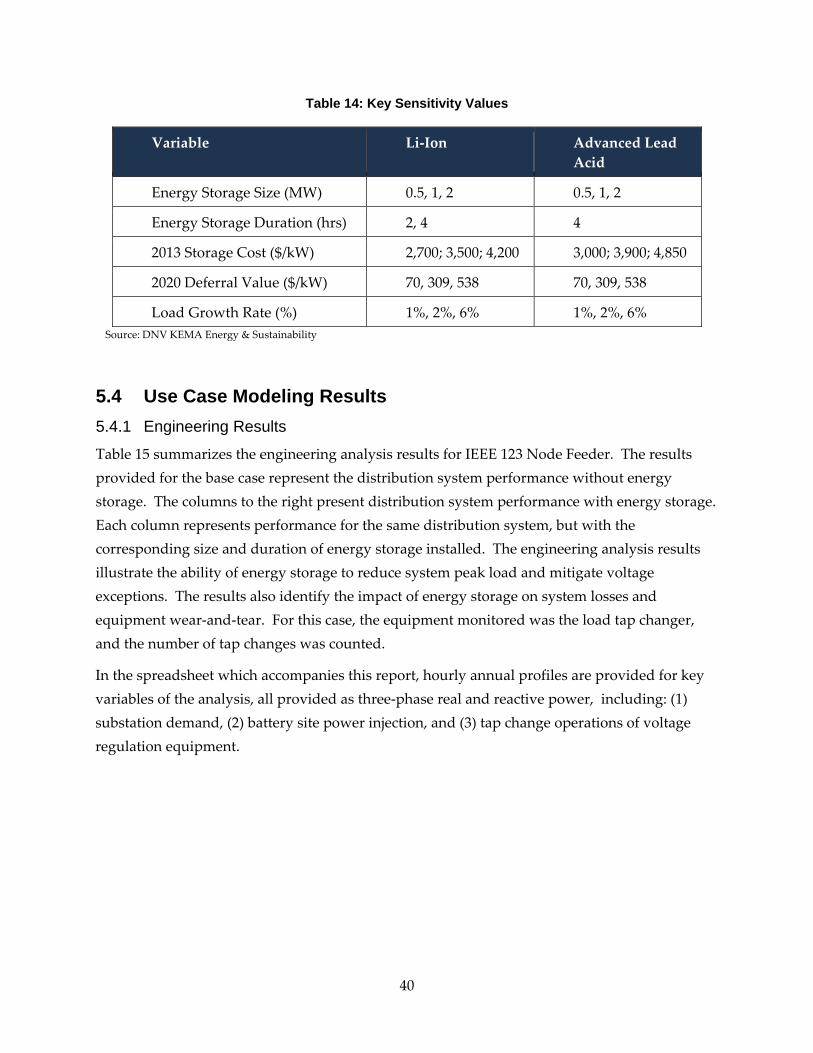
Table 14: Key Sensitivity Values
Variable Li‐Ion Advanced Lead Acid
Energy Storage Size (MW) 0.5, 1, 2 0.5, 1, 2
Energy Storage Duration (hrs) 2, 4 4
2013 Storage Cost ($/kW) 2,700; 3,500; 4,200 3,000; 3,900; 4,850
2020 Deferral Value ($/kW) 70, 309, 538 70, 309, 538
Load Growth Rate (%) 1%, 2%, 6% 1%, 2%, 6% Source: DNV KEMA Energy & Sustainability
5.4 Use Case Modeling Results 5.4.1 Engineering Results
Table 15 summarizes the engineering analysis results for IEEE 123 Node Feeder. The results provided for the base case represent the distribution system performance without energy storage. The columns to the right present distribution system performance with energy storage. Each column represents performance for the same distribution system, but with the corresponding size and duration of energy storage installed. The engineering analysis results illustrate the ability of energy storage to reduce system peak load and mitigate voltage exceptions. The results also identify the impact of energy storage on system losses and equipment wear‐and‐tear. For this case, the equipment monitored was the load tap changer, and the number of tap changes was counted.
In the spreadsheet which accompanies this report, hourly annual profiles are provided for key variables of the analysis, all provided as three‐phase real and reactive power, including: (1) substation demand, (2) battery site power injection, and (3) tap change operations of voltage regulation equipment.
40

Table 15: Summary Results With and Without Energy Storage
Source: DNV KEMA Energy & Sustainability
5.4.2 Financial Results
Drawing from the results of the engineering analysis, a cash flow analysis was then calculated for multiple scenarios, using combinations of the key sensitivities shown in Table 14. The cash flows and computed benefit cost ratios for all scenarios can be found in the spreadsheet which accompanies this report. Five illustrative scenarios are shown in Table 16.
Table 16: Sample of Financial Results
Source: DNV KEMA Energy & Sustainability
Figure 17 depicts the BCR for Scenario 178, on the left and Scenario 205, on the right. Scenario 178 illustrates that the use of energy storage for deferral at a single location was cost‐effective, where alternative costs were high and the battery was optimally sized. Regarding optimal sizing, as shown with Scenario 205, a larger size than the 0.5 MW required for deferral adds cost with little incremental value.
41

Figure 13: Benefits, Costs and NPV for Scenarios 178 and 205
255
(1,108)
‐$5,000
‐$2,500
$0
$2,500
$5,000
2020
$,000s
Deferral Losses Storage Investment Storage O&M Net Present Value
0.5 MW
1 MW
ES ‐ 3,500 $/kW; Tx ‐ 538 $/kW0.5 MW, 4 hr; BCR ~ 1.11 MW, 4 hr; BCR ~ 0.77
Source: DNV KEMA Energy & Sustainability
The rate of load growth also affects the cost‐effectiveness of an investment. In particular, the slower the load growth, the longer the energy storage can defer a substation investment. Figure 18 illustrates the differences in cost‐effectiveness under a 1 percent load growth assumption, on the left (Scenario 178) and under a 2 percent load growth assumption, on the right (Scenario 179).
Figure 14: Benefits, Costs and NPV for Scenarios 178 and 179
255
(864)
‐$3,000
‐$2,000
‐$1,000
$0
$1,000
$2,000
$3,000
2020
$,000
s
Deferral Losses Storage Investment Storage O&M Net Present Value
1% Growth
2% Growth
ES ‐ 3,500 $/kW; Tx ‐ 538 $/kW; 0.5 MW, 4 hr1% Growth: BCR ~ 1.12% Growth: BCR ~ 0.64
42
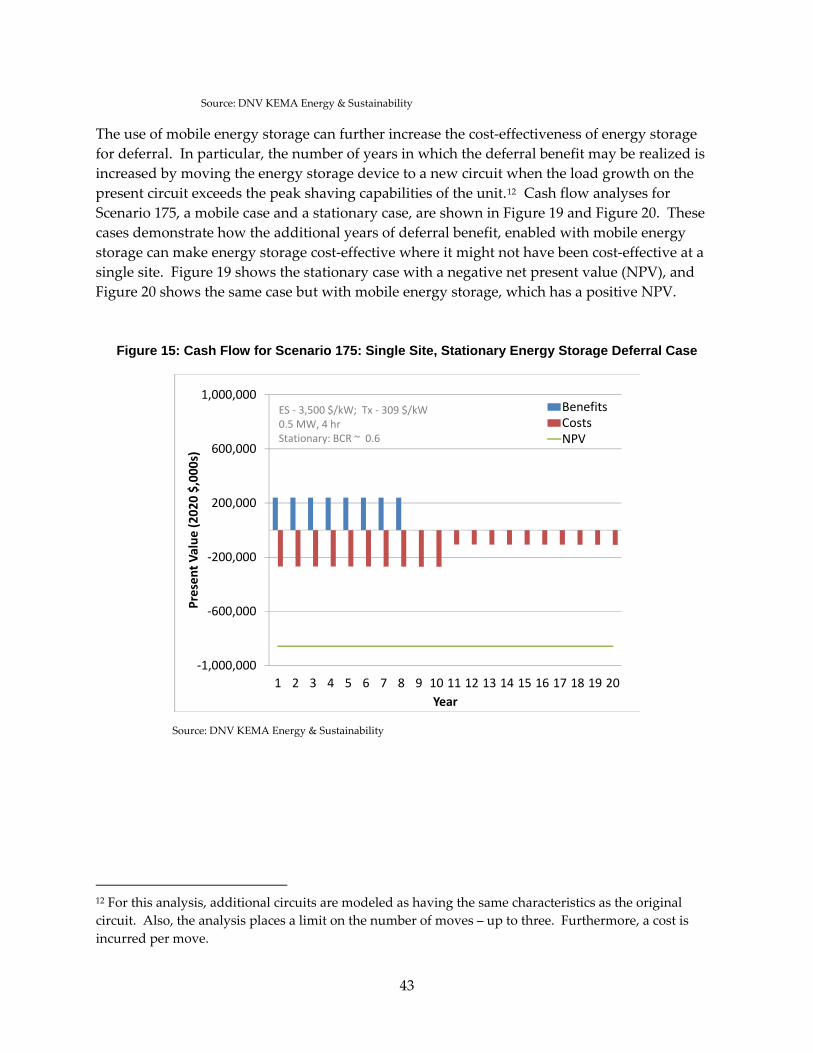
Source: DNV KEMA Energy & Sustainability
The use of mobile energy storage can further increase the cost‐effectiveness of energy storage for deferral. In particular, the number of years in which the deferral benefit may be realized is increased by moving the energy storage device to a new circuit when the load growth on the present circuit exceeds the peak shaving capabilities of the unit.12 Cash flow analyses for Scenario 175, a mobile case and a stationary case, are shown in Figure 19 and Figure 20. These cases demonstrate how the additional years of deferral benefit, enabled with mobile energy storage can make energy storage cost‐effective where it might not have been cost‐effective at a single site. Figure 19 shows the stationary case with a negative net present value (NPV), and Figure 20 shows the same case but with mobile energy storage, which has a positive NPV.
Figure 15: Cash Flow for Scenario 175: Single Site, Stationary Energy Storage Deferral Case
‐1,000,000
‐600,000
‐200,000
200,000
600,000
1,000,000
1 2 3 4 5 6 7 8 9 10 11 12 13 14 15 16 17 18 19 20
Presen
t Value
(202
0 $,00
0s)
Year
BenefitsCostsNPV
ES ‐ 3,500 $/kW; Tx ‐ 309 $/kW0.5 MW, 4 hr Stationary: BCR ~ 0.6
Source: DNV KEMA Energy & Sustainability
12 For this analysis, additional circuits are modeled as having the same characteristics as the original circuit. Also, the analysis places a limit on the number of moves – up to three. Furthermore, a cost is incurred per move.
43

Figure 16: Cash Flow for Scenario 175: Multiple Site, Mobile Energy Storage Deferral Case
‐800,000
‐400,000
0
400,000
800,000
1 2 3 4 5 6 7 8 9 10 11 12 13 14 15 16 17 18 19 20
Presen
t Value
(202
0 $,00
0s)
Year
BenefitsCostsNPV
ES ‐ 3,500 $/kW; Tx ‐ 309 $/kW0.5 MW, 4 hr Mobile: BCR ~ 1.06
Source: DNV KEMA Energy & Sustainability
Furthermore, mobile energy storage enables cases with lower alternative deferral costs to be cost‐effective. For example, the mobile version of Scenario 175 has a deferral value of $309/kW, whereas the cost‐effective stationary case noted above, Scenario 178, has a deferral value of $538/kW for the same energy storage cost ($3,500/kW) and size (0.5 MW with 4 hours).
5.4.3 Summary of Results The findings of the substation‐sited distributed energy storage Use Case are summarized below:
(1) Deferral is the primary value benefit for the substation‐sited energy storage when other applications of ancillary services or renewable integration are not considered.
a. Losses can decrease or increase, depending on the energy storage size and system set‐up, but the cost and benefits of losses tend not to have significant effect on overall cost‐effectiveness.
(2) The ability to move energy storage across multiple sites can increase deferral value for an incremental cost lower than the price of a new unit.
(3) Higher deferral costs, lower battery costs, and the ability to move across multiple sites in sequence can result in positive net values for this application.
(4) Larger sizes can allow for longer deferral periods, but can also add cost without much value if duration or capacity is in excess of system load management needs.
Additional benefits not valued here include improved power quality potential and potential improvements to system reliability.
44

CHAPTER 6: Distribution Energy Storage-PV Integration Use Case 6.1 Use Case Overview Energy storage can be employed by utilities to facilitate the integration of PV generation and mitigate possible negative impacts on the distribution system by:
(1) avoiding system upgrades required for PV integration
(2) mitigating voltage fluctuations at the primary distribution side resulting from intermittent distributed PV generation
(3) reducing distribution system losses through improved utilization of distributed generation
(4) deferring upgrade of substation equipment by time‐shifting peak PV generation to coincide with system load peak
In the Use Case presented here13, the avoided system upgrade is reflected as an avoided investment to re‐conductor distribution equipment that would have become overloaded in the presence of reverse power flows from downstream PV generation. Energy storage is presented as an alternative to this equipment upgrade. This avoided upgrade is the primary application of this Use Case. Also, energy storage can mitigate voltage fluctuations and violations that might arise from PV production intermittency, resulting from changing environmental conditions, and non‐concurrence of system load peak and PV output. Mitigation of voltage fluctuations can also benefit the system by reducing the wear‐and‐tear on distribution equipment that manages feeder voltage. The controls modeled here are not designed specifically to target voltage effects, but operations are assessed to observe any opportunistic benefit obtained. Lastly, charging the energy storage devices during periods of high PV output enables time‐shifting of generation to better coincide with the system load peak. This application of energy storage can firm up the peak reductions obtained from renewable distributed generation and therefore enable deferral of substation equipment.
Figure 21 and Figure 22 present daily simulation results to illustrate how energy storage enables the avoided system upgrade benefit and the deferral benefit stated above.
In Figure 21, the red line represents the line flow violation that would have occurred without energy storage. The green line represents the line flow with energy storage, which is within the line limit.
13 See mini‐summary of use cases posted to the CPUC website, http://www.cpuc.ca.gov/PUC/energy/electric/storage.htm
The data worksheet for the analysis can be found at, http://websafe.kemainc.com/CPUC/Ch6_DistributionPVCase_Inputs‐Results.xlsx
45

Figure 17: Charging Energy Storage Reduces Power Flow from PV Generation Site
‐100
0
100
200
300
400
500
600
1 2 3 4 5 6 7 8 9 10 11 12 13 14 15 16 17 18 19 20 21 22 23 24
Power
Hour
Line Flow Violation (Base Case)
Acceptable Line Flow (Storage Case)
Line Limit
Source: DNV KEMA Energy & Sustainability
In Figure 22, the green line represents net energy demand at the substation with energy storage in combination with the downstream PV. The red line represents net energy demand without energy storage and downstream PV only. The dotted grey line represents original demand without PV production. With energy storage, the maximum net demand at the substation is lower and occurs slightly later than the case without energy storage.
Figure 18: Substation Peak Load is Reduced through Time-Shift of the PV Generation
0
500
1000
1500
2000
2500
3000
3500
4000
1 2 3 4 5 6 7 8 9 10 11 12 13 14 15 16 17 18 19 20 21 22 23 24
Dem
and (kW)
Hour
Original Load Net Demand with PV Net Demand with PV+ES PV Output
Source: DNV KEMA Energy & Sustainability
46

6.2 Modeling the Use Case 6.2.1 PV Model In this Use Case, the distributed PV generation is modeled as a single, 1,500 kW, utility‐owned three‐phase PV generator. This engineering model can be representative of either (1) a single, large‐scale PV generator, or (2) an aggregate of multiple downstream PV generators.
The output profile of the PV generator is modeled using solar irradiance data, collected from the National Renewable Energy Laboratory (NREL) using a measurement site in Southern California.14 This solar irradiance data was converted to total power output of the generator.15
The energy storage device is co‐located with the PV generator, interconnected at the primary distribution level. Figure 23 illustrates the placement of the PV and ES on the sample feeder. The engineering model for the PV integration case is based the IEEE 123 Node Test Feeder, as described in detail below.
Figure 19: IEEE 123 Node Test Feeder with Downstream PV and Co-located Energy Storage
Source: DNV KEMA Energy & Sustainability
14 Specifically, this site is Loyola Marymount University, University Hall, Los Angeles, California. Available online at: http://www.nrel.gov/midc/lmu/
15 http://users.cecs.anu.edu.au/~Andres.Cuevas/Sun/help/PVguide.html
47

6.2.2 Electric System Model The system is modeled using sample hourly planning load profiles. The substation transformer is rated at 5,000 kVA substation. To demonstrate the voltage issues which arise on distribution feeders with intermittent generation, the test feeder was modified to increase the length of all distribution lines by a factor of 1.5.
The PV unit and energy storage device is placed on the IEEE 123 Node Test Feeder, at the end of a three‐phase capacity constrained lateral which branches off the circuit’s main three‐phase feeder. The conductor for the lateral section between the PV generation and the main feeder is modeled as a Sparrow #2 conductor. This conductor size was selected to create a case where there would be an overload condition on the lateral. The total length of this lateral was set to be 1.1364 miles. A #2 conductor is commonly found on primary distribution circuits. A per‐phase real power transfer limit of 354 kW is assumed for the constrained lateral. In Figure 23, the capacity‐limited lateral is highlighted.
6.2.3 Energy Storage Controls Model The objective of real power storage dispatch controls for this Use Case is a reduction of reverse power flow exceeding the constrained lateral capacity. Although the real power controls are not designed specifically to target voltage effects, they can mitigate some voltage issues by controlling PV output intermittency. The problem is formulated as a discretized deterministic dynamic programming model. Using base case simulation results, as well as battery specifications and constraints, the model computes hourly dispatch of the energy storage device. Energy storage reactive power controls are implemented using a controller which regulates energy storage reactive power output as a proportion of the total substation reactive power demand and the real power output of the energy storage unit. Reactive power controls further improve circuit voltage by providing Volt/VAR support and mitigating low voltage constraint violations.
6.3 Summary of Inputs To evaluate the financial impact of energy storage in this Use Case, the following benefit and cost elements are evaluated:
(1) Avoided cost of upgrade. This represents a one‐time avoided cost of an upgrade which entails re‐conductoring. The value is achieved where energy storage can maintain the critical lateral power flow within its capacity limit.
(2) Avoided cost of voltage regulator installation. An added voltage regulator installation is assumed as a one‐time cost in the first year of analysis, and is avoided if energy storage can eliminate all voltage exception events.
(3) Substation upgrade deferral. This represents the benefit of delaying a substation transformer upgrade, as calculated in Chapter 5. The difference here is that the benefit attributed to energy storage is the difference between what is achievable with PV alone versus with energy storage and PV. The number of years that a substation upgrade is
48

deferred is calculated by counting the number of years between the time that peak demand exceeds 90 percent of circuit capacity in the base and test cases.
(4) Distribution loss changes. Annual time series data for electricity wholesale prices are used to compute value of loss changes.
Energy storage costs considered in the analysis include:
(1) Investments cost of energy storage. The energy storage unit’s capital cost is calculated as a function of the size of the unit and the battery type. During the analysis period, energy storage units are replaced based on estimated actual life. Energy storage actual life is calculated as a function of the number of charge/discharge half‐cycles and the amount of energy that is charged/discharged in each half‐cycle, and its calendar life. (The engineering simulation tracks energy storage charges and discharges). A fixed charge rate is used to levelize the total cost.
(2) Cost of replacement. The cost of replacing energy storage at the end of its actual life is assumed to be a fraction of initial investment cost. The number of replacements during the project analysis period depends on the energy storage actual life.
(3) Operation and maintenance cost. Annual operation and maintenance costs are assumed to be proportional to energy storage power capacity.
(4) Cost of electricity. This cost element is defined as the cost of energy to charge the battery. A set of electricity wholesale price time series data is used to approximate the cost of electricity.
Table 17 shows the general financial assumptions used in this Use Case.
49

Table 17: Financial Assumptions Used in Analysis
Variable Value
General inflation rate* (prior to and post 2020) 2.00%
Electricity price escalation rate (prior to 2020) 1.00%
Electricity price escalation rate (post 2020) 2.00%
Percent financed with equity 50.00%
Percent financed by debt 50.00%
Cost of equity 11.47%
Cost of debt 6.18%
Property tax rate 1.10%
Insurance 0.40%
Weighted average cost of capital (WACC) 7.57%
Federal income tax rate 35%
State income tax rate 8.84%
*All prices are inflated from 2013 to 2020 and from 2020 to 2040 with 2% inflation rate.
Source: DNV KEMA Energy & Sustainability
To evaluate the cost‐effectiveness of energy storage under a range of scenarios, varying cost and benefit values were assigned to key financial parameters and scenarios were developed by taking a combination of these values. These key sensitivity values can be seen in Table 18.
50
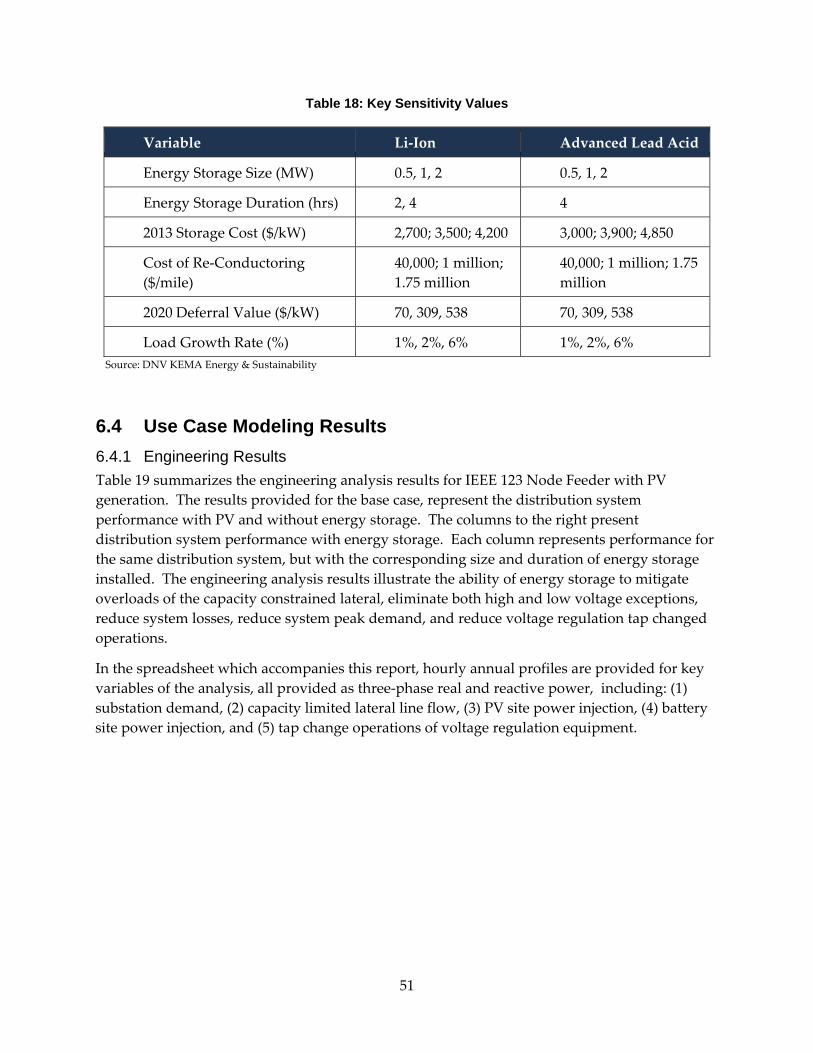
Table 18: Key Sensitivity Values
Variable Li‐Ion Advanced Lead Acid
Energy Storage Size (MW) 0.5, 1, 2 0.5, 1, 2
Energy Storage Duration (hrs) 2, 4 4
2013 Storage Cost ($/kW) 2,700; 3,500; 4,200 3,000; 3,900; 4,850
Cost of Re‐Conductoring ($/mile)
40,000; 1 million; 1.75 million
40,000; 1 million; 1.75 million
2020 Deferral Value ($/kW) 70, 309, 538 70, 309, 538
Load Growth Rate (%) 1%, 2%, 6% 1%, 2%, 6% Source: DNV KEMA Energy & Sustainability
6.4 Use Case Modeling Results 6.4.1 Engineering Results Table 19 summarizes the engineering analysis results for IEEE 123 Node Feeder with PV generation. The results provided for the base case, represent the distribution system performance with PV and without energy storage. The columns to the right present distribution system performance with energy storage. Each column represents performance for the same distribution system, but with the corresponding size and duration of energy storage installed. The engineering analysis results illustrate the ability of energy storage to mitigate overloads of the capacity constrained lateral, eliminate both high and low voltage exceptions, reduce system losses, reduce system peak demand, and reduce voltage regulation tap changed operations.
In the spreadsheet which accompanies this report, hourly annual profiles are provided for key variables of the analysis, all provided as three‐phase real and reactive power, including: (1) substation demand, (2) capacity limited lateral line flow, (3) PV site power injection, (4) battery site power injection, and (5) tap change operations of voltage regulation equipment.
51

Table 19: Summary Results for Distribution System Performance with PV and Energy Storage
Source: DNV KEMA Energy & Sustainability
6.4.2 Financial Results Drawing on the results of the engineering analysis, a cash flow analysis was run for several scenarios, using combinations of the key sensitivities shown in Table 18. The cash flows and computed benefit cost ratios for all scenarios can be found in the spreadsheet which accompanies this report. Six illustrative scenarios are shown in Table 20.
Table 20: Select Financial Results
Scenario # Size Deferral Benefits Costs NPV BCR150 0.5 MW 4 hr $309/kW 2,584 ‐2,392 192 1.1177 1 MW 4 hr $309/kW 2,867 ‐4,753 ‐1,887 0.6138 0.5 MW 4 hr $70/kW 2,399 ‐1,880 519 1.3153 0.5 MW 4 hr $538/kW 2,761 ‐2,392 369 1.2147 0.5 MW 4 hr $70/kW 2,399 ‐2,392 7 1.0
Source: DNV KEMA Energy & Sustainability
Figure 24 illustrates a cost‐effective case, Scenario 150, on the left. The majority of the benefits are due to avoided re‐conductoring upgrades. Additional benefit comes from substation upgrade deferral and some loss reduction. Larger energy storage investment, illustrated with Scenario 177, on the right, shows a slight increase in value. However, the case is not cost‐effective, as the incremental cost of sizing energy storage beyond the re‐conductoring avoidance application is greater than the incremental benefits.
52

Figure 20: Cost, Benefits and NPV for Scenarios 150 and 177
192
(1,887)
‐$6,000
‐$4,000
‐$2,000
$0
$2,000
$4,000
$6,000
2020
$,000
s
Upgr Avoidance Deferral Losses
Storage Investment Storage O&M Net Present Value
0.5 MW 1 MW
ES ‐ 3,500 $/kW; Upgr ‐ $1.75 M; Tx ‐ 309 $/kW0.5 MW, 4 hr; BCR ~ 1.11 MW, 4 hr; BCR ~ 0.6
Source: DNV KEMA Energy & Sustainability
Though re‐conductoring is the primary benefit of this application, higher substation upgrade costs (and therefore higher deferral values) enable cost‐effective cases with higher energy storage costs. Figure 25 illustrates two cases that are cost‐effective, one with lower energy storage cost and deferral value (Scenario 138, on the left) and the other with higher energy storage cost and deferral value (Scenario 153, on the right).
Figure 21: Cost, Benefits and NPV for Scenarios 138 and 153
519 369
‐$6,000
‐$4,000
‐$2,000
$0
$2,000
$4,000
$6,000
2020
$,000
s
Upgr Avoidance Deferral Losses
Storage Investment Storage O&M Net Present Value
Low Cost & DeferralHigh Cost & Deferral
0.5 MW, 4 hr; Upgr ‐ $1.75 M; ES ‐ 2,700 $/kW; Tx ‐ 70 $/kW: BCR ~ 1.3ES ‐ 3,500 $/kW; Tx ‐ 538 $/kW; BCR ~ 1.2
Source: DNV KEMA Energy & Sustainability
53
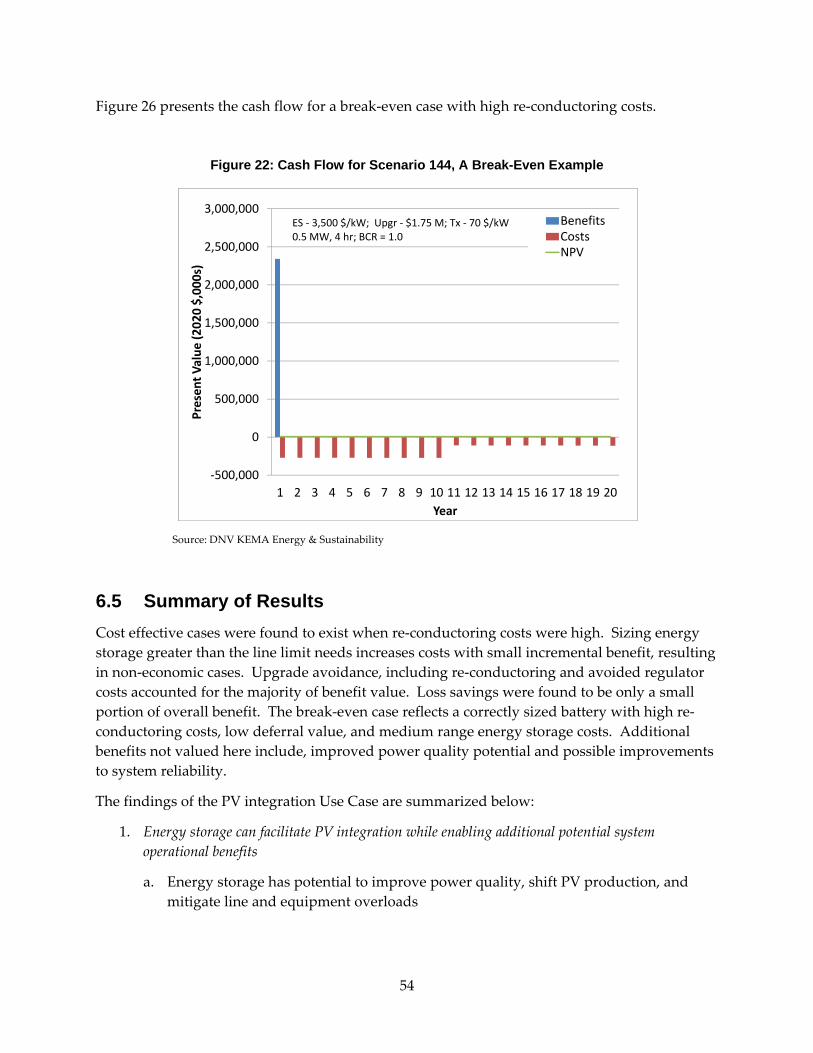
Figure 26 presents the cash flow for a break‐even case with high re‐conductoring costs.
Figure 22: Cash Flow for Scenario 144, A Break-Even Example
‐500,000
0
500,000
1,000,000
1,500,000
2,000,000
2,500,000
3,000,000
1 2 3 4 5 6 7 8 9 10 11 12 13 14 15 16 17 18 19 20
Presen
t Value
(202
0 $,00
0s)
Year
BenefitsCostsNPV
ES ‐ 3,500 $/kW; Upgr ‐ $1.75 M; Tx ‐ 70 $/kW0.5 MW, 4 hr; BCR = 1.0
Source: DNV KEMA Energy & Sustainability
6.5 Summary of Results Cost effective cases were found to exist when re‐conductoring costs were high. Sizing energy storage greater than the line limit needs increases costs with small incremental benefit, resulting in non‐economic cases. Upgrade avoidance, including re‐conductoring and avoided regulator costs accounted for the majority of benefit value. Loss savings were found to be only a small portion of overall benefit. The break‐even case reflects a correctly sized battery with high re‐conductoring costs, low deferral value, and medium range energy storage costs. Additional benefits not valued here include, improved power quality potential and possible improvements to system reliability.
The findings of the PV integration Use Case are summarized below:
1. Energy storage can facilitate PV integration while enabling additional potential system operational benefits
a. Energy storage has potential to improve power quality, shift PV production, and mitigate line and equipment overloads
54
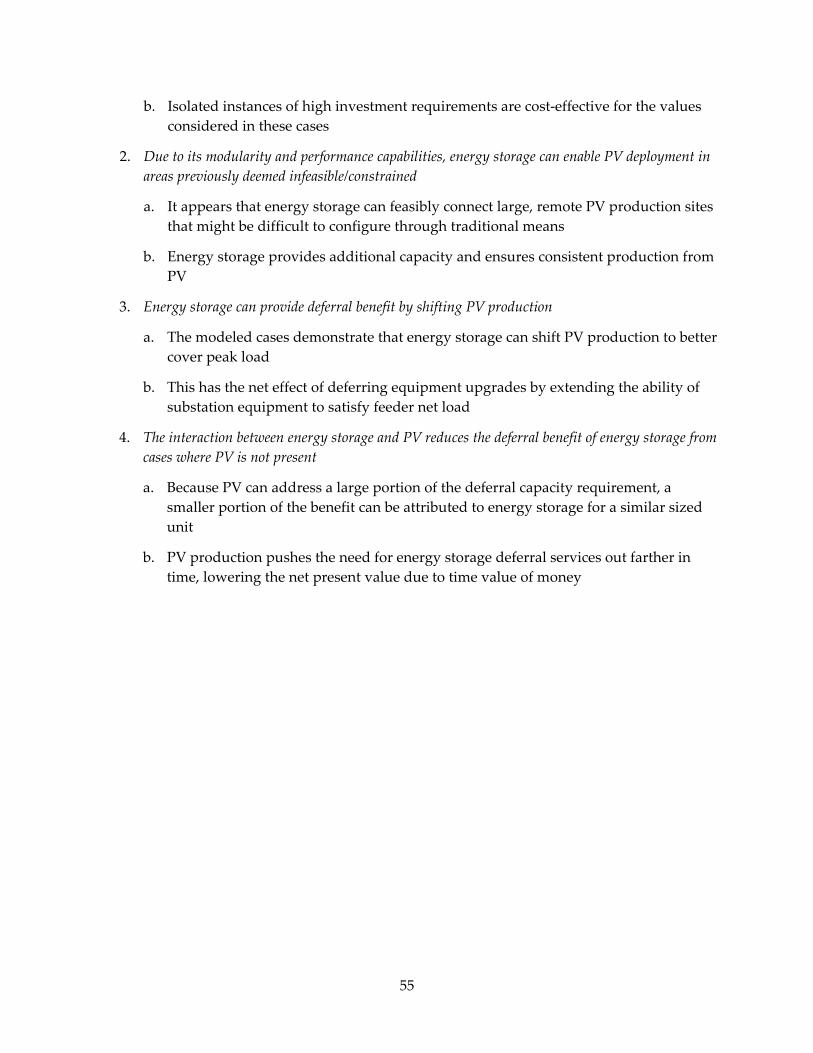
b. Isolated instances of high investment requirements are cost‐effective for the values considered in these cases
2. Due to its modularity and performance capabilities, energy storage can enable PV deployment in areas previously deemed infeasible/constrained
a. It appears that energy storage can feasibly connect large, remote PV production sites that might be difficult to configure through traditional means
b. Energy storage provides additional capacity and ensures consistent production from PV
3. Energy storage can provide deferral benefit by shifting PV production
a. The modeled cases demonstrate that energy storage can shift PV production to better cover peak load
b. This has the net effect of deferring equipment upgrades by extending the ability of substation equipment to satisfy feeder net load
4. The interaction between energy storage and PV reduces the deferral benefit of energy storage from cases where PV is not present
a. Because PV can address a large portion of the deferral capacity requirement, a smaller portion of the benefit can be attributed to energy storage for a similar sized unit
b. PV production pushes the need for energy storage deferral services out farther in time, lowering the net present value due to time value of money
55

CHAPTER 7: Demand Side Customer Bill Reduction The demand side customer Use Case 16evaluates the benefits to utility customers for energy storage devices located behind‐the‐meter. The energy storage device is owned and operated by the customer. Benefits are accrued by using energy storage for reduction in electric energy costs through time arbitrage of energy and reduction in peak demand charges by shaving the peak load of the facility.
7.1 Use Case Overview (1) The Use Case focuses on buildings or facilities under commercial time‐of‐use rates to
draw energy storage benefits from energy arbitrage. The primary input assumptions for the demand Use Case are: Time horizon of financial analysis – 15 years
(2) Customer facilities evaluated – Common area meter of multi‐family residence, school
(3) Location of customer facility – San Diego, CA
(4) Tariffs evaluated– San Diego Gas & Electric (SDGE) AL‐TOU (Time of Use), SDGE A
(5) Technologies – Solar PV, high power Lithium Ion (Li‐Ion) energy storage
7.2 Modeling the Use Case The modeling methodology and input assumptions are listed below:
7.2.1 Energy Storage Services Modeled The high level energy storage services modeled are:
(1) Energy arbitrage
(2) Peak shaving
(3) Solar PV time arbitrage
The benefits are derived by simulating hourly energy storage operation one day at a time over the time horizon of financial analysis. The inputs to the simulation consist of hourly forecasts of facility electric demand, energy prices, PV production (where applicable) and monthly demand charges. The simulations model the following energy storage operational regimes:
16 Demand‐Side Energy Storage, Customer Sited Use Case(s), http://www.cpuc.ca.gov/NR/rdonlyres/2676F607‐09DC‐411E‐8E2C‐67149D81C8E0/0/DSMUseCaseCustomerSide.pdf
The data worksheet for the analysis can be found at, http://websafe.kemainc.com/CPUC/Ch7_Customer_Use_Case_Inputs‐Results_final.xlsx
56

(1) Peak shaving to attain a pre‐specified demand
(2) Co‐minimization of energy and demand costs to maximize bill reduction
Facility asset upgrades occur on the first year, 2013. The primary simulation assumptions are shown in Table 21.
Table 21: Customer Use Case Energy Storage Simulation Assumptions
Parameter Unit ValueSimulation time horizon years 15Year of upgrade / installation Year # 1Number of simulated days per year # 365Time period of optimization hours 1Time horizon of optimization hours 24 Source: DNV KEMA Energy & Sustainability
Peak shaving operation is modeled to generate customer bill reduction by switching from a commercial tariff rate (SDGE AL‐TOU) with demand charges to a residential tariff rate (SDGE A) without demand charges.
7.2.2 Implementing the Use Case in Microgrid Optimization Tool The DNV KEMA MGO tool models the optimal operation of the battery based on the tariff adopted for the load. The optimization is deterministic and thus assumes that the energy storage operator has perfect apriori information of hourly facility demand, PV production, energy and demand costs. Load forecasts for each year after the base year are generated by applying a constant escalation factor of 0.3 percent. Similarly, energy and demand costs are escalated at a constant rate of 3 percent per year. For the scenario where energy storage is operated to shift the customer to a different tariff structure, a screening algorithm is used to determine whether the installed devices have sufficient capacity to limit demand to comply with tariff switching requirements for all hours of the year.
The hourly optimization is performed over 24‐hour periods. At the beginning of each day, the energy storage state of charge is reset to zero. The physical characteristics of solar PV, energy storage, and load are modeled as constraints of the optimization problem. The objective function to be minimized is the sum of the total energy cost over the 24‐hour period and a characterization of the demand cost. Based on the day‐ahead forecasts, each day of the month is ranked on the maximum projected demand of the day. The demand cost represented in the objective function is the monthly demand charge divided by the peak demand rank for the day.
The hourly operational results are aggregated to calculate savings and costs over each year.
7.3 Summary of Inputs The input details for the customer Use Case are as follows:
57

7.3.1 Financial and Rates Inputs The input tariffs are shown in Table 22 and the primary financial parameters are detailed in Table 23. The demand charges under the AL‐TOU tariff is split up by peak demand charge and the non‐coincident demand charge. Three sensitivities on energy storage costs are considered: 1) Low ‐ $3,000/KW, 2) Medium ‐ $3,500/KW, 3) High ‐ $4,500/KW. The numbers here denote 2013 dollars ($).
(1) The incentive inputs are categorized as direct rebates on capital expenditure: Energy storage rebates under the SGIP, solar PV rebates under the CSI program
(2) Direct tax rebate: For solar PV, the Federal Income Tax Credits (FITC) comprise of 30 percent tax credit on the remainder of capital expenditure after CSI rebates. If the customer installation has solar PV and energy storage, and the net yearly charging energy of the storage device is at least 75 percent of the net yearly PV production, the customer is eligible for at least 75 percent of FITC rebate on the remainder of capital expenditure on energy storage after SGIP rebates. If the net yearly charging energy of the energy storage device is less than 75 percent of the net yearly PV production, the customer is not eligible for any FITC rebate on energy storage.
(3) Tax deduction from accelerated depreciation: Solar PV and energy storage are assumed to be under 5‐year accelerated depreciation program for tax deductions.
Table 22: Input Tariff Rates in 2013 for Customer Use Case
Jan 158.99 0 9.26Feb 158.99 0 9.26Mar 158.99 0 9.26Apr 158.99 0 9.26May 198.95 0 9.26Jun 198.95 0 9.26Jul 198.95 0 9.26Aug 198.95 0 9.26Sep 198.95 0 9.26Oct 158.99 0 9.26Nov 158.99 0 9.26Dec 158.99 0 9.26
Flat rate charge escalation rate (%) 3.00%Flat rate demand charge escalation rate (%) 3.00%
SDGE A tariff ratesEnergy Charge
Demand Charge
Service fee ($/Mth)
Month
Weekday Weekend Weekday Weekend Weekday Weekend Peak Semipeak OffpeakJan 17‐20 0‐0 06‐17, 20‐22 0‐0 22‐06 00‐23 99.68 90.53 67.39 4.97 16.76 58.22Feb 17‐20 0‐0 06‐17, 20‐22 0‐0 22‐06 00‐23 99.68 90.53 67.39 4.97 16.76 58.22Mar 17‐20 0‐0 06‐17, 20‐22 0‐0 22‐06 00‐23 99.68 90.53 67.39 4.97 16.76 58.22Apr 17‐20 0‐0 06‐17, 20‐22 0‐0 22‐06 00‐23 99.68 90.53 67.39 4.97 16.76 58.22May 11‐18 0‐0 06‐11, 18‐20 0‐0 22‐06 00‐23 104.22 83.01 61.22 14 16.76 58.22Jun 11‐18 0‐0 06‐11, 18‐20 0‐0 22‐06 00‐23 104.22 83.01 61.22 14 16.76 58.22Jul 11‐18 0‐0 06‐11, 18‐20 0‐0 22‐06 00‐23 104.22 83.01 61.22 14 16.76 58.22Aug 11‐18 0‐0 06‐11, 18‐20 0‐0 22‐06 00‐23 104.22 83.01 61.22 14 16.76 58.22Sep 11‐18 0‐0 06‐11, 18‐20 0‐0 22‐06 00‐23 104.22 83.01 61.22 14 16.76 58.22Oct 17‐20 0‐0 06‐17, 20‐22 0‐0 22‐06 00‐23 99.68 90.53 67.39 4.97 16.76 58.22Nov 17‐20 0‐0 06‐17, 20‐22 0‐0 22‐06 00‐23 99.68 90.53 67.39 4.97 16.76 58.22Dec 17‐20 0‐0 06‐17, 20‐22 0‐0 22‐06 00‐23 99.68 90.53 67.39 4.97 16.76 58.22
Three tier with demand charge energy charge escalation rate (%) 3.00%Three tier with demand charge demand charge escalation rate 3.00%
Energy Charge ($/MWhr) Peak Demand Charge ($/MW)
NonCI Demand Charge ($/MW)
Service fee ($/Mth)
SDGE AL‐TOU tariff ratesPeak hours Mid peak hours Off peak hours
Month
Source: DNV KEMA Energy & Sustainability
58

Table 23: Cost, Financial and Incentive Inputs for Customer Use Case
Parameter Unit ValueStorage technology — High energy Li‐IonRated power KW 5, 50Discharge duration at rated power hours 2Round trip storage efficiency % 87.0%Round trip inverter efficiency % 94.0%
Low Med High3,000 3,500 4,500
Storage system O&M cost $/KW $20 Engineering life of storage years 15Engineering life of inverter years 15Battery initial energy level % 0.0%PV Installation cost (full cost) $/KW $5,440PV Installation cost (only panels) $/KW $3,260PV Calendar life years 20PV Derating factor %/year 1.5%PV O&M cost $/KW $25 Storage O&M escalation rate % 2.0%Solar PV O&M escalation rate % 2.0%
Installed cost of storage $/KW
Source: DNV KEMA Energy & Sustainability
7.3.2 Energy storage and PV Technology Assumptions Inputs The characteristics of solar PV and high power Li‐Ion energy storage unit are shown in Table 24. The engineering degradation of energy storage is not taken into account in this analysis since it is assumed that the cycling intensity for peak reduction and time arbitrage does not warrant replacing either the energy storage or inverter before the 15‐year duration. Accordingly, there is no benefit attributed from salvage value of the energy storage system.
Table 24: Characteristics of Solar PV and Energy Storage
Parameter Unit ValueRound trip storage efficiency % 87.0%Round trip inverter efficiency % 94.0%Engineering life of storage years 15Engineering life of inverter years 15PV Calendar life years 20PV Derating factor %/year 1.5%Capacity factor of PV in installationyear (without derating or losses)
% 23.92%
Source: DNV KEMA Energy & Sustainability
59

7.3.3 Customer Load Assumptions Inputs For a customer facility to be a good candidate for the installation of electric energy storage systems under the benefit criteria evaluated, the demand profile should satisfy the following criteria: 1) High ratio between peak demand and base load and, 2) High variability in the demand. Table 25 shows the main input parameters for the load, and Figure 27 shows the base year hourly profiles for the customer load of the two facilities.
Table 25: Customer Facility Assumptions
Parameter Unit ValuePeak Demand of Common Area Loads (2013) kW 21
Peak Demand of School Load (2013) kW 900Standard deviation of common area load % 17.96%
Standard deviation of school load % 19.10%Standard deviation of temperature % 11.67%
Load Increment rate %/year 0.30%
Source: DNV KEMA Energy & Sustainability
Figure 23: Demand Profiles for School and Common Area Meter
Source: DNV KEMA Energy & Sustainability
60

7.4 Scenario and Sensitivity Alternatives The two facilities have been selected for two different energy storage operational paradigms, as categorized below.
7.4.1 Common Area Load for Multi-unit Residential Building A customer can enroll in the residential SDGE A rate if the peak demand for the previous twelve consecutive months is less than 20 KW. The peak demand in 2013 for the common area load of multi‐family residence is assumed to be slightly higher and the applicability for combined solar PV and energy storage systems for tariff switching is evaluated.
In this case, the energy storage unit and solar PV are Direct Current‐coupled, sharing the same inverter. It is assumed that the energy storage system installation covers the interface and electrical. As such, only the cost of solar panels is attributed to the combined installation.
The installed capacities are configured such that the net output of the combined system is never greater than the facility load. Hence, installation of a net‐meter is not required. The hourly simulation results are screened to verify compliance to the net production and energy storage FITC requirement assumptions.
Two sensitivities are evaluated for this scenario: 1) The peak demand of the facility is 21 kW in 2013 and a 10 kW combined installation is sufficient to switch the load to the A‐tariff throughout the 15 year period and, 2) The peak demand of the facility is 22.5 kW in 2013 and a 10 KW combined installation cannot curtail the peak demand below 20 kW. In this case, the energy storage unit operates to minimize energy charges through demand reduction and time arbitrage. Scenarios 1 and 2 in Table 23 detail the primary inputs for the common area meter load scenario.
7.4.2 School For the scenarios evaluated on the school, the solar PV and energy storage devices have separate inverters and net‐metering is allowed. The customer is on the commercial AL‐TOU tariff and remains on the same tariff for the duration of analysis. Sensitivities on this scenario include a combined installation of solar PV and energy storage and an installation of only energy storage. Different sizes of installations are also evaluated. Scenarios 3 – 6 in Table 26 detail the sensitivities on the school scenario.
61
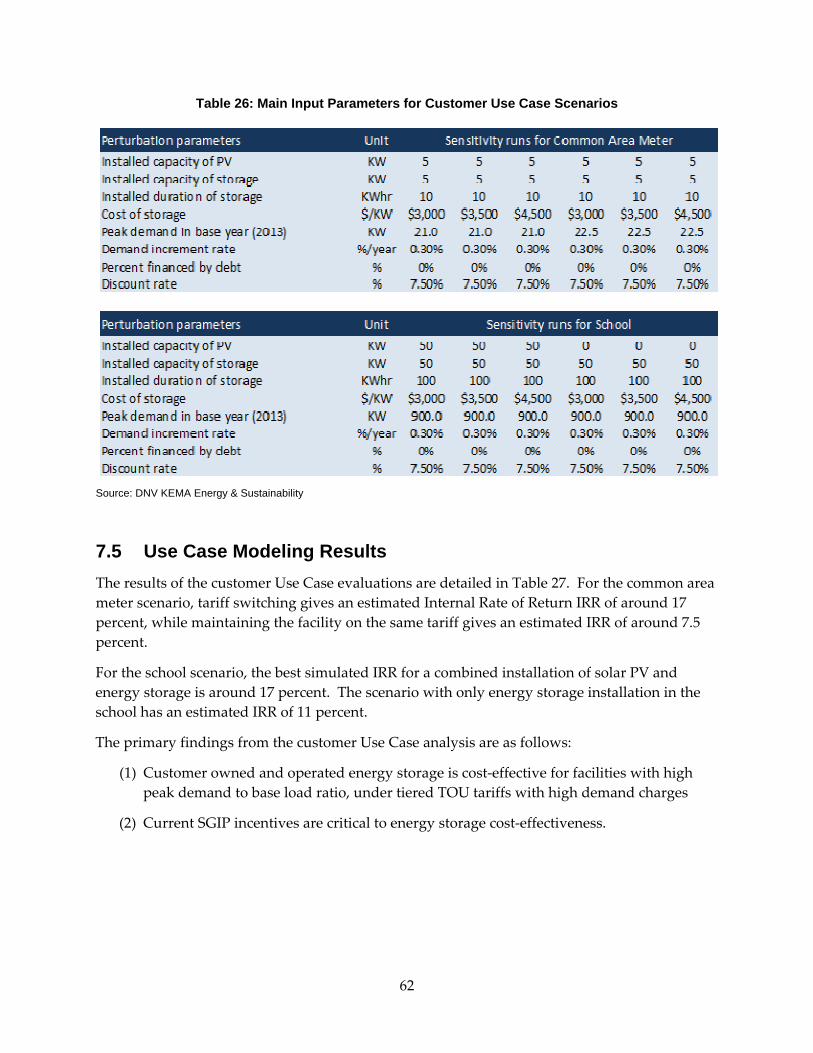
Table 26: Main Input Parameters for Customer Use Case Scenarios
Source: DNV KEMA Energy & Sustainability
7.5 Use Case Modeling Results The results of the customer Use Case evaluations are detailed in Table 27. For the common area meter scenario, tariff switching gives an estimated Internal Rate of Return IRR of around 17 percent, while maintaining the facility on the same tariff gives an estimated IRR of around 7.5 percent.
For the school scenario, the best simulated IRR for a combined installation of solar PV and energy storage is around 17 percent. The scenario with only energy storage installation in the school has an estimated IRR of 11 percent.
The primary findings from the customer Use Case analysis are as follows:
(1) Customer owned and operated energy storage is cost‐effective for facilities with high peak demand to base load ratio, under tiered TOU tariffs with high demand charges
(2) Current SGIP incentives are critical to energy storage cost‐effectiveness.
62

Table 27: Input Parameters and Financial Results for Different Customer Use Case Scenarios
Source: DNV KEMA Energy & Sustainability
63

CHAPTER 8: Generation Co-Located Energy Storage Two Use Cases for the general category of Generator Co‐located energy storage were identified in the CPUC ES OIR Phase 1 and Phase 2 Stakeholder process, Variable Energy Resources (VER) Co‐located Energy Storage and Conventional Generator Co‐located energy storage. These were not selected in CPUC ES OIR Phase 2 for detailed cost‐effectiveness modeling. But, the unique aspects and relevance to California warrant a brief discussion of these forms of thermal energy storage (TES) technology that can enhance forms of generation present in California’s resource mix which includes Concentrating Solar Power Generation and Conventional (Gas Fired) Generation both with co‐located TES.
8.1 Turbine Inlet Cooling with Thermal Energy Storage 8.1.1 TIC-TES Co-Located Generation & Storage Resource Description The Use Case for Conventional Generator Co‐located energy storage is Turbine Inlet Cooling (TIC) with Thermal Energy Storage. This system has an inlet air cooling system coupled with a traditional natural gas generator in order to improve the output characteristics of the power plant.
8.1.2 How Turbine Inlet Cooling Works Combustion turbines are sensitive to inlet air temperatures. As outside air temperature rises, the generation output of combustion turbines will decrease. The reason for this is simply because as air temperature increases, the density of the air decreases. Less dense air has less mass, which equates to less power output. For a typical combustion turbine, this output degradation starts to occur as air temperature increases past its standard ambient temperature design point, often around 60 degrees Fahrenheit, and steadily degrades by about 15‐25 percent, as the outside air temperature increases to temperatures around 100 degrees Fahrenheit.17
Cooling the inlet air counters the impact of hot weather on generation output. A chiller‐based cooling system typically provides 45 to 50 degree inlet air to a combustion turbine and allows the device to reclaim the lost output. Turbine Inlet Air cooling systems are not new and have a proven track record of performance.
8.1.3 Impact of Adding Energy Storage In order for this system to operate, chiller systems are used as one of the technologies. Systems can be designed to operate coincident to the hot periods of the day. However, this can create an additional load to the overall system to drive the chillers. When combined with thermal energy storage, or simply producing the chilled water or ice during off‐peak hours and storing the chilled water or ice, additional benefits are captured. These benefits are (1) providing an on‐
17 DN Tanks, http://www.turbineinletcooling.org/webinars/TICAWebinar5_021313TES.pdf
64

demand increase or decrease in generator output of up to 20 percent, (2) shifting the chiller load to off‐peak periods, and (3) reducing net capital cost and capacity of the chiller plant.
The addition of energy storage versus providing the chilling need real time expands the potential to enhance the operational flexibility of gas generation. This can potentially act as another resource for ramp‐rate response and provide Automatic Generation Control (AGC) tracking via modulating the cooling effect via a large stored or buffered amount of thermal energy that is decoupled from real‐time generation production. This is a new concept that DNV KEMA has conceptually discussed with several technical leaders in the TIC field. Though there are few current applications of the concept to allow for a more complete assessment of these additional benefits, these benefits could be explored in advance of field experience by implementing these performance characteristics into a production simulation model and testing the impacts through simulation.
Shifting the parasitic load of chilled water/ice will lower cost of production for the host generation plant. From a system perspective, this shift in the parasitic load to off‐peak hours improves overall system load factor. The potential aggregate off‐peak load in California for storing thermal cooling for TIC is substantial, and this form of off‐peak load could help several system level challenges including:
(1) Providing load for otherwise curtailed off‐peak wind energy production
(2) Mitigating severe evening system aggregate load ramp‐down events
On the basis of cost to install such systems, chiller TES not only provides TIC, they also provide energy storage, either on the supply‐side or on the demand‐side of the electric meter. Compared to the other energy storage options, such as Pumped Hydroelectric (PH), Compressed Air Energy Storage (CAES), Advanced Electro‐chemical Batteries, Mechanical Flywheels and Superconducting Magnetic Energy Storage (SMES), TES coupled with TIC may be a least costly option (Andrepont 2012).
A listing of additional links to work conducted by the Turbine Inlet Cooling Association (TICA) on the impact and technical benefits of recapturing generation output is provided below as reference for the area.
(1) Turbine Inlet Cooling : An Overview http://www.turbineinletcooling.org/webinars/TICAWebinar1_062012TICOverview.pdf
(2) Turbine Inlet Cooling: An Energy Solution That’s Better for the Environment, Ratepayers and Plant Owners
http://www.turbineinletcooling.org/WhitePaper/TICA%20WhitePaper_2009Nov24.pdf
(3) DN Tanks Presentation – Thermal Energy Storage: Big Batteries that Enhance Turbine Inlet Cooling Systems
http://www.turbineinletcooling.org/webinars/TICAWebinar5_021313TES.pdf
65

8.2 Concentrated Solar Power with Thermal Energy Storage For concentrating solar power with thermal energy storage (CSP‐TES), DNV KEMA is performing modeling of CSP‐TES for a separate Energy Commission Project.18 That project report has not been issued, but information describing CSP‐TES technology and interim modeling results are provided as an informational reference point on potential benefit value of adding TES to CSP.
Concentrating Solar Power technologies are gaining ground in California and around the world. Three major approaches within CSP systems are parabolic troughs, solar towers, and dish Stirling technology. Advancements in the technologies for collecting and transferring heat have made CSP more competitive with other renewable generation. CSP plants ranging in capacity from 50MW to 400MW are in operation or under construction primarily in the US (CA, NV, AZ), Spain, and South Africa.
Thermal energy storage systems have the potential to greatly enhance the grid dispatch and electricity market characteristics of concentrated solar power installations, especially in California, which is a world leader in solar energy capacity. Concentrating solar power (CSP), coupled with thermal energy storage (TES), if successfully configured and controlled, could potentially be deployed as a substitute for conventional generation or pumped hydro, with benefits in reliability, emissions, and peak generation. It is the thermal energy component that provides the flexibility to enable the system to potentially access such markets or applications. Many of the benefits of coupled CSP‐TES systems to the California grid and markets are understood only on a qualitative level. With end‐to‐end system modeling, this study aims to quantify a number of potential benefits to the California grid and market from adding substantial amounts of thermal energy storage to existing and future CSP installations.
The National Renewables Energy Laboratory (NREL) has issued a number of reports on the performance and benefit of Concentrating Solar Thermal generation including the use of thermal energy storage. The first, in 2006, analyzed the performance and economics and emissions impact of CSP on California’s energy systems but did not address thermal energy storage per se. 19 The second, in 2012, discussed the production cost simulation of CSP with Thermal Energy Storage20, but was not specific to California. The third, recently released, addressed the value of CSP with thermal energy storage with specific WECC and CA ISO LTPP case baselines.21
18 Optimizing Concentrated Solar Thermal Storage Systems, Energy Commission Contract # 500‐10‐064
19 Subcontract Report NREL/SR‐550‐39291 April 2006, “Economic, Energy, and Environmental Benefits of Solar Power in California
20 Technical Report NREL/TP‐6A20‐56731 Nov 2012, “Simulating the Value of Concentrating Solar Power with Thermal Energy Storage in a Production Cost Model
21 Technical Report NREL/TP‐6A20‐58186, March 2013 “An Analysis of Concentrating Solar Power with Thermal Energy Storage in a California 33 percent Renewable Scenario.”
66

8.2.1 CSP-TES Co-Located Generation & Energy Storage Resource Description For evaluating CSP‐TES plant performance in KERMIT, a model of CSP‐TES based on the technologies operational today, namely a CSP tower model coupled with two‐tank molten salt thermal energy storage, was developed. In this CSP model concept, the heat transfer fluid (HTF) is molten salt. Molten salt, at 290°C (554°F) is pumped from a cold storage tank through the receiver where it is heated to 565°C (1,049°F) and then into a hot tank for storage. When power is needed from the plant, the HTF is pumped from the hot tank to a steam generating system for a conventional Rankine‐cycle turbine/generator system and then on to the cold storage tank and eventually cycled to the receiver again for heating. Figure 28 provides a schematic of the CSP‐TES power plant modeled in KERMIT.
Figure 24: Schematic of CSP-TES modeled in KERMIT
Source: SolarReserve
With this plant model, the dynamics and response of the CSP‐TES plant to control signals such as schedule, real time dispatch, and area control error (ACE), can be evaluated and its output linked to system performance. In a later phase of this project, the performance of CSP‐TES, using detailed thermodynamic models of several CSP and TES technologies, will be tested against this prototype.
8.2.2 Impact of Adding Energy Storage to CSP A CSP plant, coupled with TES, has the ability to provide firm energy and ancillary services and follow a day‐ahead schedule, and hence behave like a flexible and dispatchable, yet renewable,
67
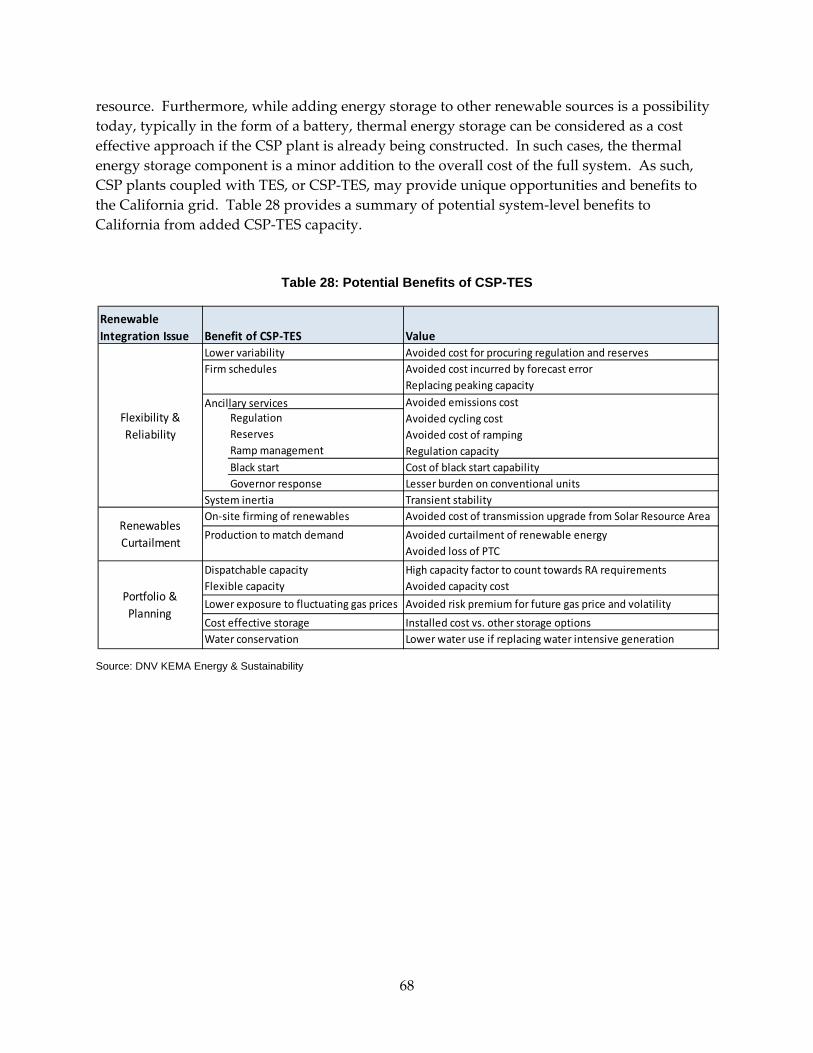
resource. Furthermore, while adding energy storage to other renewable sources is a possibility today, typically in the form of a battery, thermal energy storage can be considered as a cost effective approach if the CSP plant is already being constructed. In such cases, the thermal energy storage component is a minor addition to the overall cost of the full system. As such, CSP plants coupled with TES, or CSP‐TES, may provide unique opportunities and benefits to the California grid. Table 28 provides a summary of potential system‐level benefits to California from added CSP‐TES capacity.
Table 28: Potential Benefits of CSP-TES
Renewable Integration Issue Benefit of CSP‐TES Value
Lower variability Avoided cost for procuring regulation and reservesFirm schedules Avoided cost incurred by forecast error
Replacing peaking capacity
Ancillary servicesRegulationReservesRamp managementBlack start Cost of black start capabilityGovernor response Lesser burden on conventional units
System inertia Transient stabilityAvoided cost of transmission upgrade from Solar Resource Area
Avoided curtailment of renewable energyAvoided loss of PTC
High capacity factor to count towards RA requirementsAvoided capacity cost
Avoided risk premium for future gas price and volatility
Cost effective storage Installed cost vs. other storage optionsLower water use if replacing water intensive generation
Avoided emissions costAvoided cycling costAvoided cost of rampingRegulation capacity
Renewables Curtailment
On‐site firming of renewables
Production to match demand
Portfolio & Planning
Dispatchable capacityFlexible capacity
Lower exposure to fluctuating gas prices
Water conservation
Flexibility & Reliability
Source: DNV KEMA Energy & Sustainability
68

CHAPTER 9: Conclusions and Recommended Future Research 9.1 Cost-effectiveness Evaluation Conclusions This report described the model‐based methodology used to quantitatively evaluate energy storage cost‐effectiveness for five Use Cases: Frequency Regulation, Comparative Portfolio, Distribution Substation Capacity Deferral, Distribution Connected PV Integration, and Demand‐Side Customer Bill Reduction.
For this effort, two basic conclusions can be reached from the analysis and process:
(1) Tools are available that can allow stakeholders to accurately assess energy storage technologies for single and multiple applications at specific areas of the electricity grid
Hence, tool availability is not a limitation to the analysis of the benefits of energy storage
(2) For each of the Use Cases, energy storage was found to be cost‐effective in some of the cases where energy storage technologies are applied to specific applications
The basis of the methodology established was the use of industry accepted simulation tools customized or coupled with unique models to assess the impact of energy storage in each of the Use Cases that were evaluated.
For each of the five Use Cases evaluated, the results indicate energy storage is cost‐effective for a subset of assumptions for a range of benefits versus range of costs. The value basis for these findings are market revenue potential versus energy storage cost, avoided T&D investment versus energy storage cost, and customer bill savings versus energy storage cost. In each case evaluated the cost‐effectiveness cross over, or breakeven point, depended on the value side of the equation being at the upper end of the assumed value range, and the energy storage cost being at the lower end of the assumed cost range.
The analysis also leveraged a consensus driven process where stakeholders contributed to forming the inputs and variables that were used in the analysis.
9.1.1 Benefits to California Ratepayers Energy Storage is considered to be a technology that can potentially increase reliability of the California electricity grid and reduce emissions by allowing increasing amounts of variable renewable generation to be added into the California generation portfolio. Also, as the performance characteristics of energy storage continue to be leveraged, the devices may help reduce costs to the California ratepayers.
As the State of California assesses the potential benefits of energy storage, the modeling methodology and evaluation of Use Case examples developed in this process will serve as additional insight for the potential applications being proposed and as a beginning of the process to establish a methodology for evaluating energy storage systems deployed on the electricity grid.
69

For the Phase 2 of the California Assembly Bill AB 2514 proceedings itself, the effort showed that the potential benefits of energy storage technologies can be properly assessed and even customized to the State of California. Though evaluation of energy storage technologies can be complex, tools are available to ensure that “accurate evaluation” will not be a limitation to the Phase 2 process.
9.2 Limitations to Evaluation Energy Storage Cost-effectiveness Modeling limitations prevented quantified model‐based Cost‐effectiveness evaluation of several prioritized Use Case scenarios identified in the ES OIR Phase 2 prioritization of Use Cases, include,
(1) Multiple‐use Use Case scenarios where there were applications that bridged customer and utility side of the meter
(2) Generator co‐located Use case scenarios where the energy storage modifies attributes of a generator’s output and the energy storage is not directly delivering services to the grid.
9.3 Suggestions for Additional Research Current modeling tools do not cover scenarios that include both customer‐savings/energy use optimization and grid‐performance models. This lack of an integrated model limits the ability to quantitatively assess the feasibility, impacts, and ultimately the cost‐effectiveness of demand side energy storage applications when there is the option of utility access for control and dispatch, as one of the multiple services feasible from a demand‐side asset. The demand side modeling (MGO software) and distribution modeling (ES‐Grid software) used for this study can be extended to address energy storage multi‐use scenario where 1) services cross both sides of the meter and 2) the grid‐side benefit comes from aggregated demand‐side energy storage dispatched by a utility to deliver a system level benefit. The combining of the two modeled perspectives (customer side and utility side) is a recommended follow‐on research effort that would build on the modeling used for this study.
The lack of models for co‐located generation plus energy storage is being addressed for the Concentrated Solar Power with Thermal Energy Storage Use Case as discussed in Chapter 8. But, this modeling limitation remains for the Turbine Inlet Cooling with Thermal Energy Storage Use Case. Enhancing Production Simulation modeling (PLEXOS with KERMIT) as used for this project, and more generally for California resource planning, is a recommended follow‐on research effort that would build on the modeling used for this study.
70

GLOSSARY
Acronyms
AB Assembly Bill ACE Area Control Error AGC Automatic Generation Control BCR Benefit cost ratios CAISO California Independent System Operator CAPEX Capital Expenditure CCGT Combined Cycle Gas Turbine CESA California Energy Storage Alliance CPUC California Public Utilities Commission
CPUC ES OIR California Public Utilities Commission Energy Storage Order Instituting Rulemaking proceeding R.10‐12‐007
CSI California Solar Initiative CSP‐TES Concentrating Solar Power with Thermal Energy Storage CT Combustion Turbine DNV KEMA DNV KEMA Energy and Sustainability E3 Energy & Environmental Economics EPRI Electric Power Research Institute ES Energy storage ESBAM DNV KEMA’s Energy Storage Distribution Valuation tool ES‐Select DNV KEMA Energy Storage‐Select Tool FITC Federal Income Tax Credits HTF Heat transfer fluid IEEE Institute of Electrical and Electronics Engineers IOU Investor‐owned utilities IRR Internal Rate of Return ISO Independent System Operator KERMIT DNV KEMA Renewable Market Integration Tool kW Kilowatt Li‐Ion Lithium‐ion LSE Load Serving Entity LTPP Long Term Procurement Plan MGO Microgrid Optimization tool MW Megawatt MWh Megawatt‐hour NPV Net Present Value NREL National Renewable Energy Laboratory O&M Operations and maintenance OPEX Operating Expenditure OpenDSS Open Distribution System Simulator PG&E Pacific Gas & Electric
71

72
PIER Public Interest Energy Research PLEXOS PLEXOS® PPA Power Purchase Agreement PTO Participating Transmission Owner PV Photovoltaic RD&D Research, Development and Demonstration RegDown Regulation Down RegUp Regulation Up RPS Renewable Portfolio Standard RTO Regional Transmission Owners SCE Southern California Edison SDG&E San Diego Gas & Electric SGIP Self‐Generation Incentive Program SOC State of Charge T&D Transmission and Distribution TES Thermal Energy Storage TIC Turbine Inlet Cooling TICA Turbine Inlet Cooling Association TOU Time of Use VAR volt‐ampere reactive VER Variable Energy Resources WACC Weighted Average Cost of Capital WECC Western Energy Coordinating Council