Energy Storage and Electric Motor Systems Projects for ...
87
Energy Storage and Electric Motor Systems Projects for Hands-on Student Learning Andres Santiago Coello Behr Thesis submitted to the faculty of the Virginia Polytechnic Institute and State University in partial fulfillment of the requirements for the degree of Master of Science In Mechanical Engineering Douglas J. Nelson - Chair Scott T. Huxtable William T. Baumann June 26, 2018 Blacksburg, Virginia Keywords: onboarding, knowledge transfer, lithium ion, dynamometer.
Transcript of Energy Storage and Electric Motor Systems Projects for ...
Energy Storage and Electric Motor Systems Projects for Hands-on
Student Learning
Andres Santiago Coello Behr
Thesis submitted to the faculty of the Virginia Polytechnic Institute and State University
in partial fulfillment of the requirements for the degree of
Master of Science
In
Mechanical Engineering
Douglas J. Nelson - Chair
Scott T. Huxtable
William T. Baumann
June 26, 2018
Blacksburg, Virginia
Keywords: onboarding, knowledge transfer, lithium ion, dynamometer.

Energy Storage and Electric Motor Systems Projects for Hands-on
Student Learning
Andres Santiago Coello Behr
ABSTRACT
Advance Vehicle Technology Competitions (AVTCs) have been around for 30 years. Since
1994, the Hybrid Electric Vehicle Team (HEVT) at Virginia Tech has participated in
AVTCs to pursue hybrid technologies. HEVT participated in a four-year AVTC called
EcoCAR 3. At the beginning of the competition, HEVT introduced an ultra-rapid
onboarding process, the Independent Study (IS) program, to involve non-seniors with the
team. Although the IS program provides an incredible experience to non-seniors, it lacks
hands-on experience related to the actual work students do once they become full-fledged
team members. The challenge is to introduce two hands-on supplemental projects: the
energy storage system (ESS) and the motor system. Each project is considered low voltage
(LV) for safety and simplicity, however high voltage techniques are used for learning
purposes. The LV ESS is used to power up an LV motor system. To limit depletion of the
battery energy, another LV motor system is used as a generator to recharge the LV ESS.
The lead faculty advisor, Dr. Douglas Nelson, and the project manager, Andres Coello, are
working in congruence to introduce a smooth transition of the projects into HEVT’s IS
program. The hands-on projects are expected to last one semester. The goals are to guide
students in the design, construction and testing of both systems. The hands-on
supplemental projects are also meant to aid the Applied Automotive Engineering (AAE)
curriculum by filling important knowledge gaps current AAE modules are missing.
Energy Storage and Electric Motor Systems Projects for Hands-on
Student Learning
Andres Santiago Coello Behr
GENERAL AUDIENCE ABSTRACT
The Hybrid Electric Vehicle Team of Virginia Tech has participated in Advanced Vehicle
Technology Competitions since its inception in 1994. These competitions challenge
universities to reengineer and convert a vehicle into a hybrid vehicle. The goal is to train
the next generation of automotive students by providing real world engineering
experiences. The latest Advanced Vehicle Technology Competition is a four-year
competition called EcoCAR 3. Due to complexity of the project, the Hybrid Electric
Vehicle Team introduced an onboarding process to recruit and teach students the required
knowledge of hybrid vehicles. To further improve the program, two projects are created to
provide hands-on experience and visual learning about the electric layout of a hybrid
vehicle. The first project is a low voltage battery pack and the second project is a low
voltage motor dynamometer system. Both projects complement each other, meaning the
battery pack acts as a power supply to the motor system. Overall, these projects are chosen
to provide a good understanding to incoming students in the onboarding process about
batteries and motors. Finally, practices used by the Hybrid Electric Vehicle Team are
implemented in the project designs to improve the overall experience of students in the
onboarding process and to improve knowledge transfer.

iv
Acknowledgements
I would like to thank everyone that helped me and guide me through my graduate studies.
First, I would like to thank my faculty advisor, Dr. Douglas Nelson for selecting me in the role of
Project Manager in the Hybrid Electric Vehicle Team at Virginia Tech. Also for his invaluable
support across four years since I joined the team.
I would like to show gratitude to Dr. Huxtable and Dr. Baumann for serving in my masters
committee.
In addition, I would like to thank the Advance Vehicle Technology Competitions for sponsoring
the Hybrid Electric Vehicle Team of Virginia Tech during the EcoCAR 3 competition. Mainly, I
would like to show gratitude to all staff from the Argonne National Laboratory for their mentoring
in the project management and technical swimlanes.
Special thanks to InMotion US, for donating both motors and inverters to make this project
possible. I would like to thank Peter Hill for all the support and help provided regarding the inverter
software creation and motor dynamometer setup.
Most importantly, I would like to thank my family for all the amazing support and love during my
transition from Ecuador to USA to complete my bachelors and graduate studies. My family has
always been there for me and supported me when I needed the most.
v
Contents Contents...................................................................................................................................... v
List of Figures ..........................................................................................................................viii
List of Tables .............................................................................................................................. x
1 Chapter – Introduction ............................................................................................................. 1
1.1 Motivation for New Curriculum Development ................................................................... 1
1.2 Research Objectives of New Curriculum ........................................................................... 2
1.3 Thesis Organization ........................................................................................................... 3
2 Chapter – Project Management ................................................................................................ 3
2.1 HEVT Onboarding Process ................................................................................................ 4
2.1.1 Mechanical Engineer Majors Credit Requirement ....................................................... 6
2.1.2 Electrical Engineer and Computer Engineer Majors Credit Requirement ..................... 6
2.2 Current Onboarding Program Findings .............................................................................. 6
2.3 Project Overview and Timeline .......................................................................................... 8
2.4 Project Design and Selection ........................................................................................... 11
2.4.1 Concept Generation................................................................................................... 11
2.4.2 Concept Selection ..................................................................................................... 11
3 Chapter – Literature Review .................................................................................................. 13
3.1 Onboarding Management Process .................................................................................... 13
3.1.1 Towards Effective Knowledge Transfer .................................................................... 13
3.1.2 Effects of Knowledge Characteristics on Organizational Effort ................................. 14
3.1.3 Senior Project Design Success and Quality: A Systems Engineering Approach ......... 15
3.2 Lithium Ion Batteries ....................................................................................................... 16
3.2.1 Personal Protective Equipment .................................................................................. 16
3.2.2 Lockout and Tagout .................................................................................................. 17
3.2.3 Manual Service Disconnect ....................................................................................... 17
3.2.4 Battery Charge/Discharge and Internal Resistance Behavior...................................... 18
3.2.5 Thermal Management ............................................................................................... 19
3.2.6 Battery Model ........................................................................................................... 19
3.2.7 Battery Management System ..................................................................................... 20
3.2.8 Wire and Fuse Sizing ................................................................................................ 21
vi
3.3 Motor Systems ................................................................................................................. 21
3.3.1 AC Motors and Motor Drive ..................................................................................... 22
3.3.2 Motor Dynamometer ................................................................................................. 23
3.3.3 Motor Quadrants ....................................................................................................... 24
3.3.4 Relays and Contactor Logic ...................................................................................... 25
3.4 Summary ......................................................................................................................... 25
4 Chapter – Low Voltage Energy Storage System ..................................................................... 26
4.1 Energy Storage Simplified System Overview ................................................................... 26
4.2 Component Selection ....................................................................................................... 28
4.2.1 Lithium Ion Cells ...................................................................................................... 29
4.2.2 Manual Service Disconnect ....................................................................................... 30
4.2.3 Battery Management System ..................................................................................... 31
4.2.4 Charger ..................................................................................................................... 32
4.2.5 Charge Switch ........................................................................................................... 33
4.2.6 Voltage Display ........................................................................................................ 33
4.2.7 Wire and Fuse Sizing for LV ESS ............................................................................. 34
4.3 Overall and Detailed Design of Energy Storage System ................................................... 35
4.4 Data Acquisition System.................................................................................................. 38
4.4.1 Computer Software Required .................................................................................... 39
4.5 LV ESS Model ................................................................................................................ 40
4.6 LV ESS Experimental Setup ............................................................................................ 41
5 Chapter – Low Voltage Motor System Dynamometer ............................................................ 43
5.1 Simplified Motor System Dynamometer Overview .......................................................... 44
5.2 Component Selection ....................................................................................................... 45
5.2.1 Motor and Generator ................................................................................................. 45
5.2.2 Motor Inverters (Motor Drives) ................................................................................. 47
5.2.3 Contactor and Pre-Charge Logic ............................................................................... 48
5.2.4 Dynamometer Coupler .............................................................................................. 49
5.2.5 Motor Mounting ........................................................................................................ 50
5.3 Overall and Detailed Design of Motor Dynamometer System .......................................... 51
5.4 Data Acquisition System.................................................................................................. 52

vii
5.4.1 Computer Software Required .................................................................................... 54
5.5 Power Loss Model ........................................................................................................... 54
5.6 Motor Dynamometer Experimental Setup ........................................................................ 55
5.6.1 Safety precautions ..................................................................................................... 57
6 Chapter – Results and Analysis .............................................................................................. 59
6.1 Results and Discussion of LV ESS .................................................................................. 59
6.2 Results and Discussion of Motor System Dynamometer .................................................. 65
7 Chapter – Summary and Recommendations ........................................................................... 68
8 References ............................................................................................................................. 70
Appendix A: Wiring Schematics ............................................................................................... 75
Low Voltage Energy Storage System Schematics .................................................................. 75
Low Voltage Motor Dynamometer System Schematic .......................................................... 76
Appendix B: Pairwise Comparison Chart template .................................................................... 77

viii
List of Figures Figure 2-1: 2017-2018 Student progression path with independent study program strategy ......... 5
Figure 2-2: Academic year breakdown of current team members ................................................ 7
Figure 2-3: System diagram of the hands-on supplement projects................................................ 8
Figure 2-4. Project life cycle stages of the hands-on supplement projects .................................. 10
Figure 2-5: Concept development funnel ................................................................................... 11
Figure 3-1: (a) Battery pack open circuit voltage and (b) discharge/charge internal resistance ... 18
Figure 3-2: Basic battery model ................................................................................................ 20
Figure 3-3: (a) Forward three-phase motor connection and (b) reverse three-phase motor
connection. ............................................................................................................................... 22
Figure 3-4: Ideal motor torque speed curve and motor power speed curve ................................. 23
Figure 3-5: Four quadrants motor drive operation ..................................................................... 25
Figure 4-1: Simplified diagram of LV ESS ............................................................................... 27
Figure 4-2: 3D Preliminary CAD model of LV ESS .................................................................. 28
Figure 4-3: Cell interconnection diagram for LV ESS ............................................................... 30
Figure 4-4: 14s BMS diagram connection [33] .......................................................................... 32
Figure 4-5: Final design product of LV ESS .............................................................................. 37
Figure 4-6: Connector layout for myDAQ data acquisition ........................................................ 39
Figure 4-7: Battery model circuit with a load applied ................................................................ 40
Figure 4-8: Finalized load setup using high power resistors ....................................................... 41
Figure 4-9: Data acquisition diagram for load testing ................................................................ 42
Figure 4-10: Data acquisition diagram for charging ................................................................... 43
Figure 5-1: Simplified diagram of motor dynamometer system ................................................. 44
Figure 5-2: Layout of motor dynamometer system components................................................. 45
Figure 5-3: Torque/current-speed curve of driving motor (B30xx-B) at 48 VDC ....................... 46
Figure 5-4: Torque/current-speed curve of generator (C30xx-D) at 48 VDC ............................. 47
Figure 5-5: Dynamometer coupler integrated in motor systems ................................................. 50
Figure 5-6: Motor spline and dynamometer coupler .................................................................. 50
Figure 5-7: Stress analysis results for motor bracket at 5 Nm of torque. .................................... 51
Figure 5-8: Final design product of motor dynamometer ........................................................... 52
Figure 5-9: Power loss diagram model for motor dynamometer system ..................................... 55

ix
Figure 5-10: Data acquisition diagram for motor dynamometer system ..................................... 56
Figure 6-1: Battery terminal voltage and discharge current over time ........................................ 59
Figure 6-2: End-Cell and Mid-Cell terminal voltage discharge over time .................................. 60
Figure 6-3: Battery terminal voltage and battery energy over time ............................................ 60
Figure 6-4: Battery terminal voltage over discharged capacity................................................... 61
Figure 6-5: Battery terminal voltage and mid-cell temperature .................................................. 61
Figure 6-6: Calculated internal resistance over capacity discharged ........................................... 62
Figure 6-7: Battery terminal voltage and charge current over time............................................. 63
Figure 6-8: Battery terminal voltage and battery energy during charging ................................... 63
Figure 6-9: Battery terminal voltage over charged capacity ....................................................... 64
Figure 6-10: Battery terminal voltage and Mid-Cell temperature during charging ..................... 64
Figure 6-11: (a) DC bus current from the battery, (b) battery power, (c) battery energy ............. 65
Figure 6-12: (a) DC bus current into the motor, (b) motor power consumed, (c) motor energy from
driving motor ............................................................................................................................ 66
Figure 6-13: (a) DC bus current from generator, (b) generator power absorbed, (c) generator energy
from generator .......................................................................................................................... 66
Figure 6-14: (a) AC current command from driving motor, and (b) motor speed comparison
between driving motor and generator ........................................................................................ 68

x
List of Tables Table 2-1: Subteam responsibilities for hands-on supplement projects ........................................ 9
Table 2-2. Concept selection criteria ......................................................................................... 12
Table 4-1: Cell specifications for LV ESS ................................................................................. 29
Table 4-2: MSD selection comparison ...................................................................................... 30
Table 4-3: BMS specifications for LV ESS [33] ........................................................................ 31
Table 4-4: Charger specifications for LV ESS [46] ................................................................... 32
Table 4-5: Bulk charge rate comparison and time result ............................................................ 33
Table 4-6: Voltage display specifications for LV ESS ............................................................... 33
Table 4-7: Thermal wire modeling results at different conditions .............................................. 34
Table 4-8: Bill of Materials of LV ESS ..................................................................................... 35
Table 4-9. Installed software and purpose ................................................................................. 39
Table 5-1. Main motor and generator specifications .................................................................. 46
Table 5-2. Detailed motor drive specifications [42] ................................................................... 48
Table 5-3: Motor inverter power terminal connections .............................................................. 48
Table 5-4. CAN signals recorded from motor and generator ...................................................... 53
Table 5-5. Required software and purpose................................................................................. 54
Table 5-6. Implemented limits on motor and generator inverters ............................................... 58
Table 6-1: LV ESS internal resistance calculations ................................................................... 62
Table 6-2: Motor dynamometer system efficiency ..................................................................... 67

1
1 Chapter – Introduction The Hybrid Electric Vehicle Team (HEVT) at Virginia Tech is a senior design project that
competes in Advance Vehicle Technology Competitions (AVTCs). The main goal of AVTC
competitions is to train the next generation of automotive engineers. It has been 24 years since
HEVT’s inception and the team has redesigned and re-engineered several vehicles into hybrids
electric vehicles. Currently, the team completed the final year of the current four-year AVTC called
EcoCAR 3.
Given that the project is considered a senior design project, the majority of the team members
previously were seniors. To reduce the turnover rate, the team implemented an ultra-rapid
onboarding process to involve non-seniors with the team several semesters before their senior year.
This process was recently implemented during EcoCAR 3 Year 1. Although the onboarding
process is valuable to improve students’ knowledge about hybrids, it lacks hands-on supplemental
material related to the actual work students do on the vehicle. Therefore, the main goal of this
thesis is to create a curriculum of two hands-on supplemental projects to aid the onboarding
process for new students joining the team. The projects consist of the design and testing of a low
voltage (LV) Energy Storage System (ESS) and an LV motor system dynamometer. In addition,
the two hands-on supplemental projects are being developed to contribute to the Applied
Automotive Engineering (AAE) curriculum.
The AAE project is a collection of educational content for students without prior automotive
knowledge to help students overcome the steep learning curve in AVTCs. Automotive
competitions such as AVTC have a span of several years to complete the project. Students that
join the project midway need a way to get up to speed. For that reason, the AAE curriculum was
created to help students learn critical knowledge to help students contribute on their own teams.
The knowledge provided is not usually learned in academic classes.
1.1 Motivation for New Curriculum Development
Students that join HEVT are introduced to the onboarding process for one semester to learn the
skills to become an effective team member. During this semester phase, students are taught
necessary software skills and perform small weekly assignments relatable to their chosen subteam.
Major shortcomings of the current onboarding process include the lack of hands-on work, non-
cross functional team projects and lack of real-world applications that relate to the vehicle. For
2
that reason, new hands-on projects are explored to improve the overall experience of the
onboarding process.
During the creation of the curriculum, several engineering aspects are considered. Since the team
concentrates on the hybridization of conventional vehicles, creating a project of the electric layout
of hybrid vehicles on a scale model provides several beneficial traits to students. Students gain
knowledge regarding power distribution, energy resources, mechanical and electrical design, and
safety procedures. Therefore, the curriculum chosen is two hands-on supplemental projects that
can work and be tested independently or together. These projects are an LV ESS and an LV motor
dynamometer system. It is identified as low voltage because the electrical system is under 60 volts
[1]. This is a chosen design consideration to reduce complexity and ensure both systems are not
high voltage, which require special connectors and design considerations for safety.
Since HEVT deals with high voltage systems during the hybridization of a vehicle, high voltage
practices are used in the curriculum development to improve the students’ learning. This way,
students are able to obtain knowledge on electric layouts of hybrid vehicles by filling educational
gaps in the onboarding process before joining the team.
1.2 Research Objectives of New Curriculum
The objective of HEVT is to train the engineers of tomorrow. Therefore, this thesis provides a
curriculum development to improve the onboarding process of HEVT. The curriculum is separated
into two hands-on projects that provide knowledge of batteries and motor systems. Below are the
main research objectives:
1. Introduce hands-on repeatable projects for the onboarding process of HEVT that relate directly to the work done in hybrid vehicles.
2. Educate students about electric vehicle components such as batteries and motors. 3. Explain electrical system design, voltage/current, series/parallel cells, cell connections,
insulation, wire and fuse sizing. 4. Explain control interface, torque and speed command of motor systems. 5. Introduce thermal systems to dissipate losses. 6. Develop and document mechanical and structural design of LV ESS and motor system. 7. Analyze the thermal mass temperature rise data from both LV ESS and motor system. 8. Develop documentation to reuse systems for future iterations. 9. Develop assignments to go with hands-on projects. 10. Provide recommendations based on lessons learned.

3
1.3 Thesis Organization
The organization of the thesis begins by first introducing the reader to background information of
the onboarding process and how the project manager role relates to the curriculum development.
A literature review section is explained about benefits of improving the onboarding process of an
organization. Furthermore, literature contains information on battery systems, battery cells, battery
management systems (BMS), motor systems, contactor logic and how these components are
important for both safety and education on hybrid vehicles. Next, detailed information about the
LV ESS project is further explained with components and design considerations chosen.
Additionally, the LV motor dynamometer system design is described in detail. Operations of both
systems are explained within their own sections. Lastly, results and analysis of both projects are
explained with recommendations to improve the current setup.
2 Chapter – Project Management AVTCs have been around for 30 years to provide a training ground for future automotive
engineers. Each year, competitions grow in both complexity and scope, and project management
techniques are valuable to ensure success and meet project goals [2]. For this reason, AVTCs
created a new leadership position, the project manager, for all participating universities during the
previous AVTC EcoCAR 2.
Since the inception of the project management position, HEVT has implemented planning, risk
analysis, cost analysis, cost management, human resources and stakeholder communication
techniques. Although these processes are non-technical tasks, technical knowledge of the project
is required to understand the impact of delayed tasks and create recovery plans to conform to the
schedule. Therefore, HEVT prefers the project manager to be a graduate student with a Bachelor’s
of Science in Mechanical Engineering to have the knowledge required prior to learning project
management techniques.
During the creation of PM processes at the beginning of EcoCAR 3, HEVT implemented an ultra-
rapid onboarding process to reduce the turnover rate of students. As important as the onboarding
process is, it currently does not provide hands-on supplemental projects that relate directly to the
work students do once they join HEVT. The project manager leads the onboarding process. As a
result, project management plays a huge role in the implementation of the hands-on supplement
projects to ensure students are accommodated in separate subteams, the transition is smooth from

4
the previous process to the new onboarding process, and assignments are documented to reuse the
projects in the future
2.1 HEVT Onboarding Process
In addition to being an EcoCAR 3 team, HEVT is also considered a senior design team at Virginia
Tech. To be considered a senior design team, HEVT requires about 25 mechanical engineering
(ME) undergraduate students to join the team during their senior year. For this purpose, HEVT
created an onboarding program called the Independent Study (IS) program. Students are now
required to join the IS program to eventually join HEVT as a senior.
The independent study program is essentially a class where students learn about the competition
and the team. The main goal of the independent study program is to prepare students to be
functional team members before they join the team during their senior year. Students are
encouraged to join the program during their junior year to learn what is required of team members
and be prepared for their senior year. This gives a great advantage to HEVT since it provides a
smoother transition from graduating to new senior team members.
HEVT is preparing junior students to join the team once they are in their senior year to meet
staffing requirements. Every semester, approximately 15 IS students are recruited. This means that
by the next year, tentatively 30 students can join the team. It is important to recruit additional
students given that some students decide not to return to the team. However, there has been an
approximate 100% retention rate of IS students due to the quality of the project. Although HEVT
needs to recruit ME students, computer engineer (CpE) students are recruited during every fall
semester for the advance driver assistance systems (ADAS) subteam. In addition, electrical
engineer (ECE) students are actively recruited to provide help to the ECE subteam. To visualize
the recruitment process, a flowchart is shown in Figure 2-1.

5
Figure 2-1: 2017-2018 Student progression path with independent study program strategy
(adapted from Dvorkin, et al., “Strategies to Improve Performance at a High-Turnover Engineering Organization”, ProjMAN International Conference of Project Management, 2015),
used under Fair Use, 2018 [2]
Figure 2-1 shows the ME and ECE student progression path in HEVT. ADAS students are not
included because the hands-on supplement does not directly affect members on the ADAS
subteam. By the time Year 4 started, all seniors went through the IS program before joining HEVT.
In addition, 13 sophomore IS students joined as junior team members. In the spring of Year 4,
some students were not asked to come back to the team for two reasons: to reduce the load of
graduate students and to improve the output quality of work in the team. Starting next year, the
team will be staffed with 29 seniors, 8 junior team members, and 11 Junior IS students. As seen in
Figure 2-1, HEVT is expected to meet staffing needs next year.
Understanding the requirements for students to join the IS program is important. Depending on
the major, HEVT is able to provide credits that could count towards graduation requirements.
Since the hands-on projects only affect ME and ECE students, only those majors are discussed in
the next subsection.
6
2.1.1 Mechanical Engineer Majors Credit Requirement
Given HEVT is a senior design project, the ME department provides credits to team members
because of ME 4015/4016. Prior to senior year, students are able to receive a maximum of six
credits for IS towards graduation requirement. For this reason, it is crucial to begin recruiting ME
students at the end of their sophomore year. Once students reach senior year, members are able to
count another six credits for the senior design class. Therefore, HEVT is able to offer a total
amount of 12 credits that count towards graduation requirement for ME majors.
2.1.2 Electrical Engineer and Computer Engineer Majors Credit Requirement
Working with the ECE department has been a bit more difficult but HEVT has been able to secure
credits for EE or CpE students interested in the project. Prior to senior year, students are able to
receive a maximum of three credits for IS towards graduation requirement. For this reason, it is
ideal to recruit EE and CpE students during the fall semester. Once students reach senior year,
members are able to count another six credits for the senior design class. Therefore, HEVT is able
to offer a total amount of nine credits that count towards graduation requirements for EE and CpE
majors.
2.2 Current Onboarding Program Findings
The IS program strategy is advantageous for many reasons. This program ensures senior team
members have at least one semester of experience prior to joining the senior design project and the
program reduces the turnover rate. Prior the IS program, the team often had IS students without a
structured program. This is the first time HEVT has implemented a structured onboarding process
since 1994.
Previously, most team members except graduate students would only be involved in HEVT for
two semesters. This reduced the team’s productivity by spending the first few months to onboard
new students. Therefore, the turnover rate is a key metric that needed change. Up to this point, the
IS program has reduced the turnover rate to 38%. This is a complete success given the previous
turnover rate used to be approximately 85%.
By the end of Year 4, 56% of students were non-seniors. This is an incredible turn of events given
that the team used to be senior-dominant. By involving students in an earlier academic year,

7
students are able to leverage their skills and increase the knowledge transfer between students.
Figure 2-2 provides the academic year of team members in EcoCAR 3 Year 4.
Figure 2-2: 2017-2018 academic year breakdown of current team members
Finally, the retention rate of the IS program is approximately 100%. There are students that do not
come back the next semester due to Co-Op, internships or class conflicts. When class conflicts
fully prevent students from participating in the project, the leadership team does not invite them
back.
Even though the IS program has been a success, there is room for improvement. Graduate students
are responsible of teaching incoming students the material of the IS program. Therefore, it is
important to incorporate repeatable projects on each subteam to decrease the load for graduate
students. The controls and mechanical subteams have developed a decent repeatable projects but
electrical and ADAS subteam require improvements. To improve the onboarding process,
incorporating a new and repeatable curriculum is needed, where the main three cross-functional
subteams (mechanical, controls and electrical) work together. The two hands-on supplemental
projects will encourage students to learn educational gaps from the AAE curriculum for AVTCs
and will provide a more hands-on aspect which is lacking in the current onboarding process. The
hands-on projects overview is discussed next and Chapters 4-5 covers them in detail.
0
5
10
15
20
25
30
35
40
Graduate Senior Junior Sophomore
Num
ber o
f Stu
dent
s

8
2.3 Project Overview and Timeline
As previously explained, the hands-on supplement projects consist of the design and testing of an
LV ESS and an LV motor system. Students are required to use the LV ESS to power up an LV
motor. To limit depletion of the battery energy, another LV motor system is used as a generator to
recharge the LV ESS. The second motor also acts as a load for the first motor, forming a simple
motor dynamometer. The generator is be connected to the LV ESS to keep the battery cells from
quickly depleting. The goal for the motor system project is to create a motor dynamometer. In
addition, the hands-on supplemental projects goal is to improve the IS program by creating
repeatable projects that relate directly to the work students do once they join HEVT as a team
member. An overview of the overall system is shown in Figure 2-3.
Figure 2-3: System diagram of the hands-on supplement projects.
The main components of the overall systems are the charger, the LV ESS and both LV motor
systems. Both LV motor systems are connected to a control interface (supervisory controller) via
Controller Area Network (CAN). The control interface is used to oversee all communication
within the motor components. Likewise, the control interface monitors current or voltage during
operation, commands torque, commands current, and monitors motor temperatures. A power
analyzer is used to monitor battery voltage, current and power out of the battery terminals. All

9
battery charging is required to be attended to ensure safe shut-down of all systems. To protect
battery charging, a battery management system (BMS) is in place to protect the battery cells and
ensure charge balancing.
The hands-on supplemental projects challenge incoming students to design, build and test the
electric powertrain of a hybrid in a small scale. To complete the projects, incoming students are
separated into the three main subteams: mechanical, electrical and controls. Note that subteam
does not mean degree major. An ME student can be on the electrical subteam. Each subteam has
responsibilities to complete the project which can be seen in Table 2-1.
Table 2-1: Subteam responsibilities for hands-on supplement projects Subteam Responsibilities
Mechanical
Mounting motor and inverter Housing for battery cells and support of LV ESS
Develop component layout of LV ESS Dynamometer setup (Torque generator)
Generator needs to be in place to recharge the LV ESS Needs to sustain torque from LV motor
Thermal considerations for all components
Electrical
Size and fuse design of LV ESS system Present schematic of LV ESS
Indicate all components required for safety Manual Service Disconnect (MSD)
Work with mechanical to route electrical connections in CAD Physical wiring/system diagrams (compared to electrical schematics)
Controls
Model battery & motor Present schematic of LV motor system
Develop control requirements Bench test LV motor system
Interface between LV motor and LV ESS system Contactor control logic, battery management system Use of supervisory controller (laptop or component)
Document charging requirements and procedures
Before starting the hands-on supplement projects, new IS students are required to complete general
training to become familiarized with the software and hybrid vehicles in general. Once the general
training is complete, the projects start and follow the project management life cycle. The project
management life cycle has four phases: initiation, planning, execution and closure [3]. Given that
the projects are somewhat complex; the life cycle of the hands-on supplemental projects is one full
semester.

10
Figure 2-4. Project life cycle stages of the hands-on supplement projects
(From Larson, et al., Project Management: The Managerial Process 5th Edition, 2010: 7-8), used under Fair Use, 2018 [3]
The defining phase consists of the selection of students to complete the project as well as the
training required for students to be ready to move to the next phase. The planning phase consist of
the concept design and concept selection of the project. Once students select a design and receive
feedback from the lead faculty advisor, students start by designing the projects, procuring materials
and document to prepare for the execution phase. Design reviews are also included in the planning
phase to challenge and prepare students. The goal is for students to have a plan before building the
project and be as prepared as possible for potential issues that could delay the project. The defining
and planning phases are reduced on scope since the major components are already procured and
guidance is given to the students to build the LV ESS system and LV motor dynamometer system.
To build the projects, IS students follow the created designs. The components need to be bench
tested. These tasks correspond to the execution phase. Finally, the closing phase of the product life
cycle corresponds to testing, documentation, and lessons learned for the next students to start the
project. In addition, a disassembly procedure should be in place to safely disconnect the LV ESS
system and LV motor to be reused in the next iteration of the hands-on supplement projects.
11
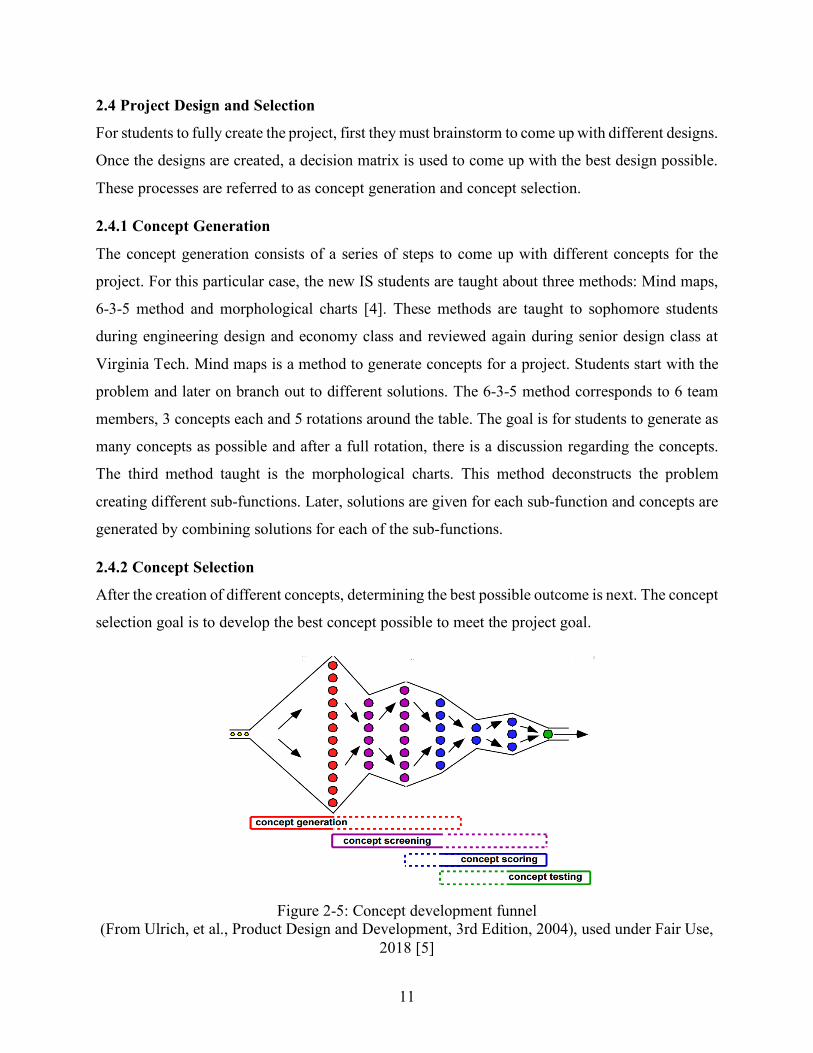
2.4 Project Design and Selection
For students to fully create the project, first they must brainstorm to come up with different designs.
Once the designs are created, a decision matrix is used to come up with the best design possible.
These processes are referred to as concept generation and concept selection.
2.4.1 Concept Generation
The concept generation consists of a series of steps to come up with different concepts for the
project. For this particular case, the new IS students are taught about three methods: Mind maps,
6-3-5 method and morphological charts [4]. These methods are taught to sophomore students
during engineering design and economy class and reviewed again during senior design class at
Virginia Tech. Mind maps is a method to generate concepts for a project. Students start with the
problem and later on branch out to different solutions. The 6-3-5 method corresponds to 6 team
members, 3 concepts each and 5 rotations around the table. The goal is for students to generate as
many concepts as possible and after a full rotation, there is a discussion regarding the concepts.
The third method taught is the morphological charts. This method deconstructs the problem
creating different sub-functions. Later, solutions are given for each sub-function and concepts are
generated by combining solutions for each of the sub-functions.
2.4.2 Concept Selection
After the creation of different concepts, determining the best possible outcome is next. The concept
selection goal is to develop the best concept possible to meet the project goal.
Figure 2-5: Concept development funnel
(From Ulrich, et al., Product Design and Development, 3rd Edition, 2004), used under Fair Use, 2018 [5]
12
Figure 2-5 shows a graphical representation to develop the best concept. There are two main stages
in concept selection: concept screening and concept scoring. Concept screening is the process to
reduce different concepts and provide further refinement and analysis. Concept scoring consists of
the use of objective methods to reach an agreement of the final concept selection.
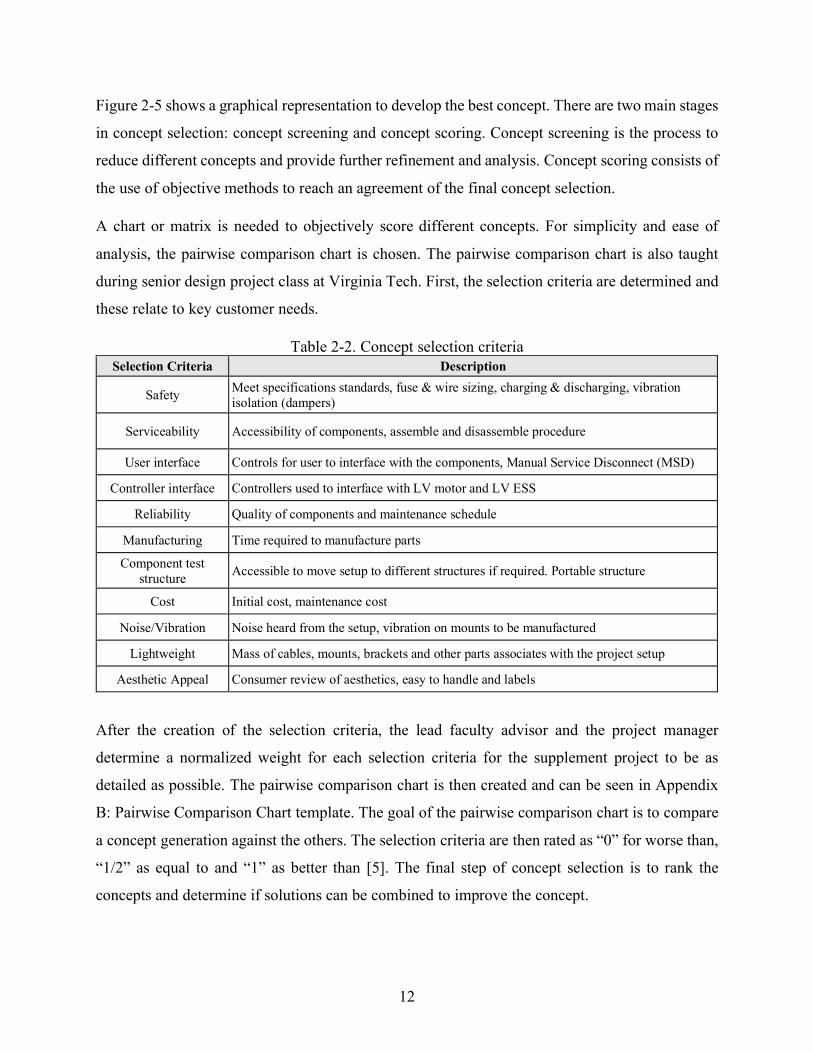
A chart or matrix is needed to objectively score different concepts. For simplicity and ease of
analysis, the pairwise comparison chart is chosen. The pairwise comparison chart is also taught
during senior design project class at Virginia Tech. First, the selection criteria are determined and
these relate to key customer needs.
Table 2-2. Concept selection criteria Selection Criteria Description
Safety Meet specifications standards, fuse & wire sizing, charging & discharging, vibration isolation (dampers)
Serviceability Accessibility of components, assemble and disassemble procedure
User interface Controls for user to interface with the components, Manual Service Disconnect (MSD)
Controller interface Controllers used to interface with LV motor and LV ESS
Reliability Quality of components and maintenance schedule
Manufacturing Time required to manufacture parts
Component test structure Accessible to move setup to different structures if required. Portable structure
Cost Initial cost, maintenance cost
Noise/Vibration Noise heard from the setup, vibration on mounts to be manufactured
Lightweight Mass of cables, mounts, brackets and other parts associates with the project setup
Aesthetic Appeal Consumer review of aesthetics, easy to handle and labels
After the creation of the selection criteria, the lead faculty advisor and the project manager
determine a normalized weight for each selection criteria for the supplement project to be as
detailed as possible. The pairwise comparison chart is then created and can be seen in Appendix
B: Pairwise Comparison Chart template. The goal of the pairwise comparison chart is to compare
a concept generation against the others. The selection criteria are then rated as “0” for worse than,
“1/2” as equal to and “1” as better than [5]. The final step of concept selection is to rank the
concepts and determine if solutions can be combined to improve the concept.

13
3 Chapter – Literature Review To apply the hands-on supplemental projects into the onboarding process, research is done
regarding the background knowledge needed to build an LV ESS and an LV motor system
dynamometer. In addition, industry strategies are researched to ensure a smooth transition of
HEVT knowledge transfer to incoming students. Likewise, aspects of project performance are
researched as well. This chapter discuss the findings of different scholarly articles about
knowledge transfer, battery cells and motor systems.
3.1 Onboarding Management Process
HEVT’s onboarding process goal is to provide students the resources to learn relatable information
about hybrid vehicles and engineering before fully joining the team. Currently, the onboarding
process provides training to incoming students but it is lacking hands-on materials to better prepare
students. Several tactics are furthered explored to find ways to improve the current onboarding
process.
3.1.1 Towards Effective Knowledge Transfer
Power et al., in Towards effective knowledge transfer in high-tech project environments:
Preliminary development of key determinants, argue to better promote knowledge transfer to
improve project success [6]. Project success is important to ensure an organization secures future
funding and provides the best education possible to employers. To provide the best experience
possible, organizational culture plays an important role.
Power et al., suggests a conceptual model with five factors that are important to improve
organizational culture and knowledge transfer: trust, rewards, communication, leadership and
motivation [6]. Management of these factors are imperative given these could also be an obstacle
in sharing knowledge. Trust provides a path for employees to work together and ease the transfer
of knowledge [7]. Consequently, competence enables co-workers to build up trust [8]. Rewards
are an incentive to motivate employees to perform specific tasks. Soft rewards are when incentives
relate to team recognition. Studies found soft rewards are the most important to transfer knowledge
[9]. Communication is an enabler for knowledge transfer. Face to face communication has been
found to be more effective than using social networking technologies [10]. Leadership on a project
is a main driver for direct knowledge transfer. Specifically, participatory leadership style reduces
employee fear and enables communication across different hierarchy levels in an organization

14
[11]. Motivation is important to ensure project success. For projects where motivation plays a large
role, intrinsic motivation provides a positive influence in knowledge transfer because project tasks
are found to be interesting [11] [12].
Understanding these five factors are important in incorporating repeatable projects and improving
the onboarding process. As previously mentioned, competence is an enabler for trust among co-
workers. The LV ESS and LV motor system projects will enable students to gain trust among
coworkers. Graduate students, responsible in teaching the projects, ensure face to face
communication and participate in the project to further improve communication. Students should
be required to document and disassemble the projects as part of their assignments to receive a
sense of soft rewards. Finally, both hands-on supplements act as visual learning for students to
improve their motivation and to ensure knowledge is transferred to improve the success of the
project.
3.1.2 Effects of Knowledge Characteristics on Organizational Effort
Kang et al, in Revisiting knowledge transfer: Effects of knowledge characteristics on
organizational effort for knowledge transfer, identifies three characteristics that affect the
effectiveness of knowledge transfer: tacitness, difficulty, and importance of knowledge. As time
progresses, organizations have to create new knowledge to maintain their success. This knowledge
creation is a process of combining and organizing existing information to pass down to the
organization for future success [13].
Tacit knowledge is referred to the knowledge that is difficult to transfer using notes or verbal
communication. In this article, it has been found that tacit knowledge has a negative effect on
knowledge transfer [13] [14]. Although the option of reducing the tacit knowledge could increase
the performance of knowledge transfer, tacit knowledge can be learned and transferred through
practical projects and visual learning. Frequent meetings between knowledge sources and students
are required in transferring tacit knowledge [15]. Lamb et al., suggests tacit knowledge can be
learned through practical projects with relevant context of the organization [16]. In addition,
Carlile et al. found that a common technical language is required to improve knowledge transfer.
With the development of technical language, interactions between knowledge sources and students
is most likely to increase [13].
15
The difficulty of knowledge is a factor that affects the transfer of knowledge. When knowledge is
explicit, it could still be complex and difficult to understand for students. By increasing the
knowledge difficulty, the knowledge transfer effectiveness is decreased and requires knowledge
sources to interact with students more frequently [17]. Organizations should transfer important
knowledge strategically for efficient knowledge transfer under limited resources [13]. This way,
organizations are able to reinforce the specific knowledge and improve the knowledge transfer
effort for the benefit of the organization.
These three knowledge transfer characteristics heavily apply to HEVT’s onboarding process to
improve the students’ experience in the program. Given HEVT is a senior design project that
competes in a four-year competition, it can be determined that tacit knowledge is transferred to
incoming students. Therefore, implementing hands-on approach projects relatable to HEVT and
hybrid vehicles will ease the learning process. Due to limited resources, strategically transferring
knowledge is necessary for HEVT’s graduate students manage the onboarding process effectively.
3.1.3 Senior Project Design Success and Quality: A Systems Engineering Approach
Flores et al., in Senior Project Design Success and Quality: A Systems Engineering Approach,
discusses how soft skills encourage project design success. Soft skills are identified as
communication, teamwork, and leadership. Lack of these skills, lack of high level view of the
project, and lack of work on a team environment are culprits that hinder project success [18].
Project success is based upon hard work, knowledge and determination of each team member.
Communication skills are emphasized to develop end-to-end systems thinking. It is encouraged
for an organization to require students to give weekly presentations on the status of the project.
Students are able to practice and improve their communication and leadership skills [18].
Teamwork is an important factor in distributing responsibilities amongst a team. According to the
United Nations Educational Scientific and Cultural Organization (UNESCO), it suggests that
students benefit more from a project based instruction because students face challenges earlier on
in their careers [19]. The International Council of Systems Engineering (INCOSE) encourage
organizations to educate professionals to adapt to changes and challenges associated with the
increasing complexity of systems [20]. Leadership skills allow students to work on a specific
subsystem and encourage students to become subject matter experts on a particular component.
This method ensures peer mentoring occurs and knowledge is strengthened [18].

16
Prior literature provides strategies to ensure knowledge transfer and project success. By
implementing project based instruction on the onboarding process of HEVT, students are able to
improve their experience in solving and facing challenges. Likewise, communications and
leadership skills are developed across the program where teamwork is required to complete project
goals. The onboarding process can be determined as a scaled senior design project where students
learn to be better prepared when they join the team for senior design project.
3.2 Lithium Ion Batteries
Lithium ion batteries are used as an energy storage system (ESS) for EVs and HEVs. Due to their
high specific energy and energy density, lithium ion batteries have led the EV market compared
to other cell chemistries [21]. Lithium ion batteries are composed of battery cells connected in
series, parallel or in series/parallel to form an ESS. Series connection increases the battery voltage
and parallel connection increases the capacity or the amp-hour (Ah) of the battery. Different
configurations are used depending of the needs of the application.
There are various types of lithium ion batteries, but normally these come in cylindrical, coin and
prismatic shapes. Prismatic cells are normally used in the automotive industry but cylindrical cells
are starting to gain popularity as a choice in the automotive industry [22]. Although there are
several lithium ion chemistries and types, the general purpose of this thesis is not to analyze each
of them, but to learn about the lithium ion battery behavior and safety precautions when building
an ESS. As incoming students joining the team need to tackle the LV ESS hands-on supplement,
safety is a great concern when dealing with batteries.
3.2.1 Personal Protective Equipment
The handling of battery cells must be treated with strict precaution to reduce the chance of an
electric shock. According to Pretruzella et al. in his book of Electric Motors and Control Systems,
“…the severity of an electric shock is the amount of electric current that passes through the body”
[23]. The use of personal protective equipment during the handling and testing of equipment is
paramount for safety. Specifically for equipment above 50 V, it is considered dangerous [24]. If
equipment is alive, it is recommended to just use one hand to reduce passing current through the
body. High voltage systems have the ability to force current through the skin, which is why special
equipment is necessary when dealing with these systems [23].
17
Before handling battery cells, all personal protective equipment must be rated for the battery
voltage rating. Several examples of electrical equipment include but are not limited to: rubber
protective equipment (gloves), blankets, safety glasses, and tools (pliers, hammer, and
screwdrivers). Rubber gloves prevent hands from coming into contact with energized systems.
Blankets are used as an insulation between the energy system and the surface. Normally, blankets
are used during the building and repair of battery systems. Safety glasses are required for every
type of mechanical or electrical work and need to be compliant by the American National
Standards Institute (ANSI). Tools such as pliers, hammers, and screwdrivers are needed for the
installation of compressive plates or other overhead materials to build an ESS [23] [24].
3.2.2 Lockout and Tagout
Electrical lockout corresponds to the procedure of disabling the energy source of electrical power.
A lock is used to disable the power from being turned on. Tagout is the procedure of placing a tag
on the source to indicate the component mustn’t be activated until tag is removed and service is
complete. Generally, lockout and tagout are used as safety precautions during servicing electric
equipment. Ensuring the system is not energized with a voltmeter is recommended to confirm that
the system is not “live” [23].
During the voltmeter measurements in an un-energized battery system, voltage readings may
appear between positive and negative leads. This phenomenon is called “ghost voltage”.
According to a support fluke document, Ghost voltages – phantom readings can lead to the wrong
diagnosis, digital multimeter (DMM) may give false readings due to high input impedance coming
from the DMM [25]. When an open circuit provides voltage readings using a DMM, the circuit is
completed by the DMM and “…the capacitance between the hot conductor and the floating
conductor forms a voltage divider in conjunction with the DMM input impedance” [25]. Low input
impedance DMMs can dissipate the ghost voltage and determines if the circuit is not live.
3.2.3 Manual Service Disconnect
ESS above 60 V peak is considered high voltage (HV) in the automotive industry. As an HV
system, complexity increases and several components are added to ensure the system is safe. The
Manual Service Disconnect (MSD) is one particular component used during servicing to split the
voltage of the battery pack in half. Hence, the ESS is not fully energized. The MSD must be in an
accessible location and by removing the MSD from the ESS, it provides a shut-off for the HV
18
system. The MSD acts as an energy source disabler, thus it must follow the lockout and tagout
procedure. The MSD may also have a built-in fuse to protect the ESS in a faulty event [24].
The LV ESS hands-on supplement is lower than 60 V peak, which technically does not require an
MSD. However, this concept and procedure is important for students to learn during the
onboarding process.
3.2.4 Battery Charge/Discharge and Internal Resistance Behavior
In HEVs and EVs, batteries are used as the main electric energy source. Depending on the driver
behavior of electric vehicles, batteries experience charge and discharge conditions. When batteries
are discharged, the capacity starts to fade and the power is reduced, known as performance
degradation. When cell internal impedance increases, battery power is reduced which also reduces
the operating voltage [21] [26]. Several studies have found that lithium ion batteries age after
cycling them several times [21] [26] [27]. Takei et al., present results that the capacity is reduced
as maximum voltage is increased [27].
Lithium ion batteries specifications are nominal voltage, maximum allowable voltage, minimum
allowable voltage and capacity (Ah). Although there are other specifications depending on battery
type, these are the most important to understand the behavior. When a lithium ion battery reaches
high or low voltage, current is limited by both the charger and the internal resistance.
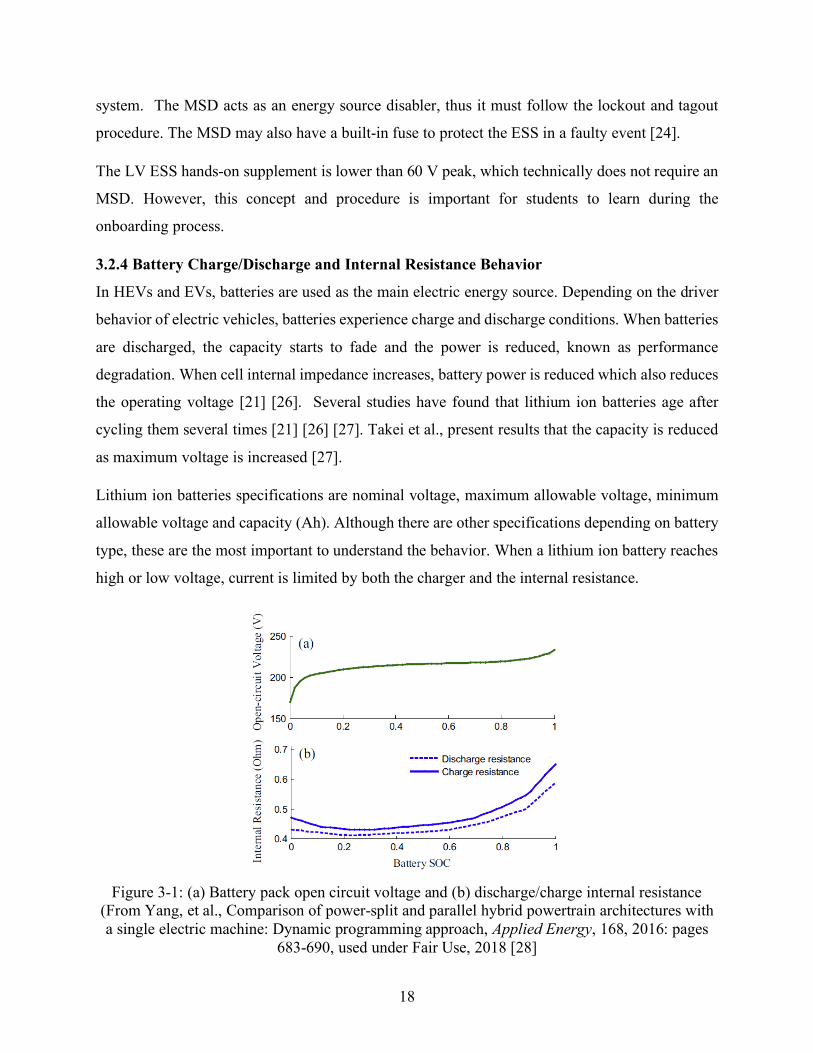
Figure 3-1: (a) Battery pack open circuit voltage and (b) discharge/charge internal resistance
(From Yang, et al., Comparison of power-split and parallel hybrid powertrain architectures with a single electric machine: Dynamic programming approach, Applied Energy, 168, 2016: pages
683-690, used under Fair Use, 2018 [28]
19
Internal resistance increases and changes over battery operation and lifetime due to degradation
[29]. Although high discharge rates occur when loading lithium ion batteries, these can self-
discharge during storage. Normally, batteries in storage deplete due to high or very low
temperatures which is explained more in the next subsection.
3.2.5 Thermal Management
Self-discharge of lithium ion batteries is not as important when used in EVs or HEVs, but it can
be important when used in other types of applications when batteries are stored for long periods
of time [21]. Linden et al., presented self-discharging data of a Sanyo C/LiCoO2 cells stored in
temperatures between 0°C to 60°C. There is low self-discharge on ambient temperatures from 0°C
to 25°C, however significant discharge occurs at temperatures stored at 60°C [30] [21]. Reports
show a capacity retention of 75%, 89%, and 93% after storing cells at 60°C, 25°C, and 0°C for six
months. Johnson and White et al., present results where cells sustain greater than 97% of capacity
when cells are stored at 25°C for one month [31] [21].
As noted by Bandhauer et al., battery performance characteristics are sensitive to temperatures
above 50°C and high state-of-charge (SOC) [21]. Lithium ion batteries used in automotive
applications should be held below 50°C. As lithium ion batteries charge or discharge, the
temperature of the cells start to increase. Depending of the pack design, interior cells may heat up
faster than others and propagate heat across the pack. To reduce the heat propagation, a cooling
method must be in place. Depending of the design, ESS can be passive air cooled, active air cooled,
or liquid cooled. The advantages and disadvantages are explained in these studies [21] [29].
Finally, cooling a battery pack in normal ambient temperatures (20°C) during operation or storage
mitigates self-discharge, power, and capacity fade [21].
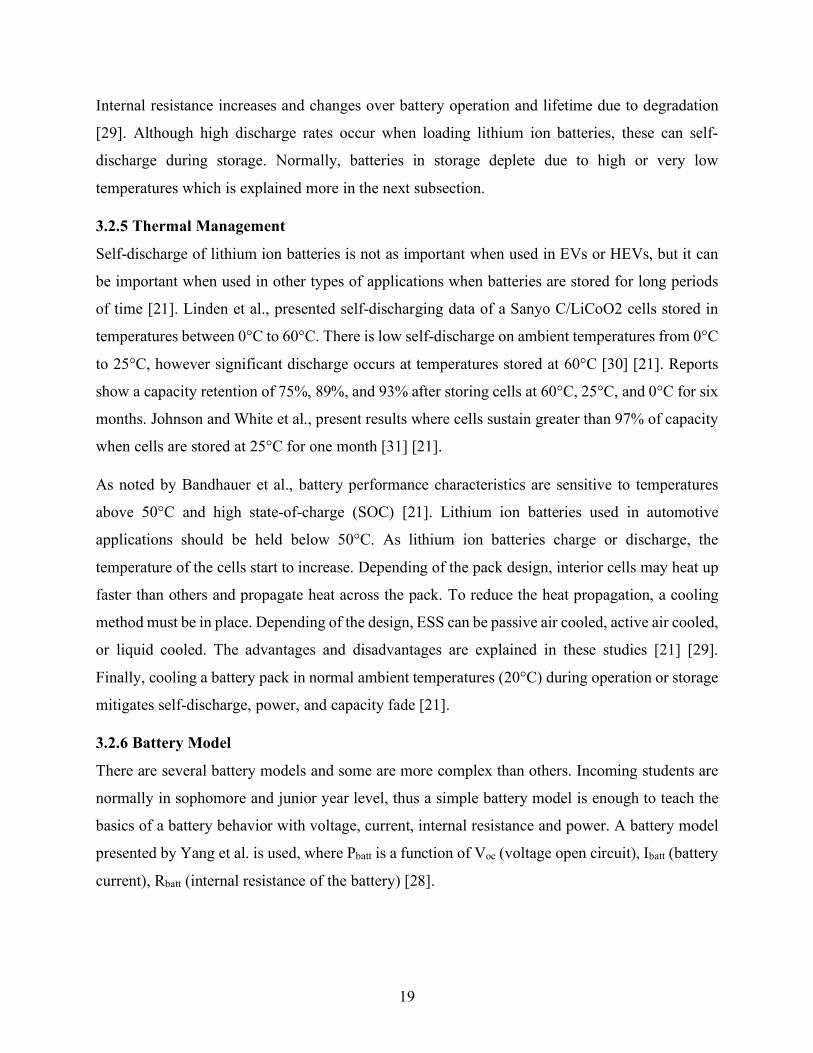
3.2.6 Battery Model
There are several battery models and some are more complex than others. Incoming students are
normally in sophomore and junior year level, thus a simple battery model is enough to teach the
basics of a battery behavior with voltage, current, internal resistance and power. A battery model
presented by Yang et al. is used, where Pbatt is a function of Voc (voltage open circuit), Ibatt (battery
current), Rbatt (internal resistance of the battery) [28].

20
Figure 3-2: Basic battery model
(From Yang, et al., Comparison of power-split and parallel hybrid powertrain architectures with a single electric machine: Dynamic programming approach, Applied Energy, 168, 2016: pages
683-690, used under Fair Use, 2018 [28]
The battery model can be analyzed using Ohms law. A resistor capacitor pair is needed to model
the transient response of a battery. Several studies have shown different modeling techniques [27]
[29] [30], but for the purpose of this thesis a simple basic battery model is enough. By using this
electrical circuit to model a battery, the internal resistance could be determined by providing a load
on the open terminals.
3.2.7 Battery Management System
As previously explained, lithium ion cells are connected in series or parallel to provide a useful
voltage or power depending on the application. When cells are connected in series or parallel,
capacity differences may occur even if cells are rated at the same capacity. Cells in series with
mismatched capacity can reduce the performance of the whole pack. The reduced performance
occurs because the weakest cell limits the overall performance of the pack [21]. The same situation
occurs when charging, given the weakest cell could be overcharged. Overcharge and under
discharge is extremely dangerous for a battery pack thus monitoring each series cell voltage
individually is necessary to ensure safe operation [21] [32].
The main component used on battery packs is a battery management system (BMS) to protect the
cells from under and over voltage. BMS monitors the voltage of each cell to ensure these are
charged equally. During charge, the moment one cell group is fully charged, the BMS discharges
at a small rate to equalize that cell group with the next highest cell group. The BMS monitors these
cell groups and ensures all reach the same maximum voltage [33]. This process is called charge
balancing and it ensures all battery cells have the same voltage to provide the maximum power

21
allowable by the system. Battery management systems from different manufactures have the
ability to be controlled through a controlled area network (CAN) and provide specific limitations
but are more expensive.
3.2.8 Wire and Fuse Sizing
HEVs and EVs have several different components to electrify the vehicles. As electrical systems
become more complex, wire sizing and fuse sizing becomes imperative for safety. Wire sizing
corresponds to the selection of the correct wire gauge to meet current draw, voltage, and
temperature requirements. An undersized wire may melt the insulation and short circuit the system.
Oversized wire adds cost, weight, and complexity in routing. Therefore, a steady state and transient
model developed by Nelson et al. is used to size wires [34] [35]. These models were developed to
help HEVT when designing LV and HV systems.
A fuse is an electrical safety device that protects the circuit from overcurrent. A fuse acts as a
sacrificial device to interrupt the flow of current and protect the wire or components. Fuses are
rated for both direct current (DC) and alternating current (AC). For vehicle applications, the rated
voltage and current are in DC. Fuses come in different shapes and for different applications. The
voltage rating must never be exceeded for safety reasons. The current rating is the continuous
current allowable that a fuse can hold. However, temperature and transient current are culprits to
blow a fuse. Manufactures provide a specification sheet for fuses and the I2t curves that explain
the amount of time a fuse blows depending on the current. Temperature effects cause de-rating for
a fuse. At higher temperatures (80°C) the fuse performance could be decreased by 30%, reducing
the allowable continuous current [34]. Transient current behaviors such as pulses can affect fuses.
Overall, the fuse current rating should be lower than the wire ampacity to reduce the event of a
short circuit.
3.3 Motor Systems
Electric and hybrid vehicles are a promising solution to reduce energy consumption in the
automotive industry. To reduce energy consumption, electric machines (EM) are used to both
propel and brake [36]. EMs could be either DC or AC motors. Permanent magnet synchronous
motors (PMSM) are mostly chosen today due to advancements in power electronic converters [37]
[38]. PMSM are also AC motors.

22
One main technology already implemented in automotive industry is regenerative braking.
Regenerative braking is used to improve the energy efficiency and driving range in EVs and HEVs
[28]. Regenerative braking is the process of when the electric motor can act as an electric generator
to convert kinetic energy into electric energy and store it into the ESS for future use. There are
several studies that discuss regenerative braking, but this thesis concentrates on the learning of
three-phase AC electric motors and the loading mechanism to bench test AC electric motors.
3.3.1 AC Motors and Motor Drive
AC motors are the dominant motor technology used today. These can be classified as single-phase
or three-phase [23]. Three-phase AC motors are concentrated on this literature review given HEVT
used three-phase AC motors in the past twenty years. Likewise, these types of motors are the most
common motor used in commercial and industrial applications [23]. Three-phase motors have a
number of individual wound coils constructed internally. The wound coils are wired either in series
or parallel to produce three different windings, normally known as: Phase A, Phase B, and Phase
C.
Figure 3-3: (a) Forward three-phase motor connection and (b) reverse three-phase motor connection.
Created by author using knowledge from Petruzella et al. [23] and InMotion U.S.
Depending on the three-phase connection to the motor drive, the motor may spin forward or
backwards. It is standard practice to determine the direction of rotation before making lasting
23
connections. As seen in Figure 3-3, just interchanging two phase leads of the motor can reverse
the direction. The main components of a motor are the stator, the rotor, the windings and the case.
For an AC motor, the rotor rotates due to a magnetic field created by the stator [23].
To control an AC motor, a variable-frequency drive (VFD) system is needed. This controller is
also known as the motor drive or motor inverter. The motor inverter converts electricity from DC
to AC to drive a motor. When a motor drive controls a motor, the motor converts electrical energy
into mechanical energy to spin the shaft. According to Petruzella et al., there is a direct relationship
between armature current and motor torque as well as armature voltage and motor speed [23].
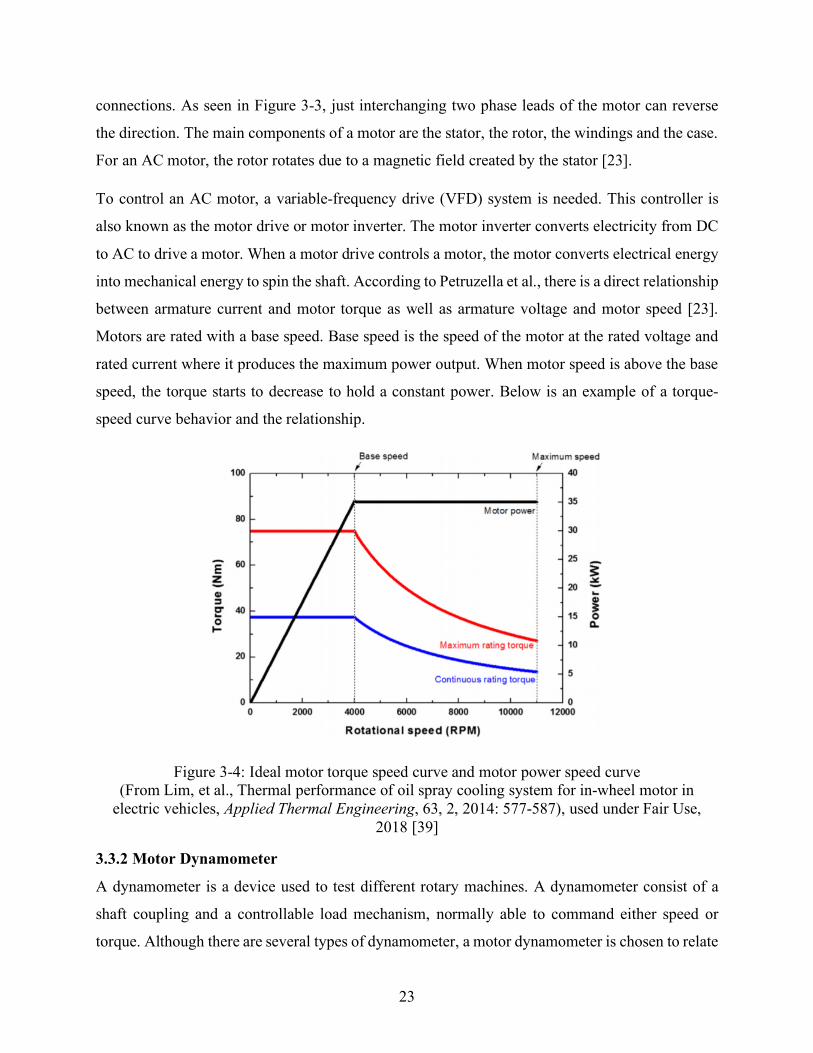
Motors are rated with a base speed. Base speed is the speed of the motor at the rated voltage and
rated current where it produces the maximum power output. When motor speed is above the base
speed, the torque starts to decrease to hold a constant power. Below is an example of a torque-
speed curve behavior and the relationship.
Figure 3-4: Ideal motor torque speed curve and motor power speed curve (From Lim, et al., Thermal performance of oil spray cooling system for in-wheel motor in
electric vehicles, Applied Thermal Engineering, 63, 2, 2014: 577-587), used under Fair Use, 2018 [39]
3.3.2 Motor Dynamometer
A dynamometer is a device used to test different rotary machines. A dynamometer consist of a
shaft coupling and a controllable load mechanism, normally able to command either speed or
torque. Although there are several types of dynamometer, a motor dynamometer is chosen to relate

24
the learnings to HEVs, EVs, and motor systems. In addition, the dynamometer setup must
introduce the concept of regenerative braking. In general, a motor dynamometer consist of a motor
acting as a driving mechanism and a motor acting as the generator to load the system. Both motors
must each have a separate motor controller, known as the motor drive, to control and command
torque or speed to each motors. Between the couplings of both motors, a torque sensor is needed
to monitor both torque and speed of the driving motor. The motor acting as a generator must always
be on the opposite setting compared to the driving motor (i.e. generator in speed mode and motor
in torque mode) [40].
3.3.3 Motor Quadrants
Motor drives could either be single-quadrant or four-quadrant. Single-quadrant drives are known
as non-regenerative drives and have no braking capabilities. A four-quadrant drive is able to take
the mechanical energy of the motor and convert it into electrical energy, thus braking the motor to
return energy to the DC bus. Four-quadrant drives have the capability of going in forward or
reverse direction. The four-quadrant drive is determined by motor speed and motor torque [23].
• Quadrant one occurs when the drive provides forward torque and motor speed. This
quadrant is known as the normal condition of a motor.
• Quadrant two provides a backwards torque and a forward motor speed. This is known as
the regenerative condition when the drive is absorbing power from a load.
• Quadrant three provides backwards torque and backwards motor speed. It is as quadrant
one but in the reverse direction.
• Quadrant four provides forwards torque and backwards motor speed. This is as quadrant
two but in the reverse direction, known as the regenerative condition.

25
Figure 3-5: Four quadrants motor drive operation Created by author using knowledge from Petruzella et al. [23] and InMotion U.S.
3.3.4 Relays and Contactor Logic
The electromechanical relay (EMR) is a switch operated by an electromagnet. Relays turn the load
on or off by providing power to the electromagnet. Relays have two components: a coil input and
a contact output. Relays and contactors have similar behavior, the only difference is that contactors
are rated for higher power, normally for HV systems. Contactors are used to reduce the inrush
current and prevent a current surge in the system [23]. Normally, controllers such as motor drives
have capacitors which should be current limited during start-up to reduce the surge current. This
is known as the pre-charge system. Normally, pre-charge systems are created with a pre-charge
resistor or an internal pre-charge circuit.
The main goal of the contactor in this thesis application is to use it by energizing the coil input
with a low voltage source to control and close the contact to power the load to allow the controller
capacitors to charge. When selecting a contactor, ensure it is AC or DC rated depending on the
application.
3.4 Summary
The literature review consisted of an introduction of knowledge to analyze the onboarding process
and knowledge transfer. To improve it, two hands-on supplemental projects are generated and

26
explained in the next sections to introduce the electric layout of a hybrid vehicle to incoming
students joining HEVT. Several studies are researched to understand the behavior of lithium ion
batteries and the safe components needed when building an LV ESS. Likewise, motor systems and
dynamometer setup is researched to understand the basics of AC three-phase motors. Chapters 4
and 5 correspond to the design, chosen components, and experimental setup of the LV ESS and
LV motor dynamometer.
4 Chapter – Low Voltage Energy Storage System From an automotive stand point, hybrid vehicles with a battery pack less than 60 V peak are
considered low voltage. The energy storage system is built as low voltage for safety and simplicity
compared to high voltage systems.
The ESS hands-on supplement content contains many tasks HEVT must complete when building
an ESS in a hybrid vehicle. The hands-on project introduces battery system requirements, matching
to load, energy and power. The project goes over electrical system design, voltage/current,
series/parallel cells, cell connections, insulation, wire and fuse sizing, and clearance. There also
exists a mechanical design for support structure, module compression, isolation enclosure and
venting. Control systems have a role in the project: the control of contactors, battery management
systems, testing and data acquisition. In addition, a simplified battery system model development
is needed. Finally, the project goes over documentation: project documentation,
assembly/disassembly procedures, schematics and specification sheets.
4.1 Energy Storage Simplified System Overview
The LV ESS is intended to be a bench top component to be used as a power supply for a low
voltage motor demonstration system. The system should be built to meet HV rules and to train the
next generation of student team members that participate in the next AVTC. A high-level system
overview is shown in Figure 4-1.

27
Figure 4-1: Simplified diagram of LV ESS
The LV ESS consist of 14 lithium ion cells connected in series to reach a nominal 52 V. The
maximum voltage of the ESS is 58.8 V and the low voltage cut-off is 35 V. Each lithium ion cell
is connected to a BMS to ensure each cell does not go over 4.2 V. In addition, a temperature sensor
is added to monitor thermal data. The charger converts AC power to DC power to charge the LV
ESS. The charger is a constant current (CC) and then constant voltage (CV) device. To monitor
the DC voltage of the LV ESS, a power analyzer is used to measure cell voltages, current demand
and power demand.
A full LV ESS design is developed using Siemens NX 10. As a bench top testing project, is
important for the LV ESS to be moveable and light for a person to carry. During the design process,
the layout is iterated many times to address component ratings and clearances, space constraints,
and wire routing. The preliminary design of the LV ESS is shown in a CAD model and Figure 4-5
shows the final design as built.

28
Figure 4-2: 3D Preliminary CAD model of LV ESS
The main overhead materials used to fully finish the system are: plywood, bolts, nuts, washers,
lock washers and custom 3D printed mounts. The next section goes into the design and selection
of the main components for the LV ESS.
4.2 Component Selection
This section describes the main components in creating the LV ESS. Components include the
lithium ion cells, the MSD, the BMS, the charger, charge switch, voltage display, and the wire and
fuse sizing.
Before selecting components for the LV ESS, the continuous and peak current demand of the LV
ESS must be determined. Although the 5 Ah lithium ion cells are able to discharge at 20C (i.e 100
A) [41], sizing components and wiring to sustain that much current draw increases cost and design
complexity. Therefore, the continuous and peak current demand of the motor drives are used to
size wires, fuses and the voltage rating of the LV ESS. The motor drive continuous current is 30
Arms and the peak current is 70 Arms. Reference Table 5-2 for all detailed specifications of the
motor drives. The operating motor drive voltage is 33-63 VDC [42]. To decrease system
complexity and ensure available components in the market, a 30 Arms continuous is chosen. The
nominal power capability of the system is thus 1.5 kW. Note the current used to size components
is the motor drive DC input current.

29
4.2.1 Lithium Ion Cells
The lithium ion cells were donated by a Virginia Tech Ph.D. student that cycled and tested lithium
ion cells. The prismatic cells came with all required hardware such as washers, lock-washers, nuts,
cell spacers and end plates for each cell. In addition, the pack end-plates with spacers were donated.
The lithium ion cell specifications are shown in Table 4-1.
Table 4-1: Cell specifications for LV ESS Cell Specifications
Cell type Prismatic type Positive/Negative Terminal M5 stud Rated capacity 5 Ah Nominal voltage 3.7 V Max voltage 4.2 V Min voltage 2.5 V Max temperature 60°C
Cell series connections are required to build an LV system. When cells are connected in series, the
voltage is increased by the amount of cells in a series connection. 14 cells in series is the maximum
allowable connections to have peak voltage less than 60 V. By using 14 cells in series, the LV ESS
nominal voltage and energy capacity is 52 V and 5 Ah respectively. Thus, the total LV ESS energy
is 260 Wh. In automotive industry, ESS are depleted to approximately 20% SOC and charged to
90% SOC to prolong the life and discharge/charge cycles of the battery pack. As seen in the results
section 6.1, when the battery pack is depleted at 1C (i.e. 5A) and the load is cutoff when battery
pack is at 42 V, the run time is approximately 52 min and 234 Wh of energy is depleted out of the
battery. Energy capacity is an important consideration for sizing and ESS design. In this thesis, 5
Ah lithium ion cells are used due to availability.
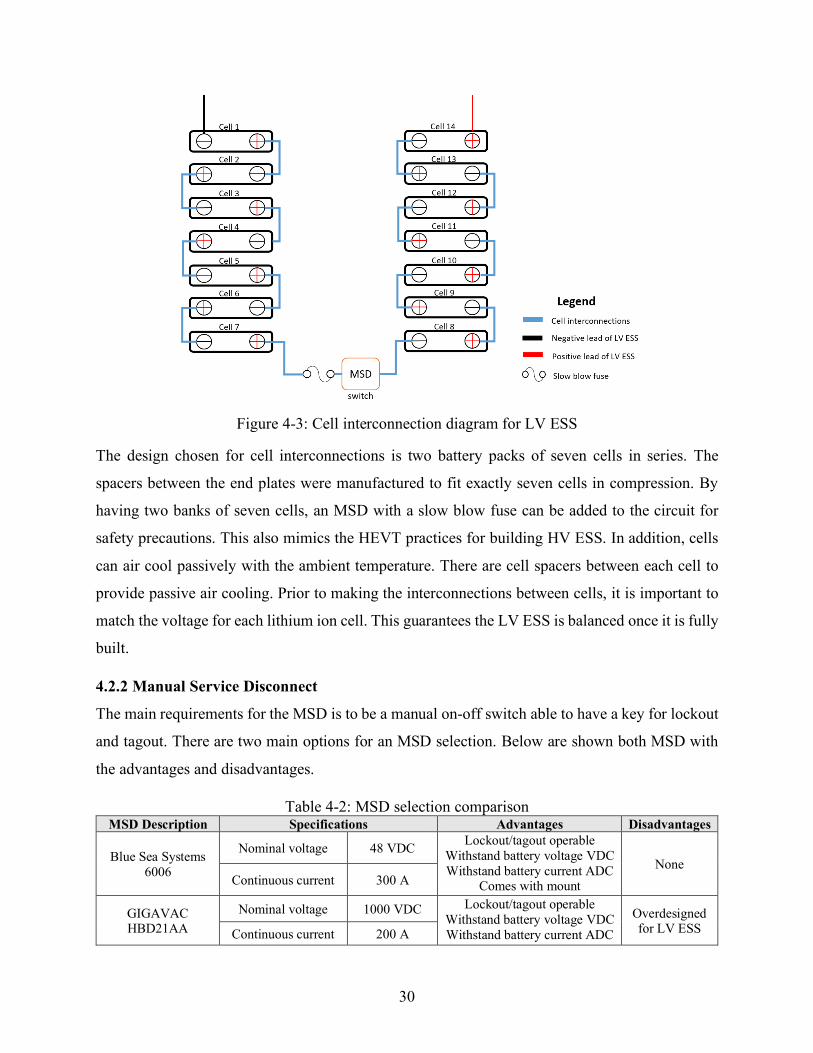
30
Figure 4-3: Cell interconnection diagram for LV ESS
The design chosen for cell interconnections is two battery packs of seven cells in series. The
spacers between the end plates were manufactured to fit exactly seven cells in compression. By
having two banks of seven cells, an MSD with a slow blow fuse can be added to the circuit for
safety precautions. This also mimics the HEVT practices for building HV ESS. In addition, cells
can air cool passively with the ambient temperature. There are cell spacers between each cell to
provide passive air cooling. Prior to making the interconnections between cells, it is important to
match the voltage for each lithium ion cell. This guarantees the LV ESS is balanced once it is fully
built.
4.2.2 Manual Service Disconnect
The main requirements for the MSD is to be a manual on-off switch able to have a key for lockout
and tagout. There are two main options for an MSD selection. Below are shown both MSD with
the advantages and disadvantages.
Table 4-2: MSD selection comparison MSD Description Specifications Advantages Disadvantages
Blue Sea Systems 6006
Nominal voltage 48 VDC Lockout/tagout operable Withstand battery voltage VDC Withstand battery current ADC
Comes with mount None
Continuous current 300 A
GIGAVAC HBD21AA
Nominal voltage 1000 VDC Lockout/tagout operable Withstand battery voltage VDC Withstand battery current ADC
Overdesigned for LV ESS Continuous current 200 A

31
The chosen MSD is the Blue Sea Systems 6006. This manual switch is able to operate at nominal
48 VDC with a continuous current rating of 300 A. The most important reason to select this manual
switch is due to an isolating cover to protect the rear contacts. Refer to the instructions and
specifications for installation [43].
4.2.3 Battery Management System
Several types of battery management systems exist in the market. Normally, these are CAN
controlled and are able to set different types of limits to each cell (voltage, temperature, current
draw). CAN controlled BMS have several configurations but are definitely the most expensive. In
the market, a normal CAN controlled BMS averages $450. The Orion Jr BMS is a good example
and is able to meet all requirements for the LV ESS [44]. However, the LV ESS hands-on
supplement is a project to teach incoming students about battery systems and expensive materials
are not required for this setup. Through research, a specific 14 lithium ion cell BMS is found and
sold by Vruzend. This BMS is able to meet all LV ESS requirements for $34. The Vruzend BMS
specifications are Table 4-3.
Table 4-3: BMS specifications for LV ESS [33] Lithium Ion BMS Specifications
Model number BMS5230 Number of cells 14 Max cell voltage 4.2 V Min cell voltage 2.5 V Max rated discharge current 30 A Charging voltage 58.8 V Max rated charging current 15 A *Balance current 50 mA Operating temperature -15ºC to +45ºC Board dimensions 10.9 cm x 5.9 cm x 0.9 cm *Charger need to be connected to enter balancing mode
The Vruzend BMS is not CAN controlled but is able to limit cell voltage by itself. The BMS5230
BMS has a discharge wire, a charge wire and a battery negative wire. The discharge wire is known
as the P-, which connects to the negative lead of the load. The charge wire is known as the C-,
which connects to the negative lead of the charger. The B- connects to the negative lead of the
battery pack. There are 15 balancing wires. The first balancing wire is black and connects to the
negative lead of the battery pack. The other 14 balancing wires connect to the positive cell stud of
each cell. By selecting this BMS, the maximum discharge current allowable is 30 A for the LV

32
ESS. A diagram from Vruzend is shown in Figure 4-4 regarding the cell connections. Follow the
installation instruction for more information [45].
Figure 4-4: 14s BMS diagram connection [33]
used under Fair Use, 2018
4.2.4 Charger
The lithium ion batteries should be charged at a 1C current for battery health. The lithium ion cells
are 5 Ah, meaning that a CC-CV charger providing a maximum voltage of 58.8 V and a maximum
current charge of 5 A is desired. The chosen charger is a 52 V nominal lithium ion battery charger
from Vruzend. This charger is chosen due to price comparison compared to other chargers in the
market. The charger specifications are shown next.
Table 4-4: Charger specifications for LV ESS [46] 52 V Lithium Ion Battery Specifications
Model number charger523 Full charge voltage 58.8 V Charging current 3 A Charger power rating 180 W Charging profile CC-CV Input 110-240V AC 50/60 Hz Cooling fan Yes, installed DC Charging connector 5.5 x 2.1 mm male barrel connector AC wall connector 2-prong USA plug Physical size 2″ x 3″ x 6″
The 52 V nominal lithium ion charger has a charging current of 3 A, lower than 1C. Charging a
battery pack with a lower C-rate does not provide any downside for battery health. The only
difference is the amount of time it takes to fully charge the battery pack. A comparison using
different charge rates in the LV ESS is displayed in the Table 4-5.

33
Table 4-5: Bulk charge rate comparison and time result C-Rate Battery
Capacity (Ah) Charge
Current (A) Time to Charge Battery (Min)
1 5 5 60 0.6 5 3 100 0.5 5 2.5 120
As seen in Table 4-5, when charge rate decreases, the time to charge increases. Note only the bulk
charge occurs at CC, in the charger phase, at maximum current. Refer to Figure 6-7 for charging
results of the LV ESS. The 52 V lithium ion battery charger meets all LV ESS requirements. A
5.5 x 2.1 mm female barrel connector is acquired to connect directly to the positive lead of the
ESS and to the negative charge lead of the BMS. Refer to the LV ESS wiring schematics in Low
Voltage Energy Storage System Schematics. Connector C3 is the female barrel connector.
4.2.5 Charge Switch
To initialize the charging process, a manual rocker switch is selected for the user. The switch acts
as a verification step to ensure all connections have been made in the LV ESS before the charging
process starts. Since the charger provides a peak voltage of 58.8 V and a current of 3 A, the selected
switch must meet those requirements. The selected rocker switch is a 48 VDC nominal rated at 6
A. This rocker switch is a double-pole single-throw (DPST), meaning that both positive and
negative leads are be controlled by the switch [47].
4.2.6 Voltage Display
A voltage display is acquired for the LV ESS for safety and storage purposes. As explained in
Section 3.2.5, batteries self-discharge over time. The voltage display is an easy way to determine
whether the battery pack is at lower voltage cut-off (i.e. 35 V). There are several types of voltage
displays but the main requirement is to read up to 60 VDC. The chosen voltage reader is able to
read voltage, current, power, and energy. To read current, a 75 mV – 100 A shunt is used. Table
4-6 provides the voltage display specifications.
Table 4-6: Voltage display specifications for LV ESS Bayite LCD Display Digital
Voltage test range 6.5 – 100 VDC Current test range 0 - 100A Active Power test range 0 – 10 kW Energy test range 0 – 9999 kWh

34
4.2.7 Wire and Fuse Sizing for LV ESS
HEVT faculty advisor, Dr. Douglas Nelson, developed an AAE curriculum module for wire sizing
and fuse sizing [34]. This module has been used to generate a general transient thermal model for
peak current to find the temperature of the wire with a known continuous current draw. The general
transient model solution is seen in the following equation.
𝑇"#$% = 𝑇()* + (𝑇#-#. − 𝑇()*)𝑒2 3345 + (𝐼7𝑅’%:𝑅’.;) <1 − 𝑒
2 3345> (1)
Where 𝑇"#$% is the temperature of the wire, 𝑇()* corresponds to the ambient temperature, 𝑇#-#. is
the wire temperature at steady state, 𝑡 is the time, 𝑡𝑎𝑢 is the thermal time constant of the wire, 𝐼 is
the peak current, 𝑅’%: is the wire electrical resistance, and 𝑅’.; is the wire thermal resistance. More
information can be found in a study made by Marquez and Nelson et al. [35] [34]. Equation 1 can
be rearranged to determine the time the wire temperature reaches the insulation temperature.
To size the main wire, all wires must be automotive standard wires. These have insulation
temperature ratings of 90, 105, and 125 ºC. The greater the insulation temperature rating the more
expensive the wire is. Since the LV ESS is to be tested in a controlled environment at 25 ºC, an
insulation temperature of 90 ºC is sufficient for the application. Below is a table with thermal wire
modeling of the selected wire size with known initial conditions.
Table 4-7: Thermal wire modeling results at different conditions
Application Ambient
Temperature (ºC)
Insulation Temperature
(ºC)
Continuous Wire Current
(A)
Peak Wire Current
(A)
Wire Size
(AWG)
Time (s) for Twire = Tinsulation
DC battery power leads
25 90 30 70 12 4.96 35 90 30 70 12 0.48 25 90 30 32 12 Inf. 35 90 30 32 12 16.65 25 90 30 70 10 51.21 35 90 30 70 10 35.79 25 90 30 32 10 Inf. 35 90 30 32 10 Inf.
DC battery charge leads
25 90 3 3.5 20 Inf. 35 90 3 3.5 20 Inf.
The selected wire gauge for the power leads is 10 AWG. Although 12 AWG would suffice for a
controlled temperature room, it could not be enough if the LV ESS is tested outside at temperatures
of 35 ºC. Also, if the BMS is bypassed and the pack is discharged at a peak current of 70 A, the
10 AWG wire takes approximately 36 seconds to reach the wire insulation temperature rating. To

35
protect the wire and the component, a fuse is used which is further explained later. The wire gauge
for the charge leads could be as small as 20 AWG. If a bigger wire gauge is chosen for the charge
leads, the temperature of the wire is not going to reach the insulation temperature. The most
common reason to choose a bigger wire gauge is to keep a symmetry along the system.
There are two fuses required when building an LV ESS. The first is the mid-pack fuse to protect
the whole battery pack in case of high loads. The second is the charge fuse to protect the pack from
current faults during the charging process. The mid-pack fuse chosen is a 30 A fuse rated at 300
VDC, slow blow. The slow blow specification allows more power through the fuse and prevents
from opening during high short time current spikes. Since low voltage automotive fuses are rated
up to 32 VDC, HV fuses are considered. Littlefuse has a family of low current (LC) HEV fuses.
The fuse termination chosen is cartridge to use on a fuse holder. Note the fuse holder must match
the system voltage (LV ESS) and the fuse current rating.
The charge fuse is difficult to select. Due to the low current supplied during charging, fuses become
limited on the market for voltage ratings of 60 VDC. The only types found are glass fuses able to
withstand 125 VDC with several current ratings. The glass fuses are normally fast-acting, meaning
the fuse blows after going above the rated current. The chosen charge fuse is a glass fuse rated at
125 VDC and 3.5 A, fast acting.
4.3 Overall and Detailed Design of Energy Storage System
All chosen components meet all requirements to build the LV ESS. A bill of materials (BOM) is
presented in Table 4-8 and Figure 4-5 shows the final design as built.
Table 4-8: Bill of Materials of LV ESS QTY Part # Description Application
14 N/A Prismatic lithium ion cells Energy source of the battery pack 12 N/A Bus bars Cell interconnection 16 N/A Cell spacers Space cells for thermal management
4 N/A End plates Compression plates to reduce thermal expansion
8 N/A Pack spacers Spacers for compression end plates 8 N/A Stud bars Compression of battery pack 28 N/A M5 nuts Cell terminal nuts 28 N/A M5 washers Cell terminal washers 28 N/A M5 lock washers Cell terminal lock washers 1 0HEV030.ZXC 30 A HEV fuse Slow blow mid-pack fuse 1 N/A 30 A fuse holder Holds and protects mid-pack fuse 1 611-DF62J12S2AQA Rocker On-Off 48 V switch Charging rocker switch

36
QTY Part # Description Application
1 7527K82 300V AC/300V DC Terminal Block, Two 30A Circuits, 9/16" Center-to-
Center w cover & marker strip Terminal block for DC bus
1 7527K75 300V AC/300V DC Terminal Block, Sixteen 30A Circuits, 9/16" Center-to-Center w cover & marker strip
Terminal block for BMS connections
1 6006 Blue Sea Systems m-Series Battery Switch, 2 Position, On-Off, 300A,
48V
Manual Service Disconnect (MSD)
1 N/A 5.5 x 2.1 mm female connector Vruzend
Charging female connector for 52V charger
1 N/A 52V Lithium-ion battery charger (3 A) Charger for LV ESS
1 N/A 52V 14s Battery Management System (BMS) BMS for LV ESS
10 ft. N/A 10 AWG (90 ºC) red wire Wire for power leads 10 ft. N/A 10 AWG (90 ºC) black wire Wire for ground leads 20 ft. N/A 20 AWG (90 ºC) red wire Wire for balancing wires 10 ft. N/A 20 AWG (90 ºC) black wire Wire for balancing wires
1 F2463-ND Fuse glass 3.5A 250VAC 125VDC Charge fuse 1 F1468-ND Inline fuse holder 350V, 10A Inline fuse holder for charging circuit
1 N/A bayite DC 6.5-100V 0-100A LCD Display Digital Current Voltage Power Energy Meter Multimeter
Digital voltage reader for battery monitoring
1 N/A 75 mV – 100 A shunt Device to measure current
15 Panduit Ring Terminal, 22 – 18 AWG, #10 stud, nylon insulated Ring terminals for balancing wires
40 Panduit Fork Terminal, 22 – 18 AWG, #10 stud, nylon insulated
Fork terminals for balancing wires and shunt connections
8 Panduit Ring Terminal, 12-10 AWG wire, #10 stud hole, nylon insulated
Ring terminals for ground and power leads
1 Panduit Ring Terminal, 16 – 14 AWG, #10 stud size Ring terminal for charger switch
4 Panduit Ring Terminal, 12 – 10 AWG, 3/8" stud size, nylon insulated, standard
package. Ring terminals for shunt and MSD
2 Panduit Loose Piece Disconnects, 22-18 AWG Disconnects to charge switch
2 Panduit Loose Piece Disconnects, 16-14 AWG Disconnects to charge switch
1 N/A High quality plywood Base of LV ESS 2 N/A 1’ x 1’ of polycarbonate Battery pack cover protection
1 N/A Roll of Kapton tape Protect terminal studs from contacting one and other
There is overhead hardware such as bolts and washers to fully complete the LV ESS that are not
in the bill of materials. The majority and main components required are shown Table 4-8. The built
LV ESS is shown next.

37
Figure 4-5: Final design product of LV ESS
There are three types of operation in the LV ESS: Charge mode, Depletion mode, and service
mode. Each mode is user selectable, so directions must be followed to prevent any safety hazard.
The steps to operate each mode are described next.
Charge Mode
1. Ensure that the MSD and the charge switch are off.
2. The DC bus for the load must be disconnected.
3. Connect the charger to the wall and connect the charger to the female barrel connector.
4. Rotate the MSD 45 degrees clockwise to turn it on.
5. Verify the voltage of the pack with the digital voltage reader
6. Turn on the charge switch for the charger to provide power to the LV ESS.
Depletion Mode
1. Ensure the MSD and the charge switch are off.
2. The female barrel connector must be disconnected from the charger.
3. Connect the DC bus to a load (resistors or motor system).
4. Rotate the MSD 45 degrees clockwise to turn it on.
5. Verify the voltage of the pack with the digital voltage reader.

38
6. The LV ESS is ready to power up a system.
Service Mode
1. Ensure the DC bus and the female barrel connector are disconnected.
2. Rotate the MSD 45 degrees counterclockwise to turn off the LV ESS.
3. Verify the voltage of the pack with the digital voltage reader (a decrease in voltage should
happen when rotating the MSD).
4. Remove knob from MSD.
5. Start lockout and tagout procedure.
4.4 Data Acquisition System
HEVT uses a main power analyzer as an instrumentation tool to test and record data for HV ESS.
This power analyzer is used as data acquisition for the LV ESS to teach students HEVT tools and
programs in the onboarding process. The power analyzer is a Hioki 3390 Power Analyzer capable
of using four channels to record voltages up to 600 VDC and four channels to record current either
AC or DC. The current sensors are hall-effect sensors able to measure the current flux to determine
the current going through a specific wire. The power analyzer has an SD card capable of saving
and recording data for later use to perform data analysis.
Other devices for data acquisition systems can be used to monitor voltage and current such as an
National Instruments (NI) myDAQ. This is a low-cost data acquisition device that is on the price
range of any student laboratory. The downside of the myDAQ system is the low quantity of analog
inputs to record cell voltages. Likewise, only the DMM inputs can be used to accurately measure
resistance, current and voltage. Resistance is used to measure temperature from a negative
temperature coefficient (NTC) thermistor and voltage is used to measure the voltage drop of the
shunt. During the construction of the LV ESS, connectors are placed in strategic locations for ease
of data acquisition using the myDAQ. On the other hand, the power analyzer does not require
external connectors because it has special hook clip voltage connectors rated for 300 VDC and 1A.
The connector layout can be seen in Figure 4-6.

39
Figure 4-6: Connector layout for myDAQ data acquisition
For both data acquisition devices, computer software is used to process the data. These are
explained in the next section.
4.4.1 Computer Software Required
Several software programs are used to process data. These programs are used in the industry and
the goal is for the incoming students to become experienced with these programs before students
join HEVT for senior design.
Table 4-9. Installed software and purpose Software Purpose
CAD NX 10.0 Mechanical design of structure, wire routing, clearance between components.
MS Visio Vesys
Schematic design of components. Document all wire size and fuse size selected for the LV ESS.
MatLab Math software analysis tool to do data processing. MS Excel Math software analysis tool to do data processing.
NI LabView 2017 Record and monitor on real time cell voltage and resistance for shunt measurements.
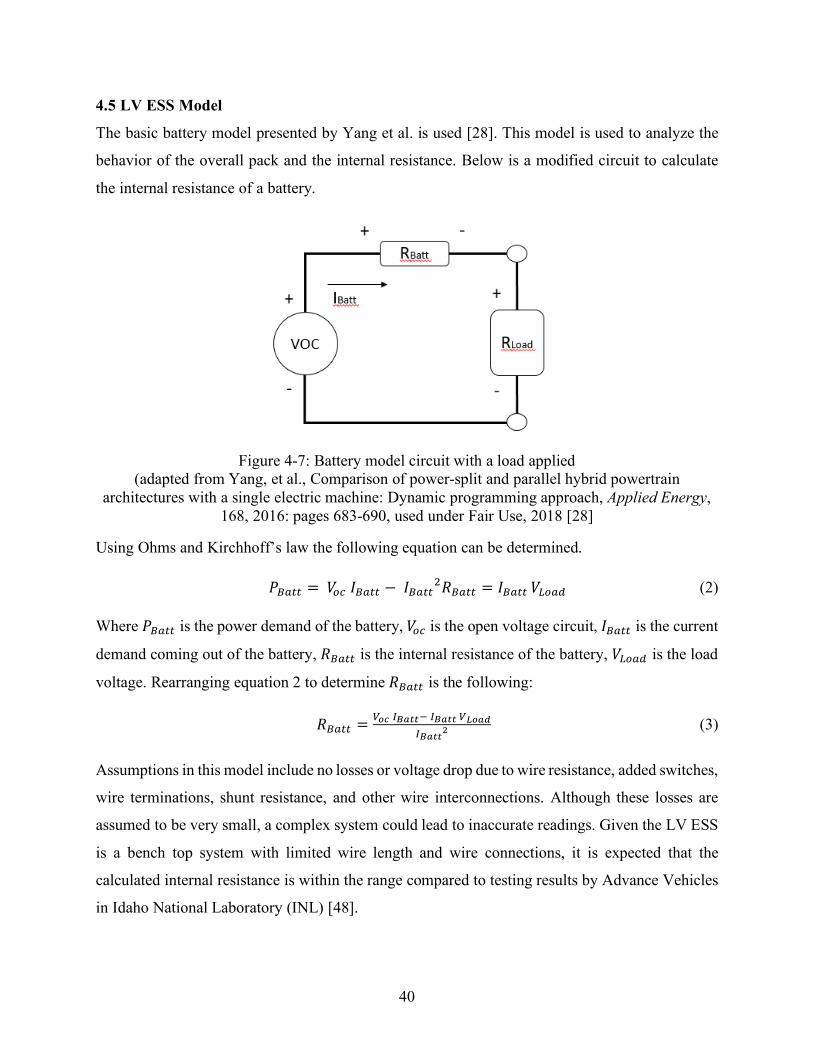
40
4.5 LV ESS Model
The basic battery model presented by Yang et al. is used [28]. This model is used to analyze the
behavior of the overall pack and the internal resistance. Below is a modified circuit to calculate
the internal resistance of a battery.
Figure 4-7: Battery model circuit with a load applied
(adapted from Yang, et al., Comparison of power-split and parallel hybrid powertrain architectures with a single electric machine: Dynamic programming approach, Applied Energy,
168, 2016: pages 683-690, used under Fair Use, 2018 [28]
Using Ohms and Kirchhoff’s law the following equation can be determined.
𝑃C(.. = 𝑉EF𝐼C(.. − 𝐼C(..7𝑅C(.. = 𝐼C(..𝑉GE(H (2)
Where 𝑃C(.. is the power demand of the battery, 𝑉EF is the open voltage circuit, 𝐼C(.. is the current
demand coming out of the battery, 𝑅C(.. is the internal resistance of the battery, 𝑉GE(H is the load
voltage. Rearranging equation 2 to determine 𝑅C(.. is the following:
𝑅C(.. =IJKLM4332LM433INJ4O
LM433P (3)
Assumptions in this model include no losses or voltage drop due to wire resistance, added switches,
wire terminations, shunt resistance, and other wire interconnections. Although these losses are
assumed to be very small, a complex system could lead to inaccurate readings. Given the LV ESS
is a bench top system with limited wire length and wire connections, it is expected that the
calculated internal resistance is within the range compared to testing results by Advance Vehicles
in Idaho National Laboratory (INL) [48].

41
4.6 LV ESS Experimental Setup
To determine the behavior of the LV ESS, a load is generated. The easiest way to generate a load
is by using high power resistors to deplete the pack. An external load setup is built as a portion of
the experimental setup of the LV ESS. Using Ohms Law to size the external load to be
approximately 1C (discharge at 5 A), the resistance of a high-power resistor is determined.
𝑉QRR = 𝐼𝑅GE(H (4)
Where 𝑉QRR is the voltage of the LV ESS, 𝐼 is the discharge current, and 𝑅GE(H is the resistance of
the high power resistor. Using the nominal case, the resistance and power dissipation determined
is 10.4 Ω and 260 W. Although there are disadvantages of just using a resistor to load the system
due to current drop, it is sufficient because students can learn the basics of circuits. In addition,
building the load setup takes considerable less time than other possible solutions.
The chosen high-power resistors are rated for 5 Ω resistors and 225 W for power dissipation. To
provide the approximate 1C discharge to the LV ESS, two resistors are connected in series. When
resistors are connected in series, the ohm rating and power rating are added. Overall, the load setup
is rated at 10 Ω and 450 W for power dissipation. This meets the requirements to load the LV ESS.
Figure 4-8: Finalized load setup using high power resistors
The setup for load testing starts by connecting the DC leads to the LV ESS. Three hook voltage
clip connectors pairs from the power analyzer are used to monitor pack, and cell voltage. Only two
voltage channels are used to measure mid-cell and end-cell voltages. These two locations are the
extreme scenarios possible and are chosen to monitor the behavior between middle and end cells.

42
The third voltage channel is used for the battery pack terminals. An AC/DC current sensor is used
with the power analyzer to measure the RMS current through the load. The following figure
presents a diagram of the load setup.
Figure 4-9: Data acquisition diagram for load testing
The load testing setup is also used to determine the internal resistance of the LV ESS. The open
circuit voltage can be measured in the battery terminals after a resting period of 15 minutes.
Resting period indicates there is no current flow through the battery pack. The goal is to measure
𝑉EF when the LV ESS is not loaded, and measure 𝑉GE(H and 𝐼C(.. when the LV ESS is loaded. The
following steps provide a test plan to calculate the internal resistance of the battery pack
1. Instrument the LV ESS with the power analyzer.
2. Connect a hook voltage clip pair to the battery terminals and the AC/DC current sensor to
the power analyzer. Do not forget to start measuring. Note the LV ESS voltage should be
above 58 VDC.
3. Load the battery pack using the load switch (turn on the load switch).
4. Discharge the LV ESS for approximately six minutes. Note as the lower limit voltage is
approached, discharge time should be decreased.
5. Turn off the load switch (no current through the battery pack).
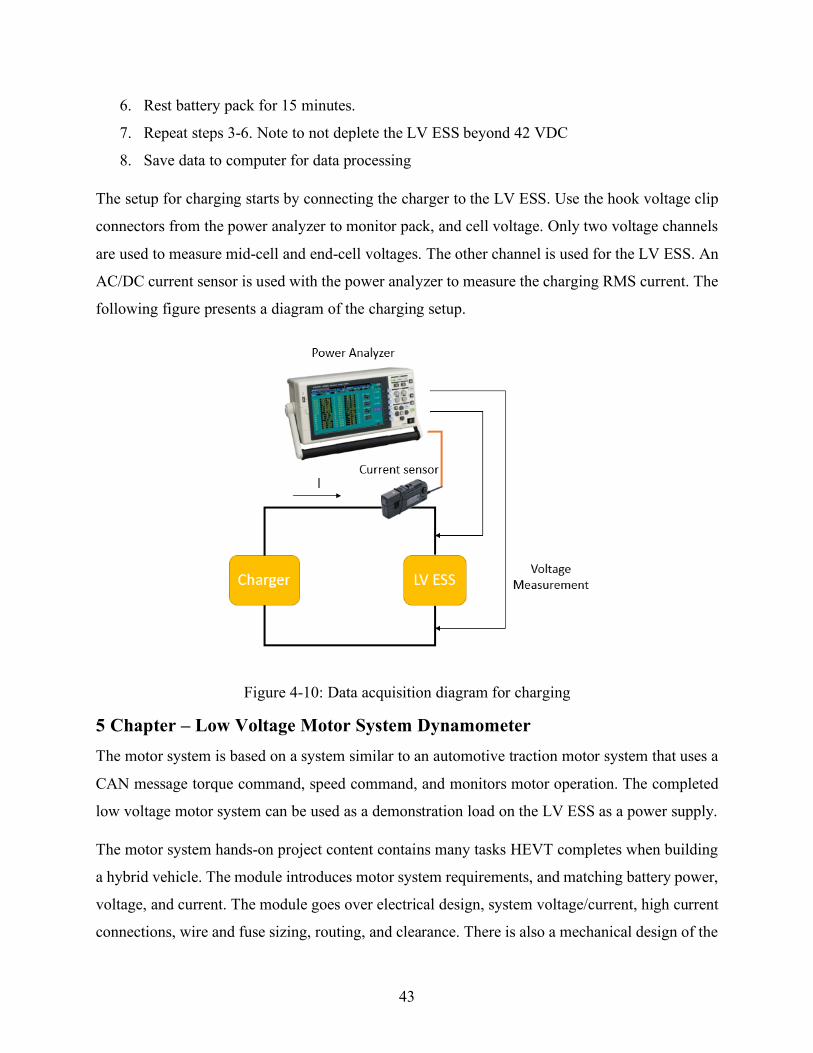
43
6. Rest battery pack for 15 minutes.
7. Repeat steps 3-6. Note to not deplete the LV ESS beyond 42 VDC
8. Save data to computer for data processing
The setup for charging starts by connecting the charger to the LV ESS. Use the hook voltage clip
connectors from the power analyzer to monitor pack, and cell voltage. Only two voltage channels
are used to measure mid-cell and end-cell voltages. The other channel is used for the LV ESS. An
AC/DC current sensor is used with the power analyzer to measure the charging RMS current. The
following figure presents a diagram of the charging setup.
Figure 4-10: Data acquisition diagram for charging
5 Chapter – Low Voltage Motor System Dynamometer The motor system is based on a system similar to an automotive traction motor system that uses a
CAN message torque command, speed command, and monitors motor operation. The completed
low voltage motor system can be used as a demonstration load on the LV ESS as a power supply.
The motor system hands-on project content contains many tasks HEVT completes when building
a hybrid vehicle. The module introduces motor system requirements, and matching battery power,
voltage, and current. The module goes over electrical design, system voltage/current, high current
connections, wire and fuse sizing, routing, and clearance. There is also a mechanical design of the

44
motor mount support structure, load/generator torque coupling, and torque load reactions. The
project goes over a cooling system to dissipate losses; however simple fan cooling is enough for
the system. Control systems have a role in the project: the control of torque command, system
enable, testing and data acquisition. Finally, the content goes over documentation: project
documentation, assembly/disassembly procedures, schematics and specification sheets.
5.1 Simplified Motor System Dynamometer Overview
The motor system dynamometer is intended to be a bench top component to be used as a learning
and demonstration tool for incoming students to learn about motors. The system is built to meet
wire clearances and torque reactions. A high-level system overview is shown in Figure 5-1.
Figure 5-1: Simplified diagram of motor dynamometer system
The motor system dynamometer consists of two motor systems (motor and motor drive) in a closed
loop to create a motor dynamometer. The “motor” is the driving unit and the motor loading the
system is the “generator”. Both motors have an APS48M inverter that provides variable frequency,
voltage, three-phase AC power to motors. The “driving motor” converts electrical power into
mechanical power by rotating the shaft. The shaft couples mechanically both the motor and the
generator. The generator loads the system and converts the mechanical power into electrical power
back to the generator inverter. Finally, the generator inverter returns power to the DC bus. The
generator system is controlled in speed mode using a control interface (computer) and the driving
motor system is controlled in torque/current mode. To control both motor systems, two

45
CANcaseXL devices are used to allow CAN communication from the control interface to the two
inverter pairs. The final LV motor dynamometer system design is presented in Figure 5-2 to present
the layout and main components of the whole system.
Figure 5-2: Layout of motor dynamometer system components
5.2 Component Selection
This section describes the main components to create the motor system dynamometer. Components
include the motors, the inverters (motor drive), the contactor, the coupler connection, and motor
mounting.
5.2.1 Motor and Generator
HEVT has developed a relationship with a local motor company, InMotion US, during the
EcoCAR 3 competition. InMotion US manufactured and donated the main electric motor for the
hybrid Camaro of HEVT. Because of this relationship, HEVT was able to receive two low voltage
steering motors for bench testing purposes. Both motors are permanent magnet synchronous AC
motor (PSM). AC motors have been recently used as the EMs for HEVT. Therefore, these motors

46
are used for the motor dynamometer setup and the specifications are shown below. Note that other
motors could be used in this project if desired.
Table 5-1. Main motor and generator specifications Application Motor Model
Number Specifications
Generator PSM-C3016-D
Voltage 48 V Max radial shaft load 2240 N
Continuous RMS (1 hr.) 30 A Peak RMS (1 min.) 70 A
Motor PSM-B3015-B
Voltage 48 V Max radial shaft load 2240 N
Continuous RMS (1 hr.) 15 A Peak RMS (1 min.) 35 A
The torque-speed and current-speed curves of both motors are presented in the next figures by
courtesy of InMotion US.
Figure 5-3: Torque/current-speed curve of driving motor (B3015-B) at 48 VDC
0
10
20
30
40
50
60
70
0.0
0.5
1.0
1.5
2.0
2.5
3.0
3.5
0 1000 2000 3000 4000 5000
Cur
rent
(Arm
s)
Torq
ue (N
-m)
Speed (rpm)Maximum Torque Continuous Torque 100degC RiseMaximum Torque Current Continuous Torque Current 100degC Rise
≈ 1.7 Nm
≈ 15 A

47
Figure 5-4: Torque/current-speed curve of generator (C3016-D) at 48 VDC
The PSM C3016-D is used as the generator due to the peak torque rating and the torque/current
relationship at continuous and peak torque command. To operate the motor dynamometer system
safely, the driving motor torque rating must be the same or lower than the generator torque rating.
This way, both the driving motor and generator torque ratings are not exceeded. In addition, the
PSM C3016-D torque-speed curve behaves differently at maximum torque compared to
continuous torque before base speed. The PSM B3015-B torque-speed curve have a linear
relationship for both continuous and maximum torque before base speed, which allows to calculate
both torque and current accurately.
5.2.2 Motor Inverters (Motor Drives)
The motor and generator inverters support synchronous AC motors and are specifically for power
steering motors. The motor inverters were donated at the same time with the PSM motors by
InMotion US. Below are the main specifications of the advanced power steering (APS) controller.
Note that motor and generator inverters are the same model number.
0
10
20
30
40
50
60
70
0.0
0.5
1.0
1.5
2.0
2.5
3.0
3.5
4.0
4.5
0 2000 4000 6000 8000
Cur
rent
(Arm
s)
Torq
ue (N
-m)
Speed (rpm)Maximum Torque Continuous Torque 100degC RiseMaximum Torque Current Continuous Torque Current 100degC Rise

48
Table 5-2. Detailed motor drive specifications [42] Motor Model
Number Specifications
APS48M
Nominal voltage 48 V Operating voltage range 33 – 63 V Continuous RMS (1 hr.) 30 A
Peak RMS (2 min.) 70 A
CAN Communication CANopen 125, 250, 400, 500, 800 & 1000 kbps
I/O Connector AMP SEAL 35-pin Operating temperature -40°C to + 55°C Storage temperature -40°C to +70°C
The motor and generator inverters are three-phase and are well matched for both the driving motor
and the generator. Overall, the motor system is constraint by the driving motor. The driving motor
nominal voltage is 48 VDC and maximum rated current is 30 A per Figure 5-3. Therefore, the
maximum allowable motor power is 1.44 kW. As previously explained in section 4.2, the LV ESS
design is largely driven to match the motor systems DC current and voltage requirements. The LV
ESS nominal voltage is 52 VDC and maximum rated current is 30 A because of the BMS, refer to
section 4.2.3. Thus the maximum allowable battery power is 1.56 kW.
Both inverters require a 35-AMP SEAL connector to power and control the motors. In addition,
there are five power terminal connections to the motor inverters. Table 5-3 provides a description
of the terminal connections.
Table 5-3: Motor inverter power terminal connections Terminal Description
B+ Battery positive termination (external battery fuse is required) B- Battery negative termination
U, V, W Motor U, V, W -phase termination (3-phase)
Due to recommendation from InMotion, a heat sink is added to the component list for thermal
dissipation. The heat sink must have at least one and a half times the surface area of the motor
controller. The heat sink can be either flat or extruded aluminum surface. The surface area of the
motor controller is approximately 26 in2. Therefore, the chosen extruded aluminum heat sink is a
5.886 in. x 7 in. from HeatsinkUSA. Specific holes are drilled in the heat sink to match the
mounting locations of the motor inverters.
5.2.3 Contactor and Pre-Charge Logic
To reduce the inrush current from charging the inverter capacitors, the motor inverter has a pre-
charge system built-in. A main contactor is added to connect the DC bus to the motor inverter to

49
drive the motors. The motor inverter has two power inputs, the B+ terminal and pin 3 (key switch)
of the I/O inverter connector. The main goal of the contactor is to control the battery voltage to B+
by using the internal pre-charge circuit. To use the internal pre-charge, 52 V nominal is supplied
to the key switch pin and the DC negative lead to B-. When the key is turned, power is supplied to
the key switch of the motor inverters. The capacitors of both motor drives are charged. According
to the APS3 manual, 10 seconds should be allotted to charge the capacitors. Once the capacitors
are charged, the motor inverter signals the contactor to close. The contactor is controlled by the
inverter using an open drain output to power the coil contactor. Specifications can be seen in the
motor dynamometer schematics in Low Voltage Motor Dynamometer System Schematic.
The chosen contactor is a KILOVAC LEV100 Series 900 due to the high voltage rating and the
reduced power consumption. The coil operating voltage is 12 V. The pickup voltage is 8 V with a
dropout voltage of 1.2 V. The coil resistance is 26 Ω. The open drain output is set to 4 V to reduce
the power consumption of the contactor to approximately 0.6 W. To control the contactor, the
driving motor inverter is flashed with specific software to control the open drain output signals.
5.2.4 Dynamometer Coupler
Normally, a motor dynamometer has a torque sensor and couplings to fully couple the motor and
the generator. Torque sensors prices average above $3000 in the market. Although torque sensors
provide an accurate torque and speed reading, the prices are beyond the scope of this project. To
accommodate these shortcomings, the DC supply for the motor and generator inverters are
recorded to determine the efficiency of the overall dynamometer system.
To couple the generator and motor, a short section of Parker 7638 air conditioning hose is used.
The Parker 7638 hose is high pressure and kink resistant. The hose inside diameter is smaller than
the motor splines to provide enough pressure to follow the speed or torque command from the
motors. The hose was tested prior the full design implementation and the generator was able to
rotate the motor spline of the driving motor. Although this coupler is not an engineering solution,
is a possible solution to complete the dynamometer setup. By using a high quality hose, it allows
some deflection and provides some freedom for motor misalignment. The hose is 68 mm in length
to reduce undesired vibration in the coupling system. Figure 5-5 and Figure 5-6 present a close-up
picture of the dynamometer coupler and the motor spline.
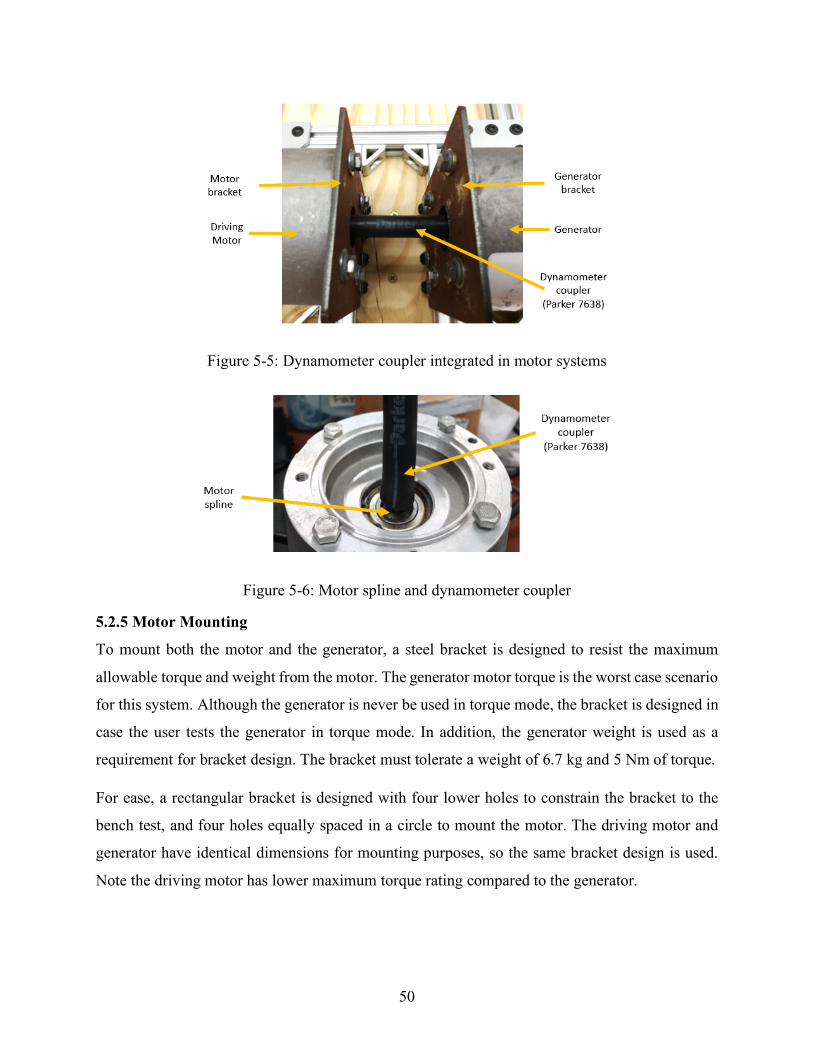
50
Figure 5-5: Dynamometer coupler integrated in motor systems
Figure 5-6: Motor spline and dynamometer coupler
5.2.5 Motor Mounting
To mount both the motor and the generator, a steel bracket is designed to resist the maximum
allowable torque and weight from the motor. The generator motor torque is the worst case scenario
for this system. Although the generator is never be used in torque mode, the bracket is designed in
case the user tests the generator in torque mode. In addition, the generator weight is used as a
requirement for bracket design. The bracket must tolerate a weight of 6.7 kg and 5 Nm of torque.
For ease, a rectangular bracket is designed with four lower holes to constrain the bracket to the
bench test, and four holes equally spaced in a circle to mount the motor. The driving motor and
generator have identical dimensions for mounting purposes, so the same bracket design is used.
Note the driving motor has lower maximum torque rating compared to the generator.

51
Figure 5-7: Stress analysis results for motor bracket at 5 Nm of torque.
Fixed constraints are used on the four lower holes. There are two load types: force and torque. The
force corresponds to the weight of the motor and the torque is the maximum torque allowed using
the InMotion data. 1010 Hot rolled steel has a yield strength of approximately 186 MPa and the
results do not even reach 1 MPa of stress concentrations. This indicates the bracket is
overdesigned. Most important is for students to understand loading and force reaction when
designing a part.
5.3 Overall and Detailed Design of Motor Dynamometer System
The overall and finalized design is presented in Figure 5-8. There are specific components added
in the final design for safety such as fuses, motor mounting base and a custom dynamometer torque
coupling cover.

52
Figure 5-8: Final design product of motor dynamometer
A 72 VDC and 16 A rocker switch is selected to act as a key-on switch. The dynamometer torque
coupler cover is a thin steel sheet cut and bent to fit the dimension of the dynamometer setup.
Fuses are placed to protect the motor and generator inverter from an undesired current surge. Fuses
are rated for 300 VDC and 30 A, slow blow. Two fuses are installed between the battery positive
terminal and B+ terminals on each motor inverter. The fuses protect the motor controller and power
distribution circuit in the event of a short circuit fault. During operation, the motor inverter depletes
the LV ESS, so power flows into the motor inverter. Also, the generator inverter charges the LV
ESS, so power flows out of the generator inverter. Section 5.5 explains in detail the power flow of
the motor dynamometer.
5.4 Data Acquisition System
HEVT uses a main power analyzer as an instrumentation tool to test and record data for LV
systems. This power analyzer is used as data acquisition for the motor dynamometer to teach
students HEVT tools and software programs during the onboarding process.

53
The main tool used for data acquisition is the software Vector CANoe. The software is able to
communicate with devices through CAN to read and send CAN messages. As a bidirectional
communication software, CAN signals are monitored and recorded for further data analysis after
testing. CAN signals recorded are presented in Table 5-4. The main controlled signals are denoted
by the transmit designation (Tx) or receive designation (Rx), and operation details are explained
in section 5.6 Motor Dynamometer Experimental Setup.
Table 5-4. CAN signals recorded from motor and generator Application Tx/Rx CAN Signal Unit Description
Motor
Tx Network Management (NMT) N/A Enable CAN Rx communication
Tx Open Drain Output 1 N/A Digital signal to close contactor to power up inverters Tx Enable Power Stage N/A Digital signal to enable the torque/current command Tx AC Current Command Arms Commanded RMS motor current Tx Torque Command Nm Commanded motor torque Rx RMS Motor Current Arms Actual RMS motor current Rx Actual Torque Nm Actual motor torque (estimated from inverter) Rx DC Bus Current Adc Filtered DC bus current of motor inverter Rx Filtered DC Voltage Vdc Filtered DC bus voltage of motor inverter Rx Actual Speed rpm Actual shaft speed Rx Motor Temperature C Temperature of motor Rx Heatsink Temperature C Temperature of motor inverter
Generator
Tx Network Management (NMT) N/A Enable CAN Rx communication
Tx Enable Power Stage N/A Digital signal to enable the speed command Tx Speed Command rpm Commanded shaft speed of generator Rx RMS Motor Current Arms Actual RMS generator current Rx DC Bus Current Adc Filtered DC bus current of generator inverter Rx Filtered DC Voltage Vdc Filtered DC bus voltage of generator inverter Rx Actual Speed rpm Actual shaft speed Rx Motor Temperature C Temperature of generator Rx Heatsink Temperature C Temperature of generator inverter
The motor is operated in current mode instead of torque mode. The estimated torque from the
motor inverter is very inaccurate, so RMS current is used instead to estimate torque. Figure 5-3,
shows the torque/current-speed curve of the driving motor. Since the motor dynamometer is
operated below 3000 rpm, the torque to RMS current relationship is linear. Thus, the torque to
current relationship in the driving motor (B3015-B) is 0.10448S)T
.
The power analyzer is used to measure the DC bus voltage and current out of the power supply
(LV ESS). Since estimated torque from the motor inverter is very inaccurate, the DC power in and
out of a device is monitored to determine the efficiency of the system. More information about the
operation procedure can be found in section 5.6 Motor Dynamometer Experimental Setup.

54
5.4.1 Computer Software Required
Several software programs are used to process data. These programs are used in industry and the
goal is for incoming students to become experienced with these programs before students join
HEVT for senior design. The only software that is InMotion proprietary is DriveTool. This is a
custom software to monitor and program the motor inverters.
Table 5-5. Required software and purpose Software Purpose
CAD NX 10.0 Mechanical design of structure, wire routing, clearance between components.
MS Visio Schematic design of components. Document all wire size and fuse size selected for the LV ESS.
MatLab Math software analysis tool for data processing. MS Excel Math software analysis tool for data processing.
DriveTool Inverter software creation. Introduce safety precautions such as voltage limits.
Vector CANoe Software for motor control and data acquisition software.
5.5 Power Loss Model
To analyze the dynamometer system behavior, a power loss model is generated to determine the
efficiency of the overall motor dynamometer system. Overall, the LV ESS powers up the whole
system. Then the driving motor depletes the LV ESS by commanding AC current or torque
clockwise (motor clockwise direction is out of the driving motor shaft). The generator commands
negative speed because the 3-phase connection for both the driving motor and generator is the
same. Thus, the driving motor rotational speed is clockwise into the driven motor shaft. The
generator operates in the fourth quadrant and converts mechanical rotational power into electrical
power to the DC bus. The dynamometer system experiences losses due to inverter losses, motor
windings, shaft coupler, wire resistance and contactor. Figure 5-9 presents a diagram to generate
the power loss model equations.
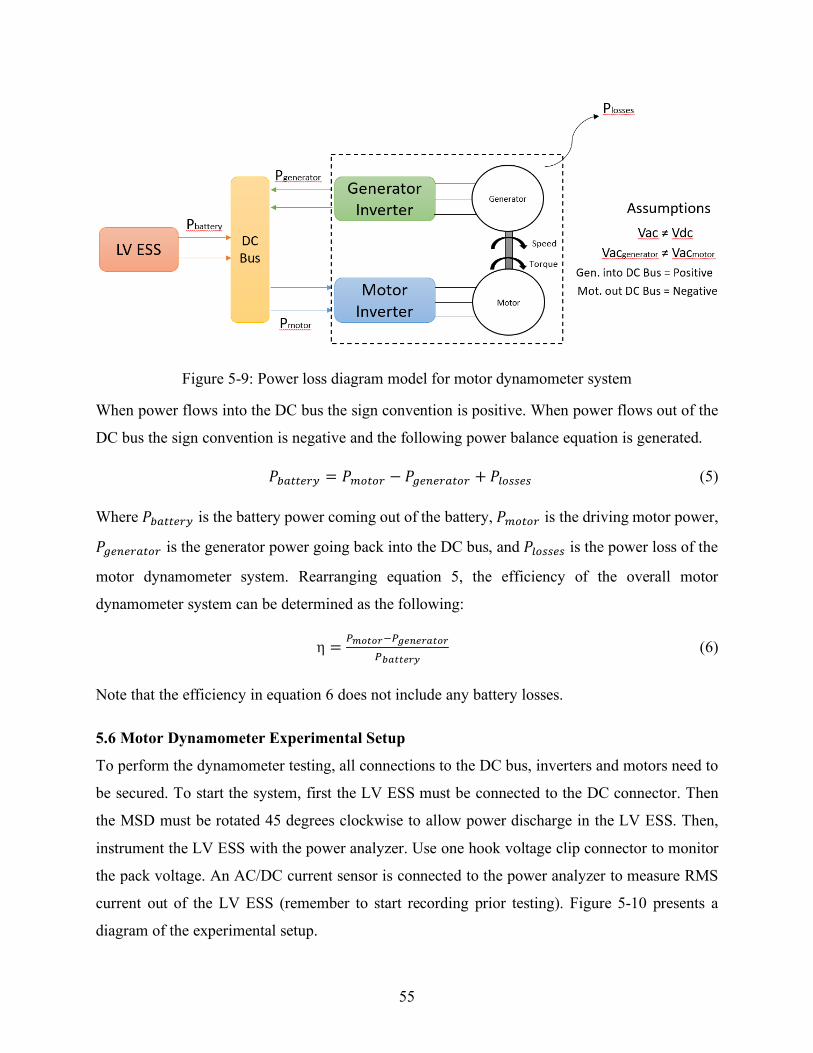
55
Figure 5-9: Power loss diagram model for motor dynamometer system
When power flows into the DC bus the sign convention is positive. When power flows out of the
DC bus the sign convention is negative and the following power balance equation is generated.
𝑃*(..%$U = 𝑃)E.E$ − 𝑃V%-%$(.E$ + 𝑃:EWW%W (5)
Where 𝑃*(..%$U is the battery power coming out of the battery, 𝑃)E.E$ is the driving motor power,
𝑃V%-%$(.E$ is the generator power going back into the DC bus, and 𝑃:EWW%W is the power loss of the
motor dynamometer system. Rearranging equation 5, the efficiency of the overall motor
dynamometer system can be determined as the following:
η = YZJ3J[2Y\]^][43J[Y_433][`
(6)
Note that the efficiency in equation 6 does not include any battery losses.
5.6 Motor Dynamometer Experimental Setup
To perform the dynamometer testing, all connections to the DC bus, inverters and motors need to
be secured. To start the system, first the LV ESS must be connected to the DC connector. Then
the MSD must be rotated 45 degrees clockwise to allow power discharge in the LV ESS. Then,
instrument the LV ESS with the power analyzer. Use one hook voltage clip connector to monitor
the pack voltage. An AC/DC current sensor is connected to the power analyzer to measure RMS
current out of the LV ESS (remember to start recording prior testing). Figure 5-10 presents a
diagram of the experimental setup.

56
Figure 5-10: Data acquisition diagram for motor dynamometer system
The user must connect the CANcaseXL 1 and CANcaseXL 2 to the computer and load the
configuration developed in Vector CANoe. Vector CANoe can be used to control both the driving
motor and the generator inverters and monitor the CAN signals for data processing. In the Vector
CANoe setup, 100 s/S (samples per second) are transmitted and recorded. The main control signals
from Table 5-4 are used to power the motor and generator. The specific steps are as follows:
1. Vector CANoe software is open with the loaded configuration.
2. Turn the key-on switch to power up the internals of the motor and generator inverters.
3. Run program (configuration) to enable CAN communication between the control interface
and the inverters.
4. Command a value of 1 for the NMT signal for the motor and generator inverters.
5. Allow 10 seconds for the inverter internal capacitors to be charged.
6. Command a value of 1 to the open drain signal to close contactor. Note the driving motor
inverter has that specific signal, not the generator inverter.
7. Ensure the driving motor is in AC current mode and the generator is in speed mode. The
driving motor is in AC current mode because the torque estimator on the motor inverter is
inaccurate.

57
8. Enable power stage for the generator.
9. Command negative speed (i.e. 500 Rpm) from the generator to load the driving motor.
Note a negative sign is used to ensure the driving motor stays in quadrant one and the
generator stays in quadrant four.
10. Enable power stage for the driving motor.
11. Command an AC current from the driving motor. Start low (i.e. 1 Arms) and increase the
value by one.
There are specific steps to follow when powering down safely the motor dynamometer. Mainly,
the generator must always be commanding and rotating the shaft to prevent the driving motor from
speeding up. The steps are as follows:
1. Command zero AC current from the driving motor. If AC current value is above 5 Arms,
ramp down the AC current manually.
2. Turn off enable power stage for the driving motor.
3. Ramp down manually the generator speed to zero.
4. Turn off enable power stage for the generator.
5. Command a value of 0 to the open drain signal to open contactor. Note the driving motor
inverter has that specific signal, not the generator inverter.
6. Stop the program to stop CAN communication between the control interface and the
inverters.
7. Turn the key-on switch off.
8. Ensure no current is flowing in or out of the LV ESS and rotate MSD 45 degrees
counterclockwise.
9. Finally, disconnect the DC connector between the LV ESS and motor dynamometer
system.
5.6.1 Safety precautions
During the creation and implementation of the motor dynamometer system, safety considerations
go into the custom software of motor and generator inverters. The main signal limitations are
explained in the Table 5-6.
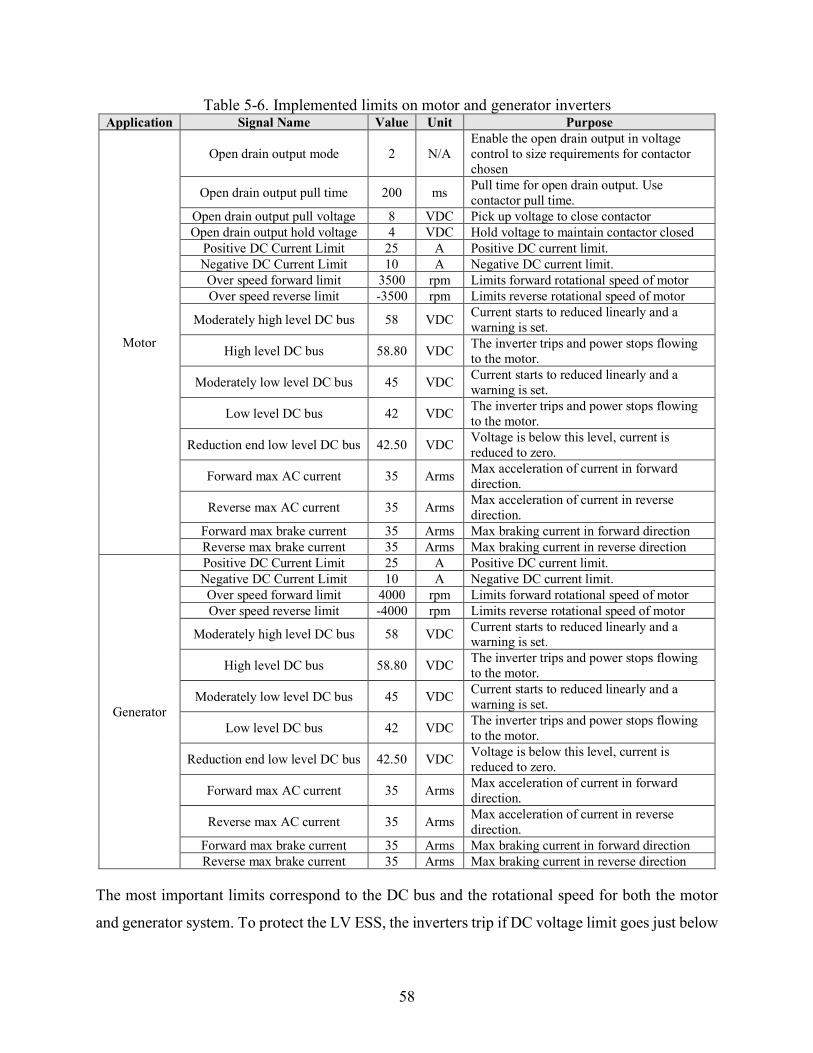
58
Table 5-6. Implemented limits on motor and generator inverters Application Signal Name Value Unit Purpose
Motor
Open drain output mode 2 N/A Enable the open drain output in voltage control to size requirements for contactor chosen
Open drain output pull time 200 ms Pull time for open drain output. Use contactor pull time.
Open drain output pull voltage 8 VDC Pick up voltage to close contactor Open drain output hold voltage 4 VDC Hold voltage to maintain contactor closed
Positive DC Current Limit 25 A Positive DC current limit. Negative DC Current Limit 10 A Negative DC current limit. Over speed forward limit 3500 rpm Limits forward rotational speed of motor Over speed reverse limit -3500 rpm Limits reverse rotational speed of motor
Moderately high level DC bus 58 VDC Current starts to reduced linearly and a warning is set.
High level DC bus 58.80 VDC The inverter trips and power stops flowing to the motor.
Moderately low level DC bus 45 VDC Current starts to reduced linearly and a warning is set.
Low level DC bus 42 VDC The inverter trips and power stops flowing to the motor.
Reduction end low level DC bus 42.50 VDC Voltage is below this level, current is reduced to zero.
Forward max AC current 35 Arms Max acceleration of current in forward direction.
Reverse max AC current 35 Arms Max acceleration of current in reverse direction.
Forward max brake current 35 Arms Max braking current in forward direction Reverse max brake current 35 Arms Max braking current in reverse direction
Generator
Positive DC Current Limit 25 A Positive DC current limit. Negative DC Current Limit 10 A Negative DC current limit. Over speed forward limit 4000 rpm Limits forward rotational speed of motor Over speed reverse limit -4000 rpm Limits reverse rotational speed of motor
Moderately high level DC bus 58 VDC Current starts to reduced linearly and a warning is set.
High level DC bus 58.80 VDC The inverter trips and power stops flowing to the motor.
Moderately low level DC bus 45 VDC Current starts to reduced linearly and a warning is set.
Low level DC bus 42 VDC The inverter trips and power stops flowing to the motor.
Reduction end low level DC bus 42.50 VDC Voltage is below this level, current is reduced to zero.
Forward max AC current 35 Arms Max acceleration of current in forward direction.
Reverse max AC current 35 Arms Max acceleration of current in reverse direction.
Forward max brake current 35 Arms Max braking current in forward direction Reverse max brake current 35 Arms Max braking current in reverse direction
The most important limits correspond to the DC bus and the rotational speed for both the motor
and generator system. To protect the LV ESS, the inverters trip if DC voltage limit goes just below

59
the peak voltage. The same occurs to the lower voltage limit at 42 VDC. This limit is chosen to
not let lithium ion cells drop below 3 V per cell. As seen in the literature review section, the voltage
of a lithium ion cell decreases exponentially once the cell is close to lower voltage limit. The
driving motor rotational limit is lower compared to the generator. This is a chosen limit to not let
the driving motor to over speed given it is set in current/torque mode. Note the driving motor can
also be tested in regenerative mode. The motor current command must be negative to produce a
counterclockwise torque and operate the driving motor in the second quadrant. Thus, the generator
operates in the third quadrant.
6 Chapter – Results and Analysis This chapter provides the results and discussion of both hands-on projects: the LV ESS and the
motor system dynamometer. First the LV ESS results are discussed, where testing for both charge
and discharge is performed. Second, results regarding the motor system dynamometer are
presented. All results are generated using both MS Excel and MATLAB software.
6.1 Results and Discussion of LV ESS
As previously explained in the experimental setup, the LV ESS is loaded with high power resistors
to discharge the pack at approximately 1C (i.e. 5 A). The battery terminal voltage and the current
during discharge are presented next.
Figure 6-1: Battery terminal voltage and discharge current over time
0
1
2
3
4
5
6
4042444648505254565860
0 500 1000 1500 2000 2500 3000
Curr
ent (
A)
Volta
ge (V
)
Time (s)Pack Voltage Current
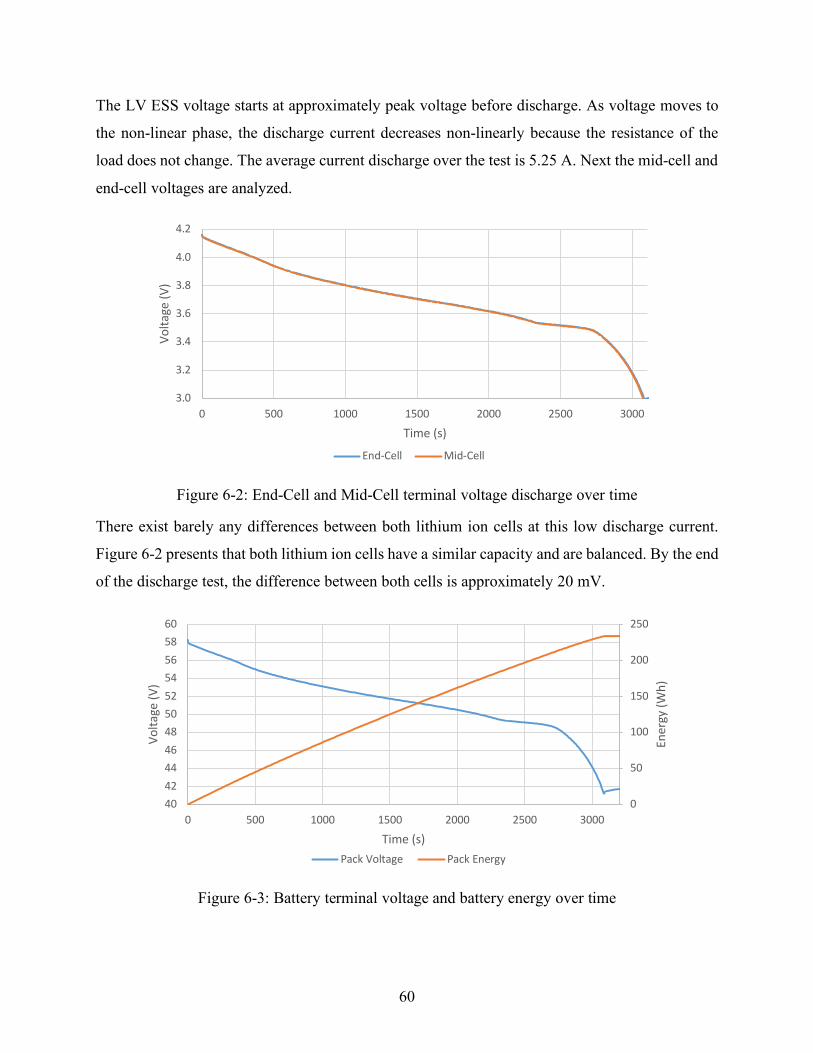
60
The LV ESS voltage starts at approximately peak voltage before discharge. As voltage moves to
the non-linear phase, the discharge current decreases non-linearly because the resistance of the
load does not change. The average current discharge over the test is 5.25 A. Next the mid-cell and
end-cell voltages are analyzed.
Figure 6-2: End-Cell and Mid-Cell terminal voltage discharge over time
There exist barely any differences between both lithium ion cells at this low discharge current.
Figure 6-2 presents that both lithium ion cells have a similar capacity and are balanced. By the end
of the discharge test, the difference between both cells is approximately 20 mV.
Figure 6-3: Battery terminal voltage and battery energy over time
3.0
3.2
3.4
3.6
3.8
4.0
4.2
0 500 1000 1500 2000 2500 3000
Volta
ge (V
)
Time (s)
End-Cell Mid-Cell
0
50
100
150
200
250
4042444648505254565860
0 500 1000 1500 2000 2500 3000
Ener
gy (W
h)
Volta
ge (V
)
Time (s)Pack Voltage Pack Energy

61
During the discharge test, approximately 234 Wh of energy is depleted out of the battery. Using
the nominal voltage of the battery pack, the battery capacity can be determined to be 4.5 Ah. The
lithium ion cells are expected to have reduced capacity given these cells were cycle tested.
Figure 6-4: Battery terminal voltage over discharged capacity
Figure 6-4 reaffirms the calculated results from battery capacity. The temperature behavior of the
mid cell is discussed next.
Figure 6-5: Battery terminal voltage and mid-cell temperature
The temperature of the mid-cell increases as the LV ESS is depleted. Note that the battery enters
the relaxation phase when discharge current is zero just after 3000 seconds. During the relaxation
40424446
485052
54565860
0 1 2 3 4 5
Volta
ge (V
)
Capacity Discharged (Ah)
22.5
23.0
23.5
24.0
24.5
25.0
25.5
4042444648505254565860
0 500 1000 1500 2000 2500 3000 3500
Tem
pera
ture
(C)
Volta
ge (V
)
Time (s)
Pack Voltage Mid-Cell Temperature
Relaxation Phase

62
phase, the mid-cell temperature stays constant. For a lumped thermal mass, it takes time to cool
down. Next, the simplified battery model is used to calculate the internal resistance of the LV ESS.
Table 6-1: LV ESS internal resistance calculations Voc (V) VLoad (V) ∆V (V) ∆I (A) Rint (mΩ) Rint/cell (mΩ) 58.34 58.02 0.31 5.88 53.24 3.80 56.71 56.41 0.30 5.72 53.17 3.80 54.80 54.51 0.29 5.52 52.88 3.78 53.60 53.31 0.28 5.40 52.82 3.77 52.61 52.33 0.28 5.29 53.66 3.83 51.76 51.48 0.28 5.20 53.61 3.83 50.62 50.35 0.27 5.09 53.49 3.82 49.49 49.23 0.27 4.97 53.55 3.83 46.56 46.31 0.25 4.66 54.07 3.86
A separated test is carried out to record the open circuit voltage and the voltage load of the LV
ESS, refer to section 4.6. The time difference between Voc and VLoad is 100 ms. The average
calculated pack internal resistance is 53.4 mΩ, meaning each cell approximately has an internal
resistance of 3.8 mΩ. Compared to the ANL battery testing, the averaged cell internal resistance
is approximately 3.3 mΩ [48].
Figure 6-6: Calculated internal resistance over capacity discharged
Overall, the internal resistance seems to increase as the capacity is discharged. Study from Yang
et al., shows that there is a relationship of OCV and internal resistance [28]. The internal resistance
is high when the battery is fully charged or completely discharged. In this case, as the battery fully
52.6
52.8
53.0
53.2
53.4
53.6
53.8
54.0
54.2
0.0 0.5 1.0 1.5 2.0 2.5 3.0 3.5 4.0 4.5
Resis
tanc
e (m
Ω)
Capacity Discharged (Ah)

63
depletes, internal resistance increases to limit the current draw out of the battery. During the battery
internal resistance test, the temperature of the mid-cell increased by 4°C.
As expected from the CC-CV charger, the charge current stays constant until the battery voltage
reaches approximately 58 V. At that moment, current starts to decrease due to the CV phase of the
charger. The averaged charge current over the charge test is 2.5 A (0.5C-rate).
Figure 6-7: Battery terminal voltage and charge current over time
Figure 6-8: Battery terminal voltage and battery energy during charging
0.0
0.5
1.0
1.5
2.0
2.5
42444648505254565860
0 1000 2000 3000 4000 5000 6000
Curr
ent (
A)
Volta
ge (V
)
Time (s)
Pack Voltage Current
0
50
100
150
200
250
42
44
46
48
50
52
54
56
58
60
0 1000 2000 3000 4000 5000 6000
Ener
gy (W
h)
Volta
ge (V
)
Time (s)
Pack Voltage Pack Energy

64
Approximately 227 Wh of energy is stored into the battery. Using the nominal voltage of the
battery pack, the battery capacity can be determined to be 4.4 Ah.
Figure 6-9: Battery terminal voltage over charged capacity
As seen in Figure 6-9, the capacity charged into the LV ESS is determined to be 4.4 Ah. This
method also reaffirms the calculated battery capacity from the energy calculation in Figure 6-8.
Next, the mid-cell temperature behavior is discussed during charging.
Figure 6-10: Battery terminal voltage and Mid-Cell temperature during charging
Prior charging the LV ESS, the pack was depleted and loaded with the power resistors. This
allowed the pack to be heated prior to the charge test and the temperature started approximately at
42
44
46
48
50
52
54
56
58
0 1 2 3 4 5
Volta
ge (V
)
Capacity Charged (Ah)
20.0
20.5
21.0
21.5
22.0
22.5
42444648505254565860
0 1000 2000 3000 4000 5000 6000
Tem
pera
ture
(C)
Volta
ge (V
)
Time (s)
Pack Voltage Mid-Cell Temperature

65
21°C. Due to 0.5C charge rate, the lithium ion cells are not highly loaded and this allowed for the
pack to stay cool for 30 minutes. The heating due to losses occurs in the core of the battery cell,
and there is some time delay for the temperature response to reach the sensor on the surface. During
both the charge and discharge test, the mid-cell temperature increased an average of 2.5°C.
6.2 Results and Discussion of Motor System Dynamometer
The motor dynamometer is tested by loading the system with the generator in speed mode and
commanding AC current from the driving motor to generate torque. Both motors are tested below
3000 rpm to back calculate the torque command using the torque-speed curves from InMotion.
The continuous torque case for the driving motor is used to create a torque to current ratio. The
calculated torque to current ratio is 0.10448S)T
.
To measure the dynamometer efficiency, the generator loads the system every 250 rpm and the
driving motor commands AC current from 1-5 A. Higher command currents affect the torque
coupler design, therefore current results only discuss up to 5 A. To better visualize the plots, the
loading case of 2000 rpm is chosen. Below are the plots of the LV ESS, driving motor system, and
generator system.
Figure 6-11: (a) DC bus current from the battery, (b) battery power, (c) battery energy

66
Figure 6-12: (a) DC bus current into the motor, (b) motor power consumed, (c) motor energy
from driving motor
Figure 6-13: (a) DC bus current from generator, (b) generator power absorbed, (c) generator
energy from generator

67
As previously explained in the experimental setup, the driving motor operates in the first quadrant
to simulate a traction motor in a hybrid vehicle. The generator loads the system and operates in the
fourth quadrant to generate electricity back into the DC bus. Note in Figure 6-12(b) the driving
motor power is positive, while in Figure 6-13(b) the generator power is negative. The efficiency
of the motor dynamometer is then determined.
Table 6-2: Motor dynamometer system efficiency
Expected Torque (Nm)
AC Current (Arms)
0.52 5 52.3% 52.1% 56.1% 50.1% 47.9% 50.5% 47.7% 0.42 4 48.0% 50.3% 47.0% 47.0% 51.7% 46.2% 47.6% 0.31 3 39.3% 44.4% 44.8% 46.2% 47.1% 44.4% 43.2% 0.21 2 32.3% 39.3% 33.2% 36.7% 24.4% 40.4% 43.6% 0.10 1 48.2% 23.6% 25.7% 28.7% 40.9% 39.2% 42.4%
500 750 1000 1250 1500 1750 2000
Speed (rpm)
Measurements at 1 Arms are very inefficient. At 500 rpm and 1500 rpm with 1 Arms, the efficiency
provides false readings. The efficiency is higher than at 2 Arms. A possibility is the inaccuracy of
the inverter readings at low power. In addition, the motor dynamometer system operates at an
efficiency of approximately 50% at 5 Arms. The continuous current for the driving motor is 15
Arms. The dynamometer testing results are well below continuous current so it is expected for
both motors to be somewhat inefficient. Losses are present due to contactor power draw and the
voltage drop across wires, but mainly in the motor windings, inverters, and the coupler connection.
The generator and the driving motors are different types, and the mechanical internals are
unknown. Furthermore, the coupler connection is not a desired solution to the dynamometer
system because the coupler connection can become undone with the motor and generator spline.
This is a more likely scenario given the coupler connection is under cyclical loads. To test the
safety limitations configured in the driving motor inverter, AC current is commanded on step until
the inverter power trips due to the firmware limit set in Table 5-6.

68
Figure 6-14: (a) AC current command from driving motor, and (b) motor speed comparison
between driving motor and generator
Figure 6-14 (a) shows the AC current command. At approximately 130 seconds, the motor inverter
tripped when the motor speed spiked (red circle). The speed spiked occurs because the coupler
connection became undone and the driving motor speed up. Due to the rotation speed limitation
implemented of 3500 rpm, the motor inverter trips. The driving motor stops to provide torque even
though motor current command is not zero. The green boxes indicate when the driving motor is
not providing torque. Finally, after the motor inverter trips, the generator still rotates the shaft until
it is commanded otherwise.
7 Chapter – Summary and Recommendations In summary, the onboarding process of HEVT requires new hands-on supplemental projects to
improve the students’ experience and improve knowledge transfer. The main goal is to implement
two projects that complement each other to teach students the electric side of a hybrid vehicle. The
hands-on projects incorporate a build activity that is missing from current HEVT projects. During
the vehicle development process, teams fall behind because of ESS design, construction and
commissioning. Likewise, controlling motor systems has been a difficult step that leaves teams
69
behind schedule. The hands-on projects correspond to the design and testing of an LV ESS and
LV motor system dynamometer. Students are required to use the LV ESS to power up an LV
motor. The LV motor is mechanically coupled to another LV motor, acting as a generator. The
generator is connected to the LV ESS to limit depletion and form a simple motor dynamometer. A
simple battery model is used to determine the internal resistance of the LV ESS. This resistance is
found to be 53.4 mΩ for the 14 cell pack. Also, the averaged discharge capacity is 4.5 Ah and the
averaged charge capacity is 4.4 Ah. The motor dynamometer testing shows that the motor
dynamometer system operates at higher efficiency when rotational speed and RMS current is
increased. The efficiency of the motor dynamometer system at 5 Arms is approximately 50%.
Overall, both projects are demanding to build in one semester and will put incoming students
outside their comfort zone. Team members exploring comfort levels will also be a healthy
precursor when competing in AVTCs. Most importantly, both projects are built using low cost
tools and reliable devices to ensure student laboratories can afford them. Finally, the hands-on
projects are repeatable, therefore students have to design, build, test, and document all required
work.
As for recommendations, two main components should be changed to improve the overall design
of both the LV ESS and the motor dynamometer system: the BMS and motor coupling. Although
the current BMS is reliable and monitors cell voltage, a CAN controlled BMS will provide
additional capabilities to control the LV ESS. CAN controlled battery management systems have
the capability of thermal management systems, which can simplify external wiring. A second
recommendation is to fuse all BMS balancing wires for safety to reduce the chance of a short.
Finally, the mechanical coupler needs to be improved to provide a more secure and robust coupling
between the motor and generator. By improving the coupling, motor dynamometer testing could
be performed at higher power demand. A separate project to create a custom spline coupler would
be useful to be presented as an external project in the onboarding process to compliment the motor
dynamometer system project.

70
8 References
[1] "Low Voltage Battery Cable," SAE International, Standard J1127_201512, 2015.
[2] W. Dvorkin, D. Nelson and C. Fiori, "Strategies to Improve Performance at a High-
Turnover Engineering Organization," in ProjMAN International Conference of Project
Management, Lisbon, 2015.
[3] E. Larson and C. Gray, in Project Management: The Managerial Process 5th Edition,
McGraw-Hill/Irwin, 2010, pp. 7-8.
[4] C. Williams, "Concept Generation," Design, Research, and Education for Additive
Manufacturing Systems (DREAMS), Virginia Tech, Blacksburg, 2015.
[5] K. T. Ulrich and S. D. Eppinger, "Concept Development & Selection Funnel," in Product
Design and Development, Irwin McGraw-Hill, 2004, p. Chapter 7.
[6] R. Power and K. Cormican, "Towards Effective Knowledge Transfer in High-tech Project
Environments: Preliminary Development of Key Determinants," Procedia Computer
Science, vol. 64, pp. 17-23, 2015.
[7] S. Y. Choi, Y. S. Kang and H. Lee, "The effects of socio-technical enablers on knowledge
sharing: An exploratory examination," Journal of Information Science, vol. 34, no. 5, pp.
742-754, 2008.
[8] K. Krot and D. Lewicka, "THE IMPORTANCE OF TRUST IN MANAGER-EMPLOYEE
RELATIONSHIPS," International Journal of Electronic Business Management, vol. 10,
no. 3, pp. 224-233, 2012.
[9] A. I. Al-Alawi, N. Y. Al-Marzooqi and Y. F. Mohammed, "Organizational culture and
knowledge sharing: critical success factors," Journal of Knowledge Management, vol. 11,
no. 2, pp. 22-42, 2007.

71
[10] S. Newell, "Knowledge integration processes and dynamics within the context of cross-
functional projects," Management of Knowledge in Project Environments, pp. 19-39, 2005.
[11] J. Mueller, "Knowledge sharing between project teams and its cultural antecedents,"
Journal of Knowledge Management, vol. 16, no. 3, pp. 435-447, 2012.
[12] H.-F. Lin, "Effects of extrinsic and intrinsic motivation on employee knowledge sharing
intentions," Journal of Information Science, vol. 33, no. 2, pp. 135-149, 2007.
[13] J. Kang, M. Rhee and K. H. Kang, "Revisiting knowledge transfer: Effects of knowledge
characteristics on organizational effort for knowledge transfer," Expert Systems with
Applications, vol. 37, no. 12, pp. 8155-8160, 2010.
[14] M. D. Lord and A. L. Ranft, "Flows Of Local Market Knowledge Within The Firm: An
Expanded View Of Entry Into New International Markets.," Academy of Management
Proceedings, vol. 1999, no. 1, 1999.
[15] K. M. Eisenhardt and F. M. Santos, "Knowledge-based view: A new theory of strategy," in
Handbook of strategy and management, London, SAGE Publications, 2002, p. 139–164.
[16] A. Lam, "Tacit Knowledge, Organizational Learning and Societal Institutions: An
Integrated Framework," Organization Studies, vol. 21, no. 3, pp. 487-513, 2000.
[17] M. T. Hansen, "The Search-Transfer Problem: The Role of Weak Ties in Sharing
Knowledge across Organization Subunits," Administrative Science Quarterly, vol. 44, no.
1, p. 82, 1999.
[18] J. A. Flores, O. H. Salcedo, R. Pineda and P. Nava, "Senior Project Design Success and
Quality: A Systems Engineering Approach," Procedia Computer Science, vol. 8, pp. 452-
460, 2012.
[19] K. Wall, "Engineering: Issues, Challenges and Opportunities for Development," UNESCO
Publishing, 2010.
72
[20] S. Friedenthal, R. Griego and M. Sampson, "Model Based Systems Engineering," in
INCOSE, San Diego, 207.
[21] T. M. Bandhauer, S. Garimella and T. F. Fuller, "A Critical Review of Thermal Issues in
Lithium-Ion Batteries," Journal of The Electrochemical Society, vol. 158, no. 3, 2011.
[22] K. Chen, Heat Generation Measurements of Prismatic Lithium Ion Batteries, Waterloo:
University of Waterloo, 2013.
[23] F. D. Petruzella, Electric motors and control systems, New York, NY: McGraw-Hill
Education, 2016.
[24] G. M. Molen, Automotive 101: High voltage Automotive systems, Mississippi State
University: Applied Automotive Engineering, 2014.
[25] Fluke Corporation, "Ghost voltages – phantom readings can lead to the wrong diagnosis,"
Fluke Digital Library, 2003.
[26] M. Broussely, P. Biensan, F. Bonhomme, P. Blanchard, S. Herreyre, K. Nechev and R.
Staniewicz, "Main aging mechanisms in Li ion batteries," Journal of Power Sources, vol.
146, no. 1-2, pp. 90-96, 2005.
[27] K. Takei, K. Kumai, Y. Kobayashi, H. Miyashiro, N. Terada, T. Iwahori and T. Tanaka,
"Cycle life estimation of lithium secondary battery by extrapolation method and accelerated
aging test," Journal of Power Sources, Vols. 97-98, pp. 697-701, 2001.
[28] Y. Yang, X. Hu, H. Pei and Z. Peng, "Comparison of power-split and parallel hybrid
powertrain architectures with a single electric machine: Dynamic programming approach,"
Applied Energy, vol. 168, pp. 683-690, 2016.
[29] X. Lin, H. Perez, J. Siegel, A. Stefanopoulou, Y. Li, R. Anderson, Y. Ding and M.
Castanier, "Online Parameterization of Lumped Thermal Dynamics in Cylindrical Lithium
Ion Batteries for Core Temperature Estimation and Health Monitoring," IEEE Transactions
on Control Systems Technology, vol. 21, no. 5, pp. 1745-1755, 2013.

73
[30] D. Linden and T. B. Reddy, Handbook of batteries, New York: McGraw-Hill, 2002.
[31] B. . A. Johnson and R. E. White, "Characterization of commercially available lithium-ion
batteries," Journal of Power Sources, vol. 70, no. 1, pp. 48-54, 1998.
[32] M. M. Hoque, M. A. Hannan and A. Mohamed, "Voltage equalization control algorithm
for monitoring and balancing of series connected lithium-ion battery," Journal of
Renewable and Sustainable Energy, vol. 8, no. 2, p. 025703, 2016.
[33] M. Toll, "52V 14s Battery Management System (BMS)," Vruzend, [Online]. Available:
https://vruzend.com/product/52v-14s-battery-management-system-bms/. [Accessed 6 June
2018].
[34] D. Nelson, Electrical Systems Wire sizing and Fusing, Virginia Tech: Applied Automotive
Engineering, 2014.
[35] E. Marquez and D. Nelson, "Development of current squared - Time curves for simplified
wire size selection for electric traction systems in automotive applications," 2015 IEEE
Transportation Electrification Conference and Expo (ITEC), 2015.
[36] T. Hofman and C. Dai, "Energy efficiency analysis and comparison of transmission
technologies for an electric vehicle," IEEE Vehicle Power and Propulsion Conference,
2010.
[37] M. Ehsani, Y. Gao, S. Longo and K. Ebrahimi, Modern Electric, Hybrid Electric, and Fuel
Cell Vehicles, Third Edition, Boca Raton: CRC Press, 2018.
[38] M. S. Kumar and S. T. Revankar, "Development scheme and key technology of an electric
vehicle: An overview," Renewable and Sustainable Energy Reviews, vol. 70, pp. 1266-
1285, 2017.
[39] D. H. Lim and S. C. Kim, "Thermal performance of oil spray cooling system for in-wheel
motor in electric vehicles," Applied Thermal Engineering, vol. 63, no. 2, pp. 577-587, 2014.

74
[40] M. Lutz, DESIGN AND CONSTRUCTION OF ELECTRIC MOTOR DYNAMOMETER
AND GRID ATTACHED STORAGE LABORATORY, Fort Collins: Colorado State
University, 2011.
[41] K. N. Radhakrishnan, Evaluation of the Cycle Profile Effect on the Degradation of
Commercial Lithium Ion Batteries, Blacksburg: Virginia Tech, 2017.
[42] InMotion U.S., The 3rd generation Power Steering Controller, Advanced Power Steering
(APS3), 2016.
[43] Blue Sea Systems, "m-Series Mini On-Off Battery Switch with Knob - Red," Blue Sea
Systems, [Online]. Available: https://www.bluesea.com/products/6006/m-
Series_Mini_On-Off_Battery_Switch_with__Knob_-_Red. [Accessed 13 June 2018].
[44] "Orion Jr. BMS," Orion BMS, [Online]. Available:
https://www.orionbms.com/products/orion-bms-jr/. [Accessed 13 June 2018].
[45] M. Toll, "How To Install A BMS," Vruzend, [Online]. Available:
https://vruzend.com/tech-center/how-to-charge-a-lithium-battery-with-a-bms/. [Accessed
13 June 2018].
[46] M. Toll, "52V Lithium-ion battery charger (3 Amps)," Vruzend, [Online]. Available:
https://vruzend.com/product/52v-lithium-ion-battery-charger-3-amps/. [Accessed 13 June
2018].
[47] C&K, "DF Series Power Rocker Switches," [Online]. Available:
https://www.mouser.com/ProductDetail/CK/DF62J12S2AQA?qs=%2fha2pyFaduiShZM
0qiNWrjts3VJJCUYDWL%252bEjvTnZbbHvaeAACWQtg%3d%3d. [Accessed 13 June
2018].
[48] Idaho National Laboratory, "Battery Pack Laboratory Testing Results 2013 Ford C-Max
SE - VIN 2158," INL/MIS-14-31587, 2016.

75
Appendix A: Wiring Schematics Low Voltage Energy Storage System Schematics

76
Low Voltage Motor Dynamometer System Schematic

77
Appendix B: Pairwise Comparison Chart template
Subteam Normalized
Weight Requirements Design
#1 Design
#2 Weighted
2 Design
#3 Weighted
3 8.00% Reliability
12.00% Serviceability
4.00% Noise/Vibrations
20.00% Safety
4.00% Lightweight
4.00% Aesthetic Appeal
8.00% Manufacturing
8.00% Component test structure
8.00% Cost
12.00% User interface
12.00% Controller interface
Total