ENERGY STAR Dishwasher Webinar: Cleanability Test Procedure Discussion · ENERGY STAR® Dishwasher...
56
U.S. Department of Energy September 19, 2011 ENERGY STAR ® Dishwasher Webinar: Cleanability Test Procedure Discussion
Transcript of ENERGY STAR Dishwasher Webinar: Cleanability Test Procedure Discussion · ENERGY STAR® Dishwasher...

U.S. Department of Energy
September 19, 2011
ENERGY STAR® Dishwasher Webinar:
Cleanability Test Procedure Discussion

Table of Contents
3 Development Testing
2 Cleanability Test Procedures
1 Introduction
Proposed Approach5
4 Results
6 Next Steps
2

3 Development Testing
2 Cleanability Test Procedures
1 Introduction
Proposed Approach5
4 Results
6 Next Steps
3

• Energy and water consumption for DWs are determined using the DOE test procedure at 10 CFR 430, Subpart B, Appendix C
• ENERGY STAR qualification criteria for DWs have been in place since 2001:
ENERGY STAR
Dishwasher (DW) History
Effective Date Compact Standard
January 2001 N/A EF ≥ 0.58
January 2007 EF ≥ 0.88 EF ≥ 0.65
August 2009
(current)
EAEU ≤ 234 kWh/yr
WC ≤ 4.0 gal/cycle
EAEU ≤ 324 kWh/yr
WC ≤ 5.8 gal/cycle
4
Note: EF is Energy Factor; EAEU is Estimated Annual Energy Use; WC is Water Consumption.

Drivers for Specification Revision
• Future qualification criteria:– Tier 2 qualification criteria will include a cleaning
performance requirement
– ENERGY STAR must specify a test method for evaluating cleaning performance
5
Tier 1
Effective January 20, 2012
Tier 2
Effective January 1, 2014
Product Type Energy Water Energy Water Cleaning
Compact 222 kWh/yr 3.5 gal/cycle TBD TBD TBD
Standard 295 kWh/yr 4.25 gal/cycle TBD TBD TBD

ENERGY STAR MOU
EPA and DOE signed a memorandum of understanding (MOU) on
9/30/2009 designed to enhance and strengthen the ENERGY STAR
program
6
EPA DOE
Brand manager for ENERGY STARLeads the development of product
testing procedures and metrics
Will establish the performance
levels for the ENERGY STAR
products programs, with technical
support from DOE
Provides technical support,
especially in the areas of product
testing and verification

ENERGY STAR Roles for
Dishwashers
• U.S. EPA
– Lead revision of dishwasher specification
– EPA Lead: Amanda Stevens, EPA
– Support: D&R and ICF
• U.S. DOE
– Investigate, review, revise, and validate dishwasher
cleaning performance test method
– DOE Lead: Ashley Armstrong, DOE
– Support: Navigant
7

8
3 Development Testing
2 Cleanability Test Procedures
1 Introduction
Proposed Approach5
4 Results
6 Next Steps

Possible Test Methods for
Evaluating Cleanability
• DOE test procedure (10 CFR 430 subpart B appendix C)
– Requires soiled load to measure energy and water use of soil-
sensing DWs
– No provisions for evaluating cleanability
• AHAM DW-1-2009 “Household Electric Dishwashers”
– Scores cleanability by means of a Cleaning Index
– Typically used for U.S. dishwashers
• IEC Standard 60436 Ed. 3.1 “Electric dishwashers for
household use – Methods for measuring the
performance”
– Scores cleanability by means of a Performance Index
– Typically used in Europe and other countries
9

Test Goals
• Determine which test method provides repeatable results with cleaning differentiation at the lowest test burden
• Experiment with test method and scoring combinations and modifications to increase repeatability, increase differentiation, and reduce test burden
• Test results and stakeholder feedback will serve as the basis for a second investigative phase of testing
10

Test Procedure Comparison
DOE AHAM IEC
Test load 8
At least 10; 12
used for this
investigation
Rated capacity; 12
used for this
investigation
Soiling
4 place settings, not
including silverware
and serving pieces;
AHAM soils
All place settings,
all serving dishes
and all silverware
All place settings,
serving dishes, and
some silverware
Reference DW No No Yes
Note: The above comparison is for standard DWs only. Compact DWs were not tested.
11

Test Procedure Comparison
DOE AHAM IEC
Pre-
conditioning
cycles
1
At least 1, with
detergent and
rinse aid
At least 3, with
detergent and no
rinse aid; used
rinse aid for this
investigation
Number of test
cycles
N/A for energy and
water rating; 3 for
this investigation
3 At least 5
Cleaning
between
cycles?
N/A for energy and
water rating;
cleaned filter for this
investigation
Yes No
Note: The above comparison is for standard DWs only. Compact DWs were not tested.
12

Test Procedure Comparison
AHAM (also used for DOE)
• Egg yolk
• Creamed corn
• Oatmeal (with milk)
• Mashed potatoes
• Ground beef/tomato paste
• Raspberry preserves
• Peanut butter (AHAM only)
• Tomato juice
• Coffee/coffee grounds
IEC
• Milk
• Tea
• Raw ground beef with egg
• Egg
• Oat flakes
• Spinach
• Margarine
Soiling materials used in the test procedures:
13

AHAM/DOE Soil Preparation
• Photo(s) of soiled items
14
Dish/Utensil Type Soiling
Dinner plates Quarter sections of egg yolk, mashed potatoes, ground
beef/tomato paste mix, and red raspberry preserves
with coffee grounds
Bread and butter plates,
dessert bowls
Half sections of oatmeal and creamed corn
Coffee cups and saucers Coffee
Glasses Tomato juice
Serving bowls and spoons
(AHAM only)
1 with creamed corn, 1 with mashed potatoes, or half
sections if only 1 bowl used
Knives and serving platter
(AHAM only)
Peanut butter (applied to knives)
Spoons (AHAM only) Half with creamed corn, half with oatmeal
Forks and serving fork
(AHAM only)
Egg yolk
Note: Soils were dried for 2 hours after the application of oatmeal. After 2 hours, the dishes were stacked
and loaded into the DW.

AHAM/DOE Soil Preparation
15
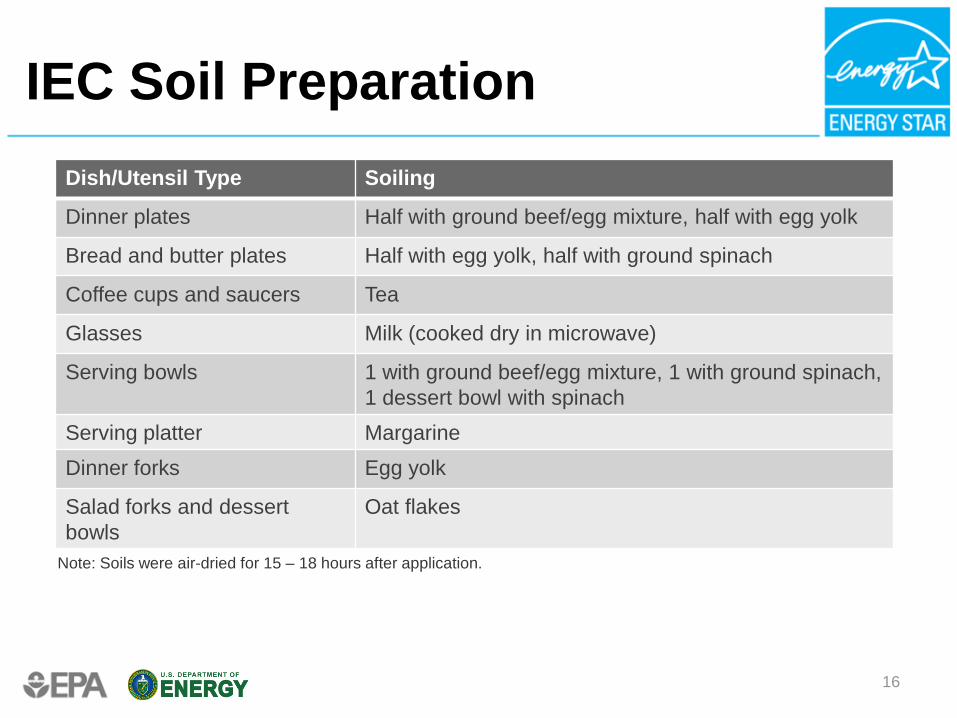
IEC Soil Preparation
Dish/Utensil Type Soiling
Dinner plates Half with ground beef/egg mixture, half with egg yolk
Bread and butter plates Half with egg yolk, half with ground spinach
Coffee cups and saucers Tea
Glasses Milk (cooked dry in microwave)
Serving bowls 1 with ground beef/egg mixture, 1 with ground spinach,
1 dessert bowl with spinach
Serving platter Margarine
Dinner forks Egg yolk
Salad forks and dessert
bowls
Oat flakes
16
Note: Soils were air-dried for 15 – 18 hours after application.

IEC Soil Preparation
17

Scoring and Cleaning Index
• Scoring
– Assigned numerical value to each item in test load
based on observed amount of soil remaining
– Conducted as each item is removed from the unit
under test (UUT)
• Cleaning index or performance index
– Calculated single overall numerical rating for the
cleaning performance of the UUT
– Based on the scoring of individual items, and
compared to a reference unit (if applicable)
18

AHAM Scoring
• Score of 0 (best) to 9 (worst) assigned to each piece of dishware,
flatware, or glassware
• Glassware also scored for water spots or streaks, and rack contact
marks
Particle size Score
≤ 1/8 in (3 mm) Score 1 per particle with a maximum score of 9
> 1/8 in (3 mm) and ≤ 1/4 in (6 mm) Score 3 per particle with a maximum score of 9
> 1/4 in (6 mm) and ≤ 3/8 in (10 mm) Score 7 per particle with a maximum score of 9
> 3/8 in (10 mm) Score 9 per particle with a maximum score of 9
Spots or streaks on glassware< 3/8” score 1, > 3/8” score 3 with a maximum score of 9
Rack contact marks on glasswareLight marks score 1, white marks score 3 with a maximum score of 9
19

IEC Scoring
• Score of 5 (best) to 0 (worst) assigned to each item in the test load
• Lowest score based on number of particles or soiled area is
assigned to each item
Number of soil particles Total soiled area A (mm2) Score
N = 0 A = 0 5
0 < n ≤ 4 0 < A ≤ 4 4
4 < n ≤ 10 4 < A ≤ 20 3
10 < n 20 < A ≤ 50 2
Not applicable 50 < A ≤ 200 1
Not applicable 200 < A 0
20

AHAM and IEC Scoring Tool
Scoring template for AHAM and IEC test methods
21

Hybrid Scoring
• AHAM and IEC scoring methods have limitations
– AHAM scoring tends to penalize items that are generally clean but have
multiple, very small particles
– IEC scoring tends to be lenient for items with a large number of small
particles because scores less than 2 depend only on soiled area
• DOE developed hybrid scoring system as a modification to IEC scoring
22
Number of soil particles Total soiled area A (mm2) Score
N = 0 A = 0 5
0 < n ≤ 3 0 < A ≤ 4 4
3 < n ≤ 6 4 < A ≤ 20 3
6 < n ≤ 9 20 < A ≤ 50 2
9 < n ≤ 12 50 < A ≤ 200 1
12 < n 200 < A 0

AHAM Cleaning Index
• Each unit starts with a cleaning index of 100
• Points are subtracted for each item in the test load with a score greater than 0, using weightings for each grade:
S=100–(12.5 (N1)+25 (N2+N3)+50 (N4+N5+N6)+75 (N7+N8)+100 (N9))/Ntot
– N1, N2,… = number of items with grade 1, 2,…
– Ntot = total number of items in the test load
• Results from 3 separate test runs are averaged to determine cleaning index of UUT
23

AHAM Totalized Scoring
Example of totalized score and cleaning index results:
24
AHAM Score Test 1 Test 2 Test 3
0 46 49 38
1 22 32 23
2 12 8 16
3 6 17 10
4 8 7 6
5 3 5 8
6 1 0 5
7 6 6 0
8 0 0 2
9 34 14 30
AHAM Score Test 1 Test 2 Test 3
Total Cleaning
Index62.5 74.8 63.5
Average Machine
Cleaning Index66.9
Number of items that
received a score of 0 in test 1
Cleaning index for test 1
using the equation from
previous slide

IEC Performance Index
• A cleaning index is calculated for the UUT and
the reference unit:C = (N1+2 N2+3 N3+4 N4+5 N5)/Ntot
– N1, N2,… = number of items with score 1, 2,…
– Ntot = total number of items in the test load
• The performance index, PC, for each test is:ln(PC) = ln(CT/CR)
– CT , CR = Cleaning index of the test and reference unit respectively
• Performance index of the UUT is calculated by
averaging ln(PC) for each test run, then
determining overall PC
25

IEC Performance Index
Example of results:
26
IEC Score Test 1 Test 2 Test 3 Test 4 Test 5
Ref. DW UUT Ref. DW UUT Ref. DW UUT Ref. DW UUT Ref. DW UUT
0 13 33 30 9 30 28 25 16 47 25
1 13 3 8 35 3 18 20 4 4 19
2 34 19 21 30 7 42 28 45 19 11
3 46 21 33 33 14 20 47 17 21 32
4 9 34 23 6 51 18 9 32 27 17
5 24 29 24 25 34 13 10 25 21 35
Cz 375 385 361 343 433 299 303 398 318 380
CR,i 2.698 2.597 3.115 2.180 2.288
CT,i 2.770 2.486 2.151 2.863 2.734
ln (PC,i) 0.026 -0.044 -0.370 0.273 0.178
ln (PC) 0.013
PC 1.013
Number of items in the reference DW
that received a score of 0 in test 1

Summary
• DOE, AHAM, and IEC test methods
• AHAM and IEC soil preparation
• AHAM, IEC, and hybrid scoring methods
• Cleaning index and performance index
27

3 Development Testing
2 Cleanability Test Procedures
1 Introduction
Proposed Approach5
4 Results
6 Next Steps
28

Units Tested
• Conducted performance testing on 8 residential DWs at DOE/NETL ATEC laboratory– Selected units that met current and future Tier 1 ENERGY
STAR criteria
– Included variety of features that may affect cleaning performance (i.e. soil sensors, spray configurations)
• Reference DW– The IEC test requires the use of a specific, custom-
manufactured European DW as the reference unit
– Phase 1 tests were conducted with a consistently-performing U.S. DW as the reference unit
– The IEC-specified reference unit will be available for Phase 2 tests
29
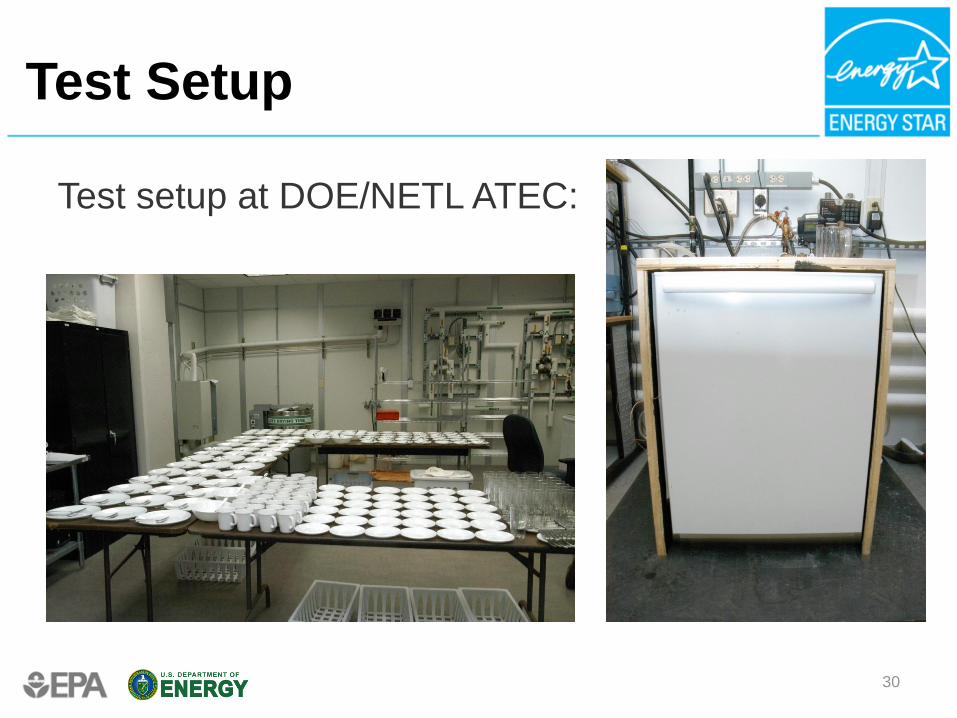
Test Setup
Test setup at DOE/NETL ATEC:
30

DOE Tests
31
• 3 test cycles with the sensor heavy response cycle as
defined in the DOE test procedure (even for non-soil-
sensing units) with modifications:
– Soil substitutions for unavailable items: suitable
replacements were found for butter, creamed corn,
and milk
– Current AHAM DW-1-2009 soil load used instead of
DW-1-1992 soil load specified in DOE test procedure
– Cleaned filters between test cycles
• Additional tests used modified soiling method (discussed
later in this section) to evaluate reducing the test burden

DOE Test Scoring and Cleaning
Index
• Three approaches investigated:
1. AHAM scoring and cleaning index used
2. IEC scoring used to generate a cleaning index on a
0 to 100 scale similar to AHAM method
S = 100 – (12.5 N4+25 N3+50 N2+75 N1+100 N0)/Ntot
3. Hybrid scoring system used on 3 units to generate a
cleaning index on a 0 to 100 scale using equation
above
32

AHAM Tests
• 3 test cycles conducted with 12 place settings
• Same soil substitutions as for DOE test
• Additional tests conducted with same modified
soiling method as in DOE tests
• Key differences from DOE test:– Heavier soil load
– Rinse aid used for tests
– Clean-up cycle between tests with filter cleaning
• Scoring and cleaning index same as DOE tests
33

IEC Tests
• 5 test cycles conducted with 12 place settings
• Substitutions:– U.S. residential DW for IEC reference DW
– Test conditions as specified in DOE test procedure
– AHAM-style load used for reference DW and UUT
– AHAM detergent and rinse aid used for consistency
– Suitable U.S. based soil substitutions made
• Key differences from DOE test:– Heavier soil load
– Rinse agent used
– No clean-up cycle between test cycles
34

IEC Tests Scoring and
Performance Index
• Three approaches investigated:
1. AHAM scoring and cleaning index (with 5 instead of 3 test
cycles)
2. IEC scoring and performance index that compares
performance to the reference DW
3. Hybrid scoring and performance index (used for 5 DWs)
• The performance index for IEC and hybrid scoring for the
reference DW is 1
35

Additional Investigations
• Alternate AHAM soil application method
• Additional tests using variants of the DOE test
procedure
• Tests to ensure scorer repeatability
36

Alternate AHAM Soil Application
• 3 DOE and 3 AHAM tests
on 1 unit
• Single soil applied on
each dinner plate instead
of 1 soil on each
quadrant
• Single soil applied on
each bread-and-butter
plate instead of 1 soil on
each half
37

Additional DOE-Based Tests
• DOE sensor light response and sensor medium
response tests
– 1 sensor light response test and 1 sensor medium
response test on 1 unit
– Soiled according to DOE test procedure
• DOE sensor extra-heavy response tests
– 3 tests each on 3 units with a clean-up cycle between
tests
– Soiled all 8 place settings without soiling serving
pieces and silverware
38

Scorer Repeatability Tests
• Tests were conducted to determine variation in
scoring between three technicians
• Performed tests where one technician scored
the reference unit and UUT for each test run
• Initial results do not provide enough information
to reach any conclusions on scorer variability
• Further testing may be required
39

Summary
• 8 units tested at ATEC
• DOE tests and cleaning index
• AHAM tests and cleaning index
• IEC tests, cleaning index, and performance index
• Additional investigations
– Alternate AHAM soil application
– Additional tests using variants of DOE test procedure
– Tests to ensure scorer repeatability
40

3 Development Testing
2 Cleanability Test Procedures
1 Introduction
Proposed Approach5
4 Results
6 Next Steps
41
Test Observations
• AHAM soils– Coffee grounds float inside the unit, are re-deposited
on most items, and accumulate on the filter
– If oatmeal sticks to ware, it typically gets a score of 9
• IEC soils– Tea stains are hardest to clean
– Spinach floats inside the unit, is re-deposited on most items, and accumulates on the filter
– If oatmeal sticks to ware, it typically gets a score of 0
– Serving bowls are not completely cleaned apparently due to the specified loading pattern
42

Comparison Between Test
Methods
DOE Test Method AHAM Test Method IEC Test Method
Typical scores70 – 95 with all
scoring methods
25 – 85 with all
scoring methods
AHAM: 40 – 80
IEC/Hybrid: 0.75 –
1.75
Differentiation
among test unitsLow High
Moderate for
AHAM grading
Low for IEC and
Hybrid grading
Consistency and
repeatability
High, especially for
IEC grading
High for IEC grading
Moderate for AHAM
and Hybrid grading
Low
Test burden Low Moderate High
43

DOE Test Results
0
10
20
30
40
50
60
70
80
90
100
A B C D E F G H
Cle
an
ing
In
dex
UUT Designation
AHAM Score IEC Score Hybrid Score
44

AHAM Test Results
45
0
10
20
30
40
50
60
70
80
90
100
A B C D E F G H
Cle
an
ing
In
dex
UUT Designation
AHAM Score IEC Score Hybrid Score

IEC Test Results
0
0.5
1
1.5
2
2.5
0
10
20
30
40
50
60
70
80
90
100
A B C D E F G H
IEC
/ H
yb
rid
Perf
orm
an
ce I
nd
ex
AH
AM
Cle
an
ing
In
dex
UUT Designation
AHAM Score IEC Score Hybrid Score
46
Note: Unit H includes only an AHAM score because it is the reference unit for the IEC and hybrid scoring.

Alternate AHAM Soil Application
Results
0
10
20
30
40
50
60
70
80
90
100
AHAM Score IEC Score AHAM Score IEC Score
Cle
an
ing
In
dex
4 soils 1 soil
DOE Test AHAMTest
Reduces test burden by shortening preparation time
by ~60% without significant changes in results
47

DOE Sensor Light Response and
Sensor Medium Response Results
• Observations
– AHAM and IEC cleaning index results between 95 –
98
– No test-to-test differentiation
• Conclusions
– Not a good indicator for cleaning performance
– Should not use the lighter soil loads specified in the
current DOE test procedure for performance testing
48

DOE Sensor Extra-Heavy Response
Results
AHAM Score
0
10
20
30
40
50
60
70
80
90
100
A C H
Cle
an
ing
In
dex
UUT Designation
DOE Heavy DOE Extra Heavy
IEC Score
0
10
20
30
40
50
60
70
80
90
100
A C H
Cle
an
ing
In
dex
UUT Designation
DOE Heavy DOE Extra Heavy
49
Moderate to high consistency in scoring and greater differentiation
between units compared to DOE sensor heavy response
Note: The DOE heavy soil load scores for unit H are based on two data points only.

Summary
• Test observations
• DOE, AHAM, and IEC test results
• Alternate AHAM soil application test results
• DOE sensor light response and sensor medium
response test results
• DOE sensor extra-heavy response test results
50

3 Development Testing
2 Cleanability Test Procedures
1 Introduction
Proposed Approach5
4 Results
6 Next Steps
51

Initial Recommendations
52
• DOE sensor extra-heavy response tests with IEC scoring– Provides adequate differentiation among units
– Least impact on test burden among methods showing differentiation: can be conducted as additional cycles after DOE testing to measure EAEU using same soil
– Moderate to highly consistent; will require tests on more units to confirm
– Provides best harmonization: cleanability would be measured according to similar soil as used for energy testing
• Alternatively, AHAM tests with IEC scoring– Provides high differentiation among units with highly consistent
results
– Somewhat more test burden compared to DOE extra-heavy soil load tests

IEC Test Method Not
Recommended
53
• Significantly higher test burden
– Uses completely different soils and preparation
– Needs 2 – 3 technicians for one round of testing
– Takes a long time to prepare, apply, and dry soils
– Requires at least 5 cycles for both UUT and reference
DW
• Our results indicate that the IEC test method
does not provide consistent results or adequate
differentiation among units tested

3 Development Testing
2 Cleanability Test Procedures
1 Introduction
Proposed Approach5
4 Results
6 Next Steps
54

Phase 2 Testing
• Perform validation tests (e.g. more units, single soil on
each dish)
• Evaluate if there is an increased consistency in results
with the IEC reference DW used for DOE and AHAM test
methods
• Analyze changes in energy and water use with a heavier
soil load and compare these with the rated energy and
water consumption to determine representativeness of
cleanability results.
55

Send Comments to:
Other Questions:
Mansi Thakkar, Navigant
Ashley Armstrong, DOE
Amanda Stevens, EPA
Contact Information
56