Energy security in APEC
264
Energy security in APEC Energy Working Group abare assessing the costs of energy supply disruptions and the impacts of alternative energy security strategies APEC#205-RE-01.5 ABARE Research Report 05.2 for the APEC Energy Working Group Lindsay Hogan, Lindsay Fairhead and Andrew Gurney, ABARE Robert Pritchard, ResourcesLaw International June 2005
Transcript of Energy security in APEC

Energy security in APEC
Energy Working Group abare
assessing the costs of energy supply disruptions and the impacts of alternative energy security strategies
APEC#205-RE-01.5
ABARE Research Report 05.2 for the APEC Energy Working Group
Lindsay Hogan, Lindsay Fairhead and Andrew Gurney, ABARE
Robert Pritchard, ResourcesLaw International
June 2005

ii Energy security in APEC
© 2005 APEC Secretariat
ISBN 1 920925 38 4
Hogan, L., Fairhead, L., Gurney, A. and Pritchard, R. 2005, Energy Security in APEC: Assessing the Costs of Energy Supply Disruptions and the Impacts of Alternative Energy Security Strategies, APEC Energy Working Group, Report no. APEC#205-RE-01.5, Published by ABARE as Research Report 05.2, Canberra, June.
Published by the Australian Bureau of Agricultural and Resource Economicsfor the APEC Energy Working Group.
ABARE GPO Box 1563 Canberra ACT 2601
Telephone +61 2 6272 2000 Facsimile +61 2 6272 2001Web site www.abareconomics.com
ResourcesLaw InternationalLevel 23 Governor Macquarie Tower1 Farrer Place Sydney NSW 2000
Telephone +61 2 9252 8900Facsimile +61 2 9252 8911Web site www.resourceslaw.net
APEC Secretariat35 Heng Mui Keng TerraceSingapore 119616
Telephone +65 6775 6012Facsimile +65 6775 6013Email [email protected] site www.apec.org

Energy security in APEC iii
foreword
APEC is an important forum for strengthening economic cooperation in the region. Energy security has become a key issue in the APEC region in recent years as a consequence of increased volatility in the world oil market since 1999 and heightened security concerns following the events of 11 September 2001. The APEC Energy Security Initiative, developed in response to these concerns, includes measures to respond to temporary supply disruptions as well as longer term policy responses that address the broader challenges facing the region’s energy supply. Security of energy supply is particularly important given the projected rise in the energy import dependence of APEC economies over the medium to longer term.
The broad objective in this study is to assess the costs of temporary energy supply disruptions to APEC economies and the impacts of alternative energy responses. There are three key components in the economic and modeling analysis of this study:
■ a detailed analysis of the economic costs associated with selected tem-porary energy supply disruption scenarios using ABARE’s global trade and environment model
■ a broad analysis of the costs and benefi ts of appropriate response strate-gies to temporary energy supply disruptions and
■ an evaluation of longer term strategies to respond to energy security challenges.
The study was prepared for the APEC Energy Working Group.
BRIAN S. FISHER
Executive Director
June 2005

iv Energy security in APEC
acknowledgments
The authors wish to thank a wide range of people from government, indus-try and other organisations who have contributed to this report in various ways, including:
■ the APEC Energy Working Group, which commissioned this study, and the APEC Secretariat
■ the project’s advisory group, which included Vivek Tulpulé (formerly of ABARE), Karen Schneider (ABARE), Masaharu Fujitomi (APERC), Mark Rodekohr (EIA) and Brett Jacobs (IEA)
■ representatives from selected APEC economies — China, Japan, the Republic of Korea, Mexico, Thailand and the United States — who participated in the consultations and advisory processes
■ Michael Whitfi eld and Joel Tu from the Australian Government Depart-ment of Industry, Tourism and Resources who were project offi cers for the study
■ offi cials from the Australia Government Department of Foreign Affairs and Trade who assisted with the consultations process
■ Karen Schneider and Anna Heaney from ABARE who participated in the consultations process in Asia
■ Guy Jakeman, Sam Hester and Helal Ahammad from ABARE who, together with Karen Schneider, provided input on the GTEM reference case and/or modeling exercise
■ Don Gunasekera, Allison Ball and Jammie Penm from ABARE who provided comments on an earlier version of this report.

Energy security in APEC v
contents
Summary 1
1 Introduction 25Why the renewed interest in energy security? 25APEC Energy Security Initiative 26Study objectives, research method and structure of the report 29
2 APEC energy security policy setting 32APEC member economies and income levels 32APEC Energy Security Initiative 34IEA and ASEAN agreements on energy security in APEC economies 41Oil stockpiling arrangements and APERC projections of oil import dependence in APEC economies 44Energy security policies in selected APEC economies 47
3 APEC energy market setting 50Primary energy consumption in APEC economies 50Energy consumption in electricity generation and end use activities 54Energy production and self suffi ciency in APEC economies 61APEC energy trade 67
4 Energy security risks and market volatility in the APEC region 72Linkages between output and energy consumption growth in APEC economies 76Sources of variability in the energy markets of APEC economies 81APEC energy self suffi ciency, oil dependence and world resource availability 105

vi Energy security in APEC
5 Modeling approach 116ABARE’s global trade and environment model 116Developing a reference case 118Reference case projections 122
6 Quantifying the economic effects of temporary energy supply disruptions 134Temporary disruption to Middle East oil supplies 134Temporary disruption to Middle East LNG production 143Temporary blockage of the Malacca Strait 150
7 Some economic aspects of energy security policies in the APEC region 158Economic rationale for government intervention in energy security 158Emergency policy response measures to energy supply disruptions 165Longer term policy response measures 175Prioritising emergency and longer term policies 186
8 Conclusion 189Causes of economic vulnerability 189Policy responses by APEC economies 190
AppendixesA Current energy policy settings in selected APEC
economies 193B Decomposition of annual growth in total primary energy
consumption in twenty APEC economies 203C Decomposition of annual growth in total fi nal energy
consumption in twenty APEC economies 224D Impacts of oil supply disruption scenarios for nineteen
APEC economies 245
References 247

Energy security in APEC vii
boxes1 Energy Security in APEC: Cooperation for a Sustainable Future –
Extract from the APEC Energy Ministers’ Declaration in June 2004 272 Key dates in the development of the APEC Energy Security Initiative 353 Economic effects of an oil supply disruption on the world oil market 1604 Some key economic implications of oil stocks for the world oil market 168
fi guresA Energy and oil self suffi ciency in APEC economies, 2002 4B GTEM simulation results for the impact of a three month disruption
to Middle East oil production on real GNP in APEC economies 131 Total primary consumption of energy and oil in APEC economies, 2002 512 Energy and oil production in APEC economies, 2002 623 Self suffi ciency in energy and specifi c fuel types, 2002 654 Net exports of energy and oil in APEC economies, 2002 685 Net exports of energy and oil as a percentage of consumption in APEC
economies, 2002 696 Historical growth in output (real GDP) and total primary energy
consumption (TPEC) in APEC economies 747 Energy, oil and electricity intensity, by per person GDP in APEC
economies, 2002 808 Overview of descriptive statistics for the percentage point contributions
of fuel types to TPEC growth in APEC economies 839 Production, consumption and self suffi ciency in APEC 10610 World proved reserves/production ratio 10811 Location of world proved reserves and production 11012 World oil production, by region 11213 Indicative world real price indexes of energy commodities 11414 Average annual growth in TPEC: reference case, 2002–30 12215 Share of world energy consumption: reference case 12316 Average annual growth in TPEC: reference case, 2002–30 12317 Energy required in APEC to produce 2002US$1 of GDP:
reference case 12418 Average annual growth in APEC electricity generation: reference case,
2002–30 12519 Average annual growth in APEC energy production: reference case,
2002–30 12620 Share of world oil production, reference case 12721 APEC oil self suffi ciency: reference case 12822 Self suffi ciency in energy and specifi c fuel types: reference case, 2030 128

viii Energy security in APEC
23 APEC net energy exports: reference case; 2030 13124 APEC net energy import dependence: reference case 13225 Interpreting the deviation from the reference case in a GTEM simulation 13326 World oil market developments 13527 Change in world crude oil prices following oil supply disruptions:
relative to the reference case 13728 Oil self suffi ciency and change in output following oil disruptions:
relative to the reference case 13829 Change in APEC production in selected sectors following oil supply
disruptions: relative to the reference case 13930 Change in APEC energy intensity following oil supply disruptions:
relative to the reference case 13931 Change in APEC TPEC following oil supply disruptions: relative to the
reference case 14032 Change in APEC oil consumption following oil supply disruptions:
relative to the reference case 14033 Change in APEC oil production following oil supply disruptions:
relative to the reference case 14134 Change in APEC oil imports following oil supply disruptions:
relative to the reference case 14235 Change in APEC oil exports following oil supply disruptions:
relative to the reference case 14336 Change in APEC LNG prices following LNG supply disruptions:
relative to the reference case 14637 Change in GNP following LNG supply disruptions: relative to the
reference case 14738 Change in output of economies importing LNG from the Middle East
following LNG supply disruptions: relative to the reference case 14839 Change in natural gas imports following LNG supply disruptions:
relative to the reference case 14840 Changes in APEC annual trade following Malacca Strait blockages:
relative to the reference case 15241 Change in APEC annual energy prices following Malacca Strait
blockages: relative to the reference case 15342 Change in APEC annual output of selected sectors following Malacca
Strait blockages: relative to the reference case 15443 Change in total APEC annual energy consumption following Malacca
Strait blockages: relative to the reference case 15444 Change in APEC annual energy production following Malacca Strait
blockages: relative to the reference case 156

Energy security in APEC ix
45 Change in APEC energy trade following Malacca Strait blockages:relative to the reference case 157
46 Cumulative changes in APEC and world energy stocks since 1970 16947 Cumulative changes in APEC and world stocks of oil and oil products
since 1970 17048 Cumulative changes in energy stocks since 1970, by APEC economy 17149 Energy intensity and self suffi ciency in APEC economies, by fuel type,
2002 17750 Diversifi cation in energy consumption (TPEC) and oil dependence in
APEC economies, 2002 18051 Oil shares in energy consumption and per person GDP in APEC
economies, 2002 183
tables1 Key economic and energy consumption indicators for APEC member
economies and membership of the IEA and ASEAN, 2002 332 Oil stockpiling arrangements and APERC projections of oil import
dependence in APEC economies, 1999 and 2020 453 Fuel shares in total primary energy consumption (TPEC), by APEC
economy, 2002 524 Fuel shares in electricity generation, by APEC economy, 2002 555 Fuel shares in total fi nal energy consumption (TFEC), by APEC economy,
2002 576 Total fi nal energy consumption (TFEC), by end use activity and by APEC
economy, 2002 597 Share of petroleum products in total fi nal energy consumption, by end use
activity and by APEC economy, 2002 608 Self suffi ciency in energy and specifi c fuel types, by APEC economy,
2002 649 Self suffi ciency of APEC economies in energy and specifi c major fuel
types (coal, oil and gas), by income category, 2002 6610 Net energy exports, by fuel type and by APEC economy, 2002 7011 Descriptive statistics for historical growth in output (real GDP) and total
primary energy consumption (TPEC) in APEC economies 7712 Decomposition of annual growth in total primary energy consumption,
by fuel type and supply source 8413 Decomposition of annual growth in total fi nal energy consumption,
by fuel type and end use sector 9814 Historical annual average growth rates for world oil production,
including OPEC, OECD and other regions 11315 Regions and sectors in GTEM 117

x Energy security in APEC
16 Real GDP growth rates assumed in the reference case 11917 Fuel shares in electricity generation, reference case, 2002 and 2030 12018 Self suffi ciency of APEC economies in energy and specifi c major
fuel types, reference case, 2030 12919 Impacts of the oil supply disruptions, 2005 and 2020: relative to the
reference case 13620 Impacts of the LNG supply disruptions in 2005 and 2020: relative to the
reference case 14521 Impacts of the Malacca Strait blockages in 2005 and 2020: relative to
the reference case 15122 Diversifi cation index for fuel types in energy consumption, by APEC
economy 17923 Rankings for APEC economies, by key energy security indicator
in 2002 18724 Main energy security risks and basic reduction strategies 19125 Decomposition of annual growth in TPEC by fuel type and supply source,
United States 20426 Decomposition of annual growth in TPEC by fuel type and supply source,
Canada 20527 Decomposition of annual growth in TPEC by fuel type and supply source,
Australia 20628 Decomposition of annual growth in TPEC by fuel type and supply source,
Hong Kong 20729 Decomposition of annual growth in TPEC by fuel type and supply source,
Japan 20830 Decomposition of annual growth in TPEC by fuel type and supply source,
Singapore 20931 Decomposition of annual growth in TPEC by fuel type and supply source,
Chinese Taipei 21032 Decomposition of annual growth in TPEC by fuel type and supply source,
New Zealand 21133 Decomposition of annual growth in TPEC by fuel type and supply source,
Republic of Korea 21234 Decomposition of annual growth in TPEC by fuel type and supply source,
Brunei Darussalam 21335 Decomposition of annual growth in TPEC by fuel type and supply source,
Chile 21436 Decomposition of annual growth in TPEC by fuel type and supply source,
Malaysia 21537 Decomposition of annual growth in TPEC by fuel type and supply source,
Mexico 216
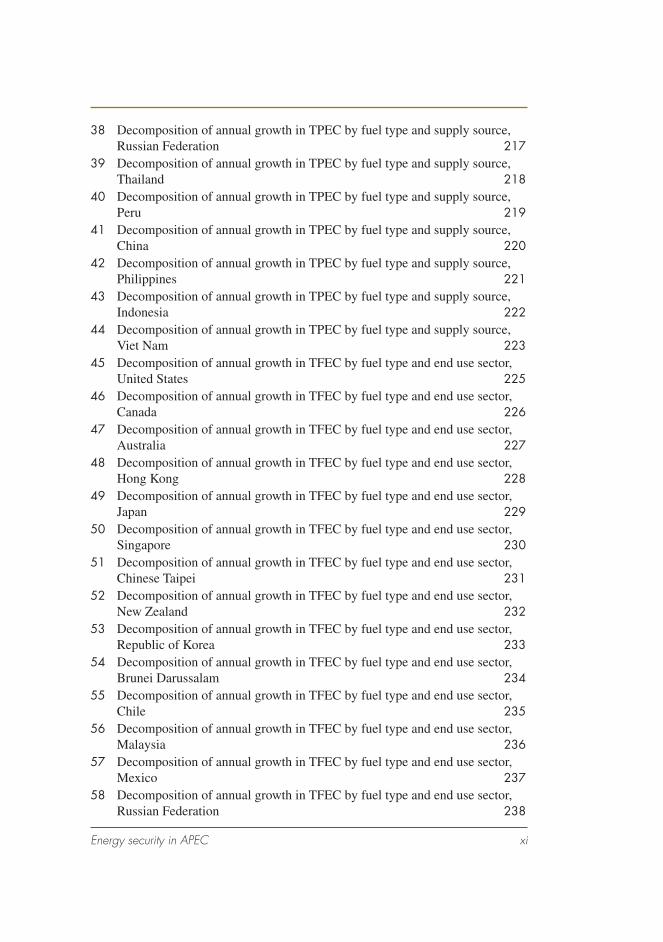
Energy security in APEC xi
38 Decomposition of annual growth in TPEC by fuel type and supply source, Russian Federation 217
39 Decomposition of annual growth in TPEC by fuel type and supply source, Thailand 218
40 Decomposition of annual growth in TPEC by fuel type and supply source, Peru 219
41 Decomposition of annual growth in TPEC by fuel type and supply source, China 220
42 Decomposition of annual growth in TPEC by fuel type and supply source, Philippines 221
43 Decomposition of annual growth in TPEC by fuel type and supply source, Indonesia 222
44 Decomposition of annual growth in TPEC by fuel type and supply source, Viet Nam 223
45 Decomposition of annual growth in TFEC by fuel type and end use sector, United States 225
46 Decomposition of annual growth in TFEC by fuel type and end use sector, Canada 226
47 Decomposition of annual growth in TFEC by fuel type and end use sector, Australia 227
48 Decomposition of annual growth in TFEC by fuel type and end use sector, Hong Kong 228
49 Decomposition of annual growth in TFEC by fuel type and end use sector, Japan 229
50 Decomposition of annual growth in TFEC by fuel type and end use sector, Singapore 230
51 Decomposition of annual growth in TFEC by fuel type and end use sector, Chinese Taipei 231
52 Decomposition of annual growth in TFEC by fuel type and end use sector, New Zealand 232
53 Decomposition of annual growth in TFEC by fuel type and end use sector, Republic of Korea 233
54 Decomposition of annual growth in TFEC by fuel type and end use sector, Brunei Darussalam 234
55 Decomposition of annual growth in TFEC by fuel type and end use sector, Chile 235
56 Decomposition of annual growth in TFEC by fuel type and end use sector, Malaysia 236
57 Decomposition of annual growth in TFEC by fuel type and end use sector, Mexico 237
58 Decomposition of annual growth in TFEC by fuel type and end use sector, Russian Federation 238

xii Energy security in APEC
59 Decomposition of annual growth in TFEC by fuel type and end use sector, Thailand 239
60 Decomposition of annual growth in TFEC by fuel type and end use sector, Peru 240
61 Decomposition of annual growth in TFEC by fuel type and end use sector, China 241
62 Decomposition of annual growth in TFEC by fuel type and end use sector, Philippines 242
63 Decomposition of annual growth in TFEC by fuel type and end use sector, Indonesia 243
64 Decomposition of annual growth in TFEC by fuel type and end use sector, Viet Nam 244
65 Impacts of 2005 oil supply disruption scenario, by APEC economy 24566 Impacts of 2020 oil supply disruption scenario, by APEC economy 246

Energy security in APEC 1
summary
In recent years, global energy security — in particular, security of oil sup-ply — has become a key political and economic issue. Energy security at its simplest means the security of energy supply. Energy security in its eco-nomic context refers to the provision of reliable and adequate supply of energy at reasonable prices in order to sustain economic growth.
Increased volatility in the world oil market, and heightened security con-cerns following the events of 11 September 2001, focused attention on energy security issues and resulted in the development of the APEC Energy Security Initiative. The APEC Energy Security Initiative includes measures to respond to temporary supply disruptions as well as longer term policy responses that address the broader challenges facing the region’s energy supply that are practical in a policy context.
The Australian Bureau of Agricultural and Resource Economics (ABARE) and ResourcesLaw International were appointed by the APEC Energy Work-ing Group in 2004 to undertake a study to quantify the costs of selected temporary energy supply disruptions to APEC economies and to analyse the costs and benefi ts of appropriate response strategies in the short and longer terms.
APEC energy security policy settingThe APEC Energy Security Initiative, which originated in 2000, has been developed to include key recommendations in the following areas:
■ joint oil data initiative – the aim of the Joint Oil Data Initiative (JODI) is to improve the quality, timeliness and completeness of world oil market data available to market participants and hence improve market transparency.
■ sea lane security – oil and gas transport in the Asian region is almost exclusively by tanker and, of particular concern, the Malacca Strait is very shallow and only 500 metres wide at the narrowest point.
2 Energy security in APEC
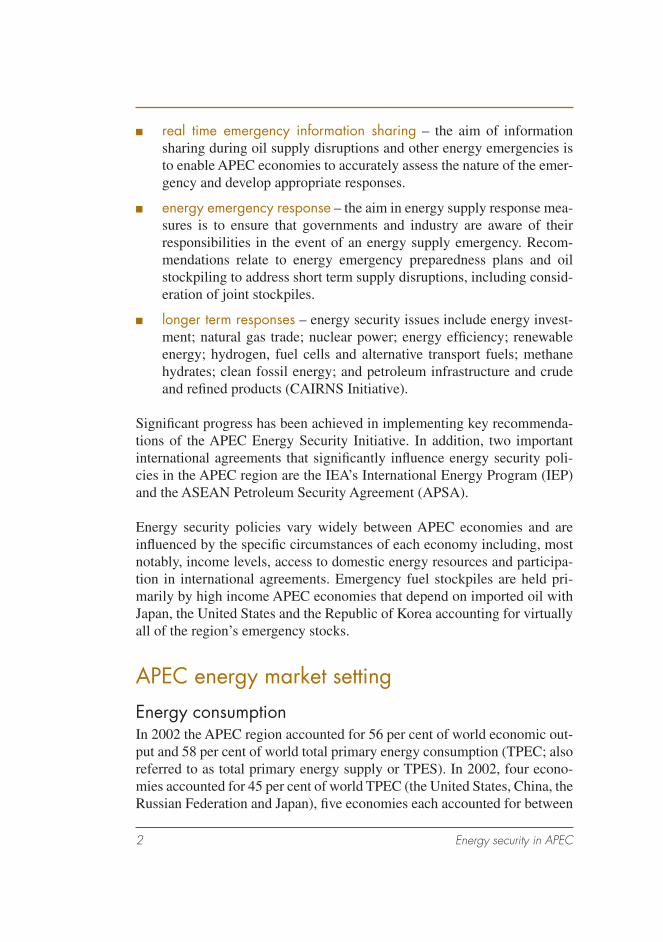
■ real time emergency information sharing – the aim of information sharing during oil supply disruptions and other energy emergencies is to enable APEC economies to accurately assess the nature of the emer-gency and develop appropriate responses.
■ energy emergency response – the aim in energy supply response mea-sures is to ensure that governments and industry are aware of their responsibilities in the event of an energy supply emergency. Recom-mendations relate to energy emergency preparedness plans and oil stockpiling to address short term supply disruptions, including consid-eration of joint stockpiles.
■ longer term responses – energy security issues include energy invest-ment; natural gas trade; nuclear power; energy effi ciency; renewable energy; hydrogen, fuel cells and alternative transport fuels; methane hydrates; clean fossil energy; and petroleum infrastructure and crude and refi ned products (CAIRNS Initiative).
Signifi cant progress has been achieved in implementing key recommenda-tions of the APEC Energy Security Initiative. In addition, two important international agreements that signifi cantly infl uence energy security poli-cies in the APEC region are the IEA’s International Energy Program (IEP) and the ASEAN Petroleum Security Agreement (APSA).
Energy security policies vary widely between APEC economies and are infl uenced by the specifi c circumstances of each economy including, most notably, income levels, access to domestic energy resources and participa-tion in international agreements. Emergency fuel stockpiles are held pri-marily by high income APEC economies that depend on imported oil with Japan, the United States and the Republic of Korea accounting for virtually all of the region’s emergency stocks.
APEC energy market settingEnergy consumptionIn 2002 the APEC region accounted for 56 per cent of world economic out-put and 58 per cent of world total primary energy consumption (TPEC; also referred to as total primary energy supply or TPES). In 2002, four econo-mies accounted for 45 per cent of world TPEC (the United States, China, the Russian Federation and Japan), fi ve economies each accounted for between

Energy security in APEC 3
1.0 and 2.4 per cent, and a further eleven APEC economies each accounted for less than 1.0 per cent (data for Papua New Guinea are unavailable).
The importance of specifi c fuels in APEC energy consumption in 2002 was:
■ APEC total primary energy consumption – 90 per cent was sourced from nonrenewable fuels including oil (crude oil, natural gas liquids and feedstocks, 35 per cent of APEC TPEC in 2002), coal (28 per cent), gas (21 per cent) and nuclear (7 per cent), and 10 per cent from renewable energy, which includes combustible renewables and waste (7 per cent), hydro (1.9 per cent), geothermal energy (0.5 per cent) and solar, wind, tide and wave energy (0.1 per cent).
■ APEC electricity generation – 85 per cent was sourced from nonrenew-able fuels including coal (46 per cent), gas (18 per cent), nuclear (16 per cent) and oil (6 per cent), with hydroelectricity the most important renewable energy source (13 per cent).
■ APEC total fi nal energy consumption – mainly sourced from oil (petro-leum products, 45 per cent), electricity (17 per cent), gas (15 per cent), coal (9 per cent) and renewables (9 per cent).
Notably, in the APEC region, nearly all renewable energy, with the excep-tion of combustible renewables and waste, over three quarters of coal and around half of gas resources are used in electricity generation. Final energy is mainly used in the industry, transport and residential sectors and oil, the key focus in energy security assessments, is mainly used in the transport and industry sectors. Transport is the most oil intensive sector in the APEC region, with 94 per cent of energy sourced from oil in 2002. Agriculture is also highly reliant on oil, with an oil share of 68 per cent, although this activity is a relatively small user of oil in absolute terms. Oil accounted for 27 per cent of energy consumption in the industry sector.
Energy production, self suffi ciency and tradeIn 2002 the APEC region accounted for 53 per cent and 38 per cent of world energy and oil production respectively. Seven APEC economies each accounted for over 1 per cent of world energy production (the United States, China, the Russian Federation, Canada, Australia, Indonesia and Mexico) and six APEC economies each accounted for over 1 per cent of world oil production (the Russian Federation, the United States, Mexico, China, Can-ada and Indonesia).

4 Energy security in APEC
APEC energy self suffi ciency (energy production as a percentage of energy consumption) was 91 per cent in 2002, indicating that the level of energy production was insuffi cient to cover the APEC region’s total primary energy consumption in the same year (see fi gure A; note that APEC economies are ranked according to income per person in 2002). Notably, there is consider-able variation in self suffi ciency by fuel type and income group:
Energy and oil self sufficiency in APEC economies, 2002ABy APEC economy
By income group
Viet NamIndonesia
PhilippinesChina
PeruThailand
Russian FederationMexico
MalaysiaChile
Republic of KoreaNew Zealand
Chinese TaipeiSingapore
JapanHong Kong, China
AustraliaCanada
United States
World
Low income excl. China
Low income
Middle income
High income
APEC total
50 100% 150 200 250
50 100% 150 200 250
300
300
Energy
Oil

Energy security in APEC 5
■ energy self suffi ciency, by fuel type – APEC oil self suffi ciency was 67 per cent in 2002, accounting for the energy shortfall within the APEC region, compared with APEC coal self suffi ciency of 105 per cent and APEC gas self suffi ciency of 108 per cent.
■ energy self suffi ciency, by income group – energy self suffi ciency in the high income economies was only 73 per cent in 2002, compared with 133 per cent in the middle income economies and 102 per cent in the low income economies (110 per cent excluding China).
There is also considerable diversity in energy self suffi ciency between indi-vidual APEC economies:
■ energy self suffi ciency below 100 per cent – twelve APEC econo-mies recorded an energy self suffi ciency below 100 per cent in 2002, of which seven economies were not self suffi cient in coal, oil or gas (including Hong Kong, Japan, Singapore, Chinese Taipei, the Republic of Korea, Chile and Thailand).
■ energy self suffi ciency of 100 per cent or higher – eight APEC econo-mies recorded an energy self suffi ciency of at least 100 per cent in 2002, of which four economies were self suffi cient in each of the three major fuel types (Canada, the Russian Federation, Indonesia and Viet Nam).
None of the APEC economies with an energy self suffi ciency below 100 per cent were self suffi cient in oil. In 2002, 10 per cent of APEC TPEC was sourced from net imports.
APEC energy security risks and market volatilityEnergy supply disruptions may occur at any point in the energy supply line and originate at a range of geographic locations affecting one or more fuel types. Disruptions may occur in isolation or simultaneously. Temporary energy supply disruptions may be caused by a range of factors, including:
■ war, civil unrest, acts of terrorism or piracy on key sea lanes may dis-rupt energy exploration, production, processing or transport activities, with the potential to have a major impact on world energy markets.
■ natural events, such as earthquakes, may cause major energy infra-structure damage, although the damage typically occurs at the local or regional level.

6 Energy security in APEC
■ accidents or technical factors, such as plant breakdown, may disrupt energy supply, although it should be noted that plant shutdown may be anticipated and occurs as part of a regular maintenance program.
■ market factors, such as production decisions and instability associated with major producer groups or cartels, may have signifi cant implica-tions for the world energy market (most notably, OPEC decisions in the 1970s).
■ policy factors, such as unintended consequences associated with energy market reform, may distort energy production and pricing outcomes to some extent (as occurred in recent years in California).
Any risk assessment of temporary energy supply disruptions in the APEC region requires information on the probability or likelihood of potential energy supply disruptions occurring and the damage or cost of each poten-tial disruption. The benefi t of policy intervention to reduce the risks and/or costs of temporary energy supply disruptions is the damage or costs avoided from such disruptions. Before quantifying the economic effects of selected temporary energy supply disruptions, it is useful to examine the historical importance of energy consumption for output growth, the extent and nature of volatility in the energy markets of APEC economies, and key aspects of the energy security risk exposure of APEC economies.
Importance of energy consumption for output growthAnnual growth rates in TPEC and output (measured by real gross domes-tic product or GDP in domestic currency) were examined in twenty APEC economies over two time periods, 1972–89 and 1990–2002. In each period, there was a relatively strong contemporaneous relationship between output and TPEC growth rates in eleven APEC economies. In a small number of economies, there was a weak or negative contemporaneous relationship.
The average growth rates in both output and TPEC vary considerably between APEC economies and time periods. In the majority of APEC economies, output growth rates tended to be higher on average than TPEC growth rates, indicating that energy intensity has declined in these econo-mies over the period (energy intensity is the ratio of energy consumption to national output). A lower energy intensity indicates an economy is rela-tively less reliant on energy as an input to production, suggesting that the
Energy security in APEC 7
costs of disruptions to energy users in these economies tend to be lower than in economies that are more energy reliant (all else constant).
However, the number of economies where the average energy consumption growth rate exceeded the average output growth rate increased from fi ve in the period 1972–89, to nine in the period 1990–2002. Notably, in the recent period, six of the nine APEC economies where average energy consump-tion growth exceeded average output growth were not energy self suffi cient in 2002 — these include Japan, Singapore, Chinese Taipei, the Republic of Korea, Thailand and the Philippines.
Extent and nature of volatility in the energy markets of APEC economiesExamining the components of growth in both primary and fi nal energy consumption provides information on the extent and nature of volatility in energy markets but does not imply causation. Realised energy consumption levels are the outcome of both supply and demand conditions — that is, not all periods of slower or negative growth in energy consumption are caused by temporary supply disruptions in the energy sector. A key issue of inter-est in the current study is the extent to which energy market variability has been associated with the oil market and, for net energy importing econo-mies, with net imports.
Oil consumption has been the major contributing factor to TPEC growth in around half of APEC economies, while coal, gas, nuclear and other energy were each the major sources of TPEC growth in a relatively small number of APEC economies. Four measures are calculated in this study to indicate the extent and nature of volatility in energy markets: including variability in annual growth rates, the strength of the relationship between consumption of a specifi c fuel type and fl uctuations in TPEC over time, and minimum and negative contributions of individual fuel types to annual TPEC growth.
There have been some signifi cant changes in the contribution of oil to TPEC growth in APEC economies between the two time periods, 1972–89 and 1990–2002. Most importantly, while oil remains the major source of variability and downside contributions to TPEC growth, the extent of vari-ability and downside contributions have been modifi ed in the majority of APEC economies in the recent period.

8 Energy security in APEC
In each APEC economy, domestic energy requirements or TPEC may be sourced from domestic production, net imports and stock drawdown. Net energy imports were the source of the greatest variability in annual TPEC growth in seven of the nine net energy importing economies in the period 1972–89 and in eight of the twelve net energy importing APEC economies in the period 1990–2002.
Overall, from an energy security perspective, oil is the main fuel type that is associated with variability in both primary and fi nal energy consumption in the APEC region. Variability associated with net imports is important in several APEC economies. There is also an important association between variability in energy consumption in the industry sector and variability in fi nal energy consumption.
APEC energy self suffi ciency, oil dependence and world resource availabilityAPEC energy self suffi ciency has declined from 96 per cent in 1992 to 91 per cent in 2002 and is projected by ABARE to fall further to 79 per cent in 2030. The APEC region tends to produce slightly more coal and gas, and substantially less oil, than is consumed within the region. Notably, APEC oil self suffi ciency has declined from 77 per cent in 1992 to 67 per cent in 2002 and is projected by ABARE to fall to 38 per cent in 2030.
APEC’s increasing oil import dependence, or declining oil self suffi ciency, is an important energy security risk refl ecting both demand side and supply side aspects of the oil market:
■ demand side aspects – oil dependence is a feature of APEC econo-mies, particularly in the transport sector, where there are limited substi-tution possibilities over the short to medium term, but agriculture and energy intensive manufacturing activities are also highly reliant on oil inputs.
■ supply side aspects – oil, together with other major fuel types, are nonrenewable resources that need to be discovered before production may proceed, which increases uncertainty in any medium to longer term outlook assessment. In addition, world oil reserves and produc-tion are concentrated in relatively high risk regions, with the prospect of increasing market concentration over the medium to longer term.

Energy security in APEC 9
Proved reserves of coal, oil and gas may be interpreted as estimates of below ground stocks that are assessed to be economic to produce over time under current market conditions. Estimates of proved reserves will vary with economic conditions. For example, a sustained real price rise would result in currently uneconomic resources being reclassifi ed as economic and, as a consequence, aggregate proved reserves for the resource would be revised upward. A sustained real price rise would also encourage explo-ration activity, with any related resource discoveries potentially adding to proved reserves. Ongoing exploration activity is important in gaining knowledge about new oil and gas fi elds.
Relative to current production levels, coal resources are relatively more abundant than either oil or gas resources. At the end of 2003, the reserves to production ratio was estimated to be around 41 years for oil, 67 years for gas and 192 years for coal. However, refl ecting the impact of exploration activity on the level of proved reserves and despite higher world production levels, the reserves to production ratio for both oil and gas was higher in 2003 than in 1980 — the ratio in 1980 was 29 years for oil and 58 years for gas.
World proved reserves for oil and gas are concentrated in the relatively high risk regions of the Middle East and Africa. At the end of 2003:
■ oil – 72 per cent of the world’s proved reserves were located in the Middle East/Africa regions (63 per cent in the Middle East and 9 per cent in Africa).
■ gas – 49 per cent of the world’s proved reserves were located in the Middle East/Africa regions (41 per cent in the Middle East and 8 per cent in Africa).
■ coal – 6 per cent of the world’s proved reserves were located in the Middle East/Africa regions (data for the separate regions were not available).
In 2003 the share of the Middle East and Africa in world production of oil, gas and coal was 41 per cent (30 per cent, 11 per cent), 15 per cent (10 per cent, 5 per cent) and 6 per cent (0 per cent, 6 per cent) respectively.
Assuming world oil consumption continues to rise over the medium to longer term, the global distribution of oil production will shift toward the

10 Energy security in APEC
distribution for proved reserves — that is, the share of the Middle East will rise — although the timing of this shift will be infl uenced by new project developments associated with existing reserves, new discoveries made out-side the Middle East, and a change in economic conditions that enables currently uneconomic reservoirs or deposits to be reclassifi ed as economic. The development of nonconventional sources, such as tar sands and gas to liquids projects, will also contribute to future oil supply.
The share of the Middle East in world oil production is projected by ABARE to increase to 46 per cent in 2030. However, the share of the Middle East in world gas production is projected to be 10 per cent in 2030, unchanged from 2003 — this outlook refl ects the assessment that there are likely to be substantial gas resources outside the Middle East that will be economic to develop over the outlook period.
Future oil exploration is therefore important to discover new reserves as well as to diversify fuel sources to reduce market dependence in high risk areas. Given the level of historical volatility sourced from this region, the concentration of proved reserves and production in the Middle East for oil and, to a lesser extent, gas represents an important energy security risk to the APEC region.
A further important consideration in world energy markets is the role of OPEC. Compared with a peak of 54 per cent in 1973, OPEC’s share of world oil production varied within a relatively narrow band of 38–42 per cent between 1990 and 2003, but is projected by ABARE to increase to 61 per cent in 2030. Future oil investment and production decisions by OPEC member economies will have important implications for world oil markets. From an energy security perspective, some consideration needs to be given to the risk of some combination of short term oil supply disruptions associ-ated with political instability in the Middle East and an unexpected change to OPEC oil production targets over a more sustained time period.
Quantifying the economic effects of temporary energy supply disruptionsABARE’s global trade and environment model, GTEM, has been used to quantify the impacts of possible energy supply disruptions on APEC econo-mies. GTEM requires a reference case or a ‘business as usual’ scenario against which the impacts of the energy supply disruptions can be measured.

Energy security in APEC 11
In this study, the reference case represents the likely outlook for economic activity and energy demand and supply in APEC and across the world over the period to 2030 in the absence of changes to key energy, environmental or economic policies.
Reference case projectionsGrowth in APEC energy consumption is similar to the projected growth in world energy consumption. As a result, APEC’s share of world energy con-sumption in 2030 remains virtually unchanged from 2002.
In the reference case, APEC energy production is projected to grow signifi -cantly slower than APEC energy consumption, implying a rapidly grow-ing shortfall in the capacity of the APEC region to satisfy its own energy requirements. Energy consumption in APEC is projected to grow by 2.1 per cent a year between 2002 and 2030, whereas APEC energy production is projected to grow by just 1.5 per cent a year between 2002 and 2030.
The growth in the energy shortfall in APEC is most apparent for oil. Because of resource constraints, APEC oil production is projected to be slow, aver-aging 0.3 per cent a year from 2002 to 2030. In contrast, APEC oil con-sumption grows at over 2 per cent a year in the same period. The result is a substantial decline in APEC’s capacity to supply its domestic oil require-ments and a decline in oil self suffi ciency in all APEC income groups.
As a result of slow growth in oil production, the share of APEC in world oil production declines considerably over the projection period from 37 per cent in 2002 to 22 per cent in 2030. Conversely, oil production grows strongly in the Middle East. By 2030 the Middle East produces 46 per cent of world oil supplies, up from 29 per cent in 2002.
Selected temporary energy supply disruptionsThe following energy supply disruption scenarios were modeled for 2005 and 2020 to represent the variety of possible threats to APEC energy supplies:
■ oil simulations – in each oil simulation, it is assumed that oil produc-tion in the Middle East is disrupted for around three months, resulting in a fall in world oil production by around 8 per cent relative to the reference case.

12 Energy security in APEC
■ LNG simulations – in each LNG simulation, it is assumed that LNG production in the Middle East region is disrupted for about six months, resulting in a fall in world LNG production by around 10 per cent rela-tive to the reference case.
■ sea lane simulations – in each sea lane simulation, it is assumed that shipping through the Malacca Strait is stopped for fi ve weeks.
Supply disruptions in 2005 are compared with disruptions of a similar mag-nitude in 2020 in order to depict the implications of projected signifi cant changes within the APEC region, particularly increasing oil import depen-dence and expanding LNG trade.
Impacts of Middle East oil supply disruptionsA three month disruption to the supply of oil from the Middle East and the associated increase in world energy prices, can be expected to have signifi -cant impacts on APEC economies. The extent of these impacts will vary between APEC economies depending on each economy’s net oil import position and on each economy’s reliance on oil — the results for nineteen APEC economies are indicated in fi gure B. In particular, the net oil export-ing economies of the region are likely to gain from income transfers asso-ciated with higher world oil prices, whereas net oil importing economies stand to lose.
In both the 2005 scenario and the 2020 scenario, the three month disruption to world oil supplies leads to a contraction in APEC gross national product (GNP) of 0.2 per cent relative to the reference case in the year of the dis-ruption. To put these numbers into perspective, the contraction in the 2005 scenario is US$43 billion (in 2002 prices) and is roughly similar to the cur-rent size of each of the economies of New Zealand, Peru or Viet Nam. In the 2020 scenario, the contraction in the APEC economy is US$82 billion (in 2002 prices) and is similar to the current size of each of the economies of Malaysia, the Philippines or Singapore.
Aggregate income impacts vary considerably between APEC economies and over time. High income economies experience the greatest losses in APEC as they typically depend heavily on net oil imports. However, the GNP impact in the high income economies relative to the reference case declines from 0.28 per cent in the 2005 scenario to 0.25 per cent in the

Energy security in APEC 13
2020 scenario because of a substantial decline in the importance of oil for generating output.
In contrast to the results for the high income economies, strong gains are experienced relative to the reference case in the oil exporting economies of Indonesia, Malaysia and the Russian Federation, and to a lesser extent
GTEM simulation results for the impact of a three month disruption to Middle East oil production on real GNP in APEC economiesB
By APEC economy
By income group
Viet NamIndonesia
PhilippinesChina
PeruThailand
Russian FederationMexico
MalaysiaChile
Republic of KoreaNew Zealand
Chinese TaipeiSingapore
JapanHong Kong, China
AustraliaCanada
United States
World
Low income excl. China
Low income
Middle income
High income
APEC total
–2.5 –2.0 –1.5 –1.0 –0.5 % 0.5 1.0 1.5 2.0 2.5 3.0
–2.5 –2.0 –1.5 –1.0 –0.5 % 0.5 1.0 1.5 2.0 2.5 3.0
2005
2020
relative to the reference case
14 Energy security in APEC
Mexico. These economies benefi t from income transfers associated with higher world oil prices. However, the gains from an oil supply disruption are lower for each of these economies in 2020 than in 2005, refl ecting the substantial decline in net oil exports projected for each of these economies over that period.
The negative impact on APEC of the disruption to oil supplies is concen-trated in those industries that rely intensively on petroleum inputs, specifi -cally the transport industry and the chemicals, rubber and plastics industry. The higher cost of oil leads to higher prices and lower demand for these oil intensive commodities relative to the reference case.
The aggregate and sectoral output impacts of the oil supply disruptions lead to a substantial decline in APEC oil consumption and imports relative to the reference case in both scenarios. Total APEC oil consumption contracts by 7.3 per cent in 2005 under the 2005 scenario relative to the reference case or by 148 million tonnes. In the 2020 scenario, APEC’s crude oil imports decline relative to the reference case by 9 per cent in 2020, or by 243 mil-lion tonnes.
Impacts of disruptions to Middle East LNG productionThe impacts of the disruption in LNG supplies on APEC as a whole are insignifi cant, refl ecting that LNG supply is only important for a small num-ber of APEC member economies.
Even in the economies that do import LNG from the Middle East, the economywide impacts of a disruption to LNG supplies are marginal. Under the 2005 LNG disruption scenario, for example, aggregate output in 2005 contracts by less than 0.1 per cent in Japan and the Republic of Korea rela-tive to the reference case. Similarly in the 2020 LNG disruption scenario, the contractions in aggregate output in 2020 among all LNG importing economies are less than 0.1 per cent.
The contraction in LNG consumption and in LNG imports relative to the reference case varies between economies according to the degree of depen-dence on Middle East LNG, and on the opportunities for low cost substitu-tion away from gas. For example, the contraction in LNG imports and LNG consumption is larger in the Republic of Korea than in all other economies, with the exception of Chinese Taipei, because Korea relies heavily on Middle

Energy security in APEC 15
East LNG. In Chinese Taipei, over three quarters of LNG imports are used to generate electricity, a sector in which there are signifi cant opportunities for fuel substitution. By increasing capacity utilisation of coal fi red and nuclear plants, Chinese Taipei is able to reduce its dependence on LNG fi red power relative to the reference case. In this way, Chinese Taipei is able to reduce gas consumption and LNG imports relative to the reference case more cheaply than can economies such as Korea, where the residential sec-tor is the primary gas consuming sector.
The fact that it is cheaper for some importers to reduce LNG imports by a given proportion than it is for others reveals that there are opportunities for economies engaged in LNG trade to gain from cooperation, and more generally from enhancing market fl exibility.
Impacts of blockages in the Malacca StraitTrade underpins the strength of APEC economies, and most maritime trade with non-APEC regions fl ows through the Malacca Strait. Obstruction of the Malacca Strait, APEC’s principal maritime trade route with non-APEC economies, raises freight costs for all traded commodities and thereby leads to a contraction in world and APEC trade volumes relative to the reference case. The reduction in demand for traded commodities across the world undermines production and income in the world and in APEC economies.
Again, the impacts on APEC are marginal, particularly when compared with the impacts of the oil supply disruption. For APEC as a whole, the fi ve week blockage costs US$1.7 billion (in 2002 dollars) in gross national product (GNP) in the 2005 scenario, and US$2.8 billion (in 2002 dollars) in the 2020 scenario. In percentage terms, this is less than 0.1 per cent of annual APEC GNP.
The cost would be greater if the blockage were simulated for a longer period. However, fi ve weeks is not an unreasonably short period of time given the experience and state of readiness of the workforces that manage the Strait, particularly in the narrowest length of the channel alongside Singapore. If anything, fi ve weeks may overstate the length of time of any potential blockage. Nonetheless the fi ve week blockage assumed in this study is suf-fi cient to indicate the nature and extent of impacts of a major blockage.
16 Energy security in APEC
Some economic aspects of energy security policies in the APEC region
Economic rationale for government intervention in energy securityEnergy security may be considered within the context of energy policy whereby energy policy makers aim to ensure the provision of energy at least cost over time, given energy technologies and resource availability, and tak-ing into account environmental impacts and economic and other risks in the outlook. The economic rationale for government intervention is based on the presence of market failure (that is, the failure of markets to effi ciently provide some goods and services) and the capacity of the government, fi rst, to identify and assess policy options that address the market failure and, second, to implement the policy option judged to result in the highest net economic benefi ts over time.
Key aspects of market adjustment to major temporary energy supply disrup-tions were quantifi ed in the GTEM analysis and include demand restraint, surge production and fuel switching. It should be noted, however, that pri-vate investment in energy supply reliability is not included explicitly in GTEM. Private companies invest in supply reliability provided there is an economic incentive to do so (ignoring any policy requirements). Pri-vate companies may adopt a range of risk sharing and reducing measures designed to offset, at least to some extent, the negative impact of temporary energy supply disruptions on profi tability. For example, private companies may manage risks by investing in energy stocks, energy exploration activ-ity, research and development into or adoption of energy conservation and switching technologies, and diversifi cation strategies (such as participation in joint ventures).
Energy markets tend to underinvest in energy supply reliability. This is a result of the public good nature of investment in energy supply reliability (others benefi t from private investment in energy supply reliability result-ing in free riding), possible external costs of energy supply disruptions (if the energy sector does not incur the full costs of energy supply disruptions, the economic incentive to invest in energy supply reliability is lower than would otherwise be the case) and the inclusion of a risk premium in private investment decision making.

Energy security in APEC 17
The observation that private investment in energy supply reliability tends to be below the optimal level provides the economic justifi cation for con-sidering government intervention in energy security, either directly through public provision or indirectly to increase private investment in energy sup-ply reliability.
Emergency policy response measures to energy supply disruptions
Energy stocksInvestment in energy stocks is the major approach for smoothing short term fl uctuations in both supply and demand where it is feasible to store the fuel type (particularly important for commodities such as oil and LNG). The availability of stocks during a temporary energy supply disruption reduces the costs of the disruption by providing an alternative supply source of the energy commodity.
The policy response to the problem of underinvestment in energy stocks in the private sector is to supplement private storage (for example, through subsidies or tax concessions) or invest in public storage. A major issue with public investment in energy storage is that it reduces the economic incen-tives for private investment — that is, public storage results in some crowd-ing out of private storage. Public storage reduces the net economic benefi ts of private storage by moderating price increases during temporary energy supply disruptions. In addition, compared with private sector behavior, there may be greater uncertainty about the nature of public intervention in energy markets through stock drawdown during periods of supply disrup-tion, increasing perceived risks in private investment in stocks and placing further downward pressure on private investment.
A key issue in assessing the net economic benefi ts of alternative policy options is that information on energy stocks in the world economy is incom-plete. The Joint Oil Data Initiative (JODI) is an important undertaking that will improve the quality, timeliness and completeness of world oil market data, although data are not yet available.
Using IEA data on the annual change in energy stocks, it is possible to con-struct time series on cumulative changes in the stocks of major energy com-modities in the APEC region since 1970. Between 1970 and 2002, annual

18 Energy security in APEC
APEC energy stocks increased by 368 Mtoe (million tonnes of oil equiva-lent) which is equivalent to around 6 per cent of TPEC in the APEC region in 2002. During this period, increases in oil, gas and coal stocks accounted for 62 per cent, 26 per cent and 12 per cent respectively of the increase in total energy stocks — that is, the focus was on building oil stocks refl ect-ing the relatively higher risks in the world oil market. Nearly two thirds of the overall buildup in energy stocks occurred during the 1970s, a period of considerable oil market volatility.
There has been substantial variation in stockpiling trends since 1970 in the individual APEC economies. Overall, compared with the world economy, there has been greater emphasis in the APEC region on building oil stocks and less emphasis on building gas stocks.
There has been some recent analysis of the potential for joint investment by a number of smaller net oil importing APEC economies in an oil stockpil-ing facility. For these economies, the economies of scale in a joint facility would reduce the costs that would otherwise be incurred in storing similar quantities of oil in separate facilities in each economy. The costs associ-ated with a range of options for such a joint facility have been examined by APERC. The benefi ts of additional oil stocks are the reduced costs of any temporary oil supply disruptions. While APERC has provided some indica-tive estimates of the costs of oil supply disruptions, the modeling analysis in this report provides more comprehensive estimates of the economic impacts of a major global oil supply disruption.
Other emergency response measuresEnergy prices have a key role in signalling variations in supply and demand conditions. During an energy supply disruption, higher energy prices are part of the process that allows energy to be rationed to users who place the highest value on the energy source. That is, price rationing is an important part of the normal operation of markets, and the market response to volatil-ity. Price rises encourage demand restraint, fuel switching and surge pro-duction in the short term.
Various forms of nonprice rationing mechanisms are adopted by govern-ments during an emergency, mainly to ensure access to energy by high pri-ority users such as emergency services and in response to equity concerns about large energy price rises. Quantity rationing may be achieved through direct allocation (the government allocates energy supplies directly to

Energy security in APEC 19
energy users), demand suppression (the fl exibility of energy purchases and consumption is restricted) and queuing (energy supplies are allocated on a fi rst come fi rst served basis). In practice, some combination of these options is used with direct allocation to emergency uses, and demand suppression and queuing mechanisms applied to other energy consumers. To comple-ment quantity rationing, information programs by governments encourag-ing energy users to adopt more energy conservationist practices, at least for the duration of the shortage, may further restrain demand.
International cooperation is an important aspect of the policy response to a major global energy supply disruption. Governments need information on the nature of the shock, fi rst, to identify and assess policy options to reduce the magnitude and duration of the energy supply disruption (that is, reduce the disruption costs by addressing the source of the shock directly) and, second, to plan and implement the appropriate emergency policy response. The importance of international cooperation and information sharing is well recognised through the APEC Energy Security Initiative.
Longer term policy response measuresSince the probability of a major energy supply disruption occurring is posi-tive, governments need to maintain an emergency response capability. How-ever, there are a range of longer term policy measures that aim to reduce the costs of disruptions in the future that will infl uence the need for investment in emergency response measures, particularly energy stockpiles. Longer term policy measures aim to reduce the costs of disruptions in the future by reducing the probability of major energy supply disruptions occurring in the future and by reducing the costs when such disruptions actually occur.
Diversifi cation in energy marketsDiversifi cation of fuel types and fuel sources is one of the most important components of the longer term policy response to energy security risks. Key aspects of diversifi cation in energy markets include:
■ diversifi cation in energy production – that is, reduce the dependence of economies on higher risk sources of energy by diversifying the geo-graphic location of fuel sources.
■ diversifi cation in energy consumption – reduce the dependence of economies on higher risk forms of energy by diversifying the fuel types in energy consumption.

20 Energy security in APEC
If there is assessed to be an equal probability of disruption across locations and fuel types, diversifi cation would reduce the expected costs of future supply disruptions by spreading the risks across different locations and fuel types. If certain locations and fuel types are assessed to be relatively high risk, private companies and governments need to assess the net economic benefi ts of diversifying the energy market to reduce dependence in these higher risk areas.
In particular, any economic assessment of the appropriate level of diver-sifi cation (and other longer term responses) needs to take into account the net economic benefi ts over time from using relatively abundant energy resources, particularly in low risk geographic locations in the world econ-omy. Coal is the most abundant resource and is located mainly in relatively low risk geographic regions, while oil is the least abundant resource and is located mainly in higher risk geographic regions — gas falls between coal and oil in terms of abundance and location risk.
In this study, diversifi cation indexes are constructed to summarise the fuel mix in TPEC, electricity generation and TFEC in twenty APEC economies in 1980 and 2002 (although data for the Russian Federation are unavailable in 1980). In the APEC region, the fuel mix in TPEC and TFEC was more diverse in 2002 than in 1980, while the fuel mix in electricity generation was more concentrated in the recent period. Between 1980 and 2002, the fuel mix in TPEC became more diversifi ed in all APEC economies except China, which recorded a minor rise.
In 2002, there were nine APEC economies where the oil share in TPEC exceeded 40 per cent and, partly as a consequence, the level of diversifi -cation in TPEC was reduced — these economies are Singapore, Mexico, Malaysia, Peru, Hong Kong, Chinese Taipei, the Republic of Korea, Japan and Thailand (of these, only Mexico and Malaysia are energy and oil self suffi cient).
R&D and technology adoption in energy marketsAnother important component of the longer term policy response is research and development (R&D) into, and adoption of, energy technologies that may reduce the risk and/or cost of disruptions in the future. While energy security may represent only part of the benefi ts of R&D activity in energy markets, government support for R&D is a key mechanism to achieve a level of energy security that is closer to society’s optimal level.

Energy security in APEC 21
R&D and technology adoption may have major implications for both the supply side and demand side of energy markets:
■ new technologies facilitate energy exploration and production for both conventional and nonconventional sources;
■ alternative processing technologies (such as gas to liquids plants) increase the fl exibility of markets to adapt fuel types to different end uses;
■ new technologies may aim to reduce energy consumption in the econ-omy (or increase the effi ciency of energy use); and
■ new technologies may increase the fl exibility of energy markets to adjust to supply disruptions (energy substitution or switching technologies).
R&D activity, and associated adoption of new technologies, is a key mecha-nism to increase the level of diversifi cation in energy production and con-sumption. The high level of dependence on oil in transport use in all APEC economies is an area where there has been limited progress in technology adoption to date. Introduction of new technologies to increase the diversity of the fuel mix in transport would signifi cantly reduce energy security risks in this area.
New environmental technologies are important for the upstream industry by allowing energy exploration and production activity to be undertaken in new areas while managing environmental impacts. In addition, R&D is clearly important for the further development of renewable energy sources.
Other longer term policy measuresOther aspects of the longer term policy response may include removal of market impediments in order to increase the effi ciency of the energy market to respond to supply disruptions, the provision of energy market informa-tion and international policy cooperation. It should be noted that other gov-ernment policies may have implications for energy security.
The energy policy setting in each economy may have important implica-tions for the economic incentives of the private sector, including invest-ment in energy supply reliability. Policy reform to increase the effi ciency of energy markets, including their capacity to respond to supply disruptions, is a signifi cant component of the longer term energy security policy response. For example, an important issue is that economic regulation of natural gas

22 Energy security in APEC
and electricity markets typically limits the extent to which prices may rise in response to an energy supply disruption, increasing the burden of adjust-ment on other parts of the energy market. This has been one of the issues addressed through the process of energy market reform in many economies in recent years.
Government support for the collection, dissemination and analysis of rel-evant energy market information is justifi ed, at least to some extent, on energy security and broader economic effi ciency grounds. Aspects of inter-national cooperation that are important include, for example, ongoing dia-logue between the major oil producers and consumers, progress to ensure reasonable levels of sea lane security, and joint R&D and information proj-ects such as JODI. The APEC Energy Security Initiative is an important example of international cooperation that should signifi cantly enhance energy security in the region.
Prioritising emergency and longer term policies The energy security policy response in each APEC economy will include a mix of emergency and longer term measures. It should be emphasised that it is beyond the scope of this study to examine in detail the energy security risks and policies of individual APEC economies. The objective has been to present relevant information that may contribute to energy security risk and policy assessments that are undertaken by individual APEC economies and that may further contribute to joint assessments within the APEC forum.
An important issue for individual economies is that energy security policy options need to be prioritised within the framework of the national budget — this includes the total budget available to policy makers as well as the full range of competing priorities in the economy. In middle and low income APEC economies, for example, addressing theft of energy and ensuring physical protection of the workforce and infrastructure may have a higher priority than investment in energy stocks.
In this report, rankings are provided for individual APEC economies based on 2002 data for several key energy security indicators and an indicative aggregate index is constructed. This is a highly simplifi ed approach to indi-cating various aspects of the relative energy security position of individual APEC economies.
Energy security in APEC 23
The modeling analysis in this study provides comprehensive estimates of the economic impacts of various temporary energy supply disruptions over the outlook period, including demand restraint, fuel switching and surge production. This information may be used in any assessment of the net eco-nomic benefi ts of investing in supply reliability measures — such as stock-piling, diversifi cation of energy markets and technology adoption — that would reduce these disruption costs. Information provided in recent assess-ments by APERC and the Energy Modeling Forum (EMF) in the United States on oil security issues is also highly relevant to these assessments. Future energy security policy assessments would be enhanced by under-taking further research using GTEM or a similar framework to examine particular policy options in greater detail.
Concluding commentsThis study suggests that oil supply security in particular, as distinct from energy supply security in general, should be the principal focus of concern of policy makers in the APEC region. The study corroborates the widely held belief that there are important energy security risks for net oil import-ing economies in their increasing dependence on the Middle East as an oil supply source (ABARE projects, given a continuation of current trends, that the share of the Middle East in world oil production will increase from 30 per cent in 2003 to as high as 46 per cent in 2030). A complementary mix of short term and longer term policy response strategies, including exploration for and development of additional oil supply sources outside the Middle East, must therefore be a key priority of policy makers in all current and prospective net oil importing economies in the APEC region.
The importance of an effi cient, resilient and open global energy market is also an underlying theme in this study.
In addressing energy security risk, the question that each APEC economy must address is: what makes the economy vulnerable? There are three main causes of economic vulnerability of an individual APEC economy to energy supply disruptions:
■ overdependence on either domestic production or imports of a single form of primary energy
■ overdependence on any particular supply source of primary energy
■ overdependence on a single energy infrastructure facility.

24 Energy security in APEC
As well as promoting the need for a more open global energy market and supporting the APEC Energy Security Initiative process, for an individual APEC economy, what might be the ‘best’ response will depend on the com-bination of particular energy security risks that it faces. There are four main policy responses that individual APEC economies can consider:
■ adoption of a diversifi ed portfolio of interchangeable energy forms and energy supply sources – this is a principal response that all econo-mies need to consider; it will entail, for example, increased investment in domestic exploration for oil and other energy forms, investment in fuel switching systems and, in many economies, increased use of natu-ral gas.
■ interconnection of energy systems – interconnection reduces vulner-ability to system failure.
■ encouragement of timely investment in energy production, transport and storage facilities – these facilities will include pipelines, other transport facilities, power stations and electricity transmission and dis-tribution networks.
■ encouragement of investment in more effi cient energy technologies – these technologies reduce the energy intensity of economies by, for example, reducing fuel use in transport.
In summary, in addition to the paramount policy of continuing to promote the need for a more open global energy market, the reduction of energy supply vulnerability in APEC economies requires a diversifi ed portfo-lio approach to energy policy and planning. Each APEC economy must decide for itself what are the most appropriate, cost effective and affordable responses for its particular circumstances. It is hoped that this study will assist them in making the optimal choice.

Energy security in APEC 25
introduction
Since the Asia Pacifi c Economic Cooperation (APEC) forum was established in 1989, membership has expanded from twelve to twenty-one economies covering a diverse range of economic structures and levels of development. APEC has emerged as a major international organisation and an important forum for strengthening economic cooperation in the region. Based on cur-rent membership, APEC’s share of world output (gross domestic product based on purchasing power parity) has increased from 52 per cent in 1990 to 56 per cent in 2002 and 2003 (IMF 2004a). In 2002, APEC accounted for 46 per cent of world merchandise exports — exports to other APEC econo-mies represented nearly three quarters of total merchandise exports from APEC economies, with a value of US$2.2 trillion (World Bank 2004).
Why the renewed interest in energy security?Energy security at its simplest means the security of energy supply. Energy security can be taken as comprising three interrelated elements:
■ security of primary energy availability
■ security of energy transportation infrastructure and systems and
■ security of energy production and conversion facilities.
For the purpose of this study, energy security does not include security of energy demand. This is not to deny the legitimate concerns of oil export-ing nations to protect their export revenues, concerns that are shared by all nations that export their energy resources.
Energy security is of fundamental and increasing economic importance not only to individual economies but also to future relations between econo-mies. It has become both a political and economic issue.
At the beginning of the previous century, the world commenced a major shift from coal to oil as the primary and most easily affordable energy source. As a generalisation, the economic development of most developed econo-mies during most of the past century was underpinned by the availability of
1

26 Energy security in APEC
cheap oil. Cheap oil from the Middle East largely fi nanced the post-World War II reconstruction of Europe and of Japan. In 2002, oil accounted for 35 per cent of world primary energy consumption and 95 per cent of world energy consumption in the transport sector (IEA 2004a,b).
In addition to the oil price shocks in the 1970s and subsequent fall in real oil prices in the fi rst half of the 1980s, the global energy economy has under-gone two major structural changes, the implications of which may not yet be fully understood. In essence, these changes were:
■ a huge increase in competitive trade and investment activity in freely operating global and regional energy markets and
■ an unprecedented wave of liberalisation of domestic energy markets.
The effi ciency of energy production and transport from increased competi-tive activity in global and domestic energy markets since 1973 has coun-terbalanced the supply vulnerabilities of energy importing economies and most of the world has continued to prosper from the availability and afford-ability of energy. This is a remarkable tribute to the effi cient and free opera-tion of energy markets and has been achieved despite the risk that supply disruptions can occur at a variety of upstream and downstream points in both cross border and internal energy transport systems, whether maritime, rail, pipeline or power transport. Disruptions can occur from a variety of factors, including government intervention and events of force majeure, such as acts of sabotage and terrorist attacks.
APEC Energy Security InitiativeEnergy security has thus become a key issue for APEC in recent years. Energy security in its economic context refers to the reliable and adequate supply of energy at reasonable prices in order to sustain economic growth. Increased volatility in the world oil market, and heightened security con-cerns following the events of 11 September 2001, focused attention on energy security issues and resulted in the development and subsequent strengthening of the APEC Energy Security Initiative (APERC 2002a, 2003). The APEC Energy Security Initiative was endorsed by APEC Lead-ers and Ministers in October 2001. At their meeting in June 2004, APEC Energy Ministers highlighted its continuing importance (see box 1).
Energy security in APEC 27
The APEC Energy Security Initiative includes measures to respond to temporary supply disruptions as well as longer term policy responses that address the broader challenges facing the region’s energy supply that are practical in a policy context and acceptable in a political context (APEC 2002). Security of energy supply is particularly important given the pro-jected rise in the energy import dependence of APEC economies over the medium to longer term. The APEC Energy Security Initiative is explained further in chapter 2.
International energy security assessments usually focus on security of sup-ply issues in the world oil market. However, in recent years, security of international shipping lanes and issues associated with security of supply in natural gas and electricity markets, mainly relating to infrastructure, have gained more attention. The focus on oil security issues refl ects both demand side and supply side characteristics of the world oil market, particularly the continuing dependence on oil in energy consumption, limited substitu-tion possibilities for oil in the transport sector, and the concentration of oil production and reserves in the Middle East region and OPEC (Organisation
Box 1: Energy Security in APEC
Cooperation for a Sustainable Future – Extract from the APEC Energy Ministers’ Declaration in June 2004
The sixth meeting of APEC Energy Ministers was held on 10 June 2004 in Manila, the Philippines. The following is an extract from the APEC Energy Ministers’ Declaration (APEC 2004a, pp. 1–2).
Message from APEC Energy MinistersWe, Energy Ministers of the APEC economies, gathered for the 6th time in Manila, the Philippines, on 10 June 2004 under the theme ‘Energy Security in APEC: Cooperation for a Sustainable Future’.
We agreed that access to adequate, reliable and affordable energy is funda-mental to achieving the region’s economic, social and environmental objec-tives, that energy security challenges faced by the APEC region are constant-ly evolving, and that our efforts to enhance energy security must be fl exible and responsive.
continued

28 Energy security in APEC
Box 1: Energy Security in APEC
Cooperation for a Sustainable Future – Extract from the APEC Energy Ministers’ Declaration in June 2004 continued
The importance of these efforts is further highlighted by the recent rise in global oil prices and its potential impact on economic growth and sustain-able development within the APEC region. Having concern for the impact of recent high oil prices on our economies, we welcome efforts by oil producers to provide adequate supply to help stabilise the oil market. We recognise, however, that a variety of factors infl uence global markets, and in that context we commit our own efforts to enhance energy security.
We agreed that common ground exists for strong cooperation on energy secu-rity, with regional and global benefi ts. We agreed that our cooperation must acknowledge the individual circumstances of each member economy, and that our diversity of views is the foundation for meaningful dialogue.
We instruct the Energy Working Group (EWG) to continue its broad-based approach to energy security. We commit to continued development of re-sponse mechanisms for short-term disruptions while pursuing longer-term energy security objectives. We agreed that initiatives should be developed and implemented in close cooperation with the business, research and fi nan-cial communities.
These initiatives include:
■ preparing for energy supply disruptions;
■ facilitating energy investment;
■ using energy more effi ciently;
■ expanding energy choices; and
■ capitalising on technological innovation.
Responding to our energy security challengesWe respond to the direction by APEC Economic Leaders in their 2003 Bang-kok Declaration, to ‘accelerate the implementation of the Energy Security Initiative by endorsing its Implementation Plan and, as appropriate, a new Action Plan to enhance regional and global energy security.’ We also com-mit to the continued implementation of our Type II Partnership Initiative, ‘Energy for Sustainable Development’, submitted to the World Summit on Sustainable Development in 2002.

Energy security in APEC 29
for Petroleum Exporting Countries) member countries. The concentration of natural gas reserves in Middle East OPEC economies also represents an energy security risk to the APEC region.
The Tokyo based Asia Pacifi c Energy Research Centre (APERC) has released a number of major studies since 2000 on oil security issues in the APEC region. To complement the APEC Energy Security Initiative pro-cess, APERC released studies in 2000 and 2002 that examined emergency oil stocks as an option to respond to oil supply disruptions (APERC 2000, 2002a). The APEC energy demand and supply outlook was released in 2002 against a background of increased uncertainty following the events of 11 September 2001 and highlighted energy security concerns associated with the growing oil import dependence of the APEC region over the outlook period to 2020 (APERC 2002b).
In 2003, APERC released another major study on aspects of oil security, with a focus on Asian premium pricing, and export and import dependence issues (APERC 2003). That report also included an overview of energy security developments in some APEC economies, particularly since the events of 11 September 2001.
Study objectives, research method and structure of the reportThe objectives in this study are to quantify the costs of selected temporary energy supply disruptions to APEC economies and to analyse the costs and benefi ts of appropriate response strategies in the short and longer terms. This study was prepared for the APEC Energy Working Group (EWG).
The study has been carried out using ABARE’s global trade and environ-ment model (GTEM) to model three selected temporary energy supply dis-ruption scenarios in each of 2005 and 2020, a total of six scenarios.
The six scenarios were selected by ABARE based on its perception of certain current and future areas of risk in world energy markets that are believed to carry the potential to cause major economic costs to the APEC region. Temporary supply disruptions are modeled in world oil and LNG markets, with supply disruptions in each case assumed to be sourced in the Middle East region, and sea lane access to south east Asia through the Strait of Malacca is assumed to be temporarily closed.

30 Energy security in APEC
■ Oil simulations – in each oil simulation, it is assumed that oil produc-tion in the Middle East is disrupted for around three months, resulting in a fall in world oil production by around 8 per cent relative to the reference case.
■ LNG simulations – in each LNG simulation, it is assumed that LNG production in the Middle East region is disrupted for about six months, resulting in a fall in world LNG production by around 10 per cent rela-tive to the reference case.
■ Sea lane simulations – in each sea lane simulation, it is assumed that shipping through the Malacca Strait is stopped for fi ve weeks.
Supply disruptions in 2005 are compared with disruptions of a similar mag-nitude in 2020 in order to depict the implications of projected signifi cant changes within the APEC region, particularly increasing oil import depen-dence and expanding LNG trade.
Given an economic framework for assessing alternative policy responses, ABARE’s modeling analysis provides the basis against which to assess the net economic benefi ts of emergency policy response measures and longer term policies that reduce the risks and/or costs of temporary energy supply disruptions. That is, ABARE’s model is used to provide an indication of the costs of temporary energy supply disruptions — the benefi ts of appropriate policy response strategies are a reduction in expected economywide costs, although any costs associated with the adoption of these policies also need to be taken into account.
The risk of major temporary energy supply disruptions may be addressed through a range of possible response strategies:
■ short term response strategies – information sharing, emergency stocks, demand restraint, fuel switching and surge production capacity.
■ longer term response strategies – diversifi cation in fuel types and fuel sources, technology adoption to enhance substitution possibilities in end use applications, energy conservation and effi ciency measures, removal of market impediments (including policies that distort energy market decisions such as the decision to invest in supply reliability, and upstream exploration and production decisions), and information shar-ing in world energy markets.
Energy security in APEC 31
In this study, some emphasis is placed on the potential for disruptions in the world oil market and policy measures including oil stocks, diversifi cation and technology adoption that may reduce both the risks and costs of such disruptions.
Chapter 2 provides an overview of APEC energy security policies, includ-ing the APEC Energy Security Initiative and agreements through the Inter-national Energy Agency (IEA) and Association of South East Asian Nations (ASEAN), two other important international organisations that facilitate international cooperation. The chapter also provides background informa-tion on oil stockholding policies in APEC economies and a discussion of energy security policies in selected economies.
In chapters 3 and 4, developments in energy markets in the APEC region are examined, with a focus on aspects that relate to APEC energy security risks and issues. In chapter 3, detailed information on the energy markets of APEC economies in 2002 (the latest year for which comprehensive data are available) is provided, with a focus on sources of dependence in energy consumption. In chapter 4, the historical relationship between output and energy consumption growth is examined for twenty APEC economies, major sources of volatility in energy consumption since the early 1970s are identifi ed for these economies, and information relevant to the assessment of supply side risks in the world energy market is presented.
The modeling analysis of the temporary energy supply disruptions is pre-sented in chapters 5 and 6. Chapter 5 provides background information on ABARE’s model (GTEM) and the reference case projections to 2030. Chapter 6 presents the simulations results of the temporary energy supply disruptions, with a focus on the impacts on APEC economies and energy markets.
In chapter 7, economic aspects of the APEC energy security policy response are examined, including the economic rationale for government intervention in energy security, and emergency and longer term policy response mea-sures to actual and potential temporary energy supply disruptions. Issues in prioritising energy security policy response measures are also discussed in this chapter and key directions for future economic research are identifi ed.
Chapter 8 contains some conclusions that can be drawn from this study.

32 Energy security in APEC
APEC energy security policy settingIn recent years, energy security issues have become a high priority for policy makers and other energy market participants in the APEC region. Energy security concerns have been heightened as a consequence of increased oil market volatility since 1999, the events of 11 September 2001 and the release in 2002 of an APERC study that projects, over the period to 2020, an increasing import dependence on Middle East OPEC member economies to meet oil requirements in the APEC region.
In this chapter, background information is provided on APEC member econ-omies and the energy security policy setting, including the APEC Energy Security Initiative developed by the APEC Energy Working Group (EWG), the International Energy Agency and ASEAN commitments relating to energy security, and energy security policies in selected APEC economies.
APEC member economies and income levelsThe current membership of APEC is provided in table 1. The APEC econo-mies are ranked according to International Monetary Fund (IMF) data on gross domestic product (GDP) per person in 2002 and divided into three groups: high income (eight economies), medium income (six) and low income (seven). This ranking is used throughout the report to provide an indication of differences in energy market structure and energy security policy choices according to income level.
Table 1 also provides a listing of the membership of APEC economies in two other international organisations that are important from an energy security perspective — the International Energy Agency (IEA) and the Association of South East Asian Nations (ASEAN). There are six APEC economies that are members of the IEA and a further seven that are members of ASEAN. APEC economies that are also members of the IEA tend to be in the high income group, while ASEAN members tend to be in the middle and low income groups.
2

Energy security in APEC 33
1 Key economic and energy consumption indicators for APEC member economies and membership of the IEA and ASEAN, 2002
Gross domestic Total primary energy Gross product a consumption bAPEC economy, domestic IEA, by income product Share of Share of ASEANcategory per person a Level world Level world members
US$ US$b % Mtoe %
High income1 United States 35 424 10 206 21.2 2 290 22.4 IEA2 Canada 30 176 945 2.0 250 2.4 IEA3 Australia 27 022 532 1.1 113 1.1 IEA4 Hong Kong, China 26 699 182 0.4 16 0.2 –5 Japan 26 691 3 399 7.1 517 5.1 IEA6 Singapore 23 504 98 0.2 25 0.2 ASEAN c7 Chinese Taipei 22 809 516 1.1 94 0.9 _8 New Zealand 20 403 80 0.2 18 0.2 IEA
Total – 15 959 33.1 3 323 32.5 –
Middle income9 Republic of Korea 16 885 804 1.7 203 2.0 IEA d10 Brunei Darussalam 14 734 5 0.01 2 0.02 ASEAN c11 Chile 9 664 151 0.3 25 0.2 –12 Malaysia 9 127 224 0.5 52 0.5 ASEAN c13 Mexico 8 941 902 1.9 157 1.5 –14 Russian Federation 8 315 1 200 2.5 618 6.0 –
Total – 3 286 6.8 1 057 10.3 –
Low income15 Thailand 6 702 426 0.9 83 0.8 ASEAN c16 Peru 4 807 135 0.3 12 0.1 –17 China 4 534 5 824 12.1 1 229 12.0 –18 Philippines 4 197 334 0.7 42 0.4 ASEAN c19 Indonesia 3 224 695 1.4 156 1.5 ASEAN c20 Viet Nam 2 201 175 0.4 43 0.4 ASEAN21 Papua New Guinea 2 165 12 0.02 na na –
Total – 7 601 15.8 1 565 15.3 – – excluding China – 1 776 3.7 336 3.3 –
APEC total – 26 846 55.7 5 945 58.1 –
World – 48 176 100.0 10 231 100.0 –
a Gross domestic product based on purchasing power parity (PPP); APEC economies are ranked ac-cording to GDP per person in 2002. b Total primary energy consumption (TPEC) is also referred to as total primary energy supply (TPES). c Original signatories in 1986 to the ASEAN Petroleum Security Agreement. d Korea joined the IEA in 2001.Sources: IMF (2004a); IEA (2004a,b).

34 Energy security in APEC
Based on current membership, the APEC region has increased its share of world output signifi cantly from 48 per cent in 1980 to 56 per cent in 2002 and 2003 (IMF 2004a; based on GDP purchasing power parity).
Within the APEC region there has been signifi cant variation in the economic performance of individual economies. Most notably, China has increased its share of world output from 3 per cent in 1980 to 12 per cent in 2002. Given the current size of its economy, the inclusion of China in the low income group signifi cantly infl uences aggregate information for this income cat-egory. Therefore, information relating to the low income group is typically reported throughout this report in aggregate and excluding China.
In 2002, the high income economies accounted for a third of world output, with the United States (21 per cent of world output) and Japan (7 per cent) together accounting for around half of APEC output. The middle income economies accounted for 7 per cent of world output in 2002 — the largest three economies in this income category are the Russian Federation (2.5 per cent), Mexico (1.9 per cent) and the Republic of Korea (1.7 per cent), which are broadly similar in size to the third largest economy in the high income category, Canada (2.0 per cent). The low income economies accounted for 16 per cent of world output in 2002 or 4 per cent excluding China — the second largest economy in the low income category is Indonesia (1.4 per cent).
Overall, there are eleven economies that each accounted for less than 1 per cent of world output in 2002 including three in both the high and middle income groups and fi ve in the low income group. The smallest APEC econ-omies are Brunei Darussalam (0.01 per cent) in the middle income category and Papua New Guinea (0.02 per cent) in the low income category.
APEC Energy Security InitiativeThe APEC Energy Security Initiative includes short term measures to respond to temporary energy supply disruptions as well as longer term pol-icy responses to energy security concerns (APEC 2002). The Energy Secu-rity Initiative originated in 2000, was developed at a series of workshops during 2001 and was endorsed by APEC Leaders and Ministers in October 2001. An Implementation Plan and Action Plan to Enhance Energy Security were subsequently developed and endorsed by APEC Leaders in 2003.
Energy security in APEC 35
In June 2004, Energy Ministers highlighted the continuing importance of the Energy Security Initiative and agreed that initiatives should be devel-oped and implemented in close cooperation with the business, research and fi nancial communities. The EWG Secretariat prepared a report outlin-ing progress in implementing the APEC Energy Security Initiative for the 29th meeting of the EWG, held in Hanoi, Viet Nam, on 16–17 March 2005 (referred to as EWG29; see APEC 2005). Key dates in the development of the Energy Security Initiative are presented in box 2.
At their 5th meeting in Mexico City in July 2002, APEC Energy Min-isters endorsed several recommendations in fi ve key areas. The APEC Energy Security Initiative has since been developed further to include more
Box 2: Key dates in the development of the APEC Energy Security Initiative
The following is a list of key events over recent years relating to the develop-ment and strengthening of the APEC Energy Security Initiative, including major studies released by the Asia Pacifi c Energy Research Centre (APERC) on oil security issues.
The information is drawn from the APERC studies and the various papers re-lating to energy security that are available on the APEC web site (see APERC 2000, 2002a, 2003; www.apecenergy.org.au).
March 2000 APERC released a major study, Emergency Oil Stocks and En-ergy Security in the APEC Region (APERC 2000).
May 2000 In the APEC Energy Ministers’ Declaration, San Diego, Cali-fornia, Ministers indicated the time is right to focus on how to implement energy policy and regulatory initiatives that have been endorsed over the past few years and that increase en-ergy security by creating conditions for providing adequate supplies at reasonable prices; ‘“... rising demand and resulting dependence on oil supplies from outside the region have made energy security a major concern in many of our economies” (Paragraph 4)’ (APERC 2002a, p. 5).
Sept. 2000 The Senior Offi cials Meeting discussed what action APEC could take to respond to oil price volatility and called on the
continued…
36 Energy security in APEC
Box 2: Key dates in the development of the APEC Energy Security Initiative continued
Energy Working Group (EWG) to analyse the situation and make recommendations on issues of energy security.
Oct. 2000 At the 20th Meeting of the APEC Energy Working Group (EWG20), Peru, an initiative addressing oil supply disruptions was put forward by the United States.
Nov. 2000 Energy security concerns were reaffi rmed in the APEC Eco-nomic Leaders’ Declaration, Brunei Darussalam.
Mar–Sept. Series of workshops in Tokyo, Houston, Seoul, Bangkok and2001 Port Moresby identifi ed the need to develop a strategic ap-
proach to the energy security issue, the outcome of which was the development of an Energy Security Initiative that was en-dorsed at EWG22 in Port Moresby in September 2001.
Oct. 2001 Meetings of both APEC Leaders and Ministers, held in Shang-hai, China, endorsed the APEC Energy Working Group’s stra-tegic approach to implementing the APEC Energy Security Initiative.
2002 APERC released a major study, Energy Security Initiative: Emergency Oil Stocks as an Option to Respond to Oil Supply Disruptions (APERC 2002a) — an update of the 2000 APERC study.
2002 APERC released long term projections for the APEC region, Energy Demand and Supply Outlook 2002 (APERC 2002b) — projected a substantial oil import dependence for the APEC region in 2020.
April 2002 APERC organised a Sea Lane Disruption Simulation Exercise in Tokyo involving participants from almost all of the APEC economies.
July 2002 At the 5th Meeting of APEC Energy Ministers (EMM5) in Mexico City, Ministers directed the EWG to further imple-mentation of the Energy Security Initiative (ESI) and endorsed recommendations in fi ve key areas: joint oil data initiative (JODI); sea lane security; real time emergency information sharing; oil supply emergency responses; and nonpetroleum and longer term responses.
continued…

Energy security in APEC 37
Box 2: Key dates in the development of the APEC Energy Security Initiative continued
2003 APERC released a major study, Energy Security Initiative: Some Aspects of Oil Security (APERC 2003) — presents an overview of energy security developments in some APEC econ-omies, particularly since the events of 11 September 2001.
Oct. 2003 To advance the implementation of the Energy Security Initia-tive, in 2003 the EWG developed an Implementation Plan that was endorsed by APEC Senior Offi cials and Leaders. At their meeting in Bangkok in October 2003, Leaders agreed to ‘ac-celerate the implementation of the ESI by endorsing its Im-plementation Plan and, as appropriate, a new Action Plan to enhance regional and global energy security’.
Feb. 2004 Trial of the Real Time Emergency Information Sharing System.
Mar. 2004 1st Meeting of the Energy Security Initiative Steering Com-mittee in Beijing.
June 2004 At the 6th Meeting of APEC Energy Ministers in Manila, the Philippines, Ministers agreed that initiatives should be devel-oped and implemented in close cooperation with the busi-ness, research and fi nancial communities (see box 1). These initiatives include: preparing for energy supply disruptions; facilitating energy investment; using energy more effi ciently; expanding energy choices; and capitalising on technological innovation. Ministers also endorsed the paper, ‘Best practice principles on the establishment and management of strategic oil stocks’ (APEC 2004c).
Nov. 2004 At the 28th Meeting of the APEC EWG in Port Douglas, Aus-tralia, the latest APEC statement on energy security was re-leased, which was endorsed at the 12th APEC Economic Lead-ers Meeting in Santiago, Chile. The statement is referred to as the CAIRNS Initiative after the title of the paper, Compre-hensive Action Initiative Recognising the Need for Strength-ening the APEC Energy Security Initiative – Energy Security, Sustainable Development and Common Prosperity (CAIRNS) (APEC 2004d).
Mar. 2005 The third report on the implementation of the Energy Security Initiative was prepared by the EWG Secretariat for the 29th Meeting of the APEC EWG in Hanoi, Viet Nam.

38 Energy security in APEC
measures, particularly under long term policy responses. The fi ve key areas are:
■ joint oil data initiative
■ sea lane security
■ real time emergency information sharing
■ energy emergency response
■ longer term responses.
The Implementation Plan identifi es the key outcomes, and timeframes where appropriate, in each of these key areas (APEC 2003a). The following outline of key areas in the Energy Security Initiative also draws on recent information on progress in implementing the recommendations presented in APEC (2004b; 2005).
Joint oil data initiativeThe aim of the Joint Oil Data Initiative (JODI) is to improve the quality, timeliness and completeness of world oil market data available to market participants and hence improve market transparency. JODI commenced in September 2002 and is undertaken jointly by six organisations — APEC, the International Energy Agency (IEA), the European Union (EU), the Latin-American Energy Organisation (OLADE), the Organisation of Petroleum Exporting Countries (OPEC) and the United Nations Statistical Division.
Around 80 economies contribute to JODI, accounting for 93 per cent of world oil production and 95 per cent of world oil consumption. All APEC economies have contributed data to JODI, although there is some variation between economies relating to data quality, timeliness and coverage.
Sea lane securityOil and gas transport in the Asian region is almost exclusively by tanker and, of particular concern, the Straits of Malacca are very shallow and only 0.5 kilometres wide at the narrowest point (APERC 2002a).
APERC organised a Sea Lane Disruption Simulation Exercise on 18–19 April 2002 to identify necessary actions to better prepare APEC economies for such disruptions (APEC 2002). The exercise used real time scenarios of
Energy security in APEC 39
sea lane disruptions in south east Asia involving accident, piracy and terror-ism elements. In addition to establishing a real time emergency information sharing system and strategic oil stockpiles (including refi ned products) in Asia, recommendations provided at the end of the exercise were to consider upgrading navigational aids in the Straits of Sunda and Lombok as alterna-tive routes to the Straits of Malacca and identify what APEC economies should do to establish appropriate responses.
Work on enhancing maritime security is being undertaken by the Interna-tional Maritime Organisation (IMO) and the APEC Transportation Working Group. At EWG27 (Beijing, March 2004), members agreed that the EWG should continue to monitor the implications of this work for the transporta-tion of energy by sea.
Real time emergency information sharingThe aim of information sharing during oil supply disruptions and other energy emergencies is to enable APEC economies to accurately assess the nature of the emergency and develop appropriate responses.
The Real Time Emergency Information Sharing System was developed by Japan, was successfully trialed by several APEC economies in Febru-ary 2004 and has been endorsed for implementation. The permanent sys-tem is to be established by the end of 2004. In March 2005, fi fteen APEC economies had nominated emergency contacts for the system. At EWG28 (Australia, November 2004), members endorsed a proposal by Australia to develop an operational manual for the Real Time Emergency Information Sharing System.
Energy emergency responseThe aim in energy supply response measures is to ensure that governments and industry are aware of their responsibilities in the event of an energy sup-ply emergency. Recommendations relate to energy emergency preparedness plans and oil stockpiling to address short term supply disruptions, including consideration of joint stockpiles.
APERC released studies in 2000 and 2002 that focused on strategic oil stockpiles and a further study in 2003 that focused on the Asian premium pricing, and export and import dependence issues relating to oil security.

40 Energy security in APEC
Workshops have been held on oil supply emergency response arrangements (United States, May 2003) and joint oil stockpiling (Republic of Korea, December 2003). Presentations by APEC economies on energy emergency arrangements have commenced at EWG meetings (Republic of Korea at EWG26 in December 2003; People’s Republic of China at EWG27 in March 2004; and Australia at EWG28 in November 2004).
In December 2003, an ad hoc group was formed to identify best practices for the establishment and management of oil stockpiles (a guide, prepared by the group, on best practices principles is given in APEC 2004c).
Longer term responsesEnergy security issues in this category are wide ranging and take into account sustainability and environmental impacts. The APEC Energy Secu-rity Initiative includes longer term responses in the following categories:
■ energy investment – implement the recommendations of the Energy Investment Report: Facilitating Energy Investment in the APEC Region, recognising the important contribution of the private sector and fi nan-cial community in developing the recommendations; reaffi rm our com-mitment to encourage the implementation of best practices previously endorsed for implementation in the natural gas and electricity sectors.
■ natural gas trade – support the creation of a competitive and transpar-ent market for gas trade and encourage member economies to move toward best practice as identifi ed in Facilitating the Development of LNG Trade in the APEC Region, recognising the important contribu-tion of the private sector in developing these principles; continue work to improve the security of natural gas supply by identifying vulnerabil-ities, supporting trade promotion and establishing convenient informa-tion links to gas market data available in existing data systems.
■ nuclear power – interested member economies are encouraged to cooperate on the nuclear framework as endorsed by the EWG; security, seismic and health concerns, including transborder effects, should be adequately addressed.
■ energy effi ciency – implement a Pledge and Review Program that includes ways to monitor the implementation of policies and programs; participate in the Energy Standards and Labelling Cooperation Initia-tive and the web based APEC Standards Notifi cation Procedure aimed
Energy security in APEC 41
to facilitate trade in effi cient energy using equipment used within the region; and encourage broadening the scope of work on energy effi -ciency to include other energy intensive sectors, and to monitor the development of new technologies that could have signifi cant impacts on, and synergy with, energy effi ciency and conservation.
■ renewable energy – the EWG to continue its work under the 21st Cen-tury Renewable Energy Development Initiative, working closely with the EWG Business Network and the APEC business and research com-munities.
■ hydrogen, fuel cells and alternative transport fuels – implement the recommendations identifi ed in the Interim Framework Document on Hydrogen and Fuel Cells that highlights the potential for a hydrogen economy in the APEC region.
■ methane hydrates – support research on the potential of methane hydrates as a future energy source, and direct the EWG to communi-cate research developments within their economies.
■ clean fossil energy – EWG to continue its work in the areas of clean fossil energy and carbon dioxide capture and geological sequestration, working closely with the EWG Business Network and the APEC busi-ness and research communities.
■ petroleum infrastructure and crude and refi ned products (CAIRNS Initiative) – working closely with the EWG Business Network, identify problems and enhance effi ciency in refi ning, transport and distribution of crude oil and petroleum products.
Progress on implementation of the above directions from Energy Ministers is provided in APEC (2005).
IEA and ASEAN agreements on energy security in APEC economiesIn addition to progress on international coordination of energy security pol-icies through the APEC forum, two important international agreements that signifi cantly infl uence energy security policies in the APEC region are the IEA’s International Energy Program and the ASEAN Petroleum Security Agreement.

42 Energy security in APEC
IEA’s International Energy Program (IEP)
The IEA was established in November 1974 within the framework of the OECD to implement the International Energy Program (IEA 2001, 2004a). The IEA was formed by sixteen OECD member economies in response to the economic costs that resulted from the fi rst oil shock in 1973. Currently, twenty-six of the thirty OECD member economies are signatories to the IEP Agreement. The basic aims of the IEA are:
■ to maintain and improve systems for coping with oil supply disruptions;
■ to promote rational energy policies in a global context through coop-erative relations with nonmember countries, industry and international organisations;
■ to operate a permanent information system on the international oil market;
■ to improve the world’s energy supply and demand structure by develop-ing alternative energy sources and increasing the effi ciency of energy use; and
■ to assist in the integration of environmental and energy policies.
Major elements of the IEP are to reduce IEA dependence on imported oil, a commitment to hold minimum levels of emergency reserves and agree-ment to share available oil supplies in the event of a major disruption (IEA 2001).
The emergency responses include a commitment to hold oil stocks equiva-lent to 90 days of net oil imports. Oil includes crude oil and other refi nery feedstock as well as petroleum products, with the mix depending on the emergency requirements of individual countries. IEA emergency response measures would be activated in a major disruption, whereby supply is reduced by at least 7 per cent, the ‘trigger’ defi ned in the IEP — the trigger is based on calculated available supply of IEA countries or a single coun-try as being 93 per cent or less of the annual average supply in the most recent previous four quarters (considered the base period) available from the Monthly Oil Statistics Questionnaire (IEA 2001).
An integrated set of emergency response measures is defi ned in the IEP, including stock drawdown, demand restraint, fuel switching, surge oil pro-duction and sharing of available supplies.

Energy security in APEC 43
The IEA has a complementary set of measures known as the Coordinated Emergency Response Measures that apply to smaller energy supply disrup-tions. These measures provide the IEA with a rapid and fl exible system of response to actual or imminent oil supply disruptions and, by a decision of the IEA Governing Board, may also be used in a trigger situation. For example, the IEA developed and implemented a Contingency Plan during the 1990-91 Gulf Crisis to supply 2.5 million barrels of oil a day, mainly through stock drawdown. The IEA also developed a Contingency Plan for supply disruptions resulting from possible year 2000 computer problems.
ASEAN Petroleum Security Agreement (APSA)The ASEAN Petroleum Security Agreement was signed in the Philippines in June 1986 by the six ASEAN member economies at the time, and has been ratifi ed by the additional four countries that have since joined ASEAN.
Under APSA, ASEAN member economies established the ASEAN Emer-gency Petroleum Sharing Scheme for crude oil and petroleum products that apply both in times of shortage and oversupply (see www.aseansec.org/6568.htm for the agreement). Under the scheme, the oil exporting ASEAN member economies are required to supply a certain quantity of crude oil and/or petroleum products if any other member economies expe-rience critical shortage. Conversely, oil importing member economies are required to purchase exports of crude oil and/or petroleum products from oil exporting ASEAN member economies in distress to increase their level of exports to at least 80 per cent of the normal exports (APERC 2000).
At the 17th ASEAN Ministers on Energy Meeting held in Bangkok during July 1999, it was decided that the ASEAN Council on Petroleum (ASCOPE) should review the provisions of the 1986 APSA. ASCOPE, which com-prises the national oil companies, was established in October 1975 by the original fi ve ASEAN member countries to provide an instrument for regional cooperation among member countries (ASCOPE 2004). Currently, there are nine members of ASCOPE (ASEAN member countries exclud-ing Laos). Subsequently, at the 21st ASEAN Ministers on Energy Meeting held in Malaysia on 2 July 2003, the signifi cant progress that ASCOPE had achieved in the review was noted and the Senior Offi cials Meeting on Energy were requested to expeditiously conclude the new APSA.

44 Energy security in APEC
Oil stockpiling arrangements and APERC projec- tions of oil import dependence in APEC economiesIt is apparent from the development of the APEC Energy Security Initia-tive that oil is a major source of energy security concerns in the APEC region, although policy makers also recognise that a broad range of factors infl uence regional energy security over the longer term. Oil security risks and policy responses (both emergency responses that may be potentially implemented in the event of a temporary supply disruption and longer term policy measures) are therefore a key focus in this study.
Emergency response measures aim to reduce the costs of any temporary energy supply disruption. Emergency measures may include stock draw-down, demand restraint, surge production, fuel switching and information sharing.
Longer term policy measures aim to reduce the risk and/or cost of tempo-rary energy supply disruptions. Longer term measures may be designed to achieve increased domestic energy exploration and production, diversifi ca-tion of oil import sources, diversifi cation of the domestic fuel mix through investment in alternative energy sources and technologies, effi ciency improvements in energy use, removal of market and policy impediments, promotion of dialogue between oil producers and consumers and long term contracts with suppliers.
International coordination of policy actions is well recognised as an impor-tant policy option for both short term and longer term energy security.
Oil stockpiling arrangements in APEC economies are described briefl y in table 2, based on information presented in APERC (2002a). Given the importance in the timing of the release of the APERC supply and demand outlook for highlighting the growing oil import dependence of the APEC region, information on the oil import dependence of APEC economies in 1999 and 2020 (as presented in APERC 2002b) is also provided in table 2.
APERC estimates oil import dependence as oil consumption minus oil pro-duction, calculated as a percentage of oil consumption. In the table, APEC economies are listed in order of oil import dependence in 1999 from the highly dependent net oil importers to net oil exporters.

Energy security in APEC 45
2 Oil stockpiling arrangements and APERC projections of oil import dependence in APEC economies, 1999 and 2020 a
Oil import Change in oil dependence b import dependenceAPEC economy,by net oil trade position 1999 2020 1999–2020 c
% %Net oil importers4 Hong Kong, China 100.0 100.0 06 Singapore 100.0 100.0 07 Chinese Taipei 99.9 100.0 +18 Philippines 99.8 97.0 –5 Japan 99.7 100.0 +9 Korea, Rep. of 99.6 99.7 +11 Chile 96.3 99.5 +15 Thailand 87.8 95.1 +8 New Zealand 64.7 80.0 +1 United States 58.5 70.7 +3 Australia 30.5 46.1 +17 China 21.7 69.5 +16 Peru 16.6 24.3 +
Net oil exporters, projected net oil importers19 Indonesia –50.1 58.0 +12 Malaysia –68.0 36.9 +20 Viet Nam –103.5 5.3 +21 Papua New Guinea –370.2 80.2 +
Net oil exporters2 Canada –36.6 –60.2 –13 Mexico –79.6 –74.3 +14 Russian Federation –139.5 –91.0 +10 Brunei Darussalam –2 169.2 –910.3 +
APEC total 35.9 54.0 +
a Economy numbers are based on the rank given in table 1 based on GDP per person in 2002. b Oil import dependence calculated as oil consumption minus oil production, as a percentage of oil consump-tion. c Indicates projected change in oil import dependency between 1999 and 2020: + increased netoil import dependence for net oil importers, or weaker net oil export position (some switching to net oil importers); 0 no change in net oil import dependence; – reduced net oil import dependence for net oil importers, or stronger net oil export position. In total, seventeen APEC economies are expected to increase their net oil import dependence, two will remain roughly the same, while two will reduce theirs.
continued…

46 Energy security in APEC
2 Oil stockpiling arrangements and APERC projections of oil import dependence in APEC economies, 1999 and 2020 a continued
APEC economy Oil stockpiling arrangements
Net oil importersHong Kong Voluntary code for commercial stocks of 30 days of retained im- ports for natural gas and naphtha. Oil supply Contingency Plan has been developed.
Singapore Fuel oil stockpile for electricity generation only.
Chinese Taipei Producers of products and importers are required to hold emergency stocks of no less than 60 days of consumption. Petroleum Business Act, November 2001 requires strategic reserves.
Philippines No requirements since 1998. Energy Contingency Plan being developed.
Japan Emergency stockpiles; generally exceed IEA requirements.
Korea, Rep. of Emergency stockpiles; meets IEA requirements.
Chile Commercial stocks only to meet around 25 days of petroleum product sales.
Thailand Company stock obligations around 22 days of demand for crude and products. Investigating stockpiling programes.
New Zealand No emergency stockpiles; commercial stocks meet IEA requirements.
United States Emergency stockpiles; generally exceed IEA requirements.
Australia No emergency stockpiles; commercial stocks meet IEA requirements.
China Plans to establish emergency stocks of up to 3 months of imports by 2010.
Peru Wholesalers required to hold stocks of 15 days of average dispatch.
Net oil exporters, projected net oil importersIndonesia Maintains emergency stock to secure domestic supplies.
Malaysia No emergency stockpiling policies. A ‘Five Fuels’ policy is in place to enhance energy diversity and security.
Viet Nam No emergency stockpiling policies; generally operational stocks only
Papua New Guinea No emergency stockpiling policies; generally operational stocks only
Net oil exportersCanada No emergency stockpiling policies; generally operational stocks only; some emergency legislation in Canada
Mexico No emergency stockpiling policies; generally operational stocks only
Russian Federation No emergency stockpiling policies; generally operational stocks only
Brunei Darrusalam No emergency stockpiling policies; generally operational stocks only
Sources: Based on APERC (2002a,b, 2003).

Energy security in APEC 47
In 1999, thirteen APEC economies were net importers, of which seven are fully or almost fully dependent on oil imports (ranging from 100 to 96 per cent, including Hong Kong, Singapore, Chinese Taipei, the Philippines, Japan, Korea and Chile), a further three rely on oil imports for over half of domestic oil consumption requirements (Thailand, New Zealand and the United States) and the remaining three rely on oil imports for less than a third of domestic needs (Australia, China and Peru). All of these economies are projected to remain highly dependent on oil imports, or to become sig-nifi cantly more reliant on oil imports by 2020.
In the other eight APEC economies, net oil exports in 1999 represented a signifi cant proportion of domestic oil consumption (ranging from 37 to over 2000 per cent). Of these economies, four are projected to become net oil importers by 2020, with signifi cant oil import dependence for three economies (ranging from 37 to 80 per cent, including Papua New Guinea, Indonesia and Malaysia), but low oil import dependence projected for Viet Nam (5 per cent). The remaining four economies are projected to continue to be net oil exporters in 2020 (Canada, Mexico, the Russian Federation and Brunei Darassalam).
Overall, the oil import dependence of the APEC region is projected by APERC to increase from 36 per cent in 1999 to 54 per cent in 2020.
Indonesia is the only net oil exporting economy to maintain emergency oil stocks; these stocks are intended to reduce the risk of oil disruptions along the archipelago. Emergency fuel stockpiles are held primarily by high income APEC economies that depend on imported oil. Japan, the United States and Korea account for virtually all of the region’s emergency stocks, with Japan and the United States often exceeding the 90 days of net imports required by the IEA. In contrast, few middle to low income APEC econo-mies hold emergency oil stockpiles. Among those that have announced or are considering oil stocks in the future are the People’s Republic of China and Thailand.
Energy security policies in selected APEC economiesWhile there are considerable differences in detail, energy policy settings across APEC are generally intended to serve policy goals of economic growth and energy security. These objectives have guided energy policy

48 Energy security in APEC
reforms, including market deregulation and the introduction and enhance-ment of a variety of energy security measures.
Structural adjustments, including energy market deregulation, have been implemented across APEC economies in the pursuit of higher economic productivity. In APEC energy industries, there is an ongoing trend away from public ownership of energy assets to private ownership, from regu-lated monopolies to regulated competition, and from vertical integration to separation of functions. Generally, high income member economies have moved further along these spectrums of deregulation than have low to mid-dle income economies. Energy sectors in New Zealand, the United States, Australia and Canada, in particular, are generally characterised by private ownership and light handed regulation of competition. With some impor-tant exceptions, particularly Chile, most low to middle income economies are still early in the process of opening up their energy sectors to private participation and greater competition. However market reforms are con-tinuing in most economies (see Fairhead et al. 2002 for more detail).
Against this background of energy policy developments, energy security has remained an important concern for APEC member economies. Member economies have responded to energy security concerns with a variety of pol-icy measures, although there are some common themes in policy settings.
Energy security policies vary widely among APEC economies and are infl u-enced by the specifi c circumstances of the economy including most nota-bly income levels, access to domestic energy resources and participation in international agreements. Current energy policy settings in six selected APEC economies are discussed in appendix A.
Compared with middle to low income member economies, high income APEC economies have made greater progress toward liberalising their energy sectors. Other policy responses to the risk of international supply disruptions include diversifi cation of fuels and of import sources, regional cooperation, and fostering investment in resource developments beyond the border. While these measures are evident among most APEC economies, they are taken further by the high income APEC economies that depend heavily on imported energy. Nuclear power for example is a major source of energy only in Japan, the United States, Korea and Chinese Taipei, the four largest net energy importers in APEC.
Energy security in APEC 49
In recent years, a number of high profi le energy supply disruptions have been associated with design failures in energy market systems. These have occurred in high income APEC economies, where market based regula-tions are more advanced. In 2001, for example, Californian consumers were faced with rolling blackouts largely because poor regulatory design forced utilities into severe fi nancial diffi culties (see Fairhead et al. 2002 for more detail). Failures such as that in California have prompted more careful analysis of the design of energy market regulations to better achieve energy systems that are both effi cient and secure (see, for example, Borenstein 2002; Wolak 2003).
In contrast to high income APEC members, most middle to low income member economies are not yet highly dependent on energy imports. In many middle to low income APEC economies, energy supply disruptions caused by inadequate infrastructure are a major constraint on economic growth and social welfare. Attracting private investment in energy infrastructure is therefore a key policy objective in middle to low income economies. In Mexico, for example, policy makers are grappling with a constitutional prohibition on private ownership of energy resources that has prevented Mexico from developing its domestic reserves. As another example, the Russian Federation’s pipeline infrastructure is aged, frequently resulting in accidents and supply disruptions. Russia’s ‘Energy Strategy to 2020’ aims to attract foreign investment to Russia’s energy export sector on the under-standing that investment in export infrastructure would involve renewing and extending Russia’s pipeline network.

50 Energy security in APEC
APEC energy market setting
There is considerable diversity in the energy markets of the twenty-one economies that currently comprise APEC, refl ecting to a large extent varia-tions in economic size and structure, income levels and proximity to energy resources. In this chapter, background information is provided on the struc-ture of energy markets in APEC economies, with a focus on energy con-sumption, production and trade in 2002 (the latest year for which compre-hensive energy data are available). It should be noted that the IEA energy database, which is the main source of information on APEC energy markets used in this chapter, does not provide information on Papua New Guinea.
Primary energy consumption in APEC economiesPrimary fuels are forms of energy obtained directly from nature and include nonrenewable fuels such as coal, crude oil, natural gas liquids and natural gas, and renewable resources such as hydro, solar and wood.
Total primary energy consumption (TPEC) in the APEC region was 5945 million tonnes of oil equivalent (Mtoe) or 58 per cent of the world level in 2002, slightly higher than the region’s share in world output (table 1 and fi gure 1; note that TPEC is referred to as total primary energy supply or TPES in the IEA energy database).
In 2002 the high income economies accounted for 32 per cent of world pri-mary energy consumption, compared with 10 per cent for middle income economies and 15 per cent for low income economies (or 3 per cent exclud-ing China). Notably, the Russian Federation’s share of world primary en-ergy consumption is substantially larger than its output share (6.0 per cent share in primary energy consumption compared with a 2.5 per cent share in output).
Around 90 per cent of primary energy consumption in the APEC region in 2002 was sourced from nonrenewable fuels, comprising oil (35 per cent), coal (28 per cent), gas (21 per cent) and nuclear (approximately 7 per cent)
3

Energy security in APEC 51
(table 3). Renewable energy is made up predominantly of combustible renewables and waste (7 per cent), hydro (1.9 per cent) and geothermal energy (0.5 per cent). Compared with the world economy, the APEC region uses proportionately more coal and, to a minor extent, geothermal energy, and proportionately less combustible renewables and waste, and to a minor extent hydro (table 3).
Total primary consumption of energy and oil in APEC economies, 20021By APEC economy
By income group
Viet NamIndonesia
PhilippinesChina
PeruThailand
Russian FederationMexico
MalaysiaChile
Republic of KoreaNew Zealand
Chinese TaipeiSingapore
JapanHong Kong, China
AustraliaCanada
United States
World
Low income excl. China
Low income
Middle income
High income
APEC total
500 1000Mtoe 1500 2000 2500
2000 4000Mtoe 6000 8000 10000
Energy
Oil
Brunei Darussalam

52 Energy security in APEC
3 Fuel shares in total primary energy consumption (TPEC), by APEC economy, 2002 a
Renewables
Com- Geo- Solar/ bustible Nu- ther- wind renew/ Coal Oil Gas clear Hydro mal etc b waste c Total
% % % % % % % % %
United States 24 39 23 9.2 0.9 0.4 0.1 3 4Canada 12 34 30 7.9 12.0 0.0 0.0 5 17Australia 43 31 18 0.0 1.2 0.0 0.1 6 8Hong Kong 33 51 12 0.0 0.0 0.0 0.0 0 0Japan 19 49 13 14.9 1.4 0.6 0.1 1 4Singapore 0 85 15 0.0 0.0 0.0 0.3 0 0Chinese Taipei 36 45 7 11.0 0.6 0.0 0.0 0 1New Zealand 7 35 28 0.0 11.7 11.2 0.4 7 30
Korea, Rep. of 23 50 10 15.3 0.1 0.0 0.0 1 2Brunei 0 32 67 0.0 0.0 0.0 0.0 1 1Chile 11 38 25 0.0 8.1 0.0 0.0 17 25Malaysia 4 49 41 0.0 0.9 0.0 0.0 5 6Mexico 5 60 24 1.6 1.4 3.0 0.0 5 10Russian Fed. 17 21 53 6.0 2.3 0.02 0.0 1 3
Thailand 11 45 26 0.0 0.8 0.0 0.0 16 17Peru 7 57 4 0.0 12.9 0.0 0.5 19 32China 58 20 3 0.5 2.0 0.0 0.0 18 20Philippines 12 39 3 0.0 1.4 21.0 0.0 24 46Indonesia 12 36 21 0.0 0.5 3.4 0.0 27 31Viet Nam 13 24 5 0.0 3.7 0.0 0.0 54 58Papua New Guinea na na na na na na na na na
APEC d 28 35 21 6.6 1.9 0.5 0.1 7 10High income 23 41 22 9.5 1.8 0.4 0.1 3 5
Middle income 16 34 39 6.7 1.8 0.5 0.0 2 5
Low income 48 24 6 0.4 1.9 0.9 0.0 20 23– excl. China 11 38 18 0.0 1.6 4.2 0.0 27 33
World 23 35 21 6.8 2.2 0.4 0.1 11 14
a Total primary energy consumption (TPEC) is also referred to as total primary energy supply (TPES). Includes minor adjustments in electricity and heat for Canada and Hong Kong. b Includes solar, wind, tide and wave energy. c Combustible renewables and waste. d APEC total excludes Papua New Guinea.na Not available.Sources: IEA (2004a,b).
Energy security in APEC 53
Excluding China where 58 per cent of primary energy consumption is sourced from coal, the share of coal in the primary fuel mix tends to be positively related to income category — that is, the coal share tends to be higher on average for higher income categories. In 2002, the coal share was 23 per cent for high income economies, 16 per cent in middle income econ-omies and 11 per cent in low income economies excluding China (48 per cent including China). There is considerable variation within each income group, however, with low or zero coal fuel shares in several economies in the high and middle income categories (notably, Singapore, New Zealand, Brunei, Malaysia and Mexico).
The share of oil in the primary energy mix ranges from a high of 85 per cent in Singapore (high income) to lows of 21 per cent in the Russian Federation (middle income) and 20 per cent in China (low income). On average, oil is an important source of energy in all income groups with oil shares in 2002 of 41 per cent in high income economies, 34 per cent in middle income economies and 38 per cent in low income economies excluding China (24 per cent including China).
Gas is substantially more important in the primary energy mix, on average, for middle income economies (39 per cent) than for either high income economies (22 per cent) or low income economies (6 per cent, or 18 per cent excluding China). Gas consumption in the middle income economies was 414 Mtoe in 2002, accounting for around a third of total gas consump-tion in the APEC region. APEC economies with low gas shares are mainly concentrated in the low income category.
Nuclear energy is positively related to income category, with shares in 2002 of 10 per cent in high income economies, 7 per cent in middle income econ-omies and close to zero in low income economies (zero excluding China). Eight APEC economies used nuclear energy in 2002 — four high income economies (Japan, Chinese Taipei, the United States and Canada), three middle income economies (Korea, the Russian Federation and Mexico) and one low income economy (China).
Use of renewable energy is considerably higher in low income economies, mainly refl ecting higher consumption of combustible renewables and waste in these economies. Hydro energy is used to some extent in most APEC economies, but the shares are highest in Peru (13 per cent), Canada (12 per cent) and New Zealand (12 per cent). Geothermal energy is used in seven
54 Energy security in APEC
APEC economies, with the highest shares in the Philippines (21 per cent) and New Zealand (11 per cent).
It should be noted that, because of concerns over data reliability, combusti-ble renewables and waste are often excluded from international energy mar-ket assessments where the focus is on economic issues relating to industry and international trade. Combustible renewables and waste are included in this study where possible to highlight the diversity in the energy mix across APEC economies and, in particular, the importance of this energy source for low income economies. In 2002, combustible renewables and waste accounted for 20 per cent of primary energy consumption in low income economies (27 per cent excluding China), compared with 3 per cent and 2 per cent for high and middle income economies, respectively.
The extent to which individual economies tend to specialise in a small number of fuel types or diversify across several fuel types varies widely across all income categories. Summary measures of energy diversifi cation in APEC economies over time are provided in chapter 7 in the context of longer term policy response strategies.
Energy consumption in electricity generation and end use activitiesElectricity generationElectricity is an important source of energy in end use applications. Elec-tricity is produced from a range of primary fuels, with variations between APEC economies refl ecting to a signifi cant extent the relative availability of energy resources.
In 2002 the APEC region accounted for 61 per cent of world electricity out-put (in GWh). Around 85 per cent of APEC electricity output was sourced from nonrenewable fuels comprising coal (46 per cent), gas (18 per cent), nuclear (16 per cent) and oil (6 per cent) (table 4). Hydroelectricity is the most important renewable energy source, accounting for 13 per cent of APEC electricity output. The most notable differences with the fuel mix used in electricity generation in the world economy are in the shares for coal (39 per cent in the world economy) and hydroelectricity (16 per cent). Coal is relatively more important, on average, for electricity generation in the high income economies, with the notable exception of China where
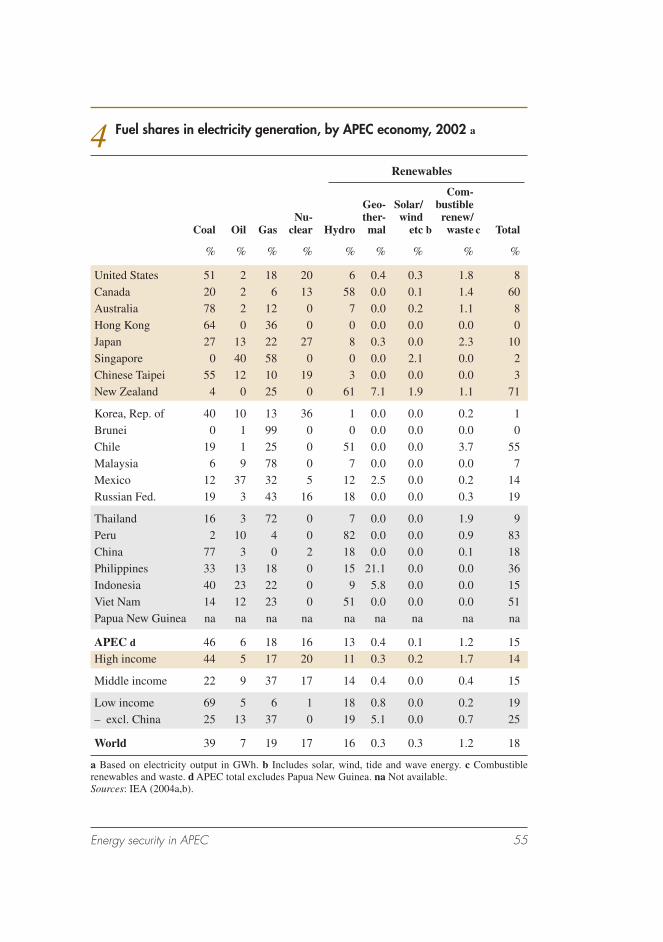
Energy security in APEC 55
4 Fuel shares in electricity generation, by APEC economy, 2002 a
Renewables
Com- Geo- Solar/ bustible Nu- ther- wind renew/ Coal Oil Gas clear Hydro mal etc b waste c Total
% % % % % % % % %
United States 51 2 18 20 6 0.4 0.3 1.8 8Canada 20 2 6 13 58 0.0 0.1 1.4 60Australia 78 2 12 0 7 0.0 0.2 1.1 8Hong Kong 64 0 36 0 0 0.0 0.0 0.0 0Japan 27 13 22 27 8 0.3 0.0 2.3 10Singapore 0 40 58 0 0 0.0 2.1 0.0 2Chinese Taipei 55 12 10 19 3 0.0 0.0 0.0 3New Zealand 4 0 25 0 61 7.1 1.9 1.1 71
Korea, Rep. of 40 10 13 36 1 0.0 0.0 0.2 1Brunei 0 1 99 0 0 0.0 0.0 0.0 0Chile 19 1 25 0 51 0.0 0.0 3.7 55Malaysia 6 9 78 0 7 0.0 0.0 0.0 7Mexico 12 37 32 5 12 2.5 0.0 0.2 14Russian Fed. 19 3 43 16 18 0.0 0.0 0.3 19
Thailand 16 3 72 0 7 0.0 0.0 1.9 9Peru 2 10 4 0 82 0.0 0.0 0.9 83China 77 3 0 2 18 0.0 0.0 0.1 18Philippines 33 13 18 0 15 21.1 0.0 0.0 36Indonesia 40 23 22 0 9 5.8 0.0 0.0 15Viet Nam 14 12 23 0 51 0.0 0.0 0.0 51Papua New Guinea na na na na na na na na na
APEC d 46 6 18 16 13 0.4 0.1 1.2 15High income 44 5 17 20 11 0.3 0.2 1.7 14
Middle income 22 9 37 17 14 0.4 0.0 0.4 15
Low income 69 5 6 1 18 0.8 0.0 0.2 19– excl. China 25 13 37 0 19 5.1 0.0 0.7 25
World 39 7 19 17 16 0.3 0.3 1.2 18
a Based on electricity output in GWh. b Includes solar, wind, tide and wave energy. c Combustible renewables and waste. d APEC total excludes Papua New Guinea. na Not available.Sources: IEA (2004a,b).
56 Energy security in APEC
77 per cent of electricity is generated using this resource. Gas is relatively more important, on average, in middle and low income economies exclud-ing China and these income groups also tend to use slightly more oil in electricity generation.
Final energy consumptionFinal energy consumption is the total amount of energy consumed outside the energy conversion sector, which includes most importantly electricity generation and petroleum refi neries.
APEC economies accounted for 57 per cent of world fi nal energy consump-tion in 2002, with the shares attributable to each income category similar to that for primary energy consumption — high income economies accounted for 32 per cent of world fi nal energy consumption, middle income econo-mies for 10 per cent and low income economies for 15 per cent (3 per cent excluding China).
In the APEC region, nearly all renewable energy with the exception of com-bustible renewables and waste, over three quarters of coal and around half of gas resources are used in electricity generation. The fuel mix in fi nal energy consumption refl ects these uses. In 2002, fi nal energy consumption in the APEC region was mainly sourced from oil (mainly refi ned petroleum products, 45 per cent), electricity (17 per cent), gas (15 per cent), coal (9 per cent) and renewables (9 per cent) (table 5).
In high income economies, 94 per cent of fi nal energy is sourced from oil (54 per cent), electricity (21 per cent) and gas (19 per cent). Within this group, the shares for gas and renewables tend to be signifi cantly higher in four economies, including Canada (28 per cent for gas and 5 per cent for renewables), New Zealand (20 per cent, 10 per cent), the United States (22 per cent, 3 per cent) and Australia (16 per cent, 6 per cent). The share of oil in fi nal energy consumption in Singapore (81 per cent) remains substantially above that of any other APEC economy, while the coal share in Chinese Taipei (12 per cent) is also high relative to most other APEC economies.
Oil, electricity and gas are also important fuel types for middle income economies (together with heat). The gas share for middle income econo-mies is signifi cantly lower in fi nal energy consumption (21 per cent) than in primary energy consumption (39 per cent) because of the importance of

Energy security in APEC 57
5 Fuel shares in total fi nal energy consumption (TFEC), by APEC economy, 2002
Renewables
Com- Solar/ bustible Geo- wind renew/ Elec- Coal Oil Gas thermal etc a waste b Total tricity Heat
% % % % % % % % %
United States 2 54 22 0.0 0.1 2.6 3 19 0Canada 2 43 28 0.0 0.0 5.0 5 22 0Australia 4 51 16 0.0 0.1 6.2 6 23 0Hong Kong 0 66 5 0.0 0.0 0.5 0 28 0Japan 6 63 7 0.1 0.2 0.7 1 24 0Singapore 0 81 1 0.0 0.0 0.0 0 18 0Chinese Taipei 12 60 3 0.0 0.0 0.0 0 25 0New Zealand 6 43 20 2.2 0.0 7.5 10 20 0
Korea, Rep. of 6 63 9 0.0 0.0 0.1 0 18 3Brunei 0 68 0 0.0 0.0 2.7 3 29 0Chile 4 50 7 0.0 0.0 20.9 21 19 0Malaysia 3 60 15 0.0 0.0 4.4 4 17 0Mexico 1 66 10 0.0 0.1 7.8 8 15 0Russian Fed. 5 22 28 0.0 0.0 0.6 1 13 32
Thailand 9 57 3 0.0 0.0 16.2 16 15 0Peru 5 60 0 0.0 0.5 19.7 20 15 0China 30 24 3 0.0 0.0 26.6 27 13 4Philippines 4 54 0 0.0 0.0 30.6 31 12 0Indonesia 5 41 11 0.0 0.0 36.1 36 7 0Viet Nam 11 23 0 0.0 0.0 59.4 59 7 0Papua New Guinea na na na na na na na na na
APEC c 9 45 15 0.0 0.1 9.2 9 17 4High income 3 54 19 0.1 0.1 2.6 3 21 0
Middle income 4 39 21 0.0 0.0 2.2 2 15 19
Low income 24 29 3 0.0 0.0 28.3 28 12 3– excl. China 7 44 6 0.0 0.0 33.8 34 10 0
World 7 43 16 0.0 0.1 14.1 14 16 3
a Includes solar, wind, tide and wave energy. b Combustible renewables and waste. c APEC total ex-cludes Papua New Guinea. na Not available.Sources: IEA (2004a,b).

58 Energy security in APEC
gas in electricity generation in this group. Notably, the Russian Federation has a relatively low oil share (22 per cent) and relatively high gas share (28 per cent). Similar to low income economies, Chile has a relatively high share of fi nal energy consumption sourced from combustible renewables and waste (21 per cent).
Excluding China, 78 per cent of fi nal energy requirements in low income economies are obtained on average from oil (44 per cent) and combustible renewables and waste (34 per cent), with the remainder obtained from elec-tricity (10 per cent), coal (7 per cent) and gas (6 per cent). In China, coal accounts for 30 per cent of fi nal energy consumption, the highest coal share in the APEC region, while the oil share (24 per cent) is low relative to that of most other APEC economies.
Energy consumption in end use activitiesIn APEC economies, as in the world economy, fi nal energy is mainly used in the industry, transport and residential sectors. In 2002, around 84 per cent of fi nal energy in the APEC region was used in these sectors — 33 per cent in industry, 28 per cent in transport and 23 per cent in residential (table 6). Commercial and public services accounted for a further 10 per cent of fi nal energy consumption.
On average, the share of fi nal energy consumption used in industry is slightly higher in middle income economies (37 per cent) compared with other groups, although the share in China is relatively high (40 per cent). The share of fi nal energy consumption in transport, on average, tends to be higher in the high income group (36 per cent), noting that China has the lowest share of all APEC economies in this sector (only 10 per cent).
Energy consumption in the residential sector is negatively related to income category. On average, 38 per cent of fi nal energy in low income econo-mies (39 per cent excluding China) is used in the residential sector, slightly above the share used in industry. This result may partly refl ect data inac-curacies, particularly with the estimates of the combustible renewables and waste shares.
Nonenergy uses of energy resources, such as consumption of lubricants and greases, bitumen and solvents, accounted for 3 per cent of total fi nal energy consumption in the APEC region in 2002.

Energy security in APEC 59
6 Total fi nal energy consumption (TFEC), by end use activity and by APEC economy, 2002
Com- Non- mercial specifi ed and other Non- Trans- Agri- public Resi- energy energy Industry port culture services dential use use Total
% % % % % % % %
United States 25 40 1.0 13 17 0.0 4 100Canada 35 28 1.8 15 16 0.0 3 100Australia 33 40 2.8 8 13 0.0 3 100Hong Kong, China 11 54 0.0 23 10 0.1 1 100Japan 38 26 1.9 17 14 0.9 3 100Singapore 38 36 0.0 7 4 11.2 3 100Chinese Taipei 55 24 1.7 5 9 2.5 3 100New Zealand 41 37 2.4 7 10 0.0 2 100
Republic of Korea 45 24 2.8 12 13 1.4 1 100Brunei Darussalam 11 56 0.0 21 8 2.7 1 100Chile 37 32 1.1 4 26 0.0 0 100Malaysia 42 39 0.3 7 10 0.0 2 100Mexico 31 41 2.8 4 19 0.0 2 100Russian Federation 35 20 2.6 5 32 2.4 2 100
Thailand 39 33 5.4 5 16 0.1 2 100Peru 28 28 5.0 3 34 0.0 2 100China 40 10 4.2 4 38 1.4 3 100Philippines 30 35 1.8 8 22 2.9 1 100Indonesia 27 21 1.7 4 46 0.0 1 100Viet Nam 16 13 1.2 3 66 0.0 0 100Papua New Guinea na na na na na na na na
APEC a 33 28 2.2 10 23 0.8 3 100High income 29 36 1.3 13 16 0.3 4 100
Middle income 37 25 2.5 6 25 1.7 2 100
Low income 37 13 3.8 4 38 1.2 3 100– excl. China 29 24 2.6 4 39 0.3 1 100
World 32 26 2.3 8 27 2.1 3 100
a APEC total excludes Papua New Guinea. na Not available.Sources: IEA (2004a,b).

60 Energy security in APEC
7 Share of petroleum products in total fi nal energy consumption, by end use activity and by APEC economy, 2002
Com- Non- mercial specifi ed and other Non- Trans- Agri- public Resi- energy energy Industry port culture services dential use use Total
% % % % % % % %
United States 26 97 98 8 12 0 100 54Canada 24 91 63 24 10 – 97 43Australia 16 98 93 9 4 – 100 51Hong Kong, China 69 100 – 13 2 0 100 66Japan 48 98 96 51 34 100 100 63Singapore 81 99 0 0 0 100 100 81Chinese Taipei 52 99 80 21 25 21 95 60New Zealand 5 99 65 7 3 – 100 43
Republic of Korea 58 99 86 43 25 56 100 63Brunei Darussalam 66 100 – 0 41 0 100 68Chile 29 99 73 22 21 – – 50Malaysia 35 100 100 32 21 – 100 60Mexico 34 100 77 49 42 – 100 66Russian Federation 11 60 40 5 3 75 85 22
Thailand 34 100 99 0 20 0 100 57Peru 53 100 50 92 29 – 100 60China 18 91 50 55 5 2 63 24Philippines 23 99 64 74 21 0 56 54Indonesia 31 100 100 9 20 – 100 41Viet Nam 32 99 85 65 2 – 100 23Papua New Guinea na na na na na na na na
APEC a 27 94 68 22 11 44 91 45High income 31 97 92 18 14 74 100 54
Middle income 27 80 56 25 10 72 90 39
Low income 20 95 57 49 8 2 65 29 – excluding China 32 100 92 29 16 0 95 44
World 27 95 63 20 12 34 94 43
a APEC total excludes Papua New Guinea. na Not available.Sources: IEA (2004a,b).

Energy security in APEC 61
Oil, the key focus in energy security assessments, is mainly used in the form of petroleum products in the transport and industry sectors. In 2002, 60 per cent and 20 per cent of fi nal consumption of oil in the APEC region was used in the transport and industry sectors respectively.
Transport is the most oil intensive sector in the APEC region, with 94 per cent of energy sourced from oil in 2002 (table 7). By contrast, oil accounted for only 27 per cent of energy consumption in the industry sector. Nonen-ergy uses and agriculture, however, are also highly reliant on oil, with oil shares of 91 per cent and 68 per cent respectively, although both activities are relatively low users of oil in absolute terms.
Energy production and self suffi ciency in APEC economiesFrom an energy security perspective, it is useful to distinguish between domestic sources of energy that are within the policy jurisdiction of national governments in the APEC region and imported sources of energy.
Total primary energy production — including production of coal, oil (crude oil, natural gas liquids and feedstocks), natural gas, nuclear and renewables — in the APEC region was 5433 Mtoe, or 53 per cent of the world level in 2002 (fi gure 2). High income economies accounted for 24 per cent of world energy production, middle income economies for 14 per cent and low income economies for 15 per cent (4 per cent excluding China).
In 2002 there were seven APEC economies that each accounted for over 1 per cent of world energy production (excluding Papua New Guinea where data are unavailable) — three high income economies and two economies in both the middle and low income groups. The major energy producers in the APEC region include the United States (16.2 per cent of world energy production in 2002), China (11.8 per cent), the Russian Federation (10.0 per cent), Canada (3.7 per cent), Australia (2.5 per cent), Indonesia (2.3 per cent) and Mexico (2.2 per cent).
Japan is the eighth largest energy producer in the APEC region, account-ing for 1 per cent of world primary energy production in 2002. It should be noted, however, that 78 per cent of primary energy production in Japan was sourced from nuclear power. To the extent that energy production in

62 Energy security in APEC
the IEA energy database is based on nuclear power generation rather than uranium production, the data should be interpreted with some caution.
In 2002 the APEC region accounted for 64 per cent of world uranium mine production, including Canada (32 per cent of world production), Australia (19 per cent), the Russian Federation (8 per cent), the United States (3 per cent) and China (2 per cent) (World Nuclear Association 2004). Energy
Energy and oil production in APEC economies, 20022By APEC economy
By income group
World
Low income excl. China
Low income
Middle income
High income
APEC total
500 1000Mtoe 1500 2000
2000 4000Mtoe 6000 8000 10000
Energy
Oil
Viet NamIndonesia
PhilippinesChina
PeruThailand
Russian FederationMexico
MalaysiaChile
Republic of KoreaNew Zealand
Chinese TaipeiSingapore
JapanHong Kong, China
AustraliaCanada
United States
Brunei Darussalam

Energy security in APEC 63
production based on uranium production in the APEC region is likely to be slightly higher than indicated in fi gure 2 since the share of APEC in world nuclear energy is 57 per cent.
Given the strategic importance of oil in energy security risk assessments — strategic in the sense that economies, particularly transport systems, are highly dependent on oil with limited substitution possibilities over the short to medium term — oil production in APEC economies is also indicated in fi gure 2. In 2002 the APEC region accounted for 38 per cent of world oil production, signifi cantly below the region’s share in total energy produc-tion. Oil production mainly occurs in the high income economies (15 per cent of world energy production) and middle income economies (17 per cent), with the remaining 7 per cent from low income economies (3 per cent excluding China).
In 2002 there were six major oil producers in the APEC region — two economies from each income group. These included the Russian Federation (10.4 per cent of world energy production in 2002), the United States (9.8 per cent), Mexico (4.8 per cent), China (4.6 per cent), Canada (3.7 per cent) and Indonesia (1.7 per cent).
Energy self suffi ciency in APEC economiesThe information on total primary energy consumption and energy produc-tion in fi gures 1 and 2, respectively may be used to derive estimates of the energy self suffi ciency of each APEC economy. Energy self suffi ciency, calculated as energy production divided by energy consumption and pre-sented in percentage terms, provides an indication of the extent to which each APEC economy is able to meet domestic energy requirements from domestic sources.
In 2002, energy self suffi ciency in the APEC region was 91 per cent, indi-cating that the level of energy production was insuffi cient to cover the APEC region’s energy requirements in the corresponding time period (table 8). Notably, there is substantial variation in energy self suffi ciency both between income groups and within each group. Energy self suffi ciency in the high income economies was only 73 per cent in 2002, compared with 133 per cent in the middle income economies and 102 per cent in the low income economies (110 per cent excluding China).

64 Energy security in APEC
8 Self suffi ciency in energy and specifi c fuel types, by APEC economy, 2002 a
Coal Oil Gas Nuclear Renewables Total b
% % % % % %
United States 102 40 83 100 100 73Canada 118 158 204 100 100 154Australia 376 96 143 – 100 226Hong Kong, China 0 0 0 – 89 0Japan 0 0 4 100 100 19Singapore 0 0 0 – 100 0Chinese Taipei 0 0 10 100 100 12New Zealand 219 27 100 – 100 83
Republic of Korea 3 1 0 100 100 18Brunei Darussalam – 1 522 657 – 100 933Chile 11 4 29 – 100 36Malaysia 4 153 179 – 101 155Mexico 69 186 84 100 100 146Russian Federation 110 295 147 100 100 167
Thailand 63 24 73 – 100 54Peru 2 71 100 - 100 77China 109 69 106 100 100 99Philippines 16 2 100 – 100 52Indonesia 354 111 200 – 100 154Viet Nam 161 174 100 – 100 125Papua New Guinea na na na na na na
APEC c 105 67 108 100 100 91High income 102 39 89 100 100 73
Middle income 76 168 136 100 100 133
Low income 114 71 132 100 100 102– excl. China 207 74 146 – 100 110
World 100 102 100 100 100 101
a Energy production as a percentage of total primary energy consumption (TPEC), based on IEA data. b Includes minor adjustments in electricity and heat for Canada and Hong Kong. c APEC total excludes Papua New Guinea. na Not available.Sources: Based on IEA (2004a,b).

Energy security in APEC 65
Importantly, the energy shortfall within the APEC region refl ects an oil self suffi ciency of 67 per cent in 2002, with regional production slightly exceeding consumption for both coal (self suffi ciency of 105 per cent in 2002) and gas (108 per cent).
Oil self suffi ciency is particularly low in the high income group (39 per cent) but there is also a substantial shortfall in the low income group (71 per cent, or 74 per cent excluding China). By contrast, the middle income group has substantial oil production in excess of domestic consumption requirements (168 per cent). In 2002, high income economies had a slight shortfall in gas (89 per cent), while middle income economies had a shortfall in coal.
The diversity in the experience of individual APEC economies in self suf-fi ciency for specifi c major fuel types is indicated in fi gure 3.
There are twelve APEC economies that recorded an energy self suffi ciency below 100 per cent in 2002 — six from the high income group, two from the middle income group and four from the low income group (although China is almost self suffi cient). Of these, seven economies were not self suffi cient in coal, oil or gas (table 9). Notably, fi ve economies have very low or zero self suffi ciency levels for each of these major fuel types — these include Hong Kong, Japan, Singapore, Chinese Taipei and Chile. A further three APEC economies were self suffi cient in one specifi c fuel type, and two economies were self suffi cient in two specifi c fuel types. None of the APEC economies with an energy self suffi ciency below 100 per cent were self suffi cient in oil.
Energy self suffi ciency in the other eight APEC economies for which data are available ranged from 125 per cent in Viet Nam to 933 per cent in Bru-nei. Of these, one economy was self suffi cient in only one fuel type (oil in Mexico), a further three economies were self suffi cient in two fuel types and four economies were self suffi cient in each of the three major fuel types.
Self sufficiency in energy and specific fuel types, 2002APEC economies (excluding Brunei)
3
0 100 200 25015050
Oil,
gas
and
coa
l sel
f suf
ficie
ncy
(%)
Energy self sufficiency (%)
0
100
200
300OilGasCoal

66 Energy security in APEC
9 Self suffi ciency of APEC economies in energy and specifi c major fuel types (coal, oil and gas), by income category, 2002 a
Number of specifi c fuel types in which each economy is self suffi cient: coal (c), oil (o) and gas (g) Total 0 1 2 3 no. no. no. no. no.
Economies with total energy self suffi ciency below 100 per centHigh income 4 1 1 0 6 Hong Kong United States (c) New Zealand (c,g) Japan Singapore Chinese Taipei
Middle income 2 0 0 0 2 Korea Chile
Low income 1 2 1 0 4 Thailand Peru (g) China (c,g) Philippines (g)
Total 7 3 2 0 12
Economies with total energy self suffi ciency equal to 100 per cent or moreHigh income 0 0 1 1 2 Australia (c,g) Canada
Middle income 0 1 2 1 4 Mexico (o) Brunei (o,g) Russia Malaysia (o,g)
Low income 0 0 0 2 2 Indonesia Viet Nam
Total 0 1 3 4 8
APEC economiesHigh income 4 1 2 1 8
Middle income 2 1 2 1 6
Low income 1 2 1 2 6
Total 7 4 5 4 20
a Excludes Papua New Guinea due to lack of data.Sources: Based on IEA (2004a,b).

Energy security in APEC 67
Seven of the eight economies were self suffi cient in oil, ranging from 111 per cent in Indonesia to 1522 per cent in Brunei. The remaining economy, Australia, recorded an oil self suffi ciency of 96 per cent in 2002. That is, all APEC economies with an energy self suffi ciency that exceeded 100 per cent were self suffi cient in, or close to being self suffi cient in, oil.
The extent to which the APEC region’s self suffi ciency position in energy, particularly oil, is projected to change over the longer term is a major issue from an energy security perspective.
APEC energy tradeEnergy import dependence in the APEC region is an alternative measure that provides an indication of the extent to which an economy relies on international markets to satisfy domestic energy requirements in a given time period. An energy self suffi ciency below 100 per cent indicates that domestic energy consumption exceeds domestic production and requires net energy imports to supply the shortfall and/or a reduction in domestic energy stocks (noting also that petroleum products are also used in inter-national shipping, and are recorded in the energy accounts as international marine bunkers).
Net energy exports of APEC economies in 2002 are presented in absolute terms in fi gure 4 and as a percentage of total primary energy consumption in fi gure 5. Net energy imports are indicated by a negative number in the fi gures, consistent with the balance of payments approach whereby imports are regarded as a cost to the economy while exports provide revenue. Net energy imports in the APEC region were 575 Mtoe in 2002, with net energy imports from high income economies (931 Mtoe) outweighing net energy exports from middle income economies (339 Mtoe) and low income econo-mies (17 Mtoe, or 35 Mtoe excluding China) (table 10).
The overall APEC energy trade defi cit is mainly driven by the substantial net oil imports in high income economies (872 Mtoe) and, to a much lesser extent, low income economies (110 Mtoe, or 33 Mtoe excluding China). High income economies are also net gas importers (63 Mtoe), while middle income economies are net coal importers (37 Mtoe).
The size of the energy trade position varies widely between APEC econo-mies. In 2002, the three largest net energy importing economies were the
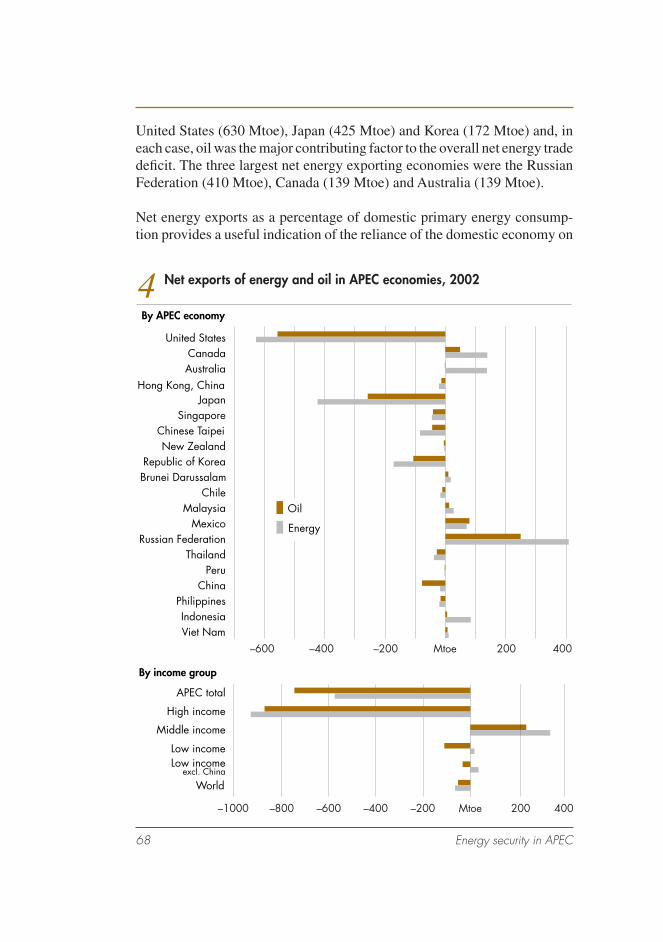
68 Energy security in APEC
United States (630 Mtoe), Japan (425 Mtoe) and Korea (172 Mtoe) and, in each case, oil was the major contributing factor to the overall net energy trade defi cit. The three largest net energy exporting economies were the Russian Federation (410 Mtoe), Canada (139 Mtoe) and Australia (139 Mtoe).
Net energy exports as a percentage of domestic primary energy consump-tion provides a useful indication of the reliance of the domestic economy on
Net exports of energy and oil in APEC economies, 20024By APEC economy
By income group
Viet NamIndonesia
PhilippinesChina
PeruThailand
Russian FederationMexico
MalaysiaChile
Republic of KoreaNew Zealand
Chinese TaipeiSingapore
JapanHong Kong, China
AustraliaCanada
United States
World
Low income excl. China
Low income
Middle income
High income
APEC total
–400–600 Mtoe 200–200 400
–800 –600–1000 –400 –200 Mtoe 200 400
Energy
Oil
Brunei Darussalam

Energy security in APEC 69
imported energy sources in the case of net energy importers, and the size of the export market relative to the domestic market in the case of net energy exporters.
In 2002, 10 per cent of APEC’s primary energy consumption was sourced from net imports. Notably, 28 per cent of primary energy consumption in high income economies was sourced from net imports, while net energy
Net exports of energy and oil as a percentage of consumption in APEC economies, 2002 excluding Brunei5
By APEC economy
By income group
Viet NamIndonesia
PhilippinesChina
PeruThailand
Russian FederationMexico
MalaysiaChile
Republic of KoreaNew Zealand
Chinese TaipeiSingapore
JapanHong Kong, China
AustraliaCanada
United States
World
Low income excl. China
Low income
Middle income
High income
APEC total
–150 –100 –50–200 % 50 100 150 200
–150 –100 – 50–200 % 50 100 150 200
Energy
Oil

70 Energy security in APEC
10 Net energy exports, by fuel type and by APEC economy, 2002 a
Net exports as % of consumption Net exports of corresponding fuel type
Coal Oil Gas Total b Coal Oil Gas Total b
Mtoe Mtoe Mtoe Mtoe % % % %
United States 12 –558 –81 –630 2 –62 –15 –27Canada 4 49 85 139 12 57 113 56Australia 131 –2 9 139 269 –5 43 123Hong Kong, China –5 –13 –2 –21 –100 –159 –100 –130Japan –103 –258 –64 –425 –103 –101 –97 –82Singapore 0 –41 –4 –45 –100 –191 –100 –177Chinese Taipei –34 –44 –6 –84 –103 –103 –90 –90New Zealand 1 –5 0 –4 109 –81 0 –21
Republic of Korea –44 –106 –21 –172 –96 –104 –98 –84Brunei Darussalam 0 10 8 18 – 1 429 556 835Chile –2 –10 –4 –17 –82 –106 –71 –67Malaysia –2 13 17 28 –94 50 79 53Mexico –3 80 –6 71 –43 86 –16 45
Russian Federation 15 250 144 410 14 195 44 66Thailand –3 –28 –6 –38 –37 –75 –27 –45Peru –1 –2 0 –3 –94 –32 0 –25China 57 –77 2 –17 8 –32 6 –1Philippines –4 –16 0 –20 –85 –98 0 –48Indonesia 46 6 33 85 254 11 100 54Viet Nam 3 7 0 11 61 74 0 25Papua New Guinea na na na na na na na na
APEC c 67 –746 103 –575 4 –36 8 –10High income 6 –872 –63 –931 1 –64 -9 –28
Middle income –37 237 138 339 –22 66 33 32
Low income 98 –110 29 17 13 –30 32 1– excl. China 41 –33 27 35 107 –26 46 10
World –11 –52 –1 –65 0 –1 0 –1
a Net exports (imports) are indicated by a positive (negative) number. b Includes small quantities of combustible renewables and waste, and electricity. c APEC total excludes Papua New Guinea. na Not available. Sources: IEA (2004a,b).
Energy security in APEC 71
exports represented 32 and 1 per cent of primary energy consumption in middle and low income economies respectively (or 10 per cent in low income economies excluding China).
The APEC economies that rely on energy imports to meet a large part, or all, of domestic energy requirements are consistent with the economies identi-fi ed in the previous section with low, or zero, energy self suffi ciency (see tables 8 and 9). In some cases, net energy imports exceed domestic energy requirements in the same year, indicating energy stocks have increased dur-ing the period (see for example Singapore and Hong Kong). Conversely, APEC economies with net energy exports have levels of self suffi ciency above 100 per cent.

72 Energy security in APEC
energy security risks and market volatility in the APEC regionIn general terms, energy security refers to the reliable and adequate supply of energy at reasonable prices. From the APEC Energy Security Initiative, potential disruptions to world oil supply remain the major energy security risk in the region. The Middle East and Africa — regions where geopoliti-cal risks are relatively high — are likely to become more important sources of world oil production over the medium to longer term. However, oil is an important energy requirement in all APEC economies and is particularly important for transport where there are limited alternative technologies (or substitution possibilities).
Any risk assessment of temporary energy supply disruptions in the APEC region requires information on:
■ the likelihood of potential energy supply disruptions occurring and
■ the damage or cost of each potential disruption.
Energy supply disruptions may occur at any point in the energy supply line (upstream, downstream or transport/distribution) and originate at a range of geographic locations affecting one or more fuel types. Disruptions may occur in isolation or simultaneously. Temporary energy supply disruptions may be caused by a range of factors:
■ war, civil unrest, acts of terrorism or piracy on key sea lanes, a major focus of energy security concerns in the APEC Energy Security Initia-tive, may disrupt energy exploration, production, processing or trans-port activities with the potential to have a major impact on world energy markets. (Disruptions to oil production in the Middle East is the most notable example, although the potential for signifi cant disruptions in world LNG trade is indicated by the experience in Indonesia where gas exploration and LNG production have been disrupted in recent years by security concerns relating to civil unrest in the Aceh province.)
■ natural events, such as earthquakes, hurricanes, fl oods and forest or bush fi res, may cause major energy infrastructure damage, although the damage typically occurs at the local or regional level.
4

Energy security in APEC 73
■ accidents or technical factors, such as plant breakdown, may disrupt energy supply, although it should be noted that plant shutdown may be anticipated and occurs as part of a regular maintenance program. (An example of unanticipated plant shutdowns is the recent experience in Japan’s nuclear power industry where the government has undertaken an assessment of compliance with safety policies to reduce the risk of a future larger disruption in that industry.)
■ market factors, such as production decisions and instability associated with major producer groups or cartels, may have signifi cant implica-tions for the world energy market (most notably, OPEC decisions in the 1970s).
■ policy factors, such as unintended consequences associated with energy market reform, may distort energy production and pricing outcomes to some extent (as occurred in recent years in California).
If the magnitude and duration of a disruption is signifi cant and unantici-pated, there will be consequent direct economic costs for associated con-version and end use activities with fl ow-on implications for other economic activities. In chapters 5 and 6, ABARE’s global trade and environment model (GTEM) is used to quantify the macroeconomic, industry and trade effects of temporary disruptions to oil and LNG production in the Middle East, and a temporary closure to the Strait of Malacca (a critical chokepoint in sea lane access to east Asian markets). Some key policy implications of energy security risks are then examined in chapter 7.
The objective in this chapter is to present relevant information that may contribute to energy security risk assessments that are undertaken by indi-vidual APEC economies and that may further contribute to joint assess-ments within the APEC forum. Information is provided on sources of vola-tility and downside risks in the energy markets of APEC economies. Based on the historical experience of twenty APEC economies (excludes Papua New Guinea), linkages between output and energy consumption growth are noted (and shown in fi gure 6 and table 11), and sources of variability in energy markets are examined.
Other aspects relevant to an assessment of energy security risks that are also considered include world energy resource availability and concentration of energy supply in high risk areas. Information on chokepoints in world oil transit and related sea lane security issues is provided in APERC (2002a).

74 Energy security in APEC
Historical growth in output (real GDP) and total primary energy consumption (TPEC) in APEC economies 6
TPECReal GDP
–10
–5
%
5
10
15
–10
–5
%
5
10
15
–10
–5
%
5
10
15
–10
–5
%
5
10
15
–10
–5
%
5
10
15
1972 1982 1992 2002
United States
Australia
Japan
Chinese Taipei
Korea
–10
–5
%
5
10
15
–10
–5
%
5
10
15
–10
10
%
20
30
–10
–5
%
5
10
15
–50
–25
%
25
50
75
1972 1982 1992 2002
Canada
Hong Kong
Singapore
New Zealand
Brunei

Energy security in APEC 75
Historical growth in output (real GDP) and total primary energy consumption (TPEC) in APEC economies 6
TPECReal GDP
–10
–5
%
5
10
–15
–10
–5
%
5
10
15
–10
–5
%
5
10
15
–10
–5
%
5
10
15
–10
–5
%
5
10
15
1972 1982 1992 2002
Chile
Mexico
Thailand
China
Indonesia
–10–5
%
510
20
15
–10
–5
%
5
10
15
–10
–10
–5
%
5
10
15
–10
–5
%
5
10
15
1972 1982 1992 2002
Malaysia
Russia
Peru
Philippines
Viet Nam
–5
%
5
10
15

76 Energy security in APEC
Linkages between output and energy consump-tion growth in APEC economiesEnergy is a key input in all sectors of the economy although, as indicated in the previous chapter, there is considerable variation in dependence on specifi c fuel types. At the national level, the importance of energy use in production is indicated by the relationship between annual growth in output and energy consumption. Annual growth rates in output (measured by real gross domestic product or GDP in domestic currency) and total primary energy consumption (TPEC) since 1972 in twenty APEC economies are presented in fi gure 6.
Descriptive statistics are provided in table 11 for two time periods — 1972 to 1989, which covers the major world oil price shocks in 1973-74 and 1979-80 and the subsequent downward correction during the 1980s, and 1990 to 2002, which covers the more recent period. The summary infor-mation that is provided on the annual percentage change in each variable includes:
■ average (or mean) – the simple unweighted sum of the annual percent-age change in each variable divided by the number of years.
■ standard deviation – a measure of dispersion or variability of the annual percentage changes around the average (a larger standard devia-tion indicates greater dispersion in annual growth around the average over the time period).
■ coeffi cient of variation – a measure of dispersion that is adjusted for the average growth rate, calculated as the standard deviation divided by the mean (a larger coeffi cient of variation indicates greater variability in annual growth, relative to the average, over the time period).
■ correlation coeffi cient – a measure of the association between output and energy consumption growth rates (the correlation coeffi cient ranges from –1.0, indicating fl uctuations in growth rates are perfectly nega-tively related, to 1.0, indicating fl uctuations in growth rates are perfectly positively related; a correlation coeffi cient of 0 indicates that there is no relationship between output and energy consumption growth rates over the time period).
The average growth rates in both output and energy consumption vary considerably between APEC economies and time periods (as noted in the

Energy security in APEC 77
footnotes to table 11, the time period referred to varies in a small number of cases owing to lack of data). In fourteen APEC economies, the average output growth rate for the period 1990–2002 was lower than for the period 1972–89. By contrast, in eight APEC economies, the average growth rate in total primary energy consumption for the period 1990–2002 was lower than for the period 1972–89.
In the majority of APEC economies, output growth rates tended to be higher on average than energy consumption growth rates. However, the number of
11 Descriptive statistics for historical growth in output (real GDP) and total primary energy consumption (TPEC) in APEC economies a
Standard Coeffi cient Correlation Average deviation of variation coeffi cient
Real Real Real GDP TPEC GDP TPEC GDP TPEC
% % % % no. no. no.1972–89United States 3.3 1.2 2.5 3.3 0.8 2.7 0.9Canada 3.8 2.5 2.2 2.7 0.6 1.1 0.7Australia 3.3 2.8 2.0 2.7 0.6 1.0 0.3Hong Kong, China 8.3 6.8 5.0 5.1 0.6 0.8 0.0Japan 4.2 2.5 2.3 4.4 0.6 1.7 0.7Singapore 7.8 7.2 3.5 8.0 0.5 1.1 0.5Chinese Taipei b 8.1 5.9 2.9 5.5 0.4 0.9 0.4New Zealand 2.6 3.6 2.5 4.7 1.0 1.3 0.1
Republic of Korea 8.0 9.1 3.3 4.8 0.4 0.5 0.6Brunei Darussalam c –0.4 2.2 1.9 30.4 –4.4 13.8 0.7Chile 2.5 2.3 7.2 5.5 2.9 2.4 0.9Malaysia 6.9 7.2 3.5 7.6 0.5 1.0 0.0Mexico 4.3 5.9 4.2 4.9 1.0 0.8 0.9Russian Federation na na na na na na na
Thailand 7.3 5.8 2.9 5.2 0.4 0.9 0.5Peru 1.9 0.6 6.5 4.1 3.5 6.6 0.8China d 9.6 3.1 3.4 2.2 0.4 0.7 0.8Philippines 3.8 3.2 4.4 4.7 1.2 1.5 0.5Indonesia 6.7 4.8 2.4 2.7 0.4 0.6 0.4Viet Nam b 5.0 2.4 3.6 1.8 0.7 0.7 -0.6
continued

78 Energy security in APEC
economies where the average energy consumption growth rate exceeded the average output growth rate increased from fi ve in the period 1972–89, to nine in the period 1990–2002 — this would imply an increase in the energy intensity of these economies over the corresponding time period. In the recent period, six of the nine APEC economies where average energy
11 Descriptive statistics for historical growth in output (real GDP) and total primary energy consumption (TPEC) in APEC economies a continued
Standard Coeffi cient Correlation Average deviation of variation coeffi cient
Real Real Real GDP TPEC GDP TPEC GDP TPEC
% % % % no. no. no.1990–2002United States 2.9 1.2 1.5 1.5 0.5 1.3 0.6Canada 2.7 1.1 2.2 2.2 0.8 2.0 0.5Australia 3.3 2.2 1.6 2.3 0.5 1.1 0.4Hong Kong, China 4.0 3.4 3.6 8.3 0.9 2.5 –0.6Japan 1.5 1.7 1.8 2.4 1.2 1.4 0.7Singapore 6.7 8.3 4.4 13.8 0.7 1.7 0.5Chinese Taipei 5.5 5.7 2.6 1.3 0.5 0.2 –0.2
New Zealand 2.7 2.4 2.3 2.2 0.9 0.9 0.1Republic of Korea 6.1 7.6 4.3 5.8 0.7 0.8 0.8Brunei Darussalam 1.8 5.0 2.0 14.4 1.2 2.9 0.2Chile 5.7 5.2 3.6 4.7 0.6 0.9 0.2Malaysia 6.6 7.7 5.1 7.9 0.8 1.0 0.6Mexico 3.1 2.1 3.5 2.1 1.1 1.0 0.7
Russian Federation e –0.7 –2.1 7.3 4.5 –10.6 –2.1 0.9Thailand 5.0 6.3 5.8 5.0 1.2 0.8 0.9Peru 3.3 1.3 4.4 4.2 1.3 3.2 0.4China 9.3 3.2 2.9 3.1 0.3 1.0 0.2Philippines 2.9 4.1 2.2 4.5 0.7 1.1 0.7Indonesia 4.3 5.3 5.7 4.5 1.3 0.8 0.5Viet Nam 6.7 4.6 2.1 2.2 0.3 0.5 0.4
a Average (mean) of the annual percentage change in real gross domestic product (GDP) in domestic currency and total primary energy consumption (TPEC) over the period indicated. Standard deviation is a measure of dispersion around the mean. Coeffi cient of variation is the standard deviation divided by the mean. Correlation coeffi cient is a measure of the association between fl uctuations in output and energy consumption, and ranges between –1.0 and 1.0. b Data for the period 1980–89. c Data for the period 1985–89. d Data for the period 1979–89. e Data for the period 1993–2002. na Not available.Source: Based on IMF (2004a), IEA (2004a,b).

Energy security in APEC 79
consumption growth exceeded average output growth were not energy self suffi cient in 2002 — these include Japan, Singapore, Chinese Taipei, Korea, Thailand and the Philippines (the extent to which these economies are not self suffi cient is indicated in tables 8 and 9).
The coeffi cient of variation is a useful measure of variability that accounts for differences in average growth rates. Based on this measure, in most APEC economies, annual growth in energy consumption was more variable than annual output growth (that is, the coeffi cient of variation was higher for energy consumption than for output in most APEC economies) — this is consistent with a visual inspection of fi gure 6. The number of economies where variability in output growth exceeded variability in energy consump-tion growth increased from two (Chile and Mexico) in the period 1972–89 to four (Chinese Taipei, Mexico, Thailand and Indonesia) in the period 1990–2002.
The correlation coeffi cient is a useful summary measure of the association between fl uctuations in any two time series over a specifi ed time period. In each time period, eleven APEC economies recorded a correlation coef-fi cient of 0.5 or higher, which may be considered to provide an indication of a relatively strong positive association between fl uctuations in economic growth rates and fl uctuations in energy consumption growth rates. Correla-tion coeffi cients of between 0.7 and 0.9 were recorded for several APEC economies in each time period. In a small number of economies, the corre-lation coeffi cient was close to zero or negative, indicating a minor or nega-tive contemporaneous relationship between output and energy consumption growth rates.
Energy intensity in APEC economiesEnergy intensity measures provide an indication of the importance of energy consumption in national output. By expressing national output in US dol-lars, it is possible to compare the energy intensity of individual APEC econ-omies. A higher energy intensity indicates that an economy is relatively more reliant on energy as an input to production, suggesting that the costs of disruptions to energy users in these economies tend to be higher than in economies that are less energy reliant (all else constant).
The intensity of APEC economies with respect to total energy, oil and elec-tricity use in 2002 is presented in fi gure 7.
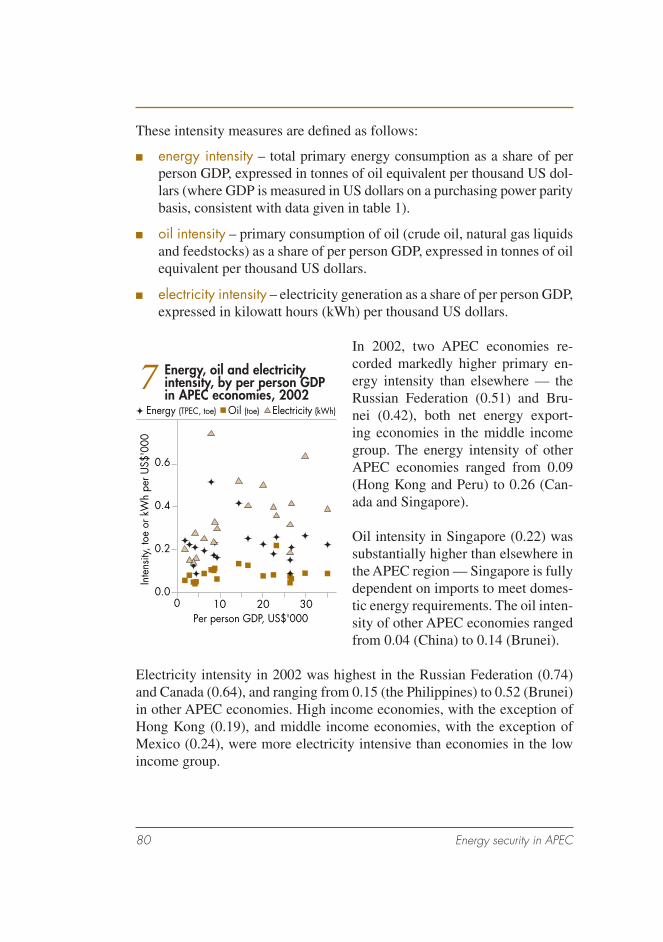
80 Energy security in APEC
These intensity measures are defi ned as follows:
■ energy intensity – total primary energy consumption as a share of per person GDP, expressed in tonnes of oil equivalent per thousand US dol-lars (where GDP is measured in US dollars on a purchasing power parity basis, consistent with data given in table 1).
■ oil intensity – primary consumption of oil (crude oil, natural gas liquids and feedstocks) as a share of per person GDP, expressed in tonnes of oil equivalent per thousand US dollars.
■ electricity intensity – electricity generation as a share of per person GDP, expressed in kilowatt hours (kWh) per thousand US dollars.
In 2002, two APEC economies re-corded markedly higher primary en-ergy intensity than elsewhere — the Russian Federation (0.51) and Bru-nei (0.42), both net energy export-ing economies in the middle income group. The energy intensity of other APEC economies ranged from 0.09 (Hong Kong and Peru) to 0.26 (Can-ada and Singapore).
Oil intensity in Singapore (0.22) was substantially higher than elsewhere in the APEC region — Singapore is fully dependent on imports to meet domes-tic energy requirements. The oil inten-sity of other APEC economies ranged from 0.04 (China) to 0.14 (Brunei).
Electricity intensity in 2002 was highest in the Russian Federation (0.74) and Canada (0.64), and ranging from 0.15 (the Philippines) to 0.52 (Brunei) in other APEC economies. High income economies, with the exception of Hong Kong (0.19), and middle income economies, with the exception of Mexico (0.24), were more electricity intensive than economies in the low income group.
Energy, oil and electricity intensity, by per person GDP in APEC economies, 2002
7
Inte
nsity
, toe
or k
Wh
per U
S$'0
00
0 10 20 30Per person GDP, US$'000
0.0
0.2
0.4
0.6
Energy (TPEC, toe) Oil (toe) Electricity (kWh)

Energy security in APEC 81
Sources of variability in the energy markets of APEC economiesIt is beyond the scope of this study to undertake a detailed assessment of historical temporary energy supply disruptions and their impact on the APEC region. However, information on the major sources of variability in the energy markets of twenty APEC economies (excluding Papua New Guinea) is provided in this section based on a decomposition of annual growth in total primary energy consumption and total fi nal energy con-sumption between 1972 and 2002.
This decomposition analysis is described briefl y below and descriptive sta-tistics for two time periods, 1972–89 and 1990–2002, are presented. Some emphasis is placed on the most important sources of variability and negative contributions to energy consumption growth. It should be noted, however, that realised energy consumption levels are the outcome of both supply and demand conditions — that is, not all periods of slower or negative growth in energy consumption are caused by temporary supply disruptions in the energy sector.
There are some technical aspects to the statistical analysis presented in this section. As a consequence, readers may prefer to read the nontechnical over-view of this in the summary to this report, and skip to the next section.
Decomposition of growth in total primary energy consumptionThere are two aspects to the decomposition of annual growth in total pri-mary energy consumption that are of interest in the study:
■ decomposition by primary fuel type – the percentage point contribu-tion of primary fuel types to the annual percentage change in total pri-mary energy consumption (for example, the percentage point contribu-tion of oil to TPEC growth is equal to oil consumption in the current year divided by TPEC in the previous year, multiplied by 100).
■ decomposition by supply source – the percentage point contribution of supply source to the annual percentage change in total primary energy consumption, where supply source covers domestic production, net imports and stock drawdown (where net imports is imports less exports less international marine bunkers).

82 Energy security in APEC
Annual data over the period 1972–2002 for each decomposition of annual growth in total primary energy consumption in twenty APEC economies are provided in appendix B. For example, in Australia, TPEC increased by 4.0 per cent in 2002 due to growth in consumption of coal (contributing 0.6 percentage points to TPEC growth), oil (1.4 percentage points), gas (0.3 percentage points) and other fuel types (1.7 percentage points) — that is, the sum of the percentage point contributions of fuel types (or supply sources) equals TPEC growth (see table 27).
Descriptive statistics are presented to summarise some of the key character-istics in this decomposition analysis and include most importantly:
■ average (or mean) – the average annual percentage change or percent-age point contribution (that is, the simple unweighted sum of the annual percentage change or percentage point contribution in each variable divided by the number of years).
■ standard deviation – a measure of dispersion or variability of the annual percentage change or percentage point contribution of a variable around its average (a larger standard deviation indicates greater disper-sion around the average over the time period).
■ minimum – the lowest annual percentage change or percentage point contribution of a variable within the specifi ed time period.
■ % years < 0 – the percentage of years in the specifi ed time period in which a variable records a negative annual percentage change or per-centage point contribution (that is, the number of years in which a vari-able records a negative annual percentage change or percentage point contribution, calculated as a percentage of the total number of years within the specifi ed time period).
■ correlation coeffi cient – a measure of the association over time between the annual energy consumption growth rate and the percentage point contribution of a variable (as noted previously, the correlation coeffi -cient ranges from –1.0 for a perfect negative association to 1.0 for a perfect positive association).
An overview of the descriptive statistics for the decomposition of TPEC growth by fuel type is provided in fi gure 8 — in this fi gure, the average per-centage point contribution of each fuel type is graphed against each of the other four descriptive statistics given above for each time period. Descrip-tive statistics are provided in table 12 for the two subperiods.

Energy security in APEC 83
Overview of descriptive statistics for the percentage point contributionsof fuel types to TPEC growth in APEC economies excludes Brunei and PNG8
Average vs standard deviation1972–1989 1990–2002
–2
0
2
4
6
8 8
Average vs standard deviation
–2
0
2
4
6
–2
0
2
4
6
8
–2
0
2
4
6
8
–2
0
2
4
6
8
-2
0
2
4
6
8
–2
0
2
4
6
8
Coal Oil Gas Nuclear Other
–2
0
2
4
6
8
Average vs minimum Average vs minimum
Average vs % years< 0 Average vs % years <0
Average vs correlation coefficient Average vs correlation coefficient
Standard deviation (% points) Standard deviation (% points)0 5 10 15 0 5 10 15
–20 –15 –10 –5 0 5
Minimum (% points)
–20 –15 –10 –5 0 5
Minimum (% points)
0 25 50 75 100
% years < 0
0 25 50 75 100
% years < 0
–1.0 –0.5 0.0 0.5 1.0Correlation coefficient (no.)
–1.0 –0.5 0.0 0.5 1.0Correlation coefficient (no.)
Ave
rage
(% p
oint
s)
Ave
rage
(% p
oint
s)
Ave
rage
(% p
oint
s)
Ave
rage
(% p
oint
s)
Ave
rage
(% p
oint
s)
Ave
rage
(% p
oint
s)
Ave
rage
(% p
oint
s)
Ave
rage
(% p
oint
s)

84 Energy security in APEC
12 Decomposition of annual growth in total primary energy consumption, by fuel type and supply source Percentage point contributions
By fuel type Total By supply source primary Stock energy con- Pro- Net draw- Coal Oil Gas Nuclear Other sumption duction imports a down
% pt % pt % pt % pt % pt % % pt % pt % ptUnited States1972–89Average 0.6 0.3 -0.2 0.4 0.1 1.2 0.6 0.6 0.1SD b 0.8 2.2 1.1 0.4 0.2 3.3 2.3 2.8 2.1Minimum c -0.9 -4.2 –2.5 –0.3 –0.3 –4.2 –3.6 –5.9 –3.8% years < 0 d 17 39 56 11 22 33 50 39 39Correlation e 0.7 0.9 0.6 0.3 0.1 1.0 0.4 0.7 0.11990–2002Average 0.3 0.3 0.4 0.2 0.0 1.2 0.2 1.0 0.0SD b 0.4 0.9 0.8 0.4 0.3 1.5 1.4 1.4 2.5Minimum c –0.3 –1.8 –1.4 –0.6 –0.9 –2.1 –2.3 –1.1 –4.9% years < 0 d 31 31 31 23 54 15 54 31 46Correlation e 0.6 0.6 0.7 0.0 0.7 1.0 –0.3 0.2 0.7
Canada1972–89Average 0.4 0.3 0.8 0.6 0.4 2.5 3.8 –1.4 0.1SD b 0.6 2.0 1.1 0.6 0.5 2.7 6.3 4.7 2.1Minimum c –1.0 –4.2 –1.2 –0.4 –1.1 –3.6 –4.0 –8.5 –3.5% years < 0 d 22 28 22 22 22 17 33 56 39Correlation e 0.1 0.8 0.7 0.2 0.2 1.0 0.7 –0.2 –0.31990–2002Average 0.1 0.2 0.7 0.0 0.2 1.1 3.8 –2.9 0.1SD b 0.7 1.1 1.0 1.1 0.5 2.2 3.3 2.7 2.0Minimum c –1.5 –2.2 –1.2 –1.2 –0.7 –4.1 –0.6 –8.0 –2.8% years < 0 d 31 31 23 62 31 31 15 92 46Correlation e 0.4 0.5 0.8 0.4 0.3 1.0 0.6 –0.1 0.3
Australia1972–89Average 1.1 0.6 1.0 0.0 0.1 2.8 7.6 -4.6 –0.2SD b 1.8 2.1 0.5 0.0 0.3 2.7 7.1 6.8 6.6Minimum c –3.0 –3.7 0.5 0.0 –0.4 –4.1 –9.0 –20.7 –9.7% years < 0 d 28 39 0 0 44 6 11 72 56Correlation e 0.6 0.7 0.2 – 0.0 1.0 0.2 0.3 –0.11990–2002 Average 1.1 0.3 0.6 0.0 0.3 2.2 8.6 –6.3 –0.2SD b 1.1 1.7 0.6 0.0 0.6 2.3 6.3 5.0 3.6Minimum c –0.5 –3.0 –1.1 0.0 –0.5 –1.3 –1.0 –13.0 –5.2% years < 0 d 15 38 8 0 23 15 15 77 38Correlation e 0.4 0.9 0.1 – 0.6 1.0 –0.4 0.6 0.4

Energy security in APEC 85
12 Decomposition of annual growth in total primary energy consumption, by fuel type and supply source Percentage point contributions
By fuel type Total By supply source primary Stock energy con- Pro- Net draw- Coal Oil Gas Nuclear Other sumption duction imports a down
% pt % pt % pt % pt % pt % % pt % pt % ptHong Kong1972–1989Average 4.5 2.4 0.0 0.0 -0.1 6.8 0.0 6.9 -0.1SD b 5.9 7.0 0.0 0.0 0.2 5.1 0.0 6.5 4.0Minimum c –0.2 –11.3 0.0 0.0 –0.5 –7.8 0.0 –4.9 –5.9% years < 0 d 39 33 0 0 67 6 6 11 56Correlation e 0.2 0.6 – – 0.5 1.0 –0.1 0.8 0.01990–2002 Average –0.4 2.2 1.1 0.0 0.4 3.4 0.0 3.2 0.2SD b 7.0 6.3 3.1 0.0 1.9 8.3 0.0 8.3 1.7Minimum c –14.8 –10.4 –1.2 0.0 –1.5 –12.8 0.0 –11.2 –3.0% years < 0 d 46 38 23 0 62 31 0 23 46Correlation e 0.6 0.8 –0.1 – –0.3 1.0 0.2 1.0 0.1
Japan1972–89Average 0.3 0.8 0.6 0.7 0.1 2.5 0.5 2.0 0.0SD b 1.3 4.5 0.6 0.7 0.3 4.4 0.9 5.4 1.1Minimum c –2.0 –6.5 0.0 –0.6 –0.5 –5.2 –1.2 –7.1 –1.3% years < 0 d 56 44 0 11 33 17 28 39 61Correlation e 0.3 0.9 0.3 –0.3 –0.3 1.0 –0.4 1.0 –0.61990–2002 Average 0.4 0.3 0.4 0.5 0.1 1.7 0.5 1.2 0.1SD b 0.6 1.8 0.3 0.8 0.3 2.4 0.9 2.4 0.7Minimum c –0.9 –1.9 0.0 –1.2 –0.4 –1.0 –1.5 –2.1 –1.5% years < 0 d 15 54 0 23 38 23 23 46 46Correlation e 0.5 0.9 0.7 0.5 0.1 1.0 0.4 0.9 –0.1
Singapore1972–89Average 0.0 7.2 0.0 0.0 0.0 7.2 0.0 9.6 –2.4SD b 0.0 8.0 0.0 0.0 0.1 8.0 0.0 36.3 36.2Minimum c –0.1 –4.9 0.0 0.0 –0.1 –4.9 0.0 –42.2 –62.2% years < 0 d 33 17 0 0 56 17 0 56 44Correlation e 0.2 1.0 – – –0.6 1.0 – 0.1 0.11990–2002 Average 0.0 6.9 1.4 0.0 0.0 8.3 0.0 7.4 1.0SD b 0.0 13.5 2.6 0.0 0.1 13.8 0.1 14.7 8.8Minimum c –0.1 –14.0 –1.2 0.0 0.0 –13.7 0.0 –15.2 –11.4% years < 0 d 23 31 23 0 31 31 0 31 54Correlation e 0.6 1.0 0.2 – –0.2 1.0 –0.1 0.8 0.2

86 Energy security in APEC
12 Decomposition of annual growth in total primary energy consumption, by fuel type and supply source Percentage point contributions
By fuel type Total By supply source primary Stock energy con- Pro- Net draw- Coal Oil Gas Nuclear Other sumption duction imports a down
% pt % pt % pt % pt % pt % % pt % pt % ptChinese Taipei1972–89 Average 1.6 5.4 0.2 1.5 0.1 8.7 1.3 7.0 0.4SD b 2.1 8.0 0.7 2.3 0.4 7.7 2.3 8.7 5.1Minimum c –2.4 –7.9 –0.8 –1.6 –0.6 –7.1 –2.0 –7.1 –8.2% years < 0 d 22 28 39 17 50 11 33 17 50Correlation e 0.1 0.9 0.7 –0.1 –0.4 1.0 0.1 0.8 0.11990–2002 Average 2.4 2.1 0.7 0.4 0.0 5.7 0.3 5.7 –0.2SD b 1.5 1.9 0.6 1.0 0.3 1.3 0.9 2.9 4.1Minimum c –0.8 –1.5 –0.2 –0.9 –0.5 3.9 –0.9 0.2 –7.9% years < 0 d 8 8 15 23 46 0 38 0 62Correlation d –0.3 0.8 0.4 0.1 –0.5 1.0 –0.2 –0.5 0.7
New Zealand1972–89 Average 0.1 0.3 2.1 0.0 1.1 3.6 4.6 –1.0 0.0SD b 1.0 3.1 3.2 0.0 1.9 4.7 4.5 4.5 2.3Minimum c –1.6 –5.1 –4.4 0.0 –2.1 –6.3 –7.1 –7.7 –2.9% years < 0 d 56 50 22 0 33 22 17 50 50Correlation e 0.5 0.8 0.5 – 0.1 1.0 0.8 0.4 –0.21990–2002 Average 0.0 1.1 0.6 0.0 0.7 2.4 1.7 0.7 –0.1SD b 0.7 1.8 2.2 0.0 2.2 2.2 3.4 1.9 1.8Minimum c –1.2 –2.2 –3.2 0.0 –3.0 –2.0 –4.7 –1.3 –3.7% years < 0 d 54 31 46 0 38 15 38 54 62Correlation e 0.5 0.2 0.6 – 0.1 1.0 0.8 –0.4 0.2
Republic of Korea1972–89 Average 2.9 4.6 0.2 1.3 0.0 9.1 2.0 7.0 0.2SD b 2.5 4.7 0.7 1.7 0.1 4.8 2.3 4.4 3.3Minimum c –0.6 –5.7 –0.1 –0.4 –0.2 –1.3 –2.5 1.7 –4.8% years < 0 d 17 17 6 6 39 6 11 0 56Correlation e 0.3 0.8 0.0 0.1 –0.2 1.0 0.1 0.7 0.41990–2002 Average 0.9 4.6 1.0 1.0 0.1 7.6 0.6 7.0 0.0SD b 1.4 6.1 0.6 0.7 0.1 5.8 1.1 6.6 1.8Minimum c –2.6 –10.2 –0.5 0.1 0.0 –8.0 –1.7 –10.3 –3.4% years < 0 d 15 15 8 0 8 8 31 15 31Correlation e –0.2 1.0 0.5 –0.1 –0.3 1.0 –0.4 0.9 0.1

Energy security in APEC 87
12 Decomposition of annual growth in total primary energy consumption, by fuel type and supply source Percentage point contributions
By fuel type Total By supply source primary Stock energy con- Pro- Net draw- Coal Oil Gas Nuclear Other sumption duction imports a down
% pt % pt % pt % pt % pt % % pt % pt % ptBrunei Darussalam 1972–89Average 0.0 1.7 16.0 0.0 0.0 17.7 235.3 –239.2 21.5SD b 0.0 14.3 37.5 0.0 0.1 41.0 596.9 642.1 136.7Minimum c 0.0 –44.3 –33.0 0.0 –0.1 –36.8 –191.2 –2060.7 –117.1% years < 0 d 0 39 28 0 11 28 33 44 44Correlation e – 0.4 0.9 – 0.5 1.0 0.5 –0.3 –0.21990–2002 Average 0.0 1.8 3.2 0.0 0.0 5.0 24.8 –20.0 0.2SD b 0.0 6.9 15.8 0.0 0.0 14.4 38.8 32.9 8.8Minimum cc 0.0 –6.6 –24.8 0.0 –0.1 –27.1 –28.7 –80.9 –15.5% years < 0 d 0 38 46 0 31 38 31 69 54Correlation e – 0.0 0.9 – –0.2 1.0 0.4 –0.1 0.1
Chile1972–89Average 0.5 0.4 0.4 0.0 1.0 2.3 1.2 0.9 0.1SD b 2.3 3.4 1.1 0.0 0.9 5.5 2.7 8.8 4.8Minimum c –4.0 –7.6 –1.2 0.0 –1.3 –9.5 –3.6 –17.5 –9.3% years < 0 d 39 33 33 0 11 28 17 44 56Correlation e 0.8 0.9 0.5 – 0.0 1.0 0.3 0.8 –0.51990–2002 Average 0.2 2.0 1.6 0.0 1.3 5.2 0.6 4.6 0.0SD b 2.9 3.0 2.5 0.0 1.8 4.7 1.7 4.5 2.8Minimum c –3.9 –5.1 –1.3 0.0 –0.9 –4.1 –2.6 –4.1 –3.9% years < 0 d 38 15 23 0 23 15 38 15 54Correlation e 0.7 0.8 0.1 – –0.1 1.0 –0.3 0.8 0.5
Malaysia1972–89Average 0.3 3.5 2.9 0.0 0.6 7.2 19.8 –12.6 0.1SD b 0.8 4.7 5.4 0.0 0.4 7.6 20.2 16.8 4.3Minimum c –0.6 –3.0 –2.6 0.0 –0.3 –0.1 –9.9 –44.2 –10.3% years < 0 d 33 22 28 0 6 6 22 78 56Correlation e 0.1 0.7 0.8 – 0.0 1.0 0.6 –0.3 0.21990–2002 Average 0.3 4.0 3.4 0.0 0.1 7.7 7.8 0.0 –0.1SD b 0.8 6.4 4.8 0.0 0.3 7.9 6.4 5.8 2.8Minimum c –1.2 –5.5 –1.7 0.0 –0.3 –4.7 –4.1 –12.2 –4.8% years < 0 d 23 31 15 0 31 23 8 38 62Correlation e 0.2 0.8 0.6 – –0.4 1.0 0.7 0.5 0.2

88 Energy security in APEC
12 Decomposition of annual growth in total primary energy consumption, by fuel type and supply source Percentage point contributions
By fuel type Total By supply source primary Stock energy con- Pro- Net draw- Coal Oil Gas Nuclear Other sumption duction imports a down
% pt % pt % pt % pt % pt % % pt % pt % ptMexico 1972–89 Average 0.1 4.4 1.0 0.0 0.4 5.9 10.8 –4.8 –0.1SD b 0.4 3.9 1.6 0.0 0.4 4.9 12.7 9.9 0.8Minimum c –0.8 –5.7 –2.4 0.0 –0.2 –5.5 –9.5 –25.5 –1.5% years < 0 d 33 11 17 0 17 11 22 61 56Correlation e 0.0 0.9 0.7 –0.1 0.0 1.0 0.7 –0.4 –0.11990–2002Average 0.2 0.6 1.0 0.1 0.1 2.1 2.2 –0.2 0.1SD b 0.3 2.2 0.9 0.3 0.4 2.1 3.5 3.1 0.9Minimum c –0.2 –4.9 –0.3 –0.3 –0.8 –3.0 –3.8 –5.0 –1.4% years < 0 d 15 23 15 38 31 8 31 62 54Correlation e –0.3 0.9 0.5 –0.4 –0.4 1.0 0.5 0.1 –0.1
Russian Federation 1972–92Average na na na na na na na na naSD b na na na na na na na na naMinimum c na na na na na na na na na% years < 0 d na na na na na na na na naCorrelation e na na na na na na na na na1993–2002Average –0.4 –1.3 –0.5 0.1 –0.1 –2.1 –0.9 –1.4 0.1SD b 1.0 2.2 1.5 0.4 0.3 4.5 5.5 3.0 1.4Minimum c –2.0 –6.7 –3.8 –0.7 –0.6 –12.7 –9.5 –6.9 –2.3% years < 0 d 50 70 50 40 80 70 50 80 40Correlation e 0.6 0.9 0.9 0.9 0.6 1.0 0.8 0.0 0.1
Thailand1972–1989Average 0.6 2.4 1.1 0.0 1.8 5.8 3.9 2.0 0.0SD b 0.9 4.0 1.6 0.0 4.2 5.2 5.3 4.8 2.0Minimum c –0.2 –4.8 –0.4 0.0 –12.2 –7.6 –9.7 –5.9 –4.0% years < 0 d 11 22 11 0 17 6 17 22 44Correlation e 0.4 0.4 0.2 – 0.7 1.0 0.7 0.3 0.11990–2002 Average 0.9 3.3 2.1 0.0 0.0 6.3 2.8 3.3 0.2SD b 1.3 4.0 1.0 0.0 1.4 5.0 2.6 4.6 1.1Minimum c –2.2 –4.6 0.8 0.0 –3.1 –6.3 –1.3 –6.0 –2.6% years < 0 d 8 23 0 0 38 8 23 23 31Correlation e 0.9 0.9 –0.3 – 0.4 1.0 0.5 0.8 –0.1
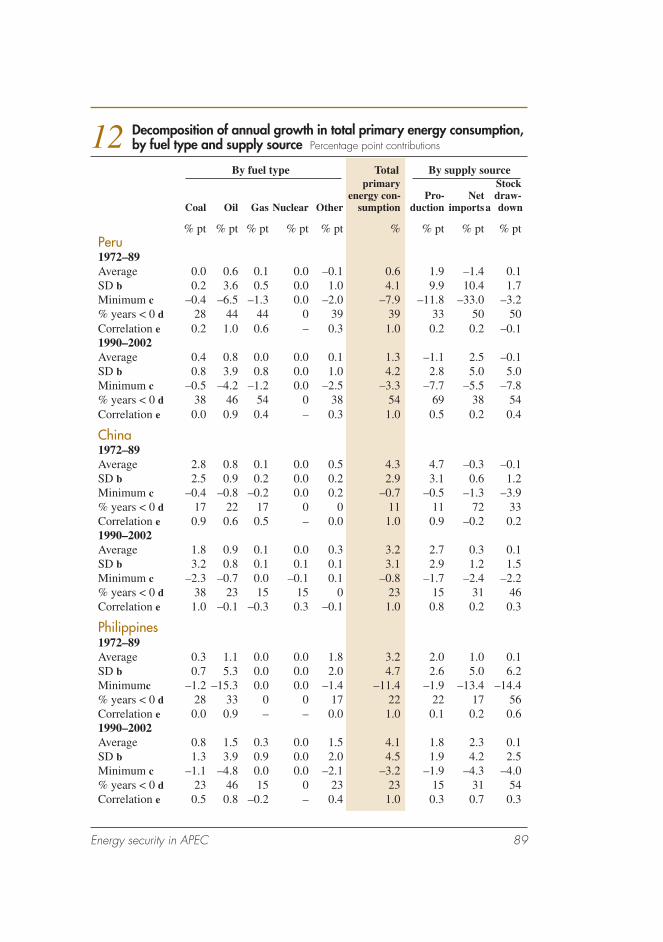
Energy security in APEC 89
12 Decomposition of annual growth in total primary energy consumption, by fuel type and supply source Percentage point contributions
By fuel type Total By supply source primary Stock energy con- Pro- Net draw- Coal Oil Gas Nuclear Other sumption duction imports a down
% pt % pt % pt % pt % pt % % pt % pt % ptPeru1972–89Average 0.0 0.6 0.1 0.0 –0.1 0.6 1.9 –1.4 0.1SD b 0.2 3.6 0.5 0.0 1.0 4.1 9.9 10.4 1.7Minimum c –0.4 –6.5 –1.3 0.0 –2.0 –7.9 –11.8 –33.0 –3.2% years < 0 d 28 44 44 0 39 39 33 50 50Correlation e 0.2 1.0 0.6 – 0.3 1.0 0.2 0.2 –0.11990–2002Average 0.4 0.8 0.0 0.0 0.1 1.3 –1.1 2.5 –0.1SD b 0.8 3.9 0.8 0.0 1.0 4.2 2.8 5.0 5.0Minimum c –0.5 –4.2 –1.2 0.0 –2.5 –3.3 –7.7 –5.5 –7.8% years < 0 d 38 46 54 0 38 54 69 38 54Correlation e 0.0 0.9 0.4 – 0.3 1.0 0.5 0.2 0.4
China1972–89Average 2.8 0.8 0.1 0.0 0.5 4.3 4.7 –0.3 –0.1SD b 2.5 0.9 0.2 0.0 0.2 2.9 3.1 0.6 1.2Minimum c –0.4 –0.8 –0.2 0.0 0.2 –0.7 –0.5 –1.3 –3.9% years < 0 d 17 22 17 0 0 11 11 72 33Correlation e 0.9 0.6 0.5 – 0.0 1.0 0.9 –0.2 0.21990–2002Average 1.8 0.9 0.1 0.0 0.3 3.2 2.7 0.3 0.1SD b 3.2 0.8 0.1 0.1 0.1 3.1 2.9 1.2 1.5Minimum c –2.3 –0.7 0.0 –0.1 0.1 –0.8 –1.7 –2.4 –2.2% years < 0 d 38 23 15 15 0 23 15 31 46Correlation e 1.0 –0.1 –0.3 0.3 –0.1 1.0 0.8 0.2 0.3
Philippines1972–89Average 0.3 1.1 0.0 0.0 1.8 3.2 2.0 1.0 0.1SD b 0.7 5.3 0.0 0.0 2.0 4.7 2.6 5.0 6.2Minimumc –1.2 –15.3 0.0 0.0 –1.4 –11.4 –1.9 –13.4 –14.4% years < 0 d 28 33 0 0 17 22 22 17 56Correlation e 0.0 0.9 – – 0.0 1.0 0.1 0.2 0.61990–2002Average 0.8 1.5 0.3 0.0 1.5 4.1 1.8 2.3 0.1SD b 1.3 3.9 0.9 0.0 2.0 4.5 1.9 4.2 2.5Minimum c –1.1 –4.8 0.0 0.0 –2.1 –3.2 –1.9 –4.3 –4.0% years < 0 d 23 46 15 0 23 23 15 31 54Correlation e 0.5 0.8 –0.2 – 0.4 1.0 0.3 0.7 0.3
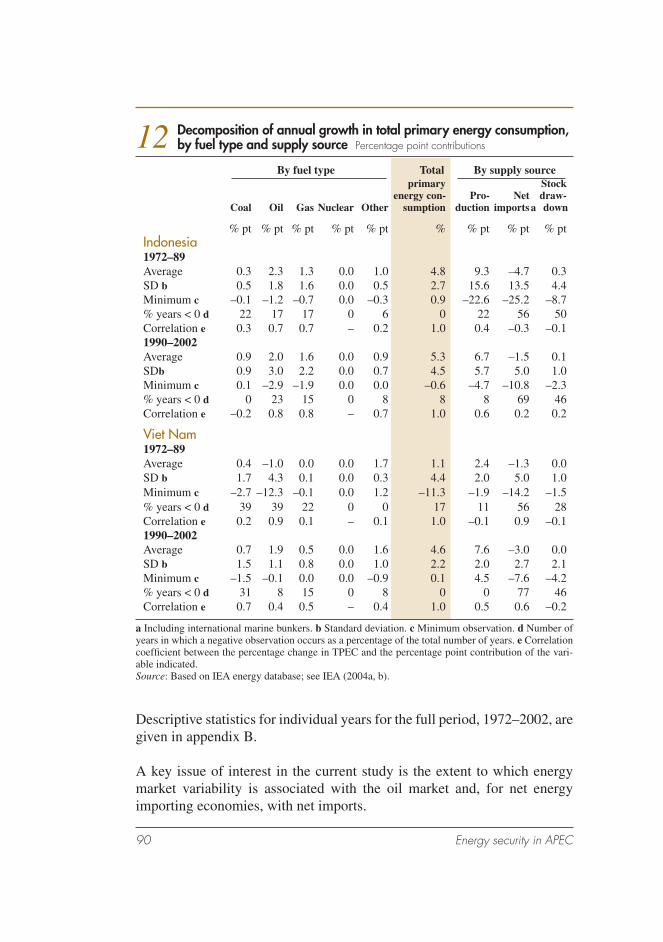
90 Energy security in APEC
Descriptive statistics for individual years for the full period, 1972–2002, are given in appendix B.
A key issue of interest in the current study is the extent to which energy market variability is associated with the oil market and, for net energy importing economies, with net imports.
12 Decomposition of annual growth in total primary energy consumption, by fuel type and supply source Percentage point contributions
By fuel type Total By supply source primary Stock energy con- Pro- Net draw- Coal Oil Gas Nuclear Other sumption duction imports a down
% pt % pt % pt % pt % pt % % pt % pt % ptIndonesia1972–89Average 0.3 2.3 1.3 0.0 1.0 4.8 9.3 –4.7 0.3SD b 0.5 1.8 1.6 0.0 0.5 2.7 15.6 13.5 4.4Minimum c –0.1 –1.2 –0.7 0.0 –0.3 0.9 –22.6 –25.2 –8.7% years < 0 d 22 17 17 0 6 0 22 56 50Correlation e 0.3 0.7 0.7 – 0.2 1.0 0.4 –0.3 –0.11990–2002Average 0.9 2.0 1.6 0.0 0.9 5.3 6.7 –1.5 0.1SDb 0.9 3.0 2.2 0.0 0.7 4.5 5.7 5.0 1.0Minimum c 0.1 –2.9 –1.9 0.0 0.0 –0.6 –4.7 –10.8 –2.3% years < 0 d 0 23 15 0 8 8 8 69 46Correlation e –0.2 0.8 0.8 – 0.7 1.0 0.6 0.2 0.2
Viet Nam1972–89Average 0.4 –1.0 0.0 0.0 1.7 1.1 2.4 –1.3 0.0SD b 1.7 4.3 0.1 0.0 0.3 4.4 2.0 5.0 1.0Minimum c –2.7 –12.3 –0.1 0.0 1.2 –11.3 –1.9 –14.2 –1.5% years < 0 d 39 39 22 0 0 17 11 56 28Correlation e 0.2 0.9 0.1 – 0.1 1.0 –0.1 0.9 –0.11990–2002Average 0.7 1.9 0.5 0.0 1.6 4.6 7.6 –3.0 0.0SD b 1.5 1.1 0.8 0.0 1.0 2.2 2.0 2.7 2.1Minimum c –1.5 –0.1 0.0 0.0 –0.9 0.1 4.5 –7.6 –4.2% years < 0 d 31 8 15 0 8 0 0 77 46Correlation e 0.7 0.4 0.5 – 0.4 1.0 0.5 0.6 –0.2
a Including international marine bunkers. b Standard deviation. c Minimum observation. d Number of years in which a negative observation occurs as a percentage of the total number of years. e Correlation coeffi cient between the percentage change in TPEC and the percentage point contribution of the vari-able indicated. Source: Based on IEA energy database; see IEA (2004a, b).
Energy security in APEC 91
Some key observations are made in the following discussion, although it should be emphasised that the descriptive statistics should be interpreted with some caution and are specifi c to the circumstances of individual APEC economies. For example, data for the Russian Federation, which are avail-able only for 1993–2002, indicate an upward trend in energy consumption growth rates. Hence the measures of dispersion (standard deviation) and downside contributions (minimum and % years < 0) should ideally be inter-preted against this background.
Decomposition by primary fuel typeNot all APEC economies consume all primary fuel types. Nuclear power did not contribute to TPEC growth in China in the period 1972–89 or in twelve APEC economies in either time period (including Australia, Hong Kong, Singapore, New Zealand, Brunei, Chile, Malaysia, Thailand, Peru, the Philippines, Indonesia and Viet Nam). In the earlier period, gas was not consumed in three APEC economies (Hong Kong, Singapore and the Phil-ippines) and coal was not consumed in Brunei.
AverageAnnual growth in TPEC may be averaged over some specifi ed time period to provide an indication (or summary measure) of the overall strength of TPEC growth during the period. The average percentage point contribution of a fuel type provides an indication (or summary measure) of the extent to which consumption of that fuel type has contributed to average TPEC growth during the period.
For example, in Australia, TPEC increased on average by 2.5 per cent a year over the period 1972–2002 as a result of increased consumption of coal (1.1 percentage points), oil (0.5 percentage points), gas (0.8 percentage points) and other fuel types (0.1 percentage points) (see table 27).
In a small number of cases, the average percentage point contribution of a primary fuel type to TPEC growth was negative — gas in the United States (–0.2 percentage points for the period 1972–89), coal in Hong Kong (–0.4, 1990–2002), all fuel types except nuclear in the Russian Federation (rang-ing from –1.3 to –0.1, 1993–2002) and oil in Viet Nam (–1.0, 1972–89).
In all other cases, the average percentage point contribution of each pri-mary fuel type to TPEC growth was positive. Oil provided the highest (or

92 Energy security in APEC
equal highest) percentage point contribution, on average, to TPEC growth in eleven APEC economies over the period 1990–2002 (nine APEC econo-mies over the period 1972–89). In some of these APEC economies, the per-centage point contribution of oil was substantially higher than that for other fuel types (see, for example, Singapore, Korea and Thailand).
Coal, gas, nuclear and other (mainly renewables) provided the highest (or equal highest) percentage point contribution, on average, to TPEC growth in three, four, two and one APEC economies respectively in the period 1990–2002 (four, three, zero and three economies respectively in the period 1972–89; note the earlier period is based on nineteen APEC economies since the Russian Federation is excluded, while oil and other fuel recorded equal highest percentage point contributions in the Philippines in the latter period).
Measures of variabilityFour summary measures of volatility in energy markets are reported, including variability in annual growth rates (standard deviation), minimum and negative contributions of individual fuel types to annual TPEC growth (minimum observation and percentage of years of negative observations respectively) and the strength of the relationship between individual fuel types and TPEC growth (correlation coeffi cient).
The variability of the percentage point contribution of each fuel type around the average is indicated by the standard deviation. Based on this measure, the percentage point contribution of oil to TPEC growth was more variable than other fuel types in fi fteen APEC economies in the period 1990–2002 (fourteen economies in the period 1972–89). By contrast, coal, gas, nuclear and other fuels recorded the largest (or equal largest) standard deviation in only three, two, one and one APEC economies respectively in the period 1990–2002 (one, three, zero and one economies respectively in the period 1972–89).
The minimum percentage point contribution is a measure of the downside contribution of a fuel type to TPEC growth within a given time period. Oil was associated with the lowest minimum percentage point contributions of all fuel types in fi fteen APEC economies in the period 1990–2002 (eighteen economies in the period 1972–89). The minimum percentage point con-tribution for oil ranged from –14.0 percentage points (Singapore) to –0.1 percentage points (Viet Nam) in the period 1990–2002, compared with
Energy security in APEC 93
a range from –44.3 percentage points (Brunei) to –0.8 percentage points (China) in the period 1972–89. Coal and gas were associated with the low-est minimum percentage point contributions to TPEC growth in three and two APEC economies respectively in the latter period (other fuel was the lowest minimum in one APEC economy in the earlier period).
The percentage of years in which there was a negative percentage point contribution to TPEC growth indicates the extent to which there have been downside contributions from a particular fuel type. In each time period, coal, oil and other fuel were associated with the largest number of years of negative percentage point contributions in fi ve, seven and seven APEC economies respectively in the period 1990–2002 (seven, seven and fi ve economies in the period 1972–89).
Oil therefore is the fuel type most often associated with the highest vari-ability in, and lowest minimum, percentage point contributions to TPEC growth with around three quarters or more of APEC economies in each category in each time period (see also fi gure 8). In addition, oil is the fuel type with the strongest positive association, or correlation coeffi cient, with TPEC growth in around three quarters of APEC economies in both time periods. However, oil, coal and other fuel are the fuel types most commonly associated with the largest number of years of negative percentage point contributions in each time period.
There have been some notable changes in the percentage point contribution of oil to TPEC growth in APEC economies between the two time periods. In the period 1990–2002, compared with the earlier period 1972–89:
■ the average percentage point contribution of oil increased in nine econ-omies, decreased in eight economies and was unchanged (at one deci-mal place) in two economies;
■ the variability in the percentage point contribution of oil to TPEC growth, as measured by the standard deviation, was higher in fi ve econ-omies, lower in thirteen economies and unchanged in one economy;
■ the minimum percentage point contribution of oil was higher in fi fteen economies and lower in four economies;
■ the percentage of years in which oil made a negative percentage point contribution to TPEC growth increased in eleven economies and was reduced in eight economies; and

94 Energy security in APEC
■ the correlation between the percentage point contribution of oil and TPEC growth was higher in six economies, lower in ten economies and unchanged in three economies.
Most importantly, while oil remains the major source of variability and downside contributions to TPEC growth, the extent of variability and mini-mum percentage point contributions have been modifi ed in the majority of APEC economies in the recent period.
Decomposition by supply sourceNet imports have become a more important source of energy for APEC economies over the past three decades. On average, the main source of additional energy for primary energy consumption — that is, the supply source with the largest percentage point contribution to TPEC growth — was domestic production in nine economies, net imports in ten economies and stock drawdown in one economy in the period 1990–2002 (fourteen, six and zero economies respectively in the period 1972–89).
Between the two time periods, there has been a rise in the number of APEC economies that rely on net energy imports, at least to some extent, to meet domestic energy requirements. The average percentage point contribution from net imports was positive in nine economies in the period 1972–89, increasing to twelve economies in the period 1990–2002.
In the context of the current study, it is of interest to examine the major sources of volatility in the net energy importing groups of economies. In the period 1990–2002, for the twelve net energy importing APEC economies:
■ net energy imports made the largest percentage point contribution to TPEC growth, on average, in ten economies (six economies in the period 1972–89);
■ net energy imports were the source of the greatest variability in the percentage point contribution to TPEC growth, as measured by the standard deviation, in eight economies (seven economies in the period 1972–89);
■ net energy imports were the source of the lowest minimum percentage point contributions to TPEC growth in the time period in eight econo-mies (four economies in the period 1972–89); and

Energy security in APEC 95
■ net energy imports were the supply source with the strongest positive association, or correlation coeffi cient, with fl uctuations in TPEC growth in seven economies (also seven economies in the period 1972–89).
However, stock drawdown was the major source of negative percentage point contributions to TPEC growth in ten net energy importing economies in the period 1990–2002 (seven economies in the period 1972–89).
For all APEC economies where data are available, stock drawdown contrib-uted on average to TPEC growth in eleven economies in the period 1990–2002, indicating that energy stocks were reduced over the period in these economies (ten economies in the period 1972–89). Energy stocks were increased (that is, made a negative percentage point contribution to TPEC growth) or were unchanged in fi ve and four economies respectively in the recent period (the same numbers as in the earlier period).
Decomposition of growth in total fi nal energy consumptionAs in the previous case, there are two aspects to the decomposition of annual growth in total fi nal energy consumption that are relevant:
■ decomposition by fi nal fuel type – the percentage point contribution of fuel types to the annual percentage change in total fi nal energy con-sumption.
■ decomposition by end use sector – the percentage point contribution of end use sectors to the annual percentage change in total fi nal energy consumption where end use sectors include industry, transport and other activities.
Annual data over the period 1972–2002 for each decomposition of annual growth in total fi nal energy consumption in twenty APEC economies are provided in appendix C. Descriptive statistics for this decomposition analy-sis are provided in table 13 for the two subperiods and in appendix C for the full period.
Decomposition by fi nal fuel typeThe fi nal fuel types included in the decomposition are coal, oil, gas, elec-tricity and other fuel (renewables and heat) — see table 5 for fuel shares in 2002. There are a relatively small number of cases where a particular fuel

96 Energy security in APEC
type is excluded from total fi nal energy consumption (TFEC). Coal was not consumed in either time period in two APEC economies (Singapore and Brunei), and gas was not consumed in the Philippines in either time period and in Viet Nam in the earlier period. It may also be noted that consumption of some fuel types occurred at relatively low levels in some economies.
In a number of cases, the average percentage point contribution of a fuel type to TFEC growth was negative — coal and gas in the United States (–0.1 percentage points for coal in both periods and –0.2 percentage points for gas in the period 1972–89), coal in Australia (–0.1, 1972–89 and –0.2, 1990–2002), coal in New Zealand (–0.1, 1990–2002), coal in Korea (–0.4, 1990–2002), coal and gas in Mexico (–0.1 and –0.3, 1990–2002), all fuel types in Russia (ranging from –1.7 to –0.2, 1993–2002), gas and other fuel in Peru (–0.1, 1990–2002 and –0.3, 1972–89), coal in China (–0.6, 1990–2002) and oil in Viet Nam (–2.6, 1972–89).
In all other cases, the average percentage point contribution of each fuel type to TFEC growth was positive. Oil provided the highest (or equal high-est) percentage point contribution, on average, to TFEC growth in fi fteen APEC economies over the period 1972–89 and in seventeen APEC econo-mies over the period 1990–2002. In several APEC economies, the average percentage point contribution of oil was substantially higher than that for other fuel types.
Coal, gas, electricity and other fuel provided the highest (or equal highest) percentage point contribution, on average, to TPEC growth in one, one, two and two APEC economies, respectively, in the period 1990–2002 (two, three, two and zero economies respectively in the period 1972–89).
Oil is the fuel type most typically associated with the highest variability in, and lowest minimum, percentage point contributions to TFEC growth — oil was the fuel type with the highest (or equal highest) standard deviation and the lowest (or equal lowest) minimum in eighteen and seventeen APEC economies in the periods 1972–89 and 1990–2002, respectively. Oil is also the fuel type with the strongest positive association, or correlation coeffi -cient, with fl uctuations in TFEC growth (fi fteen and fourteen economies in the periods 1972–89 and 1990–2002, respectively).
Coal is associated with the largest number of years of negative percent-age point contributions to TFEC growth in each time period, although this

Energy security in APEC 97
should be interpreted in the context that over three quarters of coal is used in electricity generation with the residual consumed directly in end use activi-ties (twelve and eleven economies in the periods 1972–89 and 1990–2002 respectively). Oil, gas and other fuel recorded the largest number of years of negative contributions in three, two and zero economies respectively in the period 1990–2002 (fi ve, one and fi ve respectively in the period 1972–89).
Decomposition by end use sectorFor brevity, industry and transport are identifi ed separately as the main end use sectors in total fi nal energy consumption with residential and other end use activities included in the other end use sector in table 13 — see table 6 for shares of each end use sector in TFEC in 2002.
In a small number of cases, the average percentage point contribution of energy consumption in an end use sector to TFEC growth was negative — industry in the United States (–0.2 percentage points in the period 1972–89), industry in Hong Kong (–0.4, 1990–2002), industry in Mexico (–0.5, 1990–2002), transport and other end use sectors in Russia (–0.6 and –3.0, 1993–2002), and transport and other end use sectors in Viet Nam (–1.4 and –3.3, 1972–89).
Most notably, in the period 1990–2002:
■ industry made the largest percentage point contribution to TFEC growth, on average, in eleven economies (seven economies in the period 1972–89);
■ industry was the source of the greatest variability in the percentage point contribution to TFEC growth, as measured by the standard deviation, in fourteen economies (sixteen economies in the period 1972–89);
■ industry was the source of the lowest minimum percentage point contri-bution to TFEC growth in twelve economies (eleven economies in the period 1972–89);
■ industry was the source of the largest number of negative percentage point contributions to TFEC growth in twelve economies (twelve econ-omies in the period 1972–89); and
■ industry was the end use sector with the strongest positive association, or correlation coeffi cient, with fl uctuations in TFEC growth in thirteen economies (fourteen economies in the period 1972–89).
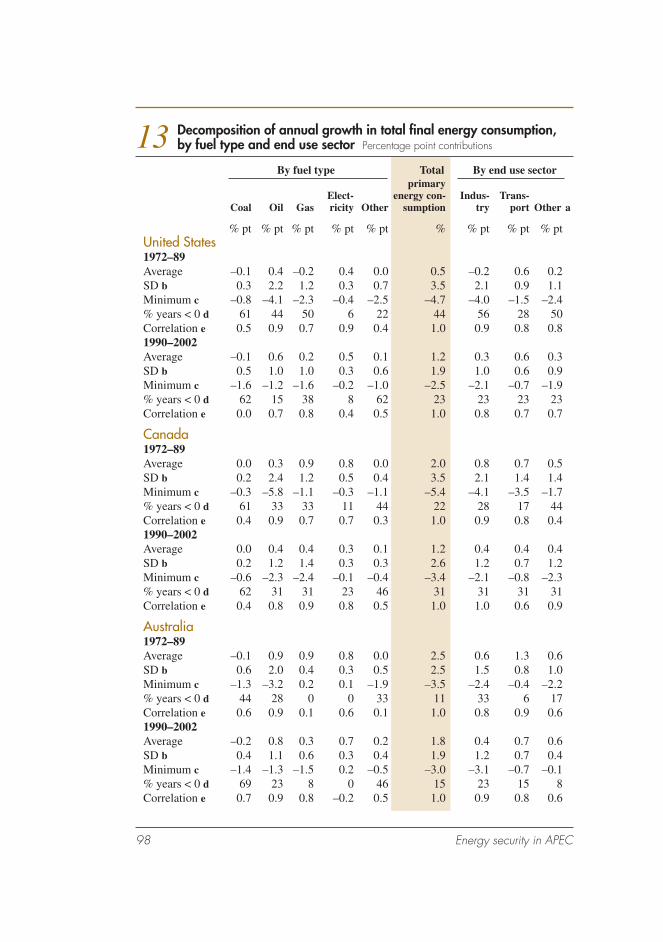
98 Energy security in APEC
13 Decomposition of annual growth in total fi nal energy consumption, by fuel type and end use sector Percentage point contributions
By fuel type Total By end use sector primary Elect- energy con- Indus- Trans- Coal Oil Gas ricity Other sumption try port Other a
% pt % pt % pt % pt % pt % % pt % pt % ptUnited States1972–89Average –0.1 0.4 –0.2 0.4 0.0 0.5 –0.2 0.6 0.2SD b 0.3 2.2 1.2 0.3 0.7 3.5 2.1 0.9 1.1Minimum c –0.8 –4.1 –2.3 –0.4 –2.5 –4.7 –4.0 –1.5 –2.4% years < 0 d 61 44 50 6 22 44 56 28 50Correlation e 0.5 0.9 0.7 0.9 0.4 1.0 0.9 0.8 0.81990–2002Average –0.1 0.6 0.2 0.5 0.1 1.2 0.3 0.6 0.3SD b 0.5 1.0 1.0 0.3 0.6 1.9 1.0 0.6 0.9Minimum c –1.6 –1.2 –1.6 –0.2 –1.0 –2.5 –2.1 –0.7 –1.9% years < 0 d 62 15 38 8 62 23 23 23 23Correlation e 0.0 0.7 0.8 0.4 0.5 1.0 0.8 0.7 0.7
Canada1972–89Average 0.0 0.3 0.9 0.8 0.0 2.0 0.8 0.7 0.5SD b 0.2 2.4 1.2 0.5 0.4 3.5 2.1 1.4 1.4Minimum c –0.3 –5.8 –1.1 –0.3 –1.1 –5.4 –4.1 –3.5 –1.7% years < 0 d 61 33 33 11 44 22 28 17 44Correlation e 0.4 0.9 0.7 0.7 0.3 1.0 0.9 0.8 0.41990–2002Average 0.0 0.4 0.4 0.3 0.1 1.2 0.4 0.4 0.4SD b 0.2 1.2 1.4 0.3 0.3 2.6 1.2 0.7 1.2Minimum c –0.6 –2.3 –2.4 –0.1 –0.4 –3.4 –2.1 –0.8 –2.3% years < 0 d 62 31 31 23 46 31 31 31 31Correlation e 0.4 0.8 0.9 0.8 0.5 1.0 1.0 0.6 0.9
Australia1972–89Average –0.1 0.9 0.9 0.8 0.0 2.5 0.6 1.3 0.6SD b 0.6 2.0 0.4 0.3 0.5 2.5 1.5 0.8 1.0Minimum c –1.3 –3.2 0.2 0.1 –1.9 –3.5 –2.4 –0.4 –2.2% years < 0 d 44 28 0 0 33 11 33 6 17Correlation e 0.6 0.9 0.1 0.6 0.1 1.0 0.8 0.9 0.61990–2002Average –0.2 0.8 0.3 0.7 0.2 1.8 0.4 0.7 0.6SD b 0.4 1.1 0.6 0.3 0.4 1.9 1.2 0.7 0.4Minimum c –1.4 –1.3 –1.5 0.2 –0.5 –3.0 –3.1 –0.7 –0.1% years < 0 d 69 23 8 0 46 15 23 15 8Correlation e 0.7 0.9 0.8 –0.2 0.5 1.0 0.9 0.8 0.6

Energy security in APEC 99
13 Decomposition of annual growth in total fi nal energy consumption, by fuel type and end use sector Percentage point contributions
By fuel type Total By end use sector primary Elect- energy con- Indus- Trans- Coal Oil Gas ricity Other sumption try port Other a
% pt % pt % pt % pt % pt % % pt % pt % ptHong Kong1972–89Average 0.0 3.6 0.3 1.9 0.0 5.8 1.4 2.5 1.9SD b 0.3 8.1 0.2 1.5 0.1 8.2 6.8 3.2 2.0Minimum c –0.9 –10.6 0.1 –0.7 –0.2 –8.6 –15.0 –1.8 –2.1% years < 0 d 56 33 0 11 33 28 39 22 22Correlation e 0.0 1.0 0.2 0.1 0.0 1.0 0.9 0.1 0.71990–2002Average 0.0 3.2 0.2 1.1 0.0 4.5 –0.4 3.4 1.6SD b 0.0 8.9 0.2 0.6 0.0 9.0 3.5 5.9 0.6Minimum c 0.0 –13.4 0.0 0.0 0.0 –12.2 –4.6 –9.3 0.6% years < 0 d 15 46 0 8 46 31 69 31 0Correlation e 0.2 1.0 0.2 0.2 –0.1 1.0 0.8 1.0 0.6
Japan1972–89Average 0.1 1.0 0.2 0.7 0.1 2.0 0.2 0.8 1.0SD b 0.6 3.7 0.1 0.6 0.2 4.2 2.9 0.7 1.2Minimum c –0.7 –6.9 0.0 –0.3 –0.1 –6.2 –5.6 –0.5 –1.0% years < 0 d 50 33 11 17 6 28 56 11 17Correlation e 0.0 1.0 0.4 0.8 –0.1 1.0 1.0 0.7 0.81990–2002Average 0.0 1.0 0.2 0.6 0.0 1.9 0.3 0.6 0.9SD b 0.6 1.3 0.1 0.6 0.1 2.0 1.9 0.7 0.9Minimum c –1.4 –0.8 0.0 –0.3 –0.1 –2.1 –2.9 –0.3 –0.3% years < 0 d 46 31 8 8 31 23 46 23 8Correlation e 0.6 0.9 0.3 0.7 0.4 1.0 0.7 0.6 0.2
Singapore1972–89Average 0.0 7.5 0.1 1.5 0.0 9.0 3.0 4.3 1.6SD b 0.0 5.4 0.1 0.7 0.1 5.6 4.6 3.7 3.3Minimum c 0.0 –0.7 –0.1 –0.2 –0.2 0.7 –1.6 –1.5 –5.6% years < 0 d 0 11 6 6 44 0 22 11 22Correlation e – 1.0 0.1 0.3 –0.3 1.0 0.5 0.4 0.61990–2002Average 0.0 5.7 0.1 1.4 0.0 7.2 2.8 2.4 2.0SD b 0.0 8.9 0.0 0.5 0.0 9.0 7.4 3.6 4.1Minimum c 0.0 –8.5 0.0 0.4 0.0 –7.2 –6.5 –1.8 –0.5% years < 0 d 0 38 8 0 23 31 38 31 15Correlation e – 1.0 0.2 0.3 0.4 1.0 0.8 0.2 0.5

100 Energy security in APEC
13 Decomposition of annual growth in total fi nal energy consumption, by fuel type and end use sector Percentage point contributions
By fuel type Total By end use sector primary Elect- energy con- Indus- Trans- Coal Oil Gas ricity Other sumption try port Other a
% pt % pt % pt % pt % pt % % pt % pt % ptChinese Taipei1972–89Average 0.3 5.7 0.3 1.6 0.0 7.9 4.4 1.9 1.6SD b 1.9 5.4 0.9 0.7 0.1 6.8 4.4 2.3 1.2Minimum c –2.5 –3.9 –1.3 –0.2 –0.3 –5.7 –4.1 –4.2 –0.4% years < 0 d 44 17 33 6 72 11 17 6 11Correlation e 0.2 1.0 0.7 0.9 0.3 1.0 0.9 0.8 0.61990–2002Average 0.5 3.0 0.2 1.6 0.0 5.3 2.9 1.4 1.0SD b 0.5 2.0 0.2 0.5 0.0 1.8 2.3 1.0 0.7Minimum c –0.6 0.3 –0.2 0.5 0.0 2.8 1.1 –0.2 –0.3% years < 0 d 23 0 23 0 38 0 0 8 8Correlation e 0.3 0.9 0.1 –0.6 –0.1 1.0 0.8 0.2 –0.3
New Zealand1972–89Average 0.1 0.8 1.0 1.0 0.5 3.3 1.6 1.1 0.6SD b 0.9 2.0 1.5 0.8 1.3 3.7 2.5 1.1 1.0Minimum c –1.6 –2.3 –0.4 0.1 –0.3 –1.4 –2.0 –0.4 –1.5% years < 0 d 50 33 17 0 22 17 33 6 28Correlation e 0.5 0.8 0.5 0.5 0.5 1.0 0.9 0.7 0.61990–2002Average –0.1 1.4 1.1 0.4 0.6 3.5 1.6 1.4 0.5SD b 0.4 1.6 1.3 0.6 1.0 2.2 1.4 1.0 0.8Minimum c –0.6 –1.2 –1.0 –0.7 –0.2 –0.7 –1.9 –0.3 –1.1% years < 0 d 46 23 31 15 23 8 8 8 31Correlation e –0.4 0.8 0.4 0.3 0.4 1.0 0.7 0.8 0.5
Republic of Korea1972–89Average 1.7 5.4 0.0 1.2 0.0 8.3 3.0 1.9 3.5SD b 2.4 5.0 0.1 0.4 0.0 6.6 3.2 2.5 2.9Minimum c –2.7 –2.7 0.0 0.4 0.0 –1.5 –2.3 –3.1 –1.0% years < 0 d 17 17 0 0 39 6 17 22 6Correlation e 0.6 1.0 0.0 0.5 0.4 1.0 0.8 0.7 0.71990–2002Average –0.4 5.3 0.9 1.4 0.3 7.5 3.8 1.9 1.9SD b 1.1 6.6 0.4 0.7 0.4 6.4 2.6 1.9 2.7Minimum c –2.5 –9.4 0.4 –0.5 –0.2 –9.9 –0.8 –3.5 –5.6% years < 0 d 62 15 0 8 8 8 8 8 15Correlation e –0.4 1.0 0.1 0.7 –0.2 1.0 0.8 0.9 0.9

Energy security in APEC 101
13 Decomposition of annual growth in total fi nal energy consumption, by fuel type and end use sector Percentage point contributions
By fuel type Total By end use sector primary Elect- energy con- Indus- Trans- Coal Oil Gas ricity Other sumption try port Other a
% pt % pt % pt % pt % pt % % pt % pt % ptBrunei Darussalam 1972–89Average 0.0 7.1 0.0 1.4 0.1 8.6 1.2 5.8 1.5SD b 0.0 12.3 0.0 1.9 0.5 12.8 5.2 7.7 2.4Minimum c 0.0 –6.9 0.0 0.0 –0.4 –4.0 –10.9 –7.1 –1.1% years < 0 d 0 22 0 0 17 22 33 11 17Correlation e – 1.0 – 0.3 0.0 1.0 0.8 0.9 0.71990–2002Average 0.0 2.9 0.0 1.6 0.0 4.5 0.3 2.6 1.6SD b 0.0 5.2 0.0 2.1 0.1 6.5 1.5 3.1 2.7Minimum c 0.0 –8.4 0.0 –3.2 –0.2 –7.3 –2.8 –4.3 –3.9% years < 0 d 0 31 0 15 31 23 31 15 31Correlation e – 1.0 – 0.7 0.0 1.0 1.0 0.9 0.8
Chile1972–1989Average 0.0 0.9 0.1 0.5 0.8 2.3 1.0 0.6 0.7SD b 1.0 3.2 0.1 0.5 0.7 4.6 2.6 2.0 1.0Minimum c –2.6 –7.3 –0.1 –0.7 –0.6 –9.8 –5.1 –3.6 –1.1% years < 0 d 50 33 17 17 11 17 28 44 17Correlation e 0.8 0.9 –0.1 0.9 0.4 1.0 0.9 0.9 0.61990–2002Average 0.1 2.4 0.5 1.2 0.9 5.0 1.9 1.7 1.4SD b 1.2 2.6 0.7 0.5 1.3 3.8 2.7 1.3 0.9Minimum c –2.3 –1.6 0.0 0.5 –2.0 –1.2 –2.5 –1.2 –0.5% years < 0 d 38 23 0 0 23 8 15 8 8Correlation e 0.7 0.8 0.0 0.5 0.4 1.0 0.9 0.5 0.7
Malaysia1972–89Average 0.3 3.8 0.6 0.9 0.4 6.1 2.1 2.3 1.7SD b 1.0 4.3 1.4 0.2 0.3 4.4 3.7 1.6 1.1Minimum c –1.2 –3.9 –0.6 0.7 –0.1 –2.4 –5.5 –1.8 0.3% years < 0 d 33 17 17 0 17 11 33 6 0Correlation e 0.4 0.9 0.1 0.0 –0.1 1.0 0.9 0.5 0.21990–2002 Average 0.1 4.7 1.2 1.5 0.1 7.7 3.3 3.1 1.4SD b 0.6 3.7 1.0 0.7 0.1 3.7 3.2 2.1 1.8Minimum c –0.6 –4.0 0.0 –0.1 –0.2 –1.6 –1.0 –1.5 –0.9% years < 0 d 31 8 8 8 15 8 23 8 23Correlation e 0.2 0.9 –0.2 0.4 0.4 1.0 0.7 0.5 0.3

102 Energy security in APEC
13 Decomposition of annual growth in total fi nal energy consumption, by fuel type and end use sector Percentage point contributions
By fuel type Total By end use sector primary Elect- energy con- Indus- Trans- Coal Oil Gas ricity Other sumption try port Other a
% pt % pt % pt % pt % pt % % pt % pt % ptMexico1972–89Average 0.1 3.6 0.8 0.6 0.1 5.2 2.2 1.9 1.0SD b 0.3 2.8 1.6 0.2 0.2 4.0 2.2 2.0 0.9Minimum c –0.5 –3.1 –2.7 0.1 –0.3 –3.5 –2.6 –3.6 –0.9% years < 0 d 44 11 22 0 28 11 17 17 17Correlation e 0.3 0.9 0.7 0.8 0.2 1.0 0.8 0.8 0.71990–2002Average –0.1 0.5 –0.3 0.5 0.0 0.7 –0.5 0.8 0.4SD b 0.3 1.8 1.2 0.3 0.3 2.3 1.2 1.2 1.0Minimum c –0.9 –3.2 –2.0 0.0 –0.5 –2.9 –2.6 –1.4 –1.4% years < 0 d 38 38 62 0 46 46 69 15 31Correlation e 0.4 0.8 0.5 0.1 0.2 1.0 0.5 0.8 0.8
Russian Federation 1972–92Average na na na na na na na na naSD b na na na na na na na na naMinimum c na na na na na na na na na% years < 0 d na na na na na na na na naCorrelation e na na na na na na na na na1993–2002Average –0.2 –0.9 –0.4 –0.2 –1.7 –3.3 0.2 –0.6 –3.0SD b 0.7 2.2 1.3 0.4 2.2 5.5 6.1 1.6 4.9Minimum c –1.1 –4.8 –3.1 –1.1 –6.4 –14.1 –8.0 –3.0 –15.7% years < 0 d 50 70 50 60 90 70 70 60 70Correlation e 0.7 0.8 0.8 0.9 0.8 1.0 0.5 0.4 0.4
Thailand1972–89Average 0.3 3.3 0.0 0.8 1.6 6.0 1.5 2.4 2.1SD b 0.4 3.1 0.3 0.4 4.6 5.8 2.5 2.4 4.6Minimum c –0.1 –2.0 –0.4 0.3 –13.0 –7.4 –3.5 –3.0 –11.2% years < 0 d 17 22 17 0 17 11 22 11 11Correlation e 0.4 0.6 0.1 0.6 0.8 1.0 0.5 0.5 0.71990–2002Average 0.8 3.5 0.3 1.1 0.1 5.7 2.8 1.9 1.0SD b 1.1 3.5 0.2 0.6 1.4 5.3 3.1 2.7 1.2Minimum c –1.5 –5.2 –0.1 –0.3 –3.2 –8.5 –4.6 –3.8 –0.8% years < 0 d 23 8 8 8 31 8 15 23 23Correlation e 0.8 1.0 0.7 0.8 0.3 1.0 0.9 0.9 0.1

Energy security in APEC 103
13 Decomposition of annual growth in total fi nal energy consumption, by fuel type and end use sector Percentage point contributions
By fuel type Total By end use sector primary Elect- energy con- Indus- Trans- Coal Oil Gas ricity Other sumption try port Other a
% pt % pt % pt % pt % pt % % pt % pt % ptPeru1972–89Average 0.0 0.5 0.0 0.3 –0.3 0.6 0.1 0.4 0.1SD b 0.2 3.8 0.2 0.4 1.1 4.1 1.6 1.8 2.1Minimum c –0.2 –8.3 –0.4 –0.6 –2.6 –9.0 –3.4 –2.5 –3.3% years < 0 d 39 39 44 17 44 33 33 44 50Correlation e 0.0 0.9 0.4 0.8 0.1 1.0 0.8 0.7 0.71990–2002Average 0.3 1.3 –0.1 0.6 –0.4 1.6 0.9 0.6 0.1SD b 0.5 3.8 0.1 0.9 0.5 3.7 2.2 2.0 1.3Minimum c –0.5 –3.8 –0.4 –2.1 –1.1 –3.3 –3.5 –3.1 –2.0% years < 0 d 38 46 62 8 77 54 23 38 46Correlation e –0.3 1.0 0.2 0.2 0.0 1.0 0.8 0.6 0.7
China1972–89Average 3.5 1.0 0.2 0.5 0.2 5.4 3.1 0.5 1.8SD b 3.6 1.8 0.2 0.3 0.5 4.4 2.8 0.3 2.2Minimum c –1.1 –3.4 –0.1 –0.1 0.0 –1.7 –1.7 –0.3 –5.1% years < 0 d 17 17 11 6 17 11 17 6 6Correlation e 0.9 0.6 0.5 0.6 –0.4 1.0 0.9 0.8 0.81990–2002Average –0.6 1.3 0.1 0.8 3.3 4.9 1.0 0.4 3.4SD b 2.9 0.5 0.1 0.3 10.7 11.9 3.0 0.5 10.6Minimum c –7.0 0.0 –0.1 0.3 –0.3 –5.1 –4.9 –0.6 –2.0% years < 0 d 38 0 8 0 8 15 23 15 23Correlation e 0.5 –0.1 0.1 0.5 1.0 1.0 0.6 –0.7 1.0
Philippines1972–89Average 0.2 0.8 0.0 0.5 0.6 2.0 0.5 0.1 1.5SD b 0.7 4.2 0.0 0.8 1.1 4.2 2.3 1.5 2.2Minimum c –1.4 –7.0 0.0 –1.4 –0.9 –5.9 –3.5 –2.8 –3.2% years < 0 d 33 39 0 17 33 33 33 44 22Correlation e 0.0 0.9 – 0.5 –0.1 1.0 0.8 0.7 0.61990–2002 Average 0.3 2.9 0.0 0.5 0.8 4.5 1.4 2.6 0.5SD b 0.8 3.4 0.0 0.7 2.0 4.6 4.2 4.5 2.5Minimum c –0.8 –1.4 0.0 –0.8 –1.3 –1.0 –1.5 –1.4 –4.7% years < 0 d 38 15 0 23 31 15 31 23 46Correlation e 0.4 0.9 – 0.5 0.5 1.0 0.5 0.7 –0.3
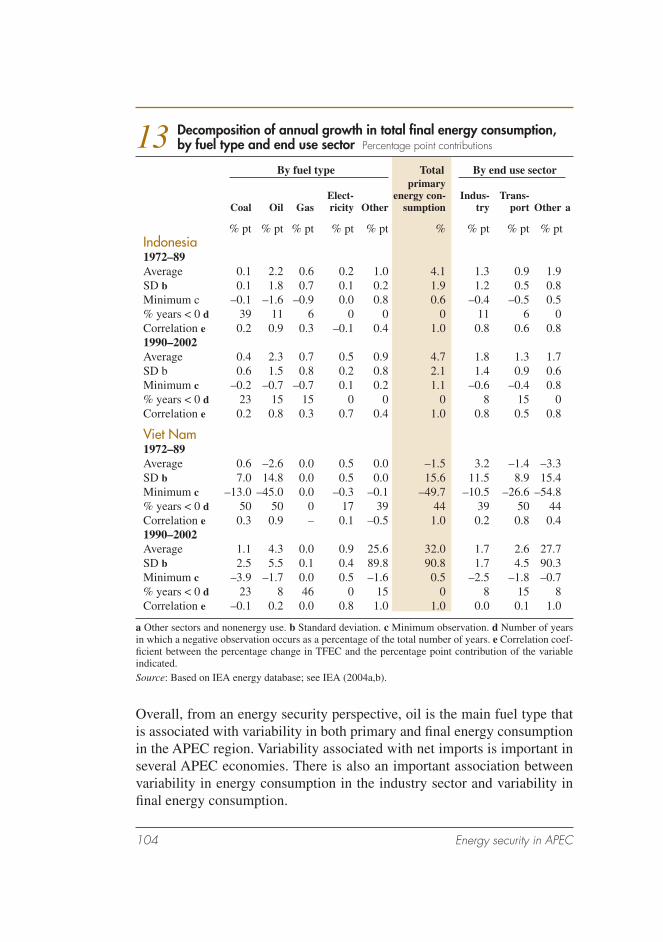
104 Energy security in APEC
Overall, from an energy security perspective, oil is the main fuel type that is associated with variability in both primary and fi nal energy consumption in the APEC region. Variability associated with net imports is important in several APEC economies. There is also an important association between variability in energy consumption in the industry sector and variability in fi nal energy consumption.
13 Decomposition of annual growth in total fi nal energy consumption, by fuel type and end use sector Percentage point contributions
By fuel type Total By end use sector primary Elect- energy con- Indus- Trans- Coal Oil Gas ricity Other sumption try port Other a
% pt % pt % pt % pt % pt % % pt % pt % ptIndonesia1972–89Average 0.1 2.2 0.6 0.2 1.0 4.1 1.3 0.9 1.9SD b 0.1 1.8 0.7 0.1 0.2 1.9 1.2 0.5 0.8Minimum c –0.1 –1.6 –0.9 0.0 0.8 0.6 –0.4 –0.5 0.5% years < 0 d 39 11 6 0 0 0 11 6 0Correlation e 0.2 0.9 0.3 –0.1 0.4 1.0 0.8 0.6 0.81990–2002Average 0.4 2.3 0.7 0.5 0.9 4.7 1.8 1.3 1.7SD b 0.6 1.5 0.8 0.2 0.8 2.1 1.4 0.9 0.6Minimum c –0.2 –0.7 –0.7 0.1 0.2 1.1 –0.6 –0.4 0.8% years < 0 d 23 15 15 0 0 0 8 15 0Correlation e 0.2 0.8 0.3 0.7 0.4 1.0 0.8 0.5 0.8
Viet Nam1972–89Average 0.6 –2.6 0.0 0.5 0.0 –1.5 3.2 –1.4 –3.3SD b 7.0 14.8 0.0 0.5 0.0 15.6 11.5 8.9 15.4Minimum c –13.0 –45.0 0.0 –0.3 –0.1 –49.7 –10.5 –26.6 –54.8% years < 0 d 50 50 0 17 39 44 39 50 44Correlation e 0.3 0.9 – 0.1 –0.5 1.0 0.2 0.8 0.41990–2002Average 1.1 4.3 0.0 0.9 25.6 32.0 1.7 2.6 27.7SD b 2.5 5.5 0.1 0.4 89.8 90.8 1.7 4.5 90.3Minimum c –3.9 –1.7 0.0 0.5 –1.6 0.5 –2.5 –1.8 –0.7% years < 0 d 23 8 46 0 15 0 8 15 8Correlation e –0.1 0.2 0.0 0.8 1.0 1.0 0.0 0.1 1.0
a Other sectors and nonenergy use. b Standard deviation. c Minimum observation. d Number of years in which a negative observation occurs as a percentage of the total number of years. e Correlation coef-fi cient between the percentage change in TFEC and the percentage point contribution of the variable indicated.Source: Based on IEA energy database; see IEA (2004a,b).

Energy security in APEC 105
APEC energy self suffi ciency, oil dependence and world resource availabilityFrom the previous two sections, it is apparent that variability in energy con-sumption is closely associated with variability in national output in many APEC economies, and variability in oil consumption is closely associated with variability in energy consumption. In this section, information is pre-sented on key demand side and supply side factors that infl uence energy security risks in the APEC region, particularly in the oil market.
Energy self suffi ciency and oil dependence in the APEC regionPrimary energy production, consumption and self suffi ciency in the APEC region since 1980 both in aggregate and for the three major primary fuel types — coal, oil and gas — are presented in fi gure 9. The fi gure is based on data for twenty APEC economies (excludes Papua New Guinea), although it should be noted that data for the Russian Federation are not available prior to 1992.
The APEC region tends to produce slightly more coal and gas, and substan-tially less oil, than is consumed within the region. Overall, the APEC region is not self suffi cient in energy, and the gap between the region’s energy production and consumption has widened over the past decade — between 1992 and 2002, annual average growth was 1.2 per cent for energy produc-tion and 1.7 per cent for energy consumption. As a consequence, APEC energy self suffi ciency — energy production as a percentage of energy con-sumption — has declined from 96 per cent in 1992 to 91 per cent in 2002, averaging 92 per cent over the period (it was 89 per cent over the period 1980–91).
Annual average growth in consumption has exceeded annual average growth in production over the past decade for each of the three main pri-mary fuel types. For coal, however, the gap between the region’s production and consumption growth has been minor (2.2 and 2.3 per cent respectively) and APEC coal self suffi ciency was 105 per cent in both 1992 and 2002 (or 105.45 per cent in 1992 and 104.8 per cent in 2002), averaging 104 per cent over the period (also 104 per cent over the period 1980–91).

106 Energy security in APEC
Between 1992 and 2002, annual aver-age growth was 1.0 per cent for gas production and 1.6 per cent for gas consumption, resulting in a fall in APEC gas self suffi ciency from 113 per cent in 1992 to 108 per cent in 2002. The average gas self suffi ciency was 112 per cent over the period 1992–2002, signifi cantly higher than the average of 99 per cent over the period 1980–91.
For oil, however, the gap between production and consumption in the APEC region has widened apprecia-bly over the past decade and oil self suffi ciency has declined markedly. Between 1992 and 2002, oil produc-tion was unchanged while the annual average growth rate for oil consump-tion was 1.4 per cent. This resulted in a fall in APEC oil self suffi ciency from 77 per cent in 1992 to 67 per cent in 2002, averaging 69 per cent over the past decade (similar to the average of 70 per cent over the period 1980–91).
Any economy or region that partici-pates in international trade will have areas of import dependence. The net economic benefi ts from international trade are well known. International trade allows economies to specialise to some extent in the production of goods and services in which they have a competitive advantage, export-ing production in excess of domestic consumption requirements to earn ex-port revenue. Economies may import
Production, consumption and self sufficiency in APEC excludes Russia before 1992
9
2
4
6
btoe
Energy
%
75
100
125
0.5
1.0
1.5
btoe
btoe
Coal
%
75
100
125
Oil
%
75
100
50
125
Gas
%
75
100
125
1982 19921987 1997 2002
0.5
1.0
1.5
btoe
Self sufficiency right axisTPEC left axis
0.5
1.0
1.5
2.0
Production left axis
Energy security in APEC 107
goods and services that may be unavailable otherwise or relatively more costly to produce domestically.
APEC’s increasing oil import dependence, or declining oil self suffi ciency, is an important aspect of the region’s energy security risk exposure because of the interaction of key demand side and supply side aspects of the oil market:
■ demand side aspects – oil dependence is a feature of APEC economies, particularly in the transport sector where there are limited substitution possibilities over the short to medium term, but agriculture and energy intensive manufacturing activities are also highly reliant on oil inputs.
■ supply side aspects – oil together with other major fuel types are non-renewable resources that need to be discovered before production may proceed, which increases uncertainty in any medium to longer term outlook assessment, and world oil reserves and production are concen-trated in relatively high risk regions, with the prospect of increasing market concentration over the medium to longer term.
Key areas of dependence in APEC energy consumption were identifi ed in chapter 3 based on 2002 data. Oil dependence in the APEC region may be summarised by the following shares:
■ the share of oil in APEC total primary energy consumption was 35 per cent in 2002, ranging from 20 to 85 per cent in individual economies;
■ the share of oil in APEC electricity generation was 6 per cent in 2002, ranging from 0 to 40 per cent;
■ the share of oil (petroleum products) in APEC total fi nal energy con-sumption was 45 per cent in 2002, ranging from 22 to 81 per cent; and
■ the share of oil (petroleum products) in the energy consumption of the APEC transport sector was 94 per cent in 2002, ranging from 60 to 100 per cent.
The oil dependence of APEC economies accounts for the strategic impor-tance of oil in energy security risk assessments. Linkages between energy consumption and national output were highlighted earlier in this chapter (see fi gures 6 and 7, and table 11). Supply side aspects of energy markets that are important for energy security risk assessments in the APEC region are discussed below.

108 Energy security in APEC
World resource availability and market concentration
Proved reserves and production of key energy resources in 2003Proved reserves of coal, oil and gas are generally defi ned to be those quanti-ties that geological and engineering information indicates with reasonable certainty can be recovered in the future from known reservoirs or depos-its under existing economic and operating conditions (BP 2004). Proved reserves may be interpreted as estimates of below ground stocks that are assessed to be economic over time under current market conditions.
Importantly, estimates of proved reserves will vary with economic con-ditions. For example, a sustained real price rise would result in currently uneconomic resources being reclassifi ed as economic and, as a consequence, aggregate proved reserves for the resource would be revised upward (and, conversely, a sustained real price fall would result in a downward revision of proved reserves). A sustained real price rise would also encourage explo-ration activity, with any related resource discoveries potentially adding to proved reserves.
At the end of 2003, world proved reserves are estimated to have been around 984 billion tonnes for coal, 157 billion tonnes for oil and 176 trillion cubic metres for natural gas (note that one billion is equal to one thousand million in this report) (BP 2004).
The reserves to production ratio is a commonly used indicator of current resource availability that adjusts for current production levels. The reserves to production ratio may be interpreted as providing an indication of the num-ber of years that proved reserves would maintain production at current levels.
Relative to current production lev-els, coal resources are relatively more abundant than either oil or gas resources. At the end of 2003, as indicated in fi gure 10, the reserves to production ratio was estimated to be around 192 years for coal, compared
World proved reserves/production ratio at end 2003 (BP statistics)
10
Coal
Oil
Gas
0 50 100 150 200years

Energy security in APEC 109
with 41 years for oil and 67 years for gas (BP 2004; production data differ slightly from the IEA).
Refl ecting the impact of exploration activity on the level of proved reserves, and despite higher world production levels, the reserves to production ratio for both oil and gas was higher in 2003 than in 1980 — the ratio was 29 years and 58 years respectively for oil and gas in 1980 (world oil and gas production increased at an annual average rate of 0.8 per cent and 2.6 per cent respectively between 1980 and 2003) (BP 2004).
Ongoing exploration activity is important in gaining knowledge about new oil and gas reservoirs. This knowledge is required to at least maintain the level of world proved reserves given that world oil and gas consumption are expected to continue to increase over the period to 2030.
However, the outcome of exploration activity is uncertain — that is, the extent to which exploration can maintain or increase economic reserves of oil and gas in the future is uncertain. This is an aspect of the upstream industry that needs to be taken into account when considering longer term aspects of policy response strategies to energy security risks.
From an APEC perspective, a further important consideration is the loca-tion of any exploration activity and associated resource discoveries. The concentration of world proved reserves for oil and gas in the relatively high risk regions of the Middle East and Africa is highlighted in fi gure 11 (regional defi nitions are given in BP 2004).
At the end of 2003:
■ 72 per cent of the world’s proved reserves for oil were located in the Middle East/Africa regions (63 per cent in the Middle East and 9 per cent in Africa);
■ 49 per cent of the world’s proved reserves for gas were located in the Middle East/Africa regions (41 per cent in the Middle East and 8 per cent in Africa); and
■ 6 per cent of the world’s proved reserves for coal were located in the Middle East/Africa regions (data for the separate regions are not avail-able in BP 2004).

110 Energy security in APEC
In 2003, the share of the Middle East and Africa in world production of oil, gas and coal was 41 per cent (30 per cent, 11 per cent), 15 per cent (10 per cent, 5 per cent) and 6 per cent (0 per cent, 6 per cent) respectively.
A major source of instability in world oil supply in recent decades has been the Middle East. APERC (2002a) contains information on signifi cant crude oil supply shocks since 1951 — from a total of eighteen oil supply disruptions,
Location of world proved reserves and productionat end 2003 (BP statistics)11
Middle East /Africa 6%
Europe/Eurasia 36%
South America 2%North America 26%
Asia Pacific 30%
Middle East /Africa 72%
Europe/Eurasia 9%
South America 9%
North America 6%Asia Pacific 4%
Middle East /Africa 49%
Europe/Eurasia 35%
South America 4%
North America 4%
Asia Pacific 8%
CoalProved reserves Production
Oil
Gas
Coal
Oil
Gas
Middle East/Africa 5%Europe/ Eurasia 13%
South America 2%
North America 18%
Asia Pacific 63%
Middle East/Africa 41%
Europe/Eurasia 22%
South America 9%
North America 18%
Asia Pacific 10%
Middle East /Africa 15%
Europe/Eurasia 39%
South America 5%
North America 29%
Asia Pacific 12%

Energy security in APEC 111
fi ve were caused by accidents, a further fi ve to internal struggles and eight to wars, embargoes and/or disputes.
Assuming world oil consumption continues to rise over the medium to lon-ger term, the global distribution of oil production will shift toward the dis-tribution for proved reserves — that is, the share of the Middle East will rise — although the timing of this shift will be infl uenced by new project developments associated with existing reserves, new discoveries made out-side the Middle East, and a change in economic conditions that enables cur-rently uneconomic reservoirs or deposits to be reclassifi ed as economic.
The development of nonconventional sources, such as tar sands and gas to liquids projects, will also contribute to future oil supply.
In the reference case projections used in the GTEM modeling analysis of oil supply disruptions sourced from the Middle East (discussed further in chapter 5), world oil consumption is projected to rise at an annual average rate of 2.2 per cent between 2002 and 2030. The share of the Middle East in world oil production is projected to fall to 28 per cent by 2010, mainly refl ecting higher production in Eurasia, but then increases to 37 per cent in 2020 and 46 per cent in 2030 — these are close to the IEA projections of 25 per cent in 2010, 35 per cent in 2020 and 43 per cent in 2030 (see IEA 2004c).
By contrast, in the ABARE reference case projections the share of the Mid-dle East in world gas production is 10 per cent in 2030, unchanged from 2003 — this outlook, which is also similar to the IEA projections, refl ects the assessment that there are likely to be substantial gas resources outside the Middle East that will be economic to develop over the outlook period (resource estimates are discussed further in IEA 2004c).
Future oil exploration is therefore important to discover new reserves as well as to diversify fuel sources to reduce market dependence in high risk areas. Given the level of historical volatility sourced from this region, the concentration of proved reserves and production in the Middle East for oil and, to a lesser extent, gas represents an important energy security risk to the APEC region.

112 Energy security in APEC
World oil production since 1965
A further important consideration in world energy markets is the role of OPEC. The importance of both the Middle East and OPEC in world oil production since 1965 is indicated in fi gure 12.
In 2003, OPEC accounted for 77 per cent of world proved oil reserves and 40 per cent of world oil production (BP 2004).
World oil production, by region (BP statistics)12 Geographical regions OPEC, OECD and other regions
20031965 1975 1984 1994
Mt
1000
2000
3000
20021965 1975 1984 1994
Mt
1000
2000
3000
Other OECD OPEC
20031965 1975 1984 1994
%
25
50
75
%
25
50
75
20021965 1975 1984 1994
Asia/Pacific North America South America Europe/Eurasia Africa Middle East
Shares Shares
Levels Levels

Energy security in APEC 113
The OPEC producer cartel includes member countries from the Middle East (Iran, Iraq, Kuwait, Qatar, Saudi Arabia and the United Arab Emir-ates), north Africa (Algeria and Libya), west Africa (Nigeria), Asia Pacifi c (Indonesia) and south America (Venezuela).
While there have been several short term or temporary oil supply disrup-tions over the period, one of the most striking features in the world oil mar-ket over the past three decades has been the apparent shifts in the medium to longer term production decisions in the OPEC region. That is, oil pro-duction decisions by OPEC member countries have signifi cantly infl uenced world oil prices in recent decades.
To the extent that any cartel (or oligopoly) has market power, industry prof-its can be increased by restricting production to raise prices above the level that would occur under competitive market conditions. Instability in the cartel arises as there are economic incentives for an individual cartel mem-ber to increase production (ignoring production targets) to increase short term profi ts.
Prior to the fi rst oil shock, world demand for oil had been growing strongly. Between 1965 and 1973, world oil production increased at an annual aver-age rate of 7.8 per cent (table 14). During this period, annual growth in OPEC oil production averaged 9.9 per cent. There had been signifi cant upward pressure on world oil prices in the early 1970s.
OPEC reduced oil production by 0.7 per cent in 1974 and by a further 11.6 per cent in 1975. As a consequence, world oil production increased by only 0.3 per cent in 1974 and fell by 4.9 per cent in 1975. After rising by 26
14 Historical annual average growth rates for world oil production, including OPEC, OECD and other regions
1965–73 1973–79 1979–85 1985–91 1991–97 1997–2003
% % % % % %
OPEC 9.9 0.1 –10.1 6.7 3.1 0.3OECD 3.6 2.3 3.3 –0.7 1.8 –0.4Other 8.7 5.8 2.1 0.2 –0.4 3.3
World 7.8 2.0 –2.4 2.1 1.6 1.0
Source: Based on BP (2004).

114 Energy security in APEC
per cent in 1973, real world oil prices increased by 217 per cent in 1974 (fi gure 13).
OPEC oil production increased in 1976 to a level marginally higher than in 1974 and, although there was some variability in subsequent years, was only around 1 per cent higher in 1979 than in 1974 — over this period, real world oil prices fell overall by 16 per cent.
The extent to which the cartel may exploit market power and sustain an increase in prices is limited since a
suffi ciently large price rise encourages oil conservation and switching to alternative fuel types as well as the exploration for and development of oil fi elds in other regions. These market responses were most apparent after the second oil shock when real world oil prices increased by 110 per cent in 1979 and by a further 5 per cent in 1980.
Annual growth in world oil production, after slowing substantially between 1973 and 1979, fell signifi cantly between 1979 and 1985. The share of OPEC in world oil production, which had increased from 46 per cent in 1965 to a high of 54 per cent in 1973, fell to 48 per cent in 1979 and a low of 29 per cent in 1985. However, despite reduced OPEC oil production dur-ing the fi rst half of the 1980s, real world oil prices fell over the period, with a sharp correction in 1986 — real world oil prices in 1986 were 70 per cent below the level in 1980.
Since that time, world oil production has increased moderately, with slower growth evident in recent years. OPEC increased production to regain mar-ket share that has varied within a relatively narrow band of 38–42 per cent since 1990.
The capacity of energy users to switch between fuel types is indicated by the relationship over time between real prices of different energy commodi-ties (fi gure 13). (In the fi gure, oil and coal prices are from IMF 2004b, the
Indicative world real price indexes of energy commodities US$ per volume unit, 1970=100
13
0
100
200
300
400
20031973 1983 1993
Oil left axis0
200
400
600
800
UraniumCoal
LNG

Energy security in APEC 115
LNG price based on the Japanese fi scal year is from IEEJ 2004 and the uranium price is ABARE 2004.)
Future oil investment and production decisions by OPEC member countries will have important implications for world oil market outcomes. From an energy security perspective, some consideration needs to be given to the risk of some combination of short term oil supply disruptions associated with political instability in the Middle East and an unexpected change to OPEC oil production targets over a more sustained time period. For example, there is likely to be some risk attached to the assumption that OPEC economies will be willing to increase production over the longer term commensurate with most long term energy projections.
116 Energy security in APEC
modeling approach
A key objective in this study is to quantify the impacts on APEC economies of possible energy supply disruptions, and to estimate how future energy market developments may affect energy security in the APEC region. The methodology employed in this study is outlined in this chapter, together with an analysis of the reference case, thereby providing the basis for understanding the impacts of energy supply disruption scenarios reported in the following chapter.
This chapter begins with a brief outline of the model and the reference case assumptions. This is followed by a presentation of the reference case out-look for APEC energy markets to 2030 that indicates how factors affecting energy security may evolve in the future. The chapter concludes with a brief comment about how to interpret simulation results.
ABARE’s global trade and environment modelThe impacts of energy supply disruptions are estimated in this study using ABARE’s global trade and environment model (GTEM). GTEM is a multiregion, multisector, dynamic general equilibrium model of the world economy.
GTEM is an appropriate framework for analysing energy market disrup-tions because it takes into account the interactions between different sectors of the economy and among economies through trade linkages. The model includes a high level of commodity disaggregation, including a detailed treatment of energy and energy related sectors and a sophisticated represen-tation of technological change and interfuel substitution possibilities in the energy sector. This enhances the capacity of GTEM to analyse the impacts of disruptions in energy markets and other external factors that could infl u-ence the operation of energy markets.
Further information on GTEM is provided on ABARE’s web site (www.abareconomics.com).
5

Energy security in APEC 117
Regional and sectoral aggregation
At its most disaggregated level, the version of GTEM used in this study consists of equations and data that describe the production, consumption, trade and investment behavior of representative producers and consum-ers in 68 regions involving 62 production sectors and commodities. In this project, the GTEM database has been aggregated to the 23 regions and 18 sectors that best capture the energy consumption and trade implications of energy supply disruptions in the APEC region (table 15).
The sectoral aggregation was chosen to include the fi ve fossil fuels –– brown steaming coal, black steaming coal, coking coal, oil and gas –– together with electricity and refi ned petroleum. The aggregation in this study also
15 Regions and sectors in GTEM
Region Sector
1 Australia 1 Brown steaming coal2 Canada 2 Coking coal3 Chile 3 Black steaming coal4 People’s Republic of China 4 Oil5 Hong Kong, China 5 Gas6 Indonesia 6 Refi ned petroleum products7 Japan 7 Electricity8 Republic of Korea 8 Iron and steel9 Malaysia 9 Nonferrous metals10 Mexico 10 Aluminium11 New Zealand 11 Chemicals, rubber and plastics12 Peru 12 Nonmetallic minerals13 Republic of the Philippines 13 Other minerals14 Russian Federation 14 Other manufacturing15 Singapore 15 Transport (other than marine) and trade16 Chinese Taipei 16 Services17 Thailand 17 Agriculture, forestry and fi sheries18 United States 18 Marine transport19 Viet Nam20 Middle East21 Other OPEC a22 Europe b23 Rest of World
a In the version of GTEM used here, Algeria is represented by north Africa and Nigeria by subSaharan Africa. b Europe includes Central Asia.

118 Energy security in APEC
includes the major energy intensive industries that are likely to infl uence total energy consumption.
The regional aggregation separately identifi es each APEC member econ-omy other than Brunei Darussalam and Papua New Guinea. Other major energy producing and trading regions, in particular the Middle East, the rest of OPEC, Europe and the Rest of World, are also represented.
Developing a reference caseAs a dynamic general equilibrium model, GTEM requires a reference case or a ‘business as usual’ scenario against which the impacts of alternative scenarios can be measured. The reference case projections also quantify possible developments in energy security indicators, such as oil import dependence.
The reference case projects the growth in key variables in a region in the absence of any signifi cant policy changes or external shocks. In this study, for example, the reference case represents the likely outlook for economic activity and energy demand and supply in APEC and across the world over the period to 2030 in the absence of any changes to key energy or economic policies.
Economic growthIn developing a reference case for APEC, a number of important assump-tions have been made. The fi rst of these is how real GDP of each economy is likely to grow over the projection period. Table 16 shows the annual average of real GDP growth rates assumed in this study. These assump-tions project more rapid economic growth in low income APEC economies, including China, Thailand and Viet Nam, and slower growth in high income APEC economies, including Japan and the United States.
The historical growth rates used in the study are from the International Mon-etary Fund (IMF 2004a). Long term projections to 2030 are from ABARE and are derived by fi tting an ARIMA (autoregressive integrated moving average) forecasting model to the historical GDP data.

Energy security in APEC 119
Fuel mix in electricity generationAs electricity is a major energy consuming sector in APEC economies, the fuel mix in electricity generation is another key determinant of energy con-sumption (table 17). In GTEM, electricity is generated by a fi nite number of fuel specifi c technologies, with distinct fi xed input requirements. The power generation technologies in the model are brown steaming coal, black steaming coal, oil, gas, nuclear, hydropower and other renewables. The share of each fuel in total electricity generation is determined exogenously (outside the model) in the reference case, using government, IEA and other projections.
Electricity fuel shares refl ect a wide range of factors, including relative fuel prices, energy endowments and levels of development, as well as concerns about energy security. For example, the share of natural gas in electricity generation is projected to increase relative to coal in many higher income economies. This is because it is assumed that the relatively low capital costs of natural gas turbines will ensure that natural gas fi red capacity remains competitive for the provision of peak load electricity. This is expected to account for a greater proportion of electricity demand in higher income economies where economic growth is slower and base load demand is more adequately met by existing capacity. On the other hand, it is projected that black steaming coal fi red capacity will remain cost effective for base load
16 Real GDP growth rates assumed in the reference case Average annual
2002–30 2002–30
Region % Region %
Australia 3.3 Republic of the Philippines 3.4Canada 2.9 Russian Federation 4.8Chile 4.2 Singapore 4.1People’s Republic of China 6.1 Chinese Taipei 4.1Hong Kong, China 3.4 Thailand 5.1Indonesia 4.5 United States 3.2Japan 1.6 Viet Nam 6.5Republic of Korea 3.9 Middle East 3.8Malaysia 5.2 Other OPEC 3.4Mexico 3.8 Europe 2.3New Zealand 3.1 Rest of World 4.6Peru 3.4

120 Energy security in APEC
capacity in many economies, because of its relatively low fuel costs. This is expected to result in increased shares of black steaming coal fi red capacity in many lower income APEC economies, where a greater amount of new capacity is expected to be base load.
Oil and gas reservesThe outlook for the production and export of both oil and gas depends very much on the abundance and location of oil and gas reserves. Assumptions about resource constraints have therefore been incorporated to represent the likely development in oil and gas reserves around the world. In particular, it is assumed that all world oil producers other than the Middle East, the rest
17 Fuel shares in electricity generation, reference case, 2002 and 2030
Brown coal Black coal Oil Natural gas Nuclear Other
2002 2030 2002 2030 2002 2030 2002 2030 2002 2030 2002 2030
% % % % % % % % % % % %
Australia 21.6 15.4 56.1 55.0 1.0 0.6 13.6 22.6 0.0 0.0 7.7 6.4
Canada 11.1 9.3 8.5 7.1 2.4 1.9 5.8 19.8 12.6 13.1 59.7 48.8
Chile 0.0 0.0 19.0 11.8 1.1 0.2 25.3 36.0 0.0 0.0 54.6 52.0
China 0.0 0.0 77.5 70.0 3.0 1.0 0.3 7.3 1.5 6.7 17.7 15.0
Hong Kong, China 0.0 0.0 63.6 65.0 0.4 0.4 35.7 34.3 0.0 0.0 0.3 0.3
Indonesia 0.0 0.0 39.6 55.4 23.2 7.2 22.0 24.8 0.0 0.0 15.2 12.6
Japan 0.0 0.0 26.5 24.3 13.2 7.7 22.3 27.6 26.9 31.6 11.0 8.9
Korea, Rep. of 0.0 0.0 39.7 37.0 9.5 0.5 12.7 13.7 36.2 45.0 1.9 3.8
Malaysia 0.6 0.2 5.4 32.4 9.3 0.2 77.3 58.3 0.0 0.0 7.4 8.9
Mexico 12.1 6.1 0.0 0.0 36.9 12.7 32.1 68.3 4.5 1.9 14.4 11.0
New Zealand 0.0 0.0 4.0 3.5 0.0 0.0 25.1 17.4 0.0 0.0 70.9 79.1
Peru 0.0 0.0 2.3 3.6 10.3 8.0 4.5 25.0 0.0 0.0 83.0 63.4
Philippines 0.0 0.0 33.2 40.5 13.0 4.4 18.0 32.0 0.0 0.0 35.8 23.2
Russian Federation 6.3 4.4 12.8 17.1 3.1 1.6 43.2 48.3 15.9 11.1 18.8 17.4
Singapore 0.0 0.0 0.0 0.0 39.6 13.6 58.3 81.5 0.0 0.0 2.1 4.9
Chinese Taipei 0.0 0.0 55.3 62.0 12.5 4.2 9.9 25.4 19.0 4.4 3.4 4.0
Thailand 15.3 2.0 1.1 16.0 2.6 0.2 72.2 73.8 0.0 0.0 8.7 8.0
United States 2.4 2.0 48.6 52.2 2.5 1.5 17.7 22.7 20.0 13.0 8.8 8.8
Viet Nam 0.0 0.0 13.6 12.9 12.2 1.8 23.2 32.6 0.0 0.0 51.0 52.7

Energy security in APEC 121
of OPEC and Mexico, encounter oil production constraints throughout the projection period, except for Russia which is assumed to approach a natural oil resource constraint toward the end of the projection period. In the gas sector, it is assumed production is constrained by resource limits in Canada, China, Thailand and the United States.
While Mexico has relatively abundant oil and gas reserves, there are con-stitutional barriers to foreign investment in oil and gas exploration and production. These barriers are represented in the reference case as natural resource constraints. Using this methodology, it is assumed that govern-ment initiatives succeed in lifting the constraint on foreign investment mid-way through the projection period.
Other key assumptionsIn the reference case, other key assumptions are that:
■ new LNG trade contracts are realised – in particular, China com-mences LNG imports from Australia and Indonesia by 2007 and Chi-nese Taipei commences LNG imports from the Middle East toward the end of this decade. In addition, it is assumed that the Russian Federation commences exporting LNG to Japan by 2020 and that, toward the end of the projection period, it begins exporting gas to China and Korea through the Irkutsk pipeline. However, not all prospective projects were modeled. For example, proposals for LNG exports from Peru and a pro-posal to expand LNG production in Alaska, United States, have been omitted simply because of uncertainties surrounding timing and the size and destination of exports.
■ the effi ciency of energy use in the electricity and iron and steel sectors improves over time – these assumptions represent the likely trend in energy effi ciencies given the rates of capacity growth projected in the reference case and are identical to those reported and explained in Heaney et al. (2005).
■ technology shares for iron and steel refl ect recent trends – in particu-lar, the share of steel produced in electric arc furnaces is assumed to increase in most economies, with the notable exceptions of Japan and China. Assumptions are identical to those reported and explained in Heaney et al. (2005).

122 Energy security in APEC
Reference case projectionsThe reference case projections presented here represent a possible outlook for energy demand and supply in APEC economies over the period to 2030 in the absence of any major policy changes or external shocks. The results, however, are not forecasts of what will actually happen in the APEC region. They are conditional on the set of assumptions outlined earlier that are con-sidered plausible at the present time. Subject to these assumptions being realised, the projections provide a reasonable estimate of energy market developments in APEC economies.
Primary energy consumption in APEC economiesTotal primary energy consumption in APEC is projected to grow in the reference case by 2.1 per cent a year between 2002 and 2030, increasing from 5513 million tonnes of oil equivalent (Mtoe) in 2002 to 9751 Mtoe in 2030 (fi gure 14).
Note that the data for 2002 reported in chapters 5 and 6 differ from that of chapter 3 because the data here excludes combustibles and waste that are not used to generate electricity.
Growth in APEC energy consumption is similar to the projected growth in world energy consumption. As a result, APEC’s share of world energy con-sumption in 2030 remains much the same as in 2002 (fi gure 15).
However, growth in energy consump-tion varies considerably among APEC economies, with signifi cant conse-quences for the importance of dif-ferent APEC income groups in total world energy consumption. Energy consumption is projected to expand most strongly in low income APEC economies as a result of relatively rapid economic growth and increased demand for personal services in these economies. Consequently, the share of world energy consumption con-sumed by the low income economies
Average annual growth in TPEC reference case, 2002–3014
World
Low incomeexcl. China
Low income
Middle income
High income
APEC total
% 1 2 3 4
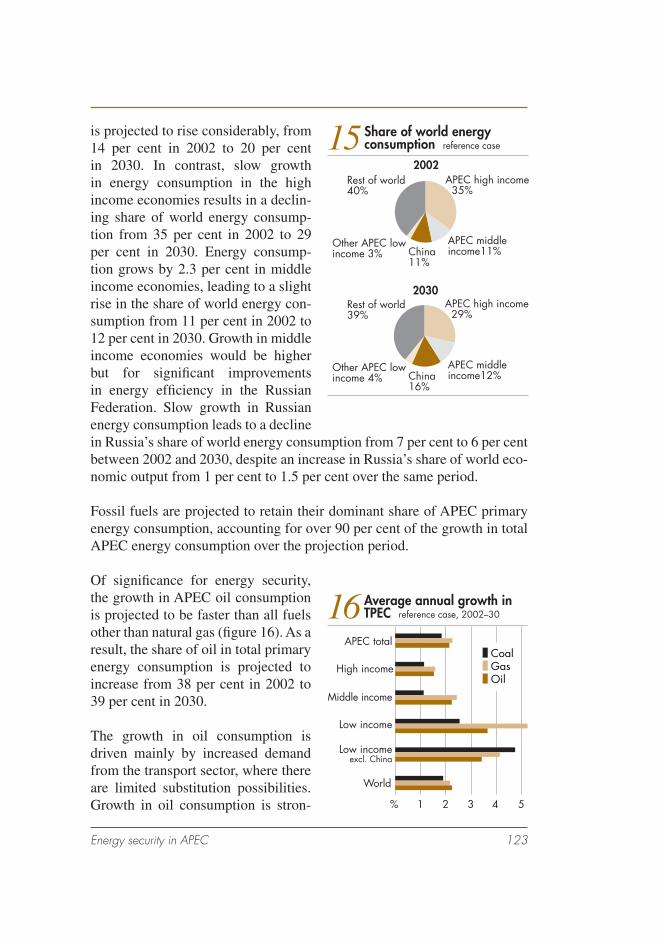
Energy security in APEC 123
is projected to rise considerably, from 14 per cent in 2002 to 20 per cent in 2030. In contrast, slow growth in energy consumption in the high income economies results in a declin-ing share of world energy consump-tion from 35 per cent in 2002 to 29 per cent in 2030. Energy consump-tion grows by 2.3 per cent in middle income economies, leading to a slight rise in the share of world energy con-sumption from 11 per cent in 2002 to 12 per cent in 2030. Growth in middle income economies would be higher but for signifi cant improvements in energy effi ciency in the Russian Federation. Slow growth in Russian energy consumption leads to a decline in Russia’s share of world energy consumption from 7 per cent to 6 per cent between 2002 and 2030, despite an increase in Russia’s share of world eco-nomic output from 1 per cent to 1.5 per cent over the same period.
Fossil fuels are projected to retain their dominant share of APEC primary energy consumption, accounting for over 90 per cent of the growth in total APEC energy consumption over the projection period.
Of signifi cance for energy security, the growth in APEC oil consumption is projected to be faster than all fuels other than natural gas (fi gure 16). As a result, the share of oil in total primary energy consumption is projected to increase from 38 per cent in 2002 to 39 per cent in 2030.
The growth in oil consumption is driven mainly by increased demand from the transport sector, where there are limited substitution possibilities. Growth in oil consumption is stron-
Share of world energy consumption reference case15
Rest of world40%
Other APEC low income 3% China
11%
APEC middle income11%
APEC high income 35%
Rest of world39%
Other APEC low income 4% China
16%
APEC middle income12%
APEC high income 29%
2002
2030
Average annual growth in TPEC reference case, 2002–3016
World
Low incomeexcl. China
Low income
Middle income
High income
APEC total
% 1 2 53 4
Coal
OilGas

124 Energy security in APEC
gest in the low and middle income economies, where rapid growth in the transport sector results from rapid economic growth and the sharp rise in private vehicle ownership. However, even in the slower growing high income economies, the consumption of oil grows faster than that of most other fuels.
Natural gas is projected to be the fastest growing fuel in APEC energy con-sumption, particularly because of increased demand for gas for electricity generation in low income economies. Similarly, increased demand for coal in low income economies for electricity generation is the main driver of the growth in APEC coal consumption.
Energy intensityEnergy intensity is the ratio of energy consumption to real GDP. It indicates the importance of a stable supply of energy for an economy. Ignoring other factors, the higher the energy intensity of an economy, the greater would be the likely costs to the economy of a disruption in energy supplies.
In the reference case, APEC’s energy intensity is projected to decline by 30 per cent between 2002 and 2030, largely as a result of a structural shift in economies away from energy intensive manufacturing and toward services that are less energy intensive. In absolute terms, the energy required to pro-duce 2002US$1 of output declines from 277 grams of oil equivalent (goe) in 2002 to 192 goe in 2030 (fi gure 17).
Energy required in APEC to produce 2002US$1 of GDPreference case17
Low incomeexcl. China
Low income
Middle income
High income
APEC total
goe 200 800600400
Coal
OilGas
20022030
20022030
20022030
20022030
20022030

Energy security in APEC 125
Energy intensity can be expressed in terms of specifi c fuels, such as oil and gas. By 2030 APEC is expected to require 28 per cent less oil per unit of output and 26 per cent less natural gas per unit of output than in 2002. In absolute terms, the amount of oil required to produce 2002US$1 of output declines from 99 goe to 71 goe between 2002 and 2030. Similarly, to pro-duce the same value of output requires 61 goe of natural gas in 2002, but only 45 goe of natural gas in 2030.
Energy intensity tends to be higher for economies that are less developed. In part this is because economic development is characterised by a shift away from energy intensive production, of base metals for example, toward high technology industries and services which use much less energy. By 2030, the low income economies are more energy intensive than the other income groups, and the high income economies are by far the least energy intensive. However, in both 2002 and 2030, oil intensity is higher in middle income economies than in low income economies excluding China. This is because the middle income economies include the Republic of Korea and the Russian Federation, which are among the world’s largest producers and exporters of petroleum products both in 2002 and 2030.
Energy consumption in electricity generationThe changes in the composition of fuel consumption in APEC over the ref-erence case are driven to a large extent by growth in electricity genera-tion across the region. Under the reference case, low income economies are projected to account for around half the growth in electricity genera-tion in the region between 2002 and 2030, despite generating only 20 per cent of the region’s electricity in 2002 (fi gure 18).
In China, the increase in electricity output over the period is characterised by increasing shares of natural gas and renewable energy sources in the electricity fuel mix. In other low income economies, where most new power generation capacity is expected to be for base load electricity demand,
Average annual growth in APEC electricity generationreference case, 2002–30
18
Low incomeexcl. China
Low income
Middle income
High income
APEC total
%–2 2 864
Coal fired
Oil firedGas fired
Total

126 Energy security in APEC
the role of coal in electricity generation is projected to increase, refl ecting the continued competitiveness of coal in providing base load power. The cost competitiveness of natural gas turbines for peak load demand is one reason for the increasing share of natural gas in the electricity fuel mix in high income APEC economies, where peak load capacity is projected to account for a larger share of new power generation capacity than in other economies.
In all economies oil accounts for a decreasing share in the electricity fuel mix. In many economies this refl ects concerns about the reliability of world oil supplies. However, in Mexico and Indonesia, two oil exporting econ-omies, it is government policy to reduce domestic consumption of oil in order to maintain or raise oil export revenues.
Energy production and self suffi ciency in APEC economiesEnergy production in the APEC region expands by 54 per cent over the pro-jection period, from 5020 Mtoe in 2002 to 7568 Mtoe in 2030 (fi gure 19).
Growth in energy production is slower in APEC than in the world as a whole. APEC’s share of world energy output therefore declines over the reference case from 54 per cent in 2002 to 48 per cent in 2030.
Over the projection period, slow growth in APEC oil production occurs as a result of natural resource constraints that are assumed to develop in most
APEC economies, and indeed in most major oil producing economies. As a result of this slow growth, the share of APEC in world oil production declines considerably over the projec-tion period, from 36 per cent in 2002 to 22 per cent in 2030 (fi gure 20). Con-versely, oil production grows strongly in the Middle East and in other OPEC member economies. By 2030, the Middle East produces 46 per cent of world oil supplies, up from 29 per cent in 2002. OPEC as a whole produces 61 per cent of the world’s oil in 2030, up from 44 per cent in 2002. Note that in
Average annual growth in APEC energy production reference case, 2002–30
19
Low incomeexcl. China
Low income
Middle income
High income
APEC total
World
%–2 2 64
Coal
OilGas
Total

Energy security in APEC 127
the GTEM database, OPEC members Algeria and Nigeria are represented by north Africa and subSaharan Africa respectively.
The increased risk attached to the concentration of oil production in the Middle East would be compounded if the Middle East were also to account for a large or growing share of world gas production. However the Middle East’s share of world natural gas out-put grows to just 10 per cent in 2030, up marginally from 9 per cent in 2002. At the same time, APEC con-tinues to dominate world natural gas production, although by a diminish-ing degree, supplying 57 per cent of the world’s gas in 2030 compared with 60 per cent in 2002.
Energy self suffi ciency in APEC economiesEnergy self suffi ciency represents an economy’s capacity to meet its own energy requirements. It is measured in this study as domestic energy pro-duction divided by domestic energy consumption and expressed as a per-centage.
Refl ecting the slow growth of energy production in the APEC region, energy self suffi ciency in APEC declines signifi cantly from 91 per cent in 2002 to 79 per cent in 2030. This indicates a substantial deterioration in the extent to which the APEC region is able to supply its energy requirements.
The principal reason for the decline in energy self suffi ciency is a large fall in oil self suffi ciency, from 67 per cent in 2002 to 38 per cent by 2030 (fi gure 21). In contrast, the APEC region’s self suffi ciency in gas and coal does not change much over the reference case. At 2030, APEC remains self suffi cient in gas (104 per cent) and coal (107 per cent).
The most severe decline in oil self suffi ciency is experienced by low income economies. Particularly in China, domestic oil production is outpaced by
Share of world oil productionreference case20
Rest of world20%
APEC low income 7%
APEC middle income 17%
APEC high income 12%
2002
2030
Other OPEC 14%
Middle East 30%
Rest of world17%
APEC low income 3%
APEC middle income 13%
APEC high income6%
Other OPEC 15%
Middle East 46%

128 Energy security in APEC
the dramatic growth in oil consump-tion, resulting in China’s self suffi -ciency in oil falling from 69 per cent in 2002, to just 13 per cent in 2030. At 2030, China’s oil self suffi ciency is lower even than that of the United States, which is expected to be 18 per cent. Oil self suffi ciency also declines strongly in the low income economies other than China, from 74 per cent in 2002 to 39 per cent in 2030. This is being driven by increasing oil reserve constraints in Indonesia, as indicated by the drop in Indonesia’s oil self suf-
fi ciency from 111 per cent in 2002 to 64 per cent in 2030. By 2030, only the middle income economies retain self suffi ciency in oil, at 102 per cent, but this is still signifi cantly lower than in 2002 when oil self suffi ciency measured 168 per cent. In the high income economies, oil self suffi ciency is already low in 2002 at 39 per cent, but declines further to 20 per cent in 2030.
Despite the decline in oil self suffi ciency in most APEC economies, there remains considerable differences in total energy self suffi ciency among APEC economies at 2030 (fi gure 22). Coal and gas reserves are so vast in
some economies that they retain self suffi ciency greater than 100 per cent in total energy despite waning self suffi ciency in oil.
Of the nineteen APEC economies included in the GTEM analysis, four-teen have an energy self suffi ciency below 100 per cent by 2030 (table 18). These economies include six high income economies, three middle income economies (although Mexico is almost self suffi cient) and fi ve low income economies. Of these, none are self suffi cient in more than one fuel type, other than New Zealand.
APEC oil self sufficiency reference case21
Low incomeexcl. China
Low income
Middle income
High income
APEC total
% 40 80 160120
20302002
Self sufficiency in energy and specific fuel types reference case, 2030
22
Oil,
gas
and
coa
l sel
f suf
ficie
ncy
(%)
Energy self sufficiency (%)
0
100
200
300
400
0 100 200 300 400
Self sufficiency in specific fuel < than energy self sufficiency
Self sufficiency in specific fuel > than energy self sufficiency
OilGasCoal

Energy security in APEC 129
18 Self suffi ciency of APEC economies in energy and specifi c major fuel types, reference case 2030
Number of specifi c fuel types in which each economy is self suffi cient: coal (c), oil (o) and gas (g) Total 0 1 2 3 no. no. no. no. no.
Economies with total energy self suffi ciency below 100 per centHigh income 4 1 1 0 6 Hong Kong United States (c) New Zealand (c,g) Japan Singapore Chinese Taipei
Middle income 2 2 0 0 4 Korea Malaysia (g) Chile Mexico (o)
Low income 1 3 0 0 4 Thailand China (c) Peru (g) Philippines (g)
Total 7 6 1 0 14
Economies with total energy self suffi ciency equal to 100 per cent or more High income 0 0 2 0 2 Australia (c,g) Canada (c,g)
Middle income 0 0 0 1 1 Russia
Low income 0 0 1 1 2 Indonesia (c,g) Viet Nam
Total 0 0 3 2 5
APEC economiesHigh income 4 1 3 0 8
Middle income 2 2 0 1 5
Low income 1 3 1 1 6
Total 7 6 4 2 19
a GTEM projections do not include Papua New Guinea and Brunei.

130 Energy security in APEC
Seven economies record low or zero self suffi ciency in all major fuel types — specifi cally Chile, Hong Kong, Japan, Korea, Singapore, Chinese Taipei and Thailand. Only Mexico is self suffi cient in oil in 2030 (161 per cent). However, a substantial shortfall in gas at 2030 (49 per cent) contributes to Mexico’s total energy self suffi ciency being marginally less than 100 per cent (98 per cent).
Five major energy producers in APEC remain self suffi cient in both coal and gas at 2030, and consequently remain self suffi cient for energy as a whole (table 18). These are Australia, Canada, Indonesia, the Russian Federation and Viet Nam. Energy self suffi ciency in these fi ve economies ranges from 258 per cent in Australia down to 114 per cent in Viet Nam. Of these, the Russian Federation and Viet Nam are also self suffi cient in oil, and Canada is virtually self suffi cient in oil (97 per cent). The remaining two economies, Australia and Indonesia, record oil self suffi ciencies of 54 per cent and 64 per cent respectively, representing a substantial shift from being totally self suffi cient or nearly so in 2002.
APEC energy tradeNet energy exports (or imports) are another way of measuring the extent by which domestic energy production exceeds (or falls short of) domestic energy consumption. Net energy exports are simply the volume of exports that exceeds the volume of imports. If this number is negative, then the economy is importing more energy than it exports and is a net energy importer, implying that domestic production is not suffi cient to meet its energy requirements.
The APEC region is a net energy importer in 2030 (fi gure 23). Net energy imports in the APEC region are 2081 Mtoe, a more than a threefold increase in net energy imports from 2002. Most of the change from 2002 is concen-trated in China and in the high income economies.
The most signifi cant increase in net energy imports occurs in China, where net energy imports increase almost thirtyfold to 732 Mtoe. This refl ects the deterioration in China’s oil self suffi ciency reported above. China’s net oil imports stand at 555 Mtoe in 2030, accounting for 70 per cent of China’s energy trade defi cit.

Energy security in APEC 131
Net energy imports of the high income economies also rise, albeit by a much smaller margin, almost doubling over the projection period to 1617 Mtoe in 2030. As is the case in China, net oil imports constitute most of the energy trade defi cit of high income economies, amounting to 1457 Mtoe in 2030. High income economies are also net importers of gas in 2030 (147 Mtoe). However, because of the strong growth in Australian coal exports, high income economies are net coal exporters in 2030 (73.5 Mtoe).
The middle income economies continue to export more energy than it imports, with net exports amounting to 219 Mtoe in 2030. But middle income economies remain net coal importers (94 Mtoe). For the low income economies other than China, energy exports surpass imports by 48 Mtoe in 2030, which is similar in volume to that of 2002.
Most APEC economies are net energy importers by 2030. In 2030 the four largest net energy importing economies represent all income groups and are the United States (1258 Mtoe), China (732 Mtoe), Japan (486 Mtoe) and Korea (315 Mtoe). The volume of net energy imports increases between 2002 and 2030 for all net energy importing economies.
Only fi ve APEC economies are net energy exporters in 2030 — apart from Brunei which is not explicitly modeled in this GTEM analysis. The fi ve net energy exporting economies represent all income groups and are the Russian Federation (615 Mtoe), Australia (307 Mtoe), Indonesia (253 Mtoe), Canada (108 Mtoe) and Viet Nam (11 Mtoe). Notably, the volume
APEC net energy exports reference case, 203023
Low incomeexcl. China
Low income
Middle income
High income
APEC total
World
–2250 –2000 –1500–1750 –1000–1250 –500 –250–750 250Mtoe
Coal
OilGas

132 Energy security in APEC
of net energy exports of the Russian Federation, Australia and Indonesia expand signifi cantly over the projec-tion period. But this expansion is not suffi cient to offset the growth in net energy imports in all other APEC economies.
Net energy imports only tell part of the story of how much APEC econo-mies depend on energy imports. A more complete measure is given by expressing net energy imports as a percentage of domestic energy con-sumption (fi gure 24). For net energy importers, this indicates the degree of
reliance on international markets to supply domestic energy requirements.
The share of APEC’s energy consumption that is supplied by net imports doubles over the projection period to 22 per cent of total primary energy consumption in 2030. Much of the change is accounted for by the tenfold increase in the share of net energy imports in China’s energy consumption to 30 per cent in 2030. Reliance on net energy imports also grows in high income economies, but by a much slower rate, to 35 per cent in 2030.
The corresponding indicator for net energy exporters is the percentage share of net energy exports in domestic energy consumption. This measure reveals the extent to which domestic energy requirements are absorbing an increasing share of domestic energy output.
Within APEC, the income groups that export more energy than they import are the middle income economies and the low income economies other than China. Over the reference case, there is a decline in the importance of export markets and a rise in the importance of the domestic market for both income groups. For the middle income economies, net energy exports decline as a share of domestic consumption from 31 per cent in 2002 to 11 per cent in 2030. Similarly, net energy exports as a share of energy con-sumption in the low income economies other than China declines from 19 per cent in 2002 to 7 per cent in 2030.
APEC net energy import dependence reference case24
Low incomeexcl. China
Low income
Middle income
High income
APEC total
%–30 –20 –10–40 10 20 30 40
20302002
Net exports
Net importdependence

Energy security in APEC 133
Interpreting simulation results
The GTEM reference case provides a benchmark against which the impacts of energy supply disruptions, such as an interruption to Middle East oil sup-plies, can be measured. For example, the impact of a disruption to Middle East oil exports can be isolated by comparing economic growth, sectoral output and investment, energy con-sumption and trade, and other vari-ables in the disruption simulation against those in the reference case scenario.
To illustrate the point, suppose that oil consumption in a certain economy in the reference case in 2020 was 3000 million tonnes (point a in fi gure 25). Following an interruption to world oil supplies in 2020, oil consumption at 2020 is projected to be 2700 mil-lion tonnes (point b), or 300 million tonnes less than in the reference case. Hence the effect of the oil supply disruption in this example would be to reduce oil consumption by 10 per cent relative to the reference case at 2020 (a movement from point d to point e in the lower diagram).
Interpreting the deviation from the reference case in a GTEM simulation
% deviation from the reference case
25reference case
3000a
boil disruption
c
2700
2020
e
fd
Mtoe
0
–10
20202010 2030
2010 2030
134 Energy security in APEC
quantifying the economic effects of temporary energy supply disruptionsIt is the purpose in this chapter to indicate the likely impacts of three types of energy supply disruptions. These three scenarios are representative of the variety of disruptions that could threaten energy supplies to the APEC region as a whole.
The three scenarios are:
■ a temporary disruption to oil production in the Middle East
■ a temporary disruption to LNG production in the Middle East
■ a temporary blockage of the Malacca Strait.
Each disruption has been simulated both in 2005 and in 2020, in order to assess how structural changes and energy market trends may alter the vul-nerability of APEC economies to energy supply disruptions over time.
In all scenarios, the disruption is assumed to be temporary, occurring in one year and returning to reference case levels in the subsequent year. It follows that the impacts are only signifi cant in the year of the disruption. Results are therefore only reported for the year of the disruption.
Temporary disruption to Middle East oil suppliesAs illustrated in fi gure 26, the world oil market has experienced a turbulent history of supply disruptions. Much of this instability has had its origins in the Middle East, which is also the location of approximately two thirds of the world’s proven oil reserves.
In the light of this history, it is assumed in these scenarios that Middle East oil output declines from the previous year by an amount that is equiva-lent to 5 per cent of world output. The severity of this disruption is simi-lar in year on year percentage terms to that of 1980 caused by the Iranian
6

Energy security in APEC 135
revolution and the subsequent Iran–Iraq war. In both scenarios, the disrup-tion translates to a decline in world oil output relative to the reference case of approximately 8 per cent, or 266 million tonnes of oil equivalent (Mtoe) in the 2005 scenario and 385 Mtoe in the 2020 scenario.
Further assumptions have been made on oil prices and LNG prices to more accurately refl ect world markets. Because of the opportunity for arbitrage in the world oil market, oil prices throughout the world move together. To ensure that this occurs in the scenarios modeled here, it is assumed that oil demand is very responsive to changes in the domestic price relative to world prices.
Current LNG contracts explicitly link LNG prices to crude oil prices, although recent LNG contracts signed with China set a ceiling on the oil price used to calculate LNG prices (Facts Inc. 2003a). The link between the oil price and LNG prices has been represented in the oil supply disruption scenarios for Japan, Korea and Chinese Taipei. However, in both scenarios, it is assumed the price of LNG imported by China is not affected by the disruption on the basis that the reference case price is already close to the ceiling price of Chinese contracts. While the detail of price formulas used in LNG contracts are not available to the public, it is possible to infer the relationship based on historical trends, as was done in Fujime (2002).
World oil market developments 26World outputright axis
World average trade weighted price left axis
US$/bbl
20
40
60
1980 1983 1986 1989 1992 1995 1998 2001 2004
IranianrevolutionShahdeposed
IraqinvadesKuwait
OPEC cuts production
Start of Iraq war
Iraq begins exporting oil under UN resolution 986
2002Mt
2700
3000
3300

136 Energy security in APEC
Summary of the impacts
The scenarios demonstrate that a disruption in the supply of oil will have signifi cant impacts on world energy prices and consequently on APEC’s energy sector. The extent of these impacts on an economy will depend on the economy’s net oil import position and on the economy’s reliance on oil. In particular, net oil exporting economies are likely to gain from higher world oil prices, whereas net oil importing economies stand to lose. The impacts of the two oil supply disruption scenarios simulated for this study are summarised in table 19.
Energy price impactsThe decline in world crude oil supplies results in a rise in world crude oil prices relative to the reference case by about 40 per cent in both the 2005 and 2020 scenarios, after adjusting for infl ation (fi gure 27). The world average trade weighted oil price, for example, rises to US$52 a barrel (in 2002 dol-lars) in 2005. Assuming perfectly competitive markets and ignoring policy
19 Impacts of the oil supply disruptions in 2005 and 2020relative to the reference case
Energy Energy Energy consumption imports exports
Real GNP Total Oil Gas Coal Oil Gas Coal Oil Gas Coal
2002US$b Mtoe Mtoe Mtoe Mtoe Mtoe Mtoe Mtoe Mtoe Mtoe Mtoe
2005 oil supply disruption scenarioAPEC –43 –136 –148 –5 15 –136 –5 1 150 1 5 High income –49 –83 –78 –4 6 –108 –5 0 26 3 2 Middle income 6 –51 –60 –1 –2 –9 0 1 109 –1 2 Low income 0 –2 –10 0 11 –18 0 0 16 –2 1
– excl. China 4 0 –2 0 1 –8 0 0 7 –2 –1
World –134 –253 –323 11 23 –193 –2 1 –135 –2 7
2020 oil supply disruption scenarioAPEC –82 –223 –243 –5 20 –211 –6 1 168 2 6 High income –68 –120 –116 –4 8 –143 –7 0 22 2 3 Middle income 1 –68 –78 –2 –2 –13 1 0 140 0 1 Low income –16 –35 –49 1 14 –54 1 0 5 0 2
– excl. China 1 –7 –10 0 1 –12 0 0 5 0 0
World –176 –386 –478 16 32 –308 –3 1 –216 –4 7

Energy security in APEC 137
responses, higher crude oil prices results in the CPI adjusted price of petroleum products rising by an aver-age 41 per cent and 39 per cent relative to the reference case in the 2005 sce-nario and 2020 scenario respectively.
Not only do oil prices increase, so do the prices for other fuels. Most LNG cargoes supplied in the Asia Pacifi c region are supplied under long term contracts that link LNG prices to the price of crude oil. This contractual arrangement means the rise in crude oil prices leads to higher LNG prices. For example, the price of LNG rises by just over 20 per cent relative to the refer-ence case in Japan, Korea and Chinese Taipei, in both the 2005 and the 2020 scenarios. In addition, in response to a higher relative price of oil, demand rises for alternative energy sources and this contributes to higher prices for coal and natural gas other than LNG, relative to the reference case.
Impacts on economic outputAs a result of the rise in world energy prices, and the associated increase in production costs, the level of economic activity across APEC contracts relative to the reference case (table 19).
The impact that higher energy prices have on the level of economic activ-ity may be dissected into two effects — an income transfer effect and an output effect. The income transfer effect can be either positive or negative depending on the oil trade position of an economy. The output effect is always negative. The income transfer effect occurs because the rise in real oil prices increases the value of oil exports (imports) relative to that of other traded commodities. This leads to an improvement (deterioration) in the terms of trade for economies that are net oil exporters (importers), contrib-uting to an income transfer from net importing to net exporting economies. On the other hand, the output effect is the decline in output, particularly in energy intensive industries, because of the increase in the costs of produc-tion associated with the shortage in oil supplies.
Change in world crude oil prices following oil supply disrup-tions relative to the reference case
27
% 10 20 30 40
2020 disruption
2005 disruption

138 Energy security in APEC
APEC as a whole is a net oil importer, and for this reason, both the out-put effect and the income transfer effect are negative for the APEC region. APEC’s gross national product (GNP) therefore contracts relative to the reference case, by 0.2 per cent, or US$43 billion (in 2002 prices) in the 2005 scenario, and by 0.2 per cent or by US$82 billion (in 2002 prices) in the 2020 scenario. To put these numbers into perspective, the contraction in the 2005 scenario is roughly similar to the current size of each of the economies of New Zealand, Peru or Viet Nam. In the 2020 scenario, the contraction in the APEC economy is similar to the current size of each of the economies of Malaysia, the Philippines or Singapore.
The interplay of the income transfer and output effects explains why aggre-gate output impacts vary considerably among APEC economies (fi gure 28). High income economies experience the greatest losses in APEC as they typically depend heavily on net oil imports. Conversely, strong gains are experienced relative to the reference case in the 2005 scenario in the oil exporting economies of Indonesia, Malaysia and Russia, and to a lesser extent Mexico. The gains in Mexico are lower than in other oil exporting economies as investment constraints in Mexico’s oil sector assumed in the reference case limit Mexico’s oil production capacity. In addition, the gains in Mexico are offset by a decline in Mexico’s exports to the United States relative to the reference case.
Oil self sufficiency and change in outputfollowing oil supply disruptions relative to the reference case28
Oil self sufficiency %
Net oil exporters
Net oil importers 20052020
% GNP loss % GNP gain–2.5 –1.5 –0.5 0.5 1.5 2.5 3.5
Malaysia
Mexico
Russia
0
50
150
200
Indonesia

Energy security in APEC 139
Sectoral impactsThe negative impact on APEC of the disruption to oil supplies is concen-trated in those industries that rely intensively on petroleum inputs, specifi -cally the transport industry and the chemicals, rubber and plastics industry (fi gure 29). The higher cost of oil leads to higher prices and lower demand for these oil intensive commodities relative to the reference case.
This decline in energy intensive manufacturing is most pronounced for middle income economies, as indicated by the reduction in energy intensity relative to the reference case in fi gure 30.
The Russian Federation in particular, which accounts for the dominant share of energy intensive production in the middle income group, is ineffi cient in the use of energy. Russian energy intensive commodities therefore lose competitiveness relative to the same commodities produced in other major world economies.
Change in APEC production in selected sectors following oil supply disruptions relative to the reference case29
Low incomeexcl. China
Low income
Middle income
High income
APEC total
%
20022030
20022030
20022030
20022030
20022030
Chemicals, rubber and plasticsTransport services
–5 –4 –3 –2 –1
Change in APEC energy intensity following oil supply disruptionsrelative to the reference case
30
Low incomeexcl. China
Low income
Middle income
High income
APEC total
%
20202005
–12 –10 –8 –6 –4 –2

140 Energy security in APEC
Energy consumption impacts
Together with the reduction in energy intensive production, total primary energy consumption declines rela-tive to the reference case in each sce-nario (fi gure 31). Underlying the fall in total primary energy consumption is a sharp drop in oil consumption in response to higher prices. APEC-wide oil consumption declines relative to the reference case by 7.3 per cent in the 2005 scenario and 9 per cent in the 2020 scenario. In contrast, APEC consumption of coal and electricity
increase relative to the reference case, as energy users substitute away from oil products in response to higher oil prices. It is worth noting, however, that in Mexico, where oil fi red power generates a signifi cant proportion of electricity, the rise in oil costs contributes to a decline in the consumption of electricity relative to the reference case by 2.5 per cent in 2005 and by 1.6 per cent in 2020.
There is some decline in APEC consumption of natural gas relative to the reference case in response to higher LNG prices. However, LNG import volumes are largely determined by contract and hence are not sensitive to
price changes, and therefore not too much weight should be put on the estimate that APEC gas consumption declines by 0.3 per cent relative to the reference case in both scenarios.
Oil consumption impacts vary consid-erably among APEC income groups (fi gure 32). Refl ecting a greater re-duction in energy intensive produc-tion, the decline in oil consumption is particularly pronounced for middle income economies in both scenarios.
Change in APEC TPECfollowing oil supply disruptionsrelative to the reference case
31
Low incomeexcl. China
Low income
Middle income
High income
APEC total
%
20202005
–5 –4 –3 –2 –1
Change in APEC oil consumption following oil supply disruptionsrelative to the reference case
32
Low incomeexcl. China
Low income
Middle income
High income
APEC total
%
20202005
–14 –12 –10 –8 –6 –4 –2

Energy security in APEC 141
This is primarily driven by the decline in competitiveness of energy inten-sive production in Russia.
In the 2005 scenario, low income economies experience the lowest decline in oil consumption among each of the income groups. In contrast, in the 2020 scenario, oil consumption by low income economies declines by more than any other income group — both when China is included and when China is excluded. Behind this marked change in the severity of the impacts on oil consumption lie important developments in the oil sectors of Indone-sia and China in particular. Net oil imports in China, for example, grow by over 200 per cent between 2005 and 2020, greatly increasing the negative income transfer effect on China of an oil supply disruption in the latter part of the projection period. Likewise, while currently a net oil exporter, by 2020 Indonesia has become a signifi cant net oil importer in the reference case, relying on net oil imports to supply 12 per cent of oil consumption.
Similarly, the reduction in oil consumed in high income economies relative to the reference case is greater in 2020 than in 2005. This is because the dependence of high income economies on oil imports, and hence the nega-tive income transfer effect, increases over time. Between 2005 and 2020, net oil imports in the United States, for example, grow by 52 per cent rela-tive to the reference case to 790 million tonnes.
Energy production impactsAPEC producers respond to higher oil prices by raising crude oil production to over 10 per cent above the refer-ence case in both the 2005 scenario and the 2020 scenario (fi gure 33). This is equivalent to an increase in produc-tion of about 138 million tonnes in 2005 and 2020 above reference case levels.
Most of this increase in crude oil pro-duction is concentrated in middle in-come economies, particularly APEC’s two largest oil exporting economies, the Russian Federation and Mexico,
Change in APEC oil production following oil supply disruptionsrelative to the reference case
33
Low incomeexcl. China
Low income
Middle income
High income
APEC total
%
20202005
2 4 6 8 10 12 14

142 Energy security in APEC
together with another signifi cant oil exporter in Malaysia. Oil production in high income economies and in other resource constrained economies such as Thailand also increases in response to higher world oil prices, as high world oil prices make it profi table to operate high marginal cost oil fi elds. Oil production in high income economies increases relative to the reference case by 56 million tonnes in the 2005 scenario, and by 49 million tonnes in the 2020 scenario. The increase is more subdued in 2020 as a result of the ongoing depletion of oil reserves in the reference case between 2005 and 2020.
APEC production of coal also rises relative to the reference case in response to the increase in consumption. Coal production rises relative to the refer-ence case by 17 Mtoe in 2005 in the 2005 scenario and by 23 Mtoe in 2020 under the 2020 scenario. In both instances, China accounts for approxi-mately 60 per cent of the increase.
Similarly, world consumption of gas increases relative to the reference case, leading to higher APEC production and export of gas. However, the increase in APEC gas production is not signifi cant, rising above the reference case by just 1.5 Mtoe in 2005 and by 3 Mtoe in 2020.
Energy trade impactsChanges in energy consumption and energy production determine the impacts of the oil supply disruption scenarios on energy trade. By far the
largest trade impacts are experienced in oil markets. Declining demand for oil leads to a fall in oil imports in all economies (fi gure 34). APEC’s demand for crude oil imports con-tracts by 11 per cent in 2005 under the 2005 scenario relative to the refer-ence case or by 136 million tonnes. In the 2020 scenario, APEC’s crude oil imports decline relative to the refer-ence case by 12 per cent in 2020, or by 211 million tonnes.
While crude oil imports contract, crude oil production and exports by
Change in APEC oil imports following oil supply disruptionsrelative to the reference case
34
Low incomeexcl. China
Low income
Middle income
High income
APEC total
%
20202005
–14 –12 –10 –8 –6 –4 –2

Energy security in APEC 143
APEC expand in response to higher world oil prices (fi gure 35). In the 2005 scenario, for example, APEC exports of crude oil rise by 34 per cent in 2005 relative to the reference case, or by 150 million tonnes. The Russian Federation accounts for a large pro-portion of this expansion, contribut-ing over half in the 2005 scenario and over 70 per cent in the 2020 scenario. Russia’s contribution is signifi cantly larger in the 2020 scenario than in the 2005 scenario because its oil reserves remain abundant in contrast to the resource constraints anticipated for APEC generally.
APEC’s gas and coal trade grows marginally relative to the reference case, refl ecting the increases in gas and coal consumption and production. Fur-thermore, following a shift toward coal and gas and out of oil consumption in regions other than APEC, APEC increases its position as a net exporter of gas and coal to the rest of the world. APEC’s net exports of gas are larger than the reference case by 6 Mtoe and 8 Mtoe in the 2005 scenario and 2020 scenario respectively. Similarly, in both scenarios APEC’s net coal exports are 5 Mtoe larger than in the reference case.
Temporary disruption to Middle East LNG productionLNG imports provide almost all of the natural gas requirements of the APEC economies of Japan, Korea and Chinese Taipei. LNG imports will also become signifi cant over time for China, Mexico and the United States. The capital intensive nature of LNG supply and the lack of a mature spot market inhibit the market’s capacity to respond to a disruption in supply from a major exporter. As demonstrated by the shutdown of the LNG complex in north Aceh in March 2001, this could leave LNG importers vulnerable to disrup-tions to LNG supply from their principal suppliers. As gas is an important input to economic activity in LNG importing economies, any interruption to LNG supplies could be costly for LNG importing economies.
Change in APEC oil exports following oil supply disruptionsrelative to the reference case
35
Low incomeexcl. China
Low income
Middle income
High income
APEC total
%
20202005
10 20 30 40 50

144 Energy security in APEC
Two LNG disruption scenarios are implemented — one in 2005 and one in 2020 — in order to show how developments in the Asia Pacifi c LNG market may alter the impacts of an LNG supply disruption. In these scenarios it is assumed that the Middle East experiences severe disruptions to the pro-duction and export of LNG. For example, security concerns or a technical failure may halt production at one or more important LNG facilities that are dedicated to the Asia Pacifi c market. Middle East gas exports are assumed to return to reference case levels in the year immediately after the disrup-tion in both scenarios.
In both scenarios, it is assumed the disruption to Middle East gas exports is equivalent to 10 per cent of the world’s annual LNG production in the year of the disruption. Based on reference case projections, the volumes of the LNG disruption are estimated to be 15 Mtoe in 2005 and 33 Mtoe in 2020. Relative to the reference case, the LNG disruption interrupts 6 per cent of APEC LNG imports in the 2005 scenario and 7 per cent in the 2020.
The consequences of a disruption to LNG supplies were found to be insig-nifi cant for economies that do not trade in LNG. The analysis is therefore confi ned to those APEC economies that either import or export LNG.
Furthermore, because of the nature of the APEC LNG market, the analysis focuses on the economies that import LNG from the Middle East. Most APEC LNG imports are supplied under long term contracts. These con-tracts link LNG prices to crude oil prices, but do not typically link LNG prices to interruptions in LNG supply. On the one hand this means that an oil price shock will directly raise the price of most LNG delivered under contract, as was modeled in the preceding oil supply disruption scenarios. On the other hand, LNG imported under a contract will not be affected by a disruption to LNG supply, for example in the Middle East, unless the con-tract is with the affected supplier. Given the nature of the LNG market, this analysis focuses on economies that source a signifi cant proportion of LNG supplies from the Middle East or on the spot market.
The focus economies in the 2005 LNG disruption scenario are Japan and Korea, as they currently import LNG from the Middle East, and the United States, which relies heavily on the spot market. In the 2020 scenario, the only additional focus economy is that of Chinese Taipei. Chinese Taipei will begin importing LNG from the Middle East under a long term contract toward the end of the decade.

Energy security in APEC 145
While China and Mexico are expected to commence importing LNG during this decade, it is not clear that these economies will source LNG from the Middle East, and so it is assumed that these economies are not subject to a disruption in LNG supply in either scenario. Other APEC economies are considering introducing LNG imports, specifi cally New Zealand, the Philip-pines, Singapore and Thailand (Ball, Schneider, Fairhead and Short 2004). However, the details of these projects have yet to be decided and so LNG imports are not introduced into these economies in the reference case.
There are fewer economies in APEC that export LNG. Current APEC suppli-ers that are explicitly represented in GTEM include Australia, Indonesia and Malaysia. The Russian Federation is included in the 2020 scenario because it is due to commence exporting LNG to Japan and Mexico later this decade. The United States currently exports small volumes of LNG from Alaska, but is not a major supplier to the APEC region. While there is a proposal to expand LNG production in Alaska, and Peru may commence exporting LNG later this decade, the uncertainties associated with these projects mean that these economies are not treated as exporters in either scenario.
Summary of the impactsThe scenario indicates that a disruption to Middle East exports of LNG to APEC will have marginal impacts on the economies that import LNG from
20 Impacts of the LNG supply disruptions in 2005 and 2020relative to the reference case
Energy Energy consumption imports
Real GNP Total Oil Gas Coal Oil Gas Coal
2002 US$b Mtoe Mtoe Mtoe Mtoe Mtoe Mtoe Mtoe
2005 LNG supply disruption scenarioJapan –0.59 –1.16 0.16 –2.14 0.01 0.16 –2.19 0.01United States 0.00 –0.16 0.07 –0.57 0.13 0.15 –0.46 0.00Korea –0.32 –0.67 0.12 –1.44 0.13 0.12 –1.44 0.13
2020 LNG supply disruption scenarioJapan –0.43 –1.16 0.12 –2.11 0.01 0.12 –2.16 0.01United States –0.09 –0.57 0.32 –1.80 0.42 0.46 –2.01 0.00Korea –0.53 –1.08 0.16 –2.69 0.23 0.16 –2.69 0.22Chinese Taipei –0.17 –1.24 0.08 –0.06 0.09 0.08 –1.81 0.09

146 Energy security in APEC
the Middle East (table 20). These impacts will arise both directly through energy prices, and indirectly through economywide and sectoral impacts. However, even for economies that are engaged in LNG trade, the impacts are signifi cantly smaller in this set of scenarios than in the oil supply disrup-tion scenarios discussed earlier.
Energy price impactsWhile GTEM does not explicitly differentiate LNG supplied under con-tract and LNG supplied on the spot market, it is possible to infer LNG price impacts on the basis of some reasonable assumptions. The majority of LNG traded in the Asia Pacifi c is supplied under long term contracts, with prices linked largely to oil prices. In contrast, spot cargoes of LNG
currently account for about 2 per cent of the Asia Pacifi c market. Given that oil prices do not vary signifi cantly in the LNG disruption scenarios, it is reasonable to assume that LNG con-tract prices do not change for the pur-pose of this analysis. Based on that assumption, it can be inferred that the disruption to LNG supplies leads to an increase in Asia Pacifi c LNG spot prices by 54 per cent in the 2005 sce-nario and by a little over 50 per cent in the 2020 scenario relative to the refer-ence case (fi gure 36).
While the impact on the LNG spot price is marginally less in 2020 than in 2005, the impact on the total gas price is marginally greater in 2020 than in 2005. This is because LNG comprises a larger share of the gas market in 2020 than in 2005. For example, it is estimated in the GTEM reference case that the share of LNG in world total gas output is between 6 and 7 per cent in 2005, and increases to almost 10 per cent in 2020.
Impacts on outputThe reduction in LNG supplies from the Middle East leads to subdued eco-nomic growth in LNG importing economies, while improving economic growth in LNG exporting economies. However, given that LNG constitutes
Change in APEC LNG prices following LNG supply disruptionsrelative to the reference case
36
% 10 20 30 40 50
2020 disruption
2005 disruption
LNG spot priceTotal LNG price
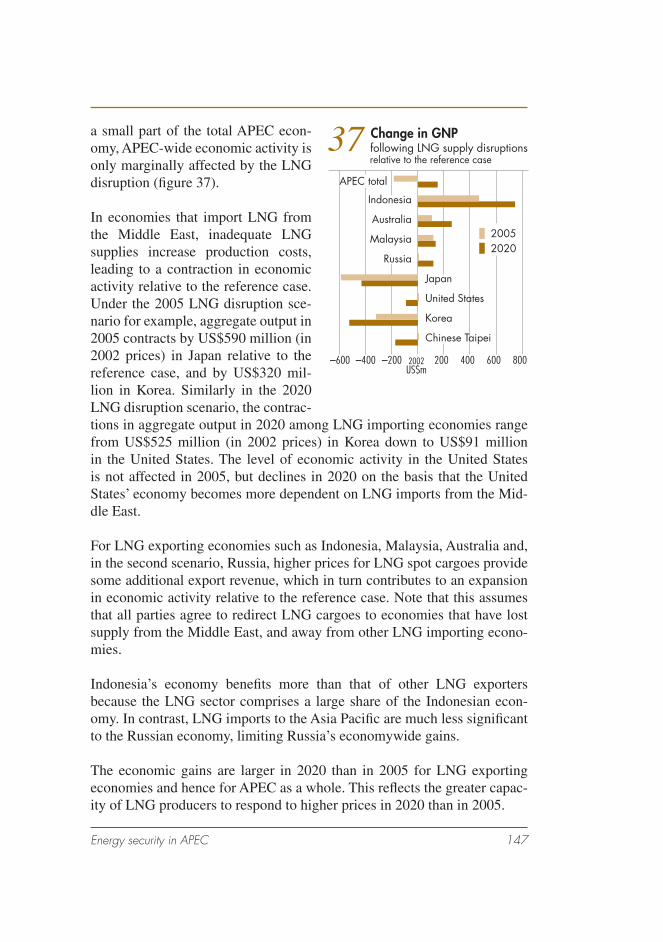
Energy security in APEC 147
a small part of the total APEC econ-omy, APEC-wide economic activity is only marginally affected by the LNG disruption (fi gure 37).
In economies that import LNG from the Middle East, inadequate LNG supplies increase production costs, leading to a contraction in economic activity relative to the reference case. Under the 2005 LNG disruption sce-nario for example, aggregate output in 2005 contracts by US$590 million (in 2002 prices) in Japan relative to the reference case, and by US$320 mil-lion in Korea. Similarly in the 2020 LNG disruption scenario, the contrac-tions in aggregate output in 2020 among LNG importing economies range from US$525 million (in 2002 prices) in Korea down to US$91 million in the United States. The level of economic activity in the United States is not affected in 2005, but declines in 2020 on the basis that the United States’ economy becomes more dependent on LNG imports from the Mid-dle East.
For LNG exporting economies such as Indonesia, Malaysia, Australia and, in the second scenario, Russia, higher prices for LNG spot cargoes provide some additional export revenue, which in turn contributes to an expansion in economic activity relative to the reference case. Note that this assumes that all parties agree to redirect LNG cargoes to economies that have lost supply from the Middle East, and away from other LNG importing econo-mies.
Indonesia’s economy benefi ts more than that of other LNG exporters because the LNG sector comprises a large share of the Indonesian econ-omy. In contrast, LNG imports to the Asia Pacifi c are much less signifi cant to the Russian economy, limiting Russia’s economywide gains.
The economic gains are larger in 2020 than in 2005 for LNG exporting economies and hence for APEC as a whole. This refl ects the greater capac-ity of LNG producers to respond to higher prices in 2020 than in 2005.
Change in GNP following LNG supply disruptions relative to the reference case
37
2002US$m
20202005
–600 –400 –200 200 400 600 800
Chinese Taipei
Korea
United States
Japan
Russia
Malaysia
Australia
Indonesia
APEC total

148 Energy security in APEC
Output changes at the sectoral level are most signifi cant in energy inten-sive manufacturing and in the energy sector. As gas fi red power generates a signifi cant share of electricity in all LNG importing economies consid-ered here, the price of electricity in these economies rises relative to the reference case. As a result, electricity consumption and electricity output are lower than in the reference case for LNG importing economies and for APEC as a whole.
Because the LNG supply disruption raises the price of gas and electricity in LNG importing economies, energy intensive production in these economies loses competitiveness relative to the reference case (fi gure 38). Production of energy intensive commodities is therefore lower in the LNG disruption sce-narios than in the reference case. Production levels in other sectors, includ-ing other manufacturing and services, are also below reference case levels to the extent they rely on electricity and gas in their production processes.
Energy and natural gas impactsA signifi cant decline in gas consumption contributes to a decline in total energy consumption in LNG importing economies relative to the reference case (table 20). Some energy substitution away from gas takes place in these economies, leading to higher levels of consumption of oil and coal than in the reference case.
In LNG importing economies, the contraction in LNG imports relative to the reference case mirrors the con-traction in gas consumption (fi gure 39). Various factors govern how the extent of contraction in consumption and imports varies among economies. The fi rst is the degree of dependence on Middle East LNG. Korea, for example, relies more on the Middle
Change in output of economies importing LNG from the Middle East following LNG supply disruptionsrelative to the reference case
38
20202005
–0.06 –0.04 –0.02 %
Electricity
Services
Other manufacturing
Energy intensive
Change in natural gas imports following LNG supply disruptionsrelative to the reference case
39
20202005
%
Chinese Taipei
Korea
United States
Japan
–12 –10 –8 –6 –4 –2

Energy security in APEC 149
East for imported gas supplies than does any other APEC economy in 2005 and in 2020. Hence the LNG disruption impacts more on Korea’s gas con-sumption and imports than for most other economies.
Another key factor underlying the extent to which LNG imports contract is the opportunity for substitution away from gas. In Chinese Taipei, for example, over three quarters of LNG imports are used to generate electric-ity, a sector in which there are signifi cant opportunities for fuel substitution. By increasing capacity utilisation of coal fi red and nuclear plants, Chinese Taipei is able to reduce its dependence on LNG fi red power relative to the reference case. In this way, Chinese Taipei is able to reduce gas consump-tion and LNG imports relative to the reference case much more cheaply than can economies such as Korea, where the residential sector is the pri-mary gas consuming sector.
The fact that it is less expensive for some importers to adjust to a disrup-tion to LNG supplies than it is for others, reveals that there are opportuni-ties for all to gain from cooperation, and more generally from enhancing market fl exibility. It is assumed in this set of scenarios that economies take advantage of these opportunities. At the very least, it is assumed that LNG cargoes are redirected, for example, from Chinese Taipei toward Korea, in order to reduce the regionwide cost of the LNG disruption. In addition, spot cargoes are made available by redirecting spot cargoes from economies that rely heavily on the spot market, for example the United States; and by a signifi cant increase in spot LNG cargoes from less traditional suppliers to the Asian region, including for example Trinidad and Nigeria. To the extent any of these factors failed to materialise, the costs that result from the LNG supply disruptions would be greater than reported here.
These factors combine in the 2005 LNG disruption scenario to provide LNG spot cargoes to Japan and Korea approximating 13 Mtoe or 16 per cent of total LNG imports for these two economies in 2005. In the 2020 LNG disruption scenario, LNG spot cargoes supplied to Japan, Korea and Chinese Taipei in 2020 are greater still, approximating 36 Mtoe or 27 per cent of total LNG imports for these three economies. This estimate for 2020, although high, is not unreasonable given the developments that are enhancing market fl exibility, including the growth of the spot market (Ball et al. 2004).

150 Energy security in APEC
Temporary blockage of the Malacca StraitThe Malacca Strait is the principal maritime trade route between the Indian and Pacifi c Oceans. While small in size, the Malacca Strait carries approxi-mately a quarter of world maritime trade through its channels. Were it to be blocked, ships would need to travel double the length of the Malacca Strait in order to circumvent the Malacca Strait. This has the potential to impose additional costs on economies that rely on trade fl ows through the Strait of Malacca, including the economies of the Asia Pacifi c. Two scenarios are implemented in this study to analyse the impacts on APEC energy markets of a blockage of the Malacca Strait — one in 2005, and a second in 2020.
In both scenarios, it is assumed that shipping through the Malacca Strait is stopped for 5 weeks. This is not an unreasonably short period of time given the experience and state of readiness of the workforces that manage the Strait, particularly in the narrowest length of the channel alongside Singa-pore. If anything, fi ve weeks may overstate the length of time of any poten-tial blockage. Nonetheless the fi ve week blockage assumed in this study is suffi cient to indicate the nature and extent of impacts of a major blockage.
The stoppage is simulated by assuming the productivity of shipping decreases by an annualised 5 per cent. The size of this decline in productiv-ity is based on the US Department of Energy’s estimate that the size of the fl eet required to navigate around the Malacca Strait would double in the event of a blockage (EIA 2004a). For the purposes of the modeling exer-cise, this is equivalent to assuming that the productivity of shipping through the Strait would be halved during the course of a blockage. A decline in productivity of shipping of 50 per cent over a period of fi ve weeks converts to an annual decline in productivity of almost 5 per cent.
Not all APEC economies depend on the Malacca Strait for trade with non-APEC economies. To refl ect this, the productivity of shipping is not shocked for some APEC economies. In particular, the productivity of shipping is not shocked for trade between non-APEC economies and Canada, Mexico, the Russian Federation and, for some commodities, the United States. The remaining volume of trade that is subject to the shock constitutes 25 per cent of world maritime trade in the GTEM database and this proportion is consistent with EIA estimates of the share of world maritime trade cur-rently fl owing through the Malacca Strait (EIA 2004a).
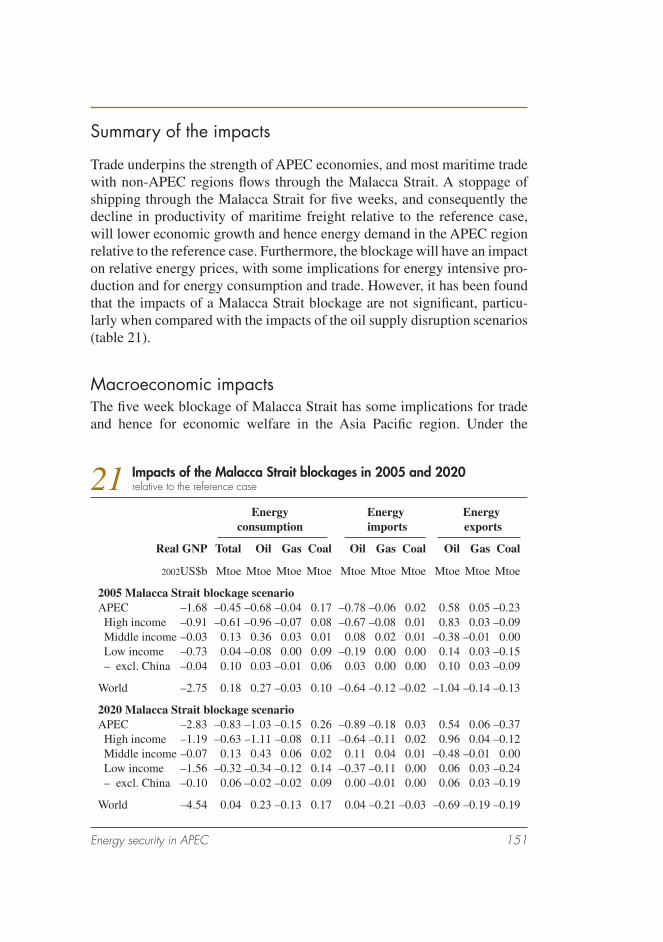
Energy security in APEC 151
Summary of the impacts
Trade underpins the strength of APEC economies, and most maritime trade with non-APEC regions fl ows through the Malacca Strait. A stoppage of shipping through the Malacca Strait for fi ve weeks, and consequently the decline in productivity of maritime freight relative to the reference case, will lower economic growth and hence energy demand in the APEC region relative to the reference case. Furthermore, the blockage will have an impact on relative energy prices, with some implications for energy intensive pro-duction and for energy consumption and trade. However, it has been found that the impacts of a Malacca Strait blockage are not signifi cant, particu-larly when compared with the impacts of the oil supply disruption scenarios (table 21).
Macroeconomic impactsThe fi ve week blockage of Malacca Strait has some implications for trade and hence for economic welfare in the Asia Pacifi c region. Under the
21 Impacts of the Malacca Strait blockages in 2005 and 2020relative to the reference case
Energy Energy Energy consumption imports exports
Real GNP Total Oil Gas Coal Oil Gas Coal Oil Gas Coal
2002US$b Mtoe Mtoe Mtoe Mtoe Mtoe Mtoe Mtoe Mtoe Mtoe Mtoe
2005 Malacca Strait blockage scenarioAPEC –1.68 –0.45 –0.68 –0.04 0.17 –0.78 –0.06 0.02 0.58 0.05 –0.23 High income –0.91 –0.61 –0.96 –0.07 0.08 –0.67 –0.08 0.01 0.83 0.03 –0.09 Middle income –0.03 0.13 0.36 0.03 0.01 0.08 0.02 0.01 –0.38 –0.01 0.00 Low income –0.73 0.04 –0.08 0.00 0.09 –0.19 0.00 0.00 0.14 0.03 –0.15 – excl. China –0.04 0.10 0.03 –0.01 0.06 0.03 0.00 0.00 0.10 0.03 –0.09
World –2.75 0.18 0.27 –0.03 0.10 –0.64 –0.12 –0.02 –1.04 –0.14 –0.13
2020 Malacca Strait blockage scenarioAPEC –2.83 –0.83 –1.03 –0.15 0.26 –0.89 –0.18 0.03 0.54 0.06 –0.37 High income –1.19 –0.63 –1.11 –0.08 0.11 –0.64 –0.11 0.02 0.96 0.04 –0.12 Middle income –0.07 0.13 0.43 0.06 0.02 0.11 0.04 0.01 –0.48 –0.01 0.00 Low income –1.56 –0.32 –0.34 –0.12 0.14 –0.37 –0.11 0.00 0.06 0.03 –0.24 – excl. China –0.10 0.06 –0.02 –0.02 0.09 0.00 –0.01 0.00 0.06 0.03 –0.19
World –4.54 0.04 0.23 –0.13 0.17 0.04 –0.21 –0.03 –0.69 –0.19 –0.19

152 Energy security in APEC
additional cost of maritime trade, world and APEC trade volumes con-tract during the time of the blockage. In the 2005 Malacca Strait blockage scenario, for example, APEC exports contract by 0.05 per cent relative to the reference case, and APEC imports by 0.07 per cent (fi gure 40). The effects are similar in the 2020 Malacca Strait blockage scenario.
In addition to the downturn in aggre-gate trade volumes, there is a trade diversion effect. Relative to the ref-erence case, the increase in maritime freight costs confers a competitive advantage on exporters that are close to the import market in question. As a result, the volume of trade within APEC expands relative to the reference case, whereas the volume of trade among APEC and non-APEC regions contracts relative to the reference case.
The reduction in demand for traded commodities across the world under-mines production and income in the world and in APEC economies. As a result, the Malacca Strait obstruction leads to lower GNP than in the refer-ence case for all APEC income groups (table 21). For APEC as a whole, the fi ve week blockage costs US$1.7 billion (in 2002 dollars) in GNP in the 2005 scenario and US$2.8 billion (in 2002 dollars) in the 2020 scenario. This is far smaller than the contraction in APEC’s economic activity experi-enced in the oil supply disruption scenarios — amounting to US$43 billion (in 2002 dollars) in the 2005 scenario and US$82 billion (in 2002 dollars) in the 2020 scenario.
Energy price impactsBefore analysing the economywide costs at a sectoral level and consider-ing how they fl ow through to APEC energy markets, there is another key to understanding the energy market implications of the blockage of the Malacca Strait. An additional factor is how energy prices change in response to the additional cost of energy trade between the Indian and Pacifi c Oceans.
On the one hand the Malacca Strait blockage leads to a higher cost than the reference case for energy that is sourced outside of APEC, particularly
Changes in APEC annual trade following Malacca Strait blockages relative to the reference case
40
20202005
%–0.10 –0.05 0.100.05
APEC–APEC trade
APEC total imports
APEC total exports

Energy security in APEC 153
crude oil from the Middle East. Fur-ther upward pressure is placed on oil prices because additional fuel is required by the maritime transport services sector in order to circumvent the Malacca Strait. Thus following the Malacca Strait blockage, annual crude oil prices in APEC are around 0.2 per cent higher in both scenarios than in the reference case (fi gure 41).
However, crude oil prices are not ris-ing in all regions. Rather, the rise in freight costs effectively drives a wedge between delivered energy prices in APEC and those in other regions. Thus in both Malacca Strait scenarios, crude oil prices in non-APEC regions are lower than in the reference case for the duration of the blockage, because the decline in APEC demand for oil from the Middle East contributes to a decline in global oil demand.
The opposite story applies to coal. As APEC is a substantial net exporter of coal to the rest of the world, higher freight costs increase the cost of seaborne coal from APEC in regions outside of the Asia Pacifi c. Demand for APEC coal in these regions is therefore lower than in the reference case. Because of the contraction in demand for APEC coal outside of APEC, annual coal prices in the Asia Pacifi c region are 0.08 per cent lower in both scenarios than in the reference case.
Sectoral impactsRefl ecting the small relative energy price effects, the sectoral changes that fl ow from the Malacca Strait blockage are insignifi cant relative to the oil supply disruption scenario (fi gure 42). The largest contraction relative to the reference case is experienced in the other manufacturing sector. But even in this sector, output contracts by less than 0.1 per cent for all income groups. Energy intensive manufacturing is the least affected sector and, in middle income economies, energy intensive manufacturing expands to some degree relative to the reference case. This very small expansion in energy intensive output refl ects the decline in the price of coal in APEC relative to the reference case, as coal is used more than other fuels in energy intensive industries in APEC.
Change in APEC annual energy prices following Malacca Strait blockages relative to the reference case
41
%
CoalOilGas
2020 blockage
2005 blockage
–0.10 –0.05 0.05 0.10 0.15 0.20

154 Energy security in APEC
Energy impactsAPEC energy markets are affected by the blockage of the Malacca Strait, through the implications of the blockage for the level of economic activity, energy prices and energy intensive production.
Marginally lower economic activity in the Malacca Strait scenarios than in the reference case, including in the energy intensive sector, leads to mar-ginally lower energy consumption across APEC. The fi ve week obstruc-
tion results in total energy consump-tion being a mere 0.01 per cent or 0.45 Mtoe lower in the 2005 scenario than in the reference case, and 0.011 per cent or 0.83 Mtoe lower under the 2020 scenario (fi gure 43).
However, the implications for APEC energy consumption vary between fuels because of the changes in rela-tive fuel prices. Thus while APEC consumption of oil is lower during the Malacca Strait blockage than in the reference case, gas consumption is hardly affected and consumption of both coal and electricity is marginally
Change in APEC annual output of selected sectors following Malacca Strait blockages relative to the reference case42
%
Low incomeexcl. China
Low income
Middle income
High income
APEC total20052020
20052020
20052020
20052020
20052020
ServicesOther manufacturingEnergy intensive
–0.08 –0.06 –0.04 –0.02 0.02
Change in total APEC annual energy consumption following Malacca Strait blockagesrelative to the reference case
43
–0.04 –0.03 –0.02 –0.01 0.01%
2020 blockage2005 blockage
Electricity
Coal
Gas
Oil
Total primary energy

Energy security in APEC 155
greater than in the reference case. Annual oil consumption is lower than in the reference case by 0.03 per cent or 0.68 Mtoe in the 2005 scenario, and by 0.04 per cent or 1.03 Mtoe in the 2020 scenario. In contrast, coal con-sumption is 0.17 Mtoe and 0.26 Mtoe higher during the same period in the 2005 and 2020 scenarios respectively than in the reference case.
Given that coal fi red power is assumed to generate approximately 45 per cent of APEC electricity in both 2005 and 2020, the temporary fall in coal prices within APEC reduces the cost of generating electricity and, on the assumption that cost savings are passed on in lower prices, results in margin-ally higher electricity consumption than in the reference case. Total APEC electricity generation is estimated to rise by 0.5 terrawatt hours above the reference case during the blockage in the 2005 scenario and by 0.6 terrawatt hours in the 2020 scenario.
There is some variation in energy consumption effects between income groups, depending on energy import dependence and associated changes in the competitiveness of energy intensive manufacturing. The middle income group of economies, which include most of APEC’s large oil exporters, is relatively self suffi cient in terms of energy and is therefore little affected by the reduction in maritime freight productivity. Therefore, energy intensive production and hence energy consumption in the middle income group of economies rises above the reference case in both scenarios for the dura-tion of the blockage. In contrast, economies with a high degree of depen-dence on energy imports, for example the high income economies of Japan, Chinese Taipei and Singapore, are more exposed to the adverse impact of higher shipping costs on energy prices. For this reason, energy consump-tion in high income economies, and particularly oil consumption, is lower in the year of the blockage in both scenarios than in the reference case (see table 21).
In response to changes in consumption and the relative price effects brought about by the Malacca Strait blockage, APEC total energy production is marginally greater than in the reference case (fi gure 44). This is true of all income groups except for middle income economies.
However, in the Russian Federation, oil and gas producers lack the infra-structure needed to increase exports to the Asia Pacifi c region. Rather, almost all of Russia’s oil and gas export infrastructure serves the Euro-pean market. In both the 2005 and 2020 Malacca Strait scenarios, Russian

156 Energy security in APEC
exports of oil and gas lose competitiveness in the European market against the Middle East relative to the reference case, because of the diffi culties experienced by the Middle East in transport to Asia. As a result, Europe secures spot supplies from the Middle East and minimises purchases from the Russian Federation, thereby reducing European demand for Russian gas and oil exports. Without the infrastructure to tap into the Asian market, Russian production of gas and oil contracts relative to the reference case. However, the contraction is very small in this set of scenarios — oil produc-tion declines by less than 0.05 per cent relative to the reference case in both scenarios and gas production by even less.
Higher freight costs undermine the demand for bulk shipments of commod-ities such as coal, resulting in lower coal production in the APEC region. On the other hand, domestic coal demand increases in coal producing econ-omies, mainly as a result of substitution away from oil and gas in the elec-tricity sector. However, this increase in domestic demand is only enough to offset the decline in exports in the middle income economies, where almost all coal is consumed domestically.
The effects of the Malacca Strait blockage on energy trade, while small, nonetheless refl ect APEC’s position as a net importer of oil and as a net exporter of coal (fi gure 45). APEC relies on long range shipments of oil and gas imports, for example from the Middle East, whereas a signifi cant share of APEC coal exports is shipped to Europe and South Asia. The dis-ruption to shipping through the Malacca Strait increases the cost of oil and
Change in APEC annual energy production following Malacca Strait blockages relative to the reference case44
%
Low income
Middle income
High income
APEC total2005
2020
20052020
20052020
20052020
–0.02 0.040.02 0.080.06 0.120.10
CoalGasOilTotal primary energy

Energy security in APEC 157
gas imports to APEC relative to the reference case and raises slightly the cost of APEC coal delivered in Europe and elsewhere. As a result, APEC imports of gas and oil are lower than in the reference case, as are APEC coal exports.
Intra-APEC energy trade is typically higher in both Malacca Strait block-age scenarios than in the reference case. In response to the regional shortage of oil and gas, APEC economies increase production and exports to other APEC economies. In the coal market, APEC importing economies increase consumption and imports of coal from within APEC relative to the refer-ence case, in response to the regional surplus of coal. This helps to offset the negative, albeit small, impact of the blockage on coal export revenues.
Change in APEC energy trade following Malacca Strait blockages relative to the reference case45
%
APEC totalimports
2005
2020
2005
2020
2005
2020
–0.2 0.40.2 0.80.6 1.21.0
CoalGasOil
APEC–APEC trade
APEC totalexports

158 Energy security in APEC
some economic aspects of energy security policies in the APEC regionIn this chapter, some key economic aspects of energy security risks and policies are discussed, including the economic rationale for government intervention in enhancing energy security, the economic implications of emergency policies to reduce the costs of temporary energy supply disrup-tions and longer term policy response measures to reduce the risk and/or costs of such disruptions in the future.
It should be emphasised that it is beyond the scope of this study to examine in detail the energy security risks and policies of individual APEC econo-mies. The objective is to present relevant information that may contribute to energy security risk and policy assessments that are undertaken by individ-ual APEC economies and that may further contribute to joint assessments within the APEC forum.
Economic rationale for government intervention in energy securityEnergy security has been referred to previously in this report as the reliable and adequate supply of energy at reasonable prices. Energy security may be considered within the context of energy policy whereby energy policy makers aim to ensure the provision of energy at least cost over time given energy technologies and resource availability, and taking into account envi-ronmental impacts and economic and other risks in the outlook. Energy policy is part of the broader economic policy framework whereby the gov-ernment aims to optimise the economic wellbeing of the community over time (in theory, economic wellbeing may be represented by a social welfare function — economic aspects that rely on the subjective judgment of gov-ernment, such as the importance of equity, may be represented within the social welfare function).
The economic rationale for government intervention is based on the pres-ence of market failure (that is, the failure of markets to effi ciently provide some goods and services) and the capacity of the government, fi rst, to iden-tify and assess policy options that address the market failure and, second,
7

Energy security in APEC 159
to implement the policy option judged to result in the highest net economic benefi ts over time. The assessment of the net economic benefi ts of alterna-tive policy options should include any costs of implementation. Any policy option that is not likely to result in positive net economic benefi ts should not be considered for implementation.
A number of criteria may be used to assess alternative policy options includ-ing effi ciency, equity, administrative simplicity and fl exibility to adapt to changing economic and other circumstances. Notably, not all the costs and benefi ts of alternative policy options may be quantifi ed.
In practice, energy services are typically provided by both public (state owned) and private companies, although the mix varies among APEC econ-omies. Public companies may have been formed in response to an identi-fi ed market failure (such as a natural monopoly). For the purposes of the discussion in this section, no distinction is made between public and private companies.
In chapter 6, the economic impacts of three temporary energy supply disrup-tions in 2005 and 2020 were quantifi ed using GTEM, ABARE’s model of the world economy. Temporary supply disruptions were assumed to occur in the world oil and LNG markets, and a temporary closure was assumed to occur in the Strait of Malacca. Consistent with the APEC Energy Security Initiative (chapter 2) and the information on demand and supply side risks to APEC energy markets (chapters 3 and 4), oil supply disruptions represent the main energy security concern in the APEC region. As a consequence, examples presented in this chapter will focus on world oil disruptions and policy responses.
Some key economic effects of a world oil supply disruption are illustrated in box 3. The simple demand–supply framework serves to highlight some of the most important aspects of adjustment in the world oil market — this framework is also useful to indicate the nature of the economic effects of alternative policy options discussed later in this chapter. Some of the most notable aspects of market adjustment to a world oil supply disruption are as follows:
■ a fall in world oil production results in a higher world oil price under the assumption of price rationing (that is, prices are allowed to adjust to re-equilibrate world oil demand and supply);

160 Energy security in APEC
■ a higher world oil price provides an economic incentive to increase oil production in locations outside the source of the disruption (surge pro-duction);
■ a higher world oil price reduces oil consumption by both net oil import-ers and net oil exporters, but consumption of other fuel types increases to the extent that switching to alternatives is viable in the short term (oil conservation and switching);
Box 3: Economic effects of an oil supply disruption on the world oil market
In this box, some key aspects of market adjustment to a temporary oil supply disruption are highlighted, based on a simplifi ed representation of the world oil market. Assuming competitive markets, some key economic effects of an oil supply disruption on the world oil market, a net oil importer and a net oil ex-porter are shown in the following diagrams. It needs to be emphasised that the diagrams should be interpreted as broadly indicative of oil market adjustment.
a. World oil marketPrior to the disruption, the world oil supply (marginal cost) and de-mand (marginal benefi t) curves are given by S
w1S
w1 and D
w1D
w1
respectively (panel a). The world oil market is in equilibrium (that is, marginal cost to the supplier equals marginal benefi t to the user) at the intersection of these curves — at this point, A, world oil pro-duction of Q
w1 is sold at a market
price of Pw1
.
The oil disruption reduces the quantity of oil available on the world market — this is represented by a leftward shift in the world supply curve to S
w2S
w2.
The world oil market adjusts to the oil disruption by moving to the new equi-librium at point B — world oil production falls to Q
w2 and the world oil price
increases to Pw2
.
The net economic cost of the oil disruption may be given by the area ABC (this is also referred to as the deadweight loss). This area represents the forgone benefi ts
continued …
Price
Quantity
C
B
A
Pw2
Pw1
Qw1
Dw1
Sw1
Sw2
Sw1
Sw2
Dw1
Qw2
a World oil market
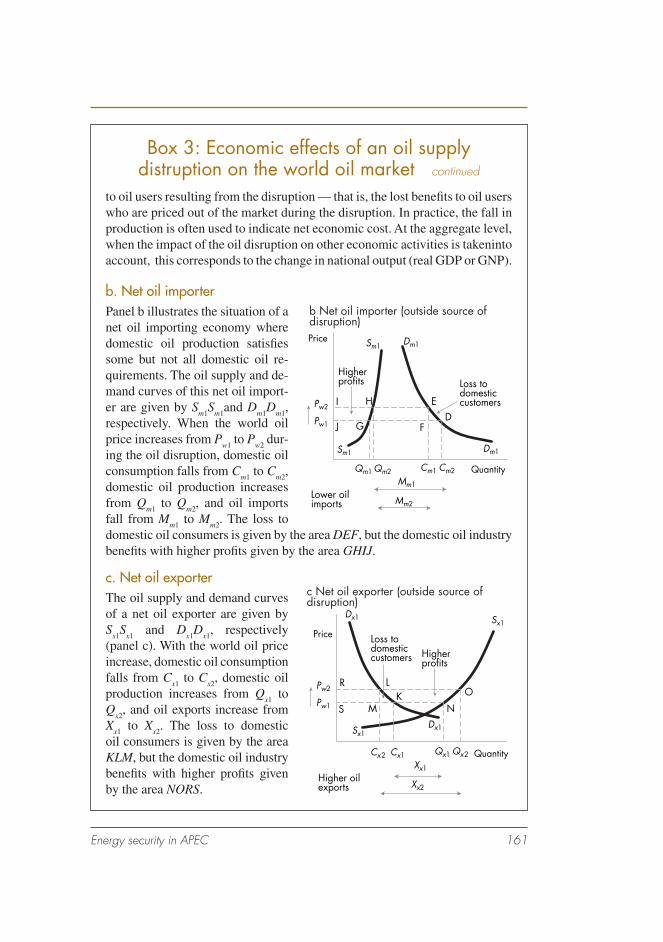
Energy security in APEC 161
Box 3: Economic effects of an oil supply distruption on the world oil market continued
to oil users resulting from the disruption — that is, the lost benefi ts to oil users who are priced out of the market during the disruption. In practice, the fall in production is often used to indicate net economic cost. At the aggregate level, when the impact of the oil disruption on other economic activities is takeninto account, this corresponds to the change in national output (real GDP or GNP).
b. Net oil importerPanel b illustrates the situation of a net oil importing economy where domestic oil production satisfi es some but not all domestic oil re-quirements. The oil supply and de-mand curves of this net oil import-er are given by S
m1S
m1and D
m1D
m1,
respectively. When the world oil price increases from P
w1 to P
w2 dur-
ing the oil disruption, domestic oil consumption falls from C
m1 to C
m2,
domestic oil production increases from Q
m1 to Q
m2, and oil imports
fall from Mm1
to Mm2
. The loss to domestic oil consumers is given by the area DEF, but the domestic oil industry benefi ts with higher profi ts given by the area GHIJ.
c. Net oil exporterThe oil supply and demand curves of a net oil exporter are given by S
x1S
x1 and D
x1D
x1, respectively
(panel c). With the world oil price increase, domestic oil consumption falls from C
x1 to C
x2, domestic oil
production increases from Qx1
to Q
x2, and oil exports increase from
Xx1
to Xx2
. The loss to domestic oil consumers is given by the area KLM, but the domestic oil industry benefi ts with higher profi ts given by the area NORS.
Price
Quantity
Loss todomesticcustomers
Higherprofits
Lower oilimports
E
FGJ
I HD
Pw2
Sm1
Qm1 Qm2 Cm1 Cm2
Mm1
Mm2
Sm1
Dm1
Dm1
Pw1
b Net oil importer (outside source of disruption)
Price
Quantity
Loss todomesticcustomers Higher
profits
MK O
NS
R L
Sx1
Sx1
Dx1
Dx1
Pw2
Pw1
c Net oil exporter (outside source of disruption)
Higher oilexports
Cx2 Cx1 Qx1 Qx2
Xx1
Xx2

162 Energy security in APEC
■ net oil importers reduce net oil imports; and
■ net oil exporters outside the source of the disruption increase net oil exports, benefi ting from the temporary increase in the world oil price.
Private companies invest in supply reliability provided there is an economic incentive to do so (ignoring any policy requirements). Private companies may adopt a range of risk sharing and reducing measures designed to offset, at least to some extent, the negative impact of temporary supply disrup-tions on profi tability. Private investment in energy supply reliability is not included explicitly in either GTEM or the demand–supply framework pre-sented in box 3.
Private companies may manage risks, either directly or indirectly, by invest-ing in:
■ stocks – the major approach for smoothing fl uctuations in both sup-ply and demand where it is feasible to store the fuel type (particularly important for commodities such as oil and LNG).
■ excess capacity – particularly an issue for sources of energy that may not be stored, such as electricity.
■ long term contracts – particularly important for LNG trade where infrastructure costs are high for both LNG exporters and importers, although LNG trade on the spot market is likely to expand over time, allowing market participants further opportunities to smooth tempo-rary fl uctuations in supply and demand.
■ futures markets – important for managing price and exchange rate risk in the short term; they also provide an economic incentive for specula-tors to invest in information that may enable them to participate profi t-ably in the market.
■ market information – to provide more accurate assessments of the ben-efi ts, costs and risks in the outlook and hence in the net economic ben-efi ts of investing in various supply reliability measures.
■ exploration – for new energy resource fi elds or deposits and, more broadly, research and development into, and the adoption of, tech-nologies that facilitate the exploration, development, production and environmental management activities in the upstream energy industry (with implications for the diversity in both the location and mix of energy resources available for production.
Energy security in APEC 163
■ research and development – into, and the adoption of, energy conser-vation and switching technologies that aim to reduce energy consump-tion and increase the short and longer term capacity of energy users to switch between alternative fuel types in response to changes in relative prices.
■ other diversifi cation strategies – as appropriate to the circumstances of the company (for example, participation in joint ventures).
Consideration of government intervention in energy security is justifi ed if private investment in energy supply reliability is assessed to be lower than some optimal level. Economic arguments relating to government involve-ment in energy security are discussed in a number of other studies (see, for example, Bohi 1993; Lynch 1997; APERC 2000; Owen 2004).
Several factors are relevant when considering the economic rationale for government intervention in energy security, including:
■ external benefi ts of private investment in energy supply reliability mea-sures
■ external costs of energy supply disruptions
■ attitudes toward risk by private investors.
In addition, there are other aspects of energy markets that have the capacity to infl uence energy supply reliability outcomes, including sources of mar-ket failure not directly related to energy security and government policies that address those market failures — these aspects are noted later in this chapter.
Public good nature of investment in energy supply reliabilityPrivate investment in energy supply reliability results in benefi ts to other participants in the energy sector, including those in overseas economies (this is the public good nature of investment in energy supply reliability). Free riding results in levels of investment that are below the optimal level since these additional benefi ts are not incorporated in the decision making process of individual private companies (that is, at the given market price, the marginal benefi t of the investment in energy supply reliability exceeds the marginal cost).

164 Energy security in APEC
External costs of energy supply disruptions
There are signifi cant macroeconomic costs of energy supply disruptions, refl ecting the importance of energy as an input in all sectors of the economy (see table 6), and institutional rigidities that impede effi cient adjustment of the economy to the disruption. Equity also becomes a signifi cant issue for governments during severe energy supply disruptions (an aspect of risk assessments that relies on the subjective judgment of governments). If the energy sector does not incur the full costs of energy supply disruptions, the economic incentive to invest in energy supply reliability is lower than would otherwise be the case.
Risk and attitudes toward risk — implications for private investment in energy supply reliabilityThe presence of risk also represents a form of market failure (in theory, perfectly competitive markets are assumed to operate under conditions of perfect information). In essence, this study is an assessment of the capacity of the private sector to respond to the risk of energy supply disruptions. All markets are characterised by risk, although there is considerable variation between economic activities. The presence of risk in itself is typically not argued to be suffi cient cause for government intervention. However, risk is an important consideration in policy formulation where risks are relatively high and the consequences of adverse outcomes are costly.
An important aspect of risk is that private investors are assumed to be risk averse, but effi cient resource allocation relies on risk neutral behavior. A risk averse investor is relatively more concerned about the risk of unexpected losses than the prospect of unexpected gains. In the case of the potential for energy supply disruptions, private investors need to assess the trade off between incurring with certainty the costs associated with energy supply reliability measures (such as holding stocks) against any uncertain future benefi ts of the investment during energy supply disruptions.
It is important for policy makers to note that a risk averse approach by private companies to investment decisions on energy supply reliability measures creates a wedge between optimal and actual levels of private investment in energy supply reliability. If the risks associated with future benefi ts from investing in supply reliability increase and the expected benefi ts remain unchanged, private investment in energy supply reliability will fall, increas-

Energy security in APEC 165
ing the extent to which private investment in energy supply reliability is below the optimal level. (See Hogan 2003a,b for further information on risk aversion and the implications of risk for private investment decisions.)
While a risk averse approach by private investors may not in itself justify government intervention, it is an important consideration in assessing opti-mal levels of investment in energy supply reliability.
Emergency policy response measures to energy supply disruptionsIt was argued in the previous section that private investment in energy sup-ply reliability tends to be below the optimal level — that is, energy markets tend to underinvest in energy supply reliability. This provides the economic justifi cation for considering government intervention in energy security, either directly through public provision or indirectly to increase private investment in energy supply reliability.
In practice, energy supply reliability is infl uenced by a mix of short term and longer term measures. From a government perspective, it is important to maintain an emergency response strategy to reduce the costs of energy supply disruptions since the probability of these events occurring is posi-tive.
Investment in stocks is the most important mechanism for smoothing short term fl uctuations in supply and demand. Other response measures often considered as part of an emergency response include demand restraint through nonprice rationing mechanisms, surge production, fuel switching, information sharing and international cooperation.
Economic role of energy stocksIn general terms, stocks of energy commodities are that part of production held in reserve for future use. In the oil industry, there are three types of stocks:
■ primary stocks – associated with the production and refi ning stages of the industry, which include stocks of crude oil, natural gas liquids and feedstocks as well as stocks of petroleum products. Stocks in this category may be held by companies or governments.

166 Energy security in APEC
■ secondary stocks – associated with the distribution of oil from the large distribution terminals to the small distribution stations includ-ing wholesalers, retailers and petrol stations. Note that some petroleum products bypass this stage and are transported directly from the refi n-ery to the end user (for example, aviation turbine oil to airports).
■ tertiary stocks – held by consumers, including for example fuel oil at electricity generating plants, automotive diesel oil or gasoline in trucks and motor vehicles, and industrial and commercial stocks.
This categorisation may be applied to other energy commodities, although secondary stocks are not relevant in all cases. For example, black coal is a major energy commodity that is traded internationally and is mainly used in the iron and steel industry (metallurgical or coking coal) and for electric-ity generation (thermal or steaming coal). However, brown coal may not be transported signifi cant distances or stored due to the risk of spontaneous combustion and, as a consequence, power plants are colocated with brown coal deposits.
The role of stocks is discussed in several papers including, for example, Brennan (1958); Newbery and Stiglitz (1981); Lowry (1988); Williams and Wright (1991); and Rey (1996).
It may be useful to distinguish between nonspeculative and speculative motives for holding stocks, where nonspeculative motives for holding stocks include pure storage, transactions demand and precautionary demand:
■ pure storage – includes minimum operating stocks (comprising unavail-able inventories and working inventories) and stocks required to smooth production under conditions of day to day fl uctuations in demand.
■ transactions demand – includes stocks that account for the spatial dis-tribution of users — the convenience of these stocks is less delay and lower costs in moving these products to market.
■ precautionary demand – includes stocks that are held to avoid stock-out costs, which are the costs incurred when stocks held by the com-pany fall to zero following a surge in demand or disruption in supply. In these circumstances, the options of the company are to make an unplanned drawdown of stocks, an unplanned increase in production, an unplanned purchase of the product on the market or refusal to sup-ply customers.
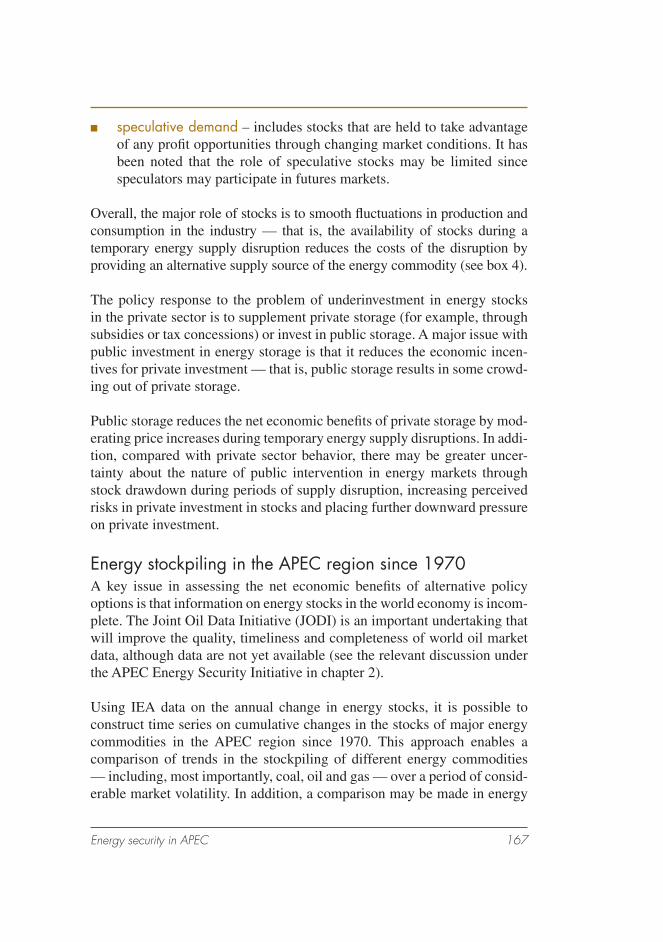
Energy security in APEC 167
■ speculative demand – includes stocks that are held to take advantage of any profi t opportunities through changing market conditions. It has been noted that the role of speculative stocks may be limited since speculators may participate in futures markets.
Overall, the major role of stocks is to smooth fl uctuations in production and consumption in the industry — that is, the availability of stocks during a temporary energy supply disruption reduces the costs of the disruption by providing an alternative supply source of the energy commodity (see box 4).
The policy response to the problem of underinvestment in energy stocks in the private sector is to supplement private storage (for example, through subsidies or tax concessions) or invest in public storage. A major issue with public investment in energy storage is that it reduces the economic incen-tives for private investment — that is, public storage results in some crowd-ing out of private storage.
Public storage reduces the net economic benefi ts of private storage by mod-erating price increases during temporary energy supply disruptions. In addi-tion, compared with private sector behavior, there may be greater uncer-tainty about the nature of public intervention in energy markets through stock drawdown during periods of supply disruption, increasing perceived risks in private investment in stocks and placing further downward pressure on private investment.
Energy stockpiling in the APEC region since 1970A key issue in assessing the net economic benefi ts of alternative policy options is that information on energy stocks in the world economy is incom-plete. The Joint Oil Data Initiative (JODI) is an important undertaking that will improve the quality, timeliness and completeness of world oil market data, although data are not yet available (see the relevant discussion under the APEC Energy Security Initiative in chapter 2).
Using IEA data on the annual change in energy stocks, it is possible to construct time series on cumulative changes in the stocks of major energy commodities in the APEC region since 1970. This approach enables a comparison of trends in the stockpiling of different energy commodities — including, most importantly, coal, oil and gas — over a period of consid-erable market volatility. In addition, a comparison may be made in energy

168 Energy security in APEC
stockpiling trends between the APEC region and the world economy, as well as between individual APEC economies.
Cumulative changes in stocks for energy, coal, oil and gas since 1970 in the APEC region and world economy are presented in fi gure 46. Between 1970 and 2002, APEC energy stocks increased by 368 Mtoe mainly through a
Box 4: Some key economic implications of oil stocks for the world oil market
Some key implications of oil stocks for the world oil market are presented in the diagram. In the absence of oil stocks, the world oil supply and demand curves are given by S
w1S
w1 and D
w1D
w1, respectively. Without stockholding
capacity, world oil production of Qw1
is the same as world oil consumption, and the world oil price is P
w1. The impact of a temporary oil supply disruption
on the world oil market without stocks was presented in box 3.
To identify the economic incentives for investing in stocks, expectations need to be introduced into the fi gure. Assume P
w1 is the expected world oil price.
In this simplifi ed framework, if the current price falls below the expected price, producers have an incentive to divert part of their pro-duction into stocks and delay sales. These stocks become available for use in years where the actual price is above the expected price (as would occur during a temporary oil supply disruption). The impact of oil stocks is to pivot the world oil supply curve around the expected price, with the new world supply curve given by S’
w1S’
w1.
Similar arguments may be made for oil consumers to the extent that
they are in a position to hold stocks. The impact of oil stocks is to pivot the world oil demand curve around the expected price, with the new world de-mand curve given by D’
w1D’
w1 (see Rey 1996 for further discussion).
The key role of oil stocks is therefore to smooth fl uctuations in supply and demand conditions.
Price
Quantity
Pw1
Qw1
Dw1
Sw1 S’w1
S’w1
Sw1
Dw1D’w1
D’w1
Illustrative effects of oil stocks on world oil supply and demand

Energy security in APEC 169
rise in oil stocks (62 per cent: 52 per cent from increased stocks of crude oil, natural gas liquids and feedstocks, and 10 per cent from increased stocks of petroleum products). Increases in gas and coal stocks accounted for 26 per cent and 12 per cent, respectively, of the increase in total energy stocks over the period.
Nearly two thirds of the overall buildup in energy stocks occurred during the 1970s, which would be consistent with the assessment of increased sup-ply side risks following the oil price shocks in the decade (see fi gure 13 for developments in world energy prices since the early 1970s). Since that time, stockpiling trends have varied between energy commodities — coal stocks have declined since 1986, oil stocks have almost doubled since 1980 but the rate of increase has slowed, and gas stocks have also almost doubled since 1980, with a signifi cant buildup occurring in the mid-1990s (gas stocks were 60 Mtoe higher, on average, between 1981 and 1993 than in 1970, and 93 Mtoe higher between 1994 and 2002).
There have been signifi cant differences in the composition of oil stocks since 1970. This is indicated by shifts in stockpiling trends for crude oil,
100
200
50
150
Cumulative changes in APEC and world energy stocks since 197046
Mtoe
10
20
30
50
Mtoe
100
150
300
200
100
Energy Coal
Oil Gas
APEC
World
APEC
World
APEC
World
APEC
World
1972 1982 1992 20021972 1982 1992 2002
Mtoe Mtoe

170 Energy security in APEC
natural gas liquids and feedstocks and for petroleum products, and these shifts are most pronounced for the world economy (fi gure 47).
Energy stockpiling trends in the APEC region have been broadly similar to those in the world economy. Overall, however, there has been greater emphasis in the APEC region on building oil stocks and less emphasis on building gas stocks. Between 1970 and 2002, world energy stocks increased by 721 Mtoe, with 52 per cent of the increase coming from a buildup in oil stocks, 34 per cent from increased gas stocks and 13 per cent from increased coal stocks.
There is considerable variation in stockpiling trends since 1970 in the indi-vidual APEC economies (fi gure 48). As discussed in chapter 2, in recent years, there has been increased concern within the APEC region about heightened energy security risks and the preparedness of economies in the case of a major oil supply disruption. Oil stockholding policies of APEC economies were presented in table 2. The paper ‘Best practice principles for the establishment and management of strategic oil stocks’ was endorsed by APEC Energy Ministers at their 6th meeting in Manila, the Philippines, in June 2002 (see APEC 2002c).
There has been some recent analysis of the potential for joint investment by a number of smaller net oil importing APEC economies in an oil stockpil-ing facility. For these economies, the economies of scale in a joint facility would reduce the costs that would otherwise be incurred in storing similar quantities of oil in separate facilities in each economy. The costs associ-
Cumulative changes in APEC and world stocks of oil and oil products since 197047
APEC
World
APEC
World
1972 1982 1992 20021972 1982 1992 2002
Mtoe
Crude oil, NGL and feedstocks Petroleum products
100
200
300
Mtoe
25
50
75

Energy security in APEC 171
Cumulative changes in energy stocks since 1970, by APEC economy48
–50
Mtoe
50
100
150
–5
5
Mtoe
10
15
–10Mtoe
Mtoe
Mtoe
3020
50
40
10
–5
5
1015
20
25
–30
–15
1972 1982 1992 2002
United States
Australia
Japan
Chinese Taipei
Korea
–25
–20–15
–5
–10
Mtoe
Mtoe
Mtoe
Mtoe
Mtoe
5
–0.2
0.2
0.4
10
20
30
–0.50
–0.25
0.25
0.50
–2.5
–0.5
–1.5
–2.0
–1.0
1972 1982 1992 2002
Canada
Hong Kong
Singapore
New Zealand
Brunei
GasOilCoalEnergy

172 Energy security in APEC
Cumulative changes in energy stocks since 1970, by APEC economy48
–1.0–0.5Mtoe
1.00.5
2.53.0
1.52.0
–5
5
Mtoe
10
15
–1.0–0.5
–0.5
Mtoe
Mtoe
Mtoe
1.00.5
2.0
1.5
–50
–25
25
–2
2
7
68
10
–2.0
–1.5–1.0
–0.5
Mtoe
Mtoe
Mtoe
Mtoe
Mtoe
1.0 0.5
–10
2010
4030
50
1.52.0
0.51.0
2.5
–2.0–1.5
1.01.5
0.5
–0.5–1.0
–0.5
2.0
2.5
1.00.5
1.5
1972 1982 1992 2002
GasOilCoalEnergy
Chile
Mexico
Thailand
China
Indonesia
Malaysia
Russian Federation
Peru
Philippines
Viet Nam
1972 1982 1992 2002

Energy security in APEC 173
ated with a range of options for such a joint facility have been examined in APERC (2000, 2002a). The benefi ts of additional oil stocks are the reduced costs of any temporary oil supply disruptions. While APERC provided some indicative estimates of the costs of oil supply disruptions, the modeling analysis in chapter 6 of this report provides more comprehensive estimates of the economic impacts of a major global oil supply disruption and hence the benefi ts of investing in oil stocks.
The GTEM analysis contributes to a better understanding of the costs of temporary energy supply disruptions, but it should be emphasised that the costs, benefi ts and risks of investing in emergency oil stockpiling facilities need to be assessed by individual member economies.
Other emergency response measuresMarket adjustment to an oil supply disruption was discussed earlier in this chapter (see also box 3). Energy prices have a key role in signaling varia-tions in supply and demand conditions. During an energy supply disruption, higher energy prices is part of the process that allows energy to be rationed to users who place the highest value on the energy source. That is, price rationing is an important part of the normal operation of markets, and the market response to volatility. Price rises encourage demand restraint, fuel switching and surge production in the short term.
There are two particular issues relevant here. Economic regulation of natu-ral gas and electricity markets typically limits the extent to which prices may rise in response to an energy supply disruption, refl ecting concern about any price rise being sustained over the longer term (monopoly pric-ing issues). Rigidities in pricing in the natural gas and electricity markets increase the burden of adjustment on other parts of the energy market. This has been one of the issues addressed through the process of energy market reform in many economies in recent years (energy market reform is dis-cussed further in the next section).
A second issue is that, during a severe oil supply disruption, the price rises associated with price rationing may result in signifi cant concern about the capacity of emergency services and people on lower incomes (includ-ing welfare recipients) to maintain access to meet some reasonable level of energy requirements. Emergency services provided by government (such as hospitals and fi re stations) usually have annual budgets that are

174 Energy security in APEC
not adjusted contemporaneously with temporary sharp rises in the cost of essential inputs (such as energy). Large energy price rises in the short term have signifi cant adverse consequences for the equity of the adjustment to the disruption — that is, the costs of the disruption are not borne equitably throughout society since people on low incomes will spend proportionately more of their income on energy. Suffi ciently large price rises also increase the economic incentives for illegal, or black market, activity in the energy commodity.
Various forms of nonprice rationing mechanisms are adopted by govern-ments during an emergency. Quantity rationing may be achieved through:
■ direct allocation – whereby the government allocates energy supplies directly to energy users.
■ demand suppression – whereby the fl exibility of energy purchases and consumption is restricted — for example, an odds and evens purchas-ing system (based on the car registration number) restricts access to service stations to every second day.
■ queuing – whereby energy supplies are allocated on a fi rst come fi rst served basis.
In practice, some combination of these options is used, with direct alloca-tion to emergency uses, and demand suppression and queuing mechanisms applied to other energy consumers. Some economic implications of alterna-tive rationing systems are discussed in Heyhoe and Levantis (2003).
To complement quantity rationing, information programs by governments encouraging energy users to adopt more energy conservationist practices, at least for the duration of the shortage, may further restrain demand. Informa-tion programs aim to change the tastes and preferences of energy consum-ers (through moral suasion).
International cooperation is an important aspect of the policy response to a major global energy supply disruption. Governments need information on the nature of the shock, fi rst, to identify and assess policy options to reduce the magnitude and duration of the energy supply disruption (that is, reduce the disruption costs by addressing the source of the shock directly) and, second, to plan and implement the appropriate emergency policy response. The importance of international cooperation and information sharing is well recognised through the APEC Energy Security Initiative.

Energy security in APEC 175
Longer term policy response measuresIt was noted in chapter 4 that any risk assessment of temporary energy sup-ply disruptions in the APEC region requires information on the probability or likelihood of potential energy supply disruptions occurring and the dam-age or cost of each potential disruption. This information is required to assess the net economic benefi ts of policy intervention in both the short and longer term.
Since the probability of a major energy supply disruption occurring is posi-tive, governments need to maintain an emergency response capability. How-ever, there are various longer term policy measures that aim to reduce the costs of disruptions in the future, which will infl uence the need for invest-ment in emergency response measures, particularly energy stockpiles.
Longer term policy measures aim to reduce the costs of disruptions in the future by:
■ reducing the probability of major energy supply disruptions occurring in the future – that is, changing the risk profi le of possible energy sup-ply shocks such that, even if the cost of a particular shock is unchanged, the expected cost of future energy supply disruptions is lowered.
■ reducing the costs of any given major energy supply disruption – that is, changing the cost profi le of possible energy supply shocks such that, even if the probabilities assigned to future possible disruptions are unchanged, the expected cost of future energy supply disruptions is lowered.
Longer term energy security policies are discussed in a number of stud-ies, including Bohi (1993); Lynch (1997); APERC (2000); Bielecki (2002); Cleveland and Kaufmann (2003).
Diversifi cation of fuel types and fuel sources is one of the most important components of the longer term policy response to the risk of major tem-porary energy supply disruptions. A second important component of the longer term policy response is research and development (R&D) into, and adoption of, energy technologies that may reduce the risk and/or cost of disruptions, for example, by increasing the fl exibility of markets to adjust to supply disruptions.
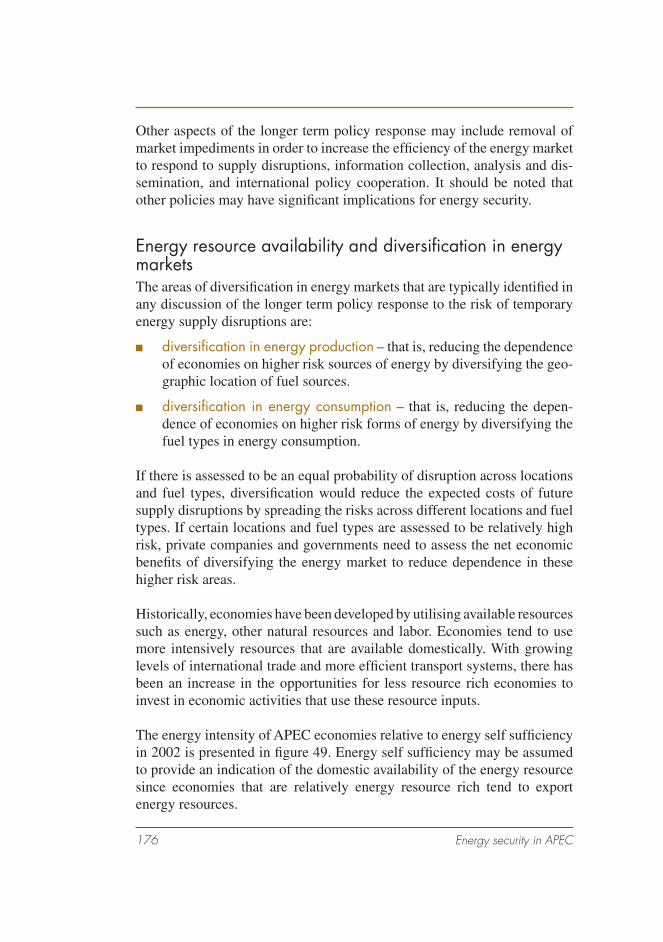
176 Energy security in APEC
Other aspects of the longer term policy response may include removal of market impediments in order to increase the effi ciency of the energy market to respond to supply disruptions, information collection, analysis and dis-semination, and international policy cooperation. It should be noted that other policies may have signifi cant implications for energy security.
Energy resource availability and diversifi cation in energy marketsThe areas of diversifi cation in energy markets that are typically identifi ed in any discussion of the longer term policy response to the risk of temporary energy supply disruptions are:
■ diversifi cation in energy production – that is, reducing the dependence of economies on higher risk sources of energy by diversifying the geo-graphic location of fuel sources.
■ diversifi cation in energy consumption – that is, reducing the depen-dence of economies on higher risk forms of energy by diversifying the fuel types in energy consumption.
If there is assessed to be an equal probability of disruption across locations and fuel types, diversifi cation would reduce the expected costs of future supply disruptions by spreading the risks across different locations and fuel types. If certain locations and fuel types are assessed to be relatively high risk, private companies and governments need to assess the net economic benefi ts of diversifying the energy market to reduce dependence in these higher risk areas.
Historically, economies have been developed by utilising available resources such as energy, other natural resources and labor. Economies tend to use more intensively resources that are available domestically. With growing levels of international trade and more effi cient transport systems, there has been an increase in the opportunities for less resource rich economies to invest in economic activities that use these resource inputs.
The energy intensity of APEC economies relative to energy self suffi ciency in 2002 is presented in fi gure 49. Energy self suffi ciency may be assumed to provide an indication of the domestic availability of the energy resource since economies that are relatively energy resource rich tend to export energy resources.

Energy security in APEC 177
While energy is a key input in all economies, there is some tendency for energy intensity to increase with energy self suffi ciency. In particular, energy intensity tends to be higher for net energy exporters (that is, where energy self suffi ciency exceeds 100 per cent). Notably, there are two economies with low energy self suffi ciency (less than 50 per cent) and energy intensity levels that are higher than others in this group — the two economies are Singapore and the Republic of Korea.
With the exception of a small number of economies (which may be referred to as outliers), there tends to be a positive relationship between intensity of use and self suffi ciency for the individual fuel types — coal, oil and gas — although there is some variation between fuel types (fi gure 49). For coal, there are two economies with low coal self suffi ciency but, compared with other economies in this group, relatively high levels of coal intensity (Chi-nese Taipei and the Republic of Korea), and a further two economies with coal self suffi ciency close to 110 per cent in 2002 and coal intensity levels
Energy intensity and self sufficiency in APEC economies, by fuel type, 200249
Energy
Oil
Coal
Gas
0.0
0.1
0.2
0.3
0 100 200 300
0 100 200 300
Gas self sufficiency (%)Oil self sufficiency (%)
0 200 400
Excludes Brunei and PNG
Ener
gy in
tens
ity
(toe/
US$
'000
) O
il in
tens
ity
(toe/
US$
'000
)
Gas
inte
nsity
(to
e/U
S$'0
00)
Coa
l int
ensi
ty
(toe/
US$
'000
)
Energy self sufficiency (%) Coal self sufficiency (%)
0.0 0.0
0.2
0.4
0.6
0.05
0.10
0.15
0 200 4000.0
0.1
0.2
0.3

178 Energy security in APEC
among the highest in the APEC region (China and the Russian Federation). For oil, Singapore and the Republic of Korea are the two economies with low oil self suffi ciency but relatively high oil intensity. For gas, the Russian Federation is notable for being the most gas intensive economy in APEC, with substantial surplus production relative to domestic requirements (gas self suffi ciency was 147 per cent in 2002).
Diversifi cation in energy markets is an important mechanism to reduce the costs of temporary energy supply disruptions. Any economic assessment of the appropriate level of diversifi cation needs to take into account the net eco-nomic benefi ts over time from using relatively abundant energy resources, particularly in low risk geographic locations in the world economy.
Information on world energy resource availability and the geographic distri-bution of world energy reserves and production was provided in chapter 4 — see, in particular, fi gures 10 and 11. Coal is the most abundant resource that is mainly located in relatively low risk geographic regions, while oil is the least abundant resource that is mainly located in higher risk geographic regions — gas falls between coal and oil in terms of abundance and location.
In this study, an index is constructed to provide an indicator of the level of diversifi cation in energy consumption in individual APEC economies (table 22). This diversifi cation index has a value between 0 and 1, with a lower number indicating a more diverse (or less concentrated) energy mar-ket (it may be noted that this diversifi cation index is based on the Herfi n-dahl–Hirschman index of market concentration and is equal to the sum of squared market shares of each fuel type in energy consumption).
Diversifi cation indexes are constructed to summarise the fuel mix in total primary energy consumption (TPEC), electricity generation and total fi nal energy consumption (TFEC) in twenty APEC economies in both 1980 and 2002 (table 22). It should be noted that the diversifi cation indexes for the region and income categories (APEC and world regions, and the APEC income groups) are based on the fuel shares in the corresponding aggre-gated energy consumption.
In the APEC region, the fuel mix in total primary energy consumption and total fi nal energy consumption was more diverse in 2002 than in 1980 (that is, the diversifi cation index was lower in 2002 than in 1980), while the fuel mix in electricity generation was more concentrated in the recent period.

Energy security in APEC 179
22 Diversifi cation index for fuel types in energy consumption, by APEC economy based on the Herfi ndahl–Hirschman index a
Total primary Total fi nal energy Electricity energy consumption generation consumption
1980 2002 1980 2002 1980 2002
no. no. no. no. no. no.
United States 0.31 0.27 0.32 0.34 0.37 0.37Canada 0.30 0.25 0.49 0.40 0.35 0.32Australia 0.36 0.32 0.56 0.63 0.38 0.34Hong Kong, China 0.99 0.38 1.00 0.54 0.57 0.52Japan 0.50 0.32 0.29 0.22 0.50 0.46Singapore 1.00 0.75 1.00 0.50 0.71 0.69Chinese Taipei 0.55 0.35 0.42 0.37 0.47 0.44New Zealand 0.28 0.24 0.71 0.44 0.36 0.28
Republic of Korea 0.53 0.34 0.63 0.32 0.46 0.44Brunei Darussalam 0.82 0.55 0.98 0.98 0.69 0.55Chile 0.36 0.26 0.50 0.36 0.39 0.33Malaysia 0.52 0.41 0.74 0.62 0.60 0.42Mexico 0.51 0.42 0.42 0.27 0.43 0.47
Russian Federation na 0.35 na 0.28 na 0.25Thailand 0.47 0.31 0.68 0.55 0.44 0.38Peru 0.45 0.38 0.56 0.69 0.44 0.42China 0.39 0.40 0.40 0.63 0.53 0.24Philippines 0.41 0.27 0.51 0.23 0.40 0.40Indonesia 0.43 0.26 0.60 0.27 0.46 0.32Viet Nam 0.64 0.37 0.37 0.35 0.44 0.42Papua New Guinea na na na na na na
APEC d 0.29 0.25 0.25 0.29 0.32 0.27High income 0.33 0.28 0.25 0.28 0.38 0.38
Middle income 0.47 0.30 0.44 0.24 0.42 0.25
Low income 0.34 0.33 0.36 0.51 0.37 0.24– excluding China 0.42 0.26 0.46 0.26 0.41 0.33
World 0.28 0.24 0.25 0.25 0.30 0.26
a The Herfi ndahl–Hirschman index is a measure of market concentration. In this study, the index is referred to as a diversifi cation index, and is equal to the sum of squared market shares — a market share is the share of each fuel type in the energy market. The index has a value between 0 and 1, with a higher number indicating a less diverse (or more concentrated) energy market. na Not available.Source: Based on IEA (2004a,b).

180 Energy security in APEC
Between 1980 and 2002, the fuel mix in total primary energy consump-tion became more diversifi ed in all APEC economies except China, which recorded a minor rise. In 2002 the diversifi cation index ranged from 0.24 for New Zealand (most diversifi ed) to 0.75 for Singapore (least diversifi ed).
From an energy security perspective, it may be useful to identify those economies where the fuel mix in energy consumption is less diverse (or more concentrated) than in other economies and where oil dependence is higher. The relationship between the diversifi cation index for total primary energy consumption and the share of oil in total primary energy consump-tion in 2002 for individual APEC economies is provided in fi gure 50.
Singapore is notable given its high oil dependence (the share of oil in total primary energy consumption was 85 per cent in 2002) and associated high level of market concentration (the diversifi cation index for total primary energy consumption was 0.75). There are eight other APEC economies where the oil share in energy consumption exceeds 40 per cent and, partly as a consequence, the level of diversifi cation in energy consumption is reduced — these economies are Mexico, Malaysia, Peru, Hong Kong, Chi-nese Taipei, the Republic of Korea, Japan and Thailand.
An important mechanism for government involvement in achieving higher levels of diversifi cation in energy markets, on both the supply side and
Diversification in energy consumption (TPEC) and oil dependence in APEC economies, 200250Excludes Brunei and PNG
0.0
0.2
0.4
0.6
0.8
0 20 40 60 80 100Oil share in TPEC (%)
Div
ersi
ficat
ion
inde
x fo
r TPE
C (n
o.) Higher oil dependence
Less
div
erse
(or m
ore
conc
entra
ted)
fu
el m
ix in
ene
rgy
cons
umpt
ion

Energy security in APEC 181
demand side, is research and development (R&D) into, and adoption of, technologies. Some key economic aspects of the role of information in energy markets are noted in the next section.
R&D and technology adoption in energy marketsResearch and development activity is an important mechanism to enhance future energy security in the APEC region. ABS (2004a,b) provides the following defi nitions of research and development (R&D) activity and its major categories. R&D activity is defi ned as the systematic investigation or experimentation involving innovation or technical risk, the outcome of which is new knowledge, with or without a specifi c practical application, or new or improved products, processes, materials, devices or services — R&D activity extends to modifi cations to existing products/processes and ceases when work is no longer experimental.
Research and experimental development activity includes basic research, applied research and experimental development:
■ basic research – experimental and theoretical work undertaken primar-ily to acquire new knowledge without a specifi c application in view — basic research may be pure basic research or strategic basic research.
■ pure basic research – carried out without looking for long term ben-efi ts other than the advancement of knowledge.
■ strategic basic research – directed into specifi ed broad areas in the expectation of useful discoveries — strategic basic research provides the broad base of knowledge for the solution of recognised practical problems.
■ applied research – original work undertaken in order to acquire new knowledge with a specifi c application in view — it is undertaken either to determine possible uses for the fi ndings of basic research or to deter-mine new methods or ways of achieving some specifi c and predeter-mined objectives.
■ experimental development – systematic work, using existing knowl-edge gained from research or practical experience, for the purpose of creating new or improved products/processes.
In Australia, for example, government and industry investment expenditure in research and experimental development work varies widely between eco-
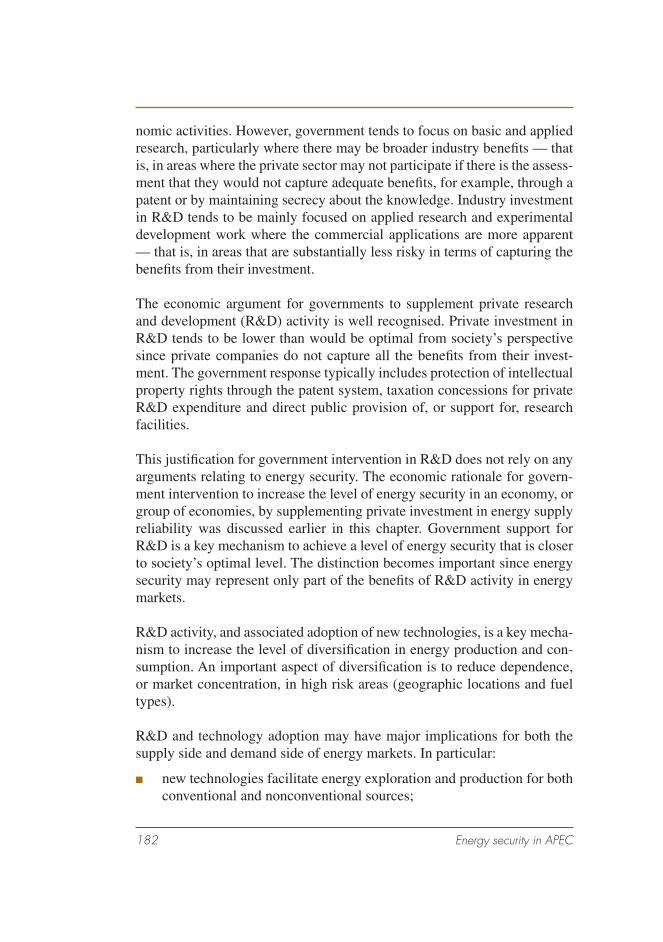
182 Energy security in APEC
nomic activities. However, government tends to focus on basic and applied research, particularly where there may be broader industry benefi ts — that is, in areas where the private sector may not participate if there is the assess-ment that they would not capture adequate benefi ts, for example, through a patent or by maintaining secrecy about the knowledge. Industry investment in R&D tends to be mainly focused on applied research and experimental development work where the commercial applications are more apparent — that is, in areas that are substantially less risky in terms of capturing the benefi ts from their investment.
The economic argument for governments to supplement private research and development (R&D) activity is well recognised. Private investment in R&D tends to be lower than would be optimal from society’s perspective since private companies do not capture all the benefi ts from their invest-ment. The government response typically includes protection of intellectual property rights through the patent system, taxation concessions for private R&D expenditure and direct public provision of, or support for, research facilities.
This justifi cation for government intervention in R&D does not rely on any arguments relating to energy security. The economic rationale for govern-ment intervention to increase the level of energy security in an economy, or group of economies, by supplementing private investment in energy supply reliability was discussed earlier in this chapter. Government support for R&D is a key mechanism to achieve a level of energy security that is closer to society’s optimal level. The distinction becomes important since energy security may represent only part of the benefi ts of R&D activity in energy markets.
R&D activity, and associated adoption of new technologies, is a key mecha-nism to increase the level of diversifi cation in energy production and con-sumption. An important aspect of diversifi cation is to reduce dependence, or market concentration, in high risk areas (geographic locations and fuel types).
R&D and technology adoption may have major implications for both the supply side and demand side of energy markets. In particular:
■ new technologies facilitate energy exploration and production for both conventional and nonconventional sources;

Energy security in APEC 183
■ alternative processing technologies (such as gas to liquids plants) increase the fl exibility of markets to adapt fuel types to different end uses;
■ new technologies may aim to reduce energy consumption in the econ-omy (or increase the effi ciency of energy use); and
■ new technologies may increase the fl exibility of energy markets to adjust to supply disruptions (energy substitution or switching technologies).
It may be noted that any energy saving or conservation measures may be represented in the simple demand-supply framework given in box 3 — energy saving may be represented as a leftward shift in the demand curve, such that a lower quantity of energy is consumed at any given market price. Similarly, any energy substitution or switching measures that increase sub-stitution possibilities in end use activity may be represented in the diagrams in box 3 — increased energy substitution possibilities may be represented by a fl attening of the demand curve, such that consumption of the specifi ed fuel type is reduced, particularly at higher prices that provide the economic incentive to switch to the alternative fuel.
As noted previously, oil is the key area of dependence in energy markets. The share of oil in total primary energy consumption, electricity generation, total fi nal energy consumption and energy consumption in the transport sector is summarised in fi gure 51 for individual APEC economies in 2002
Oil shares in energy consumption and per person GDP in APEC economies, 200251
Per person GDP (US$'000)
Oil
shar
e (%
)
0
25
50
75
100
0 10 20 30 40
TPEC Electricity TFEC Transport

184 Energy security in APEC
(note the defi nition of oil — crude oil, natural gas liquids and feedstocks, and petroleum products — is appropriate to the energy consumption mea-sure).
The high level of dependence on oil in transport use in all APEC economies is an area where there has been limited progress in technology adoption. Introduction of new technologies to increase the diversity of the fuel mix would signifi cantly reduce energy security risks in this area. Some energy market analysts have argued for the introduction of the electrifi cation of the transport sector to allow greater utilisation of relatively abundant resources in each economy while also complementing the current distribution sys-tem — electrifi cation is compatible with the current infrastructure, unlike alternative hydrogen technologies that would require investment in separate distribution facilities to the end user (see the web site for the Institute for the Analysis of Global Security (www.iags.org/es).
New environmental technologies are important for the upstream indus-try as they allow energy exploration and production activity to be under-taken in new areas while managing environmental impacts. In addition, R&D is clearly important for the further development of renewable energy sources.
Other longer term policy measuresThere are a number of other policy measures that may be considered for implementation over the longer term to reduce the risks and costs of tempo-rary energy supply disruptions. It should be noted that there may be reasons in addition to energy security goals that provide an economic justifi cation for considering policy intervention in the following broad areas.
Removal of market impedimentsThe energy policy setting in each economy may have important implica-tions for the economic incentives of the private sector, including invest-ment in energy supply reliability. Policy reform to increase the effi ciency of energy markets to respond to supply disruptions is a signifi cant component of the longer term energy security policy response.
Trade and investment liberalisation in the APEC region was examined in Sch-neider et al. (2000) and energy market reform in the APEC region was exam-ined by Fairhead et al. (2002). In the latter report, some security of supply

Energy security in APEC 185
implications of market deregulation are noted — in Britain, for example, pri-vatisation and deregulation have provided economic incentives to electricity generators to diversify their sources of fuel supply and it has been argued that system security has increased (see Fairhead et al. 2002, p. 36).
The effi ciency of policy arrangements in energy exploration and production varies widely among APEC economies. Policies underpinning the alloca-tion of exploration and production rights, and the collection of resource royalties may signifi cantly impede industry exploration and production activity in some economies.
On a related point, some commentators such as Heyhoe and Levantis (2003) have suggested that, during a major oil supply disruption, the oil industry should be subject to an additional tax so that the community may share in the benefi ts of higher world oil prices (see box 3 for a discussion of some key economic effects of an oil disruption). However, under an effi -cient policy regime, higher oil prices should translate into higher resource royalty payments to governments for community use (see Hogan 2003a). Additional taxation would also reduce the economic incentives for surge production — that is, for the domestic oil industry to increase production during the disruption.
Provision of energy market information and international cooperationGovernment support for the collection, dissemination and analysis of rel-evant energy market information is justifi ed, at least to some extent, on energy security and broader economic effi ciency grounds. Information may be used by both governments and the private sector as an input to commer-cial and policy decisions. The nature of the information varies widely and may include the public provision of basic geoscientifi c data as an input to exploration activity (see Hogan 2003b), information collection as required to meet international obligations (such as through membership of the IEA), and economic analysis of energy markets and policies (including quantita-tive assessments).
Dissemination of reliable information on future developments in energy markets, over different time frames, would assist energy users in making more informed choices when considering alternative energy related invest-ments or consumer durable purchases.

186 Energy security in APEC
The Joint Oil Data Initiative (JODI) is an example of a joint international project that should contribute substantially to the information available for international oil market analysis. Other aspects of international coopera-tion that are important include, for example, ongoing dialogue between the major oil producers and consumers, progress to ensure reasonable levels of sea lane security and joint R&D projects. The APEC Energy Security Initiative is an important example of international cooperation that should signifi cantly enhance energy security in the region.
Prioritising emergency and longer term policiesThe energy security policy response in each APEC economy will include a mix of emergency and longer term measures. It is important that each APEC economy undertake its own energy security policy assessment by applying the available information to their economy’s specifi c circumstances.
To prioritise policy options, each economy needs to make an assessment of the expected net economic benefi ts of each policy option. There are several elements of any energy security policy assessment that require subjective judgment by policy makers within the relevant economy. It is not possible to assign objective probabilities to future possible outcomes — assessing the likelihood of future energy supply disruptions requires subjective judg-ment (in a formal analytical framework, subjective probabilities may be assigned to future events). Governments need to make subjective judgments about the relative importance of equity and other issues relating to social welfare during a major energy supply disruption.
An important issue for individual economies is that energy security policy options need to be prioritised within the framework of the national budget — this includes the total budget available to policy makers as well as the full range of competing priorities in the economy, although this judgment may be based on an objective assessment of the issues. In middle and low income APEC economies, for example, theft of energy and physical protec-tion of the workforce and infrastructure are major energy security issues that have a higher priority than investment in energy stocks.
In table 23, rankings are provided for individual APEC economies based on 2002 data for several key energy security indicators, including energy intensity, energy and oil self suffi ciency, the oil share in energy consump-tion (TPEC) and the diversifi cation index for energy consumption (TPEC).
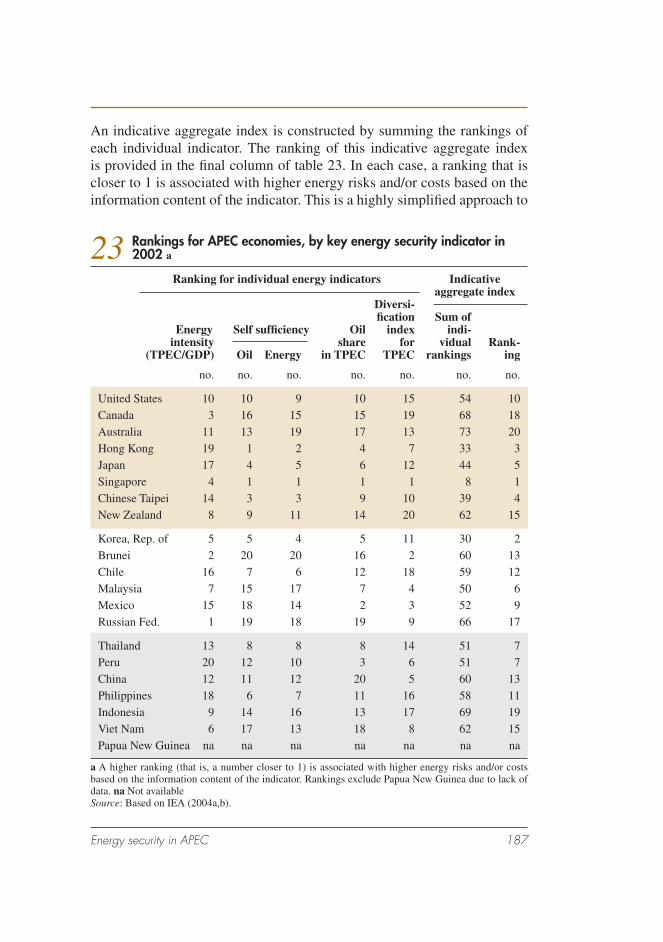
Energy security in APEC 187
An indicative aggregate index is constructed by summing the rankings of each individual indicator. The ranking of this indicative aggregate index is provided in the fi nal column of table 23. In each case, a ranking that is closer to 1 is associated with higher energy risks and/or costs based on the information content of the indicator. This is a highly simplifi ed approach to
23 Rankings for APEC economies, by key energy security indicator in 2002 a
Ranking for individual energy indicators Indicative aggregate index Diversi- fi cation Sum of Energy Self suffi ciency Oil index indi- intensity share for vidual Rank- (TPEC/GDP) Oil Energy in TPEC TPEC rankings ing
no. no. no. no. no. no. no.
United States 10 10 9 10 15 54 10Canada 3 16 15 15 19 68 18Australia 11 13 19 17 13 73 20Hong Kong 19 1 2 4 7 33 3Japan 17 4 5 6 12 44 5Singapore 4 1 1 1 1 8 1Chinese Taipei 14 3 3 9 10 39 4New Zealand 8 9 11 14 20 62 15
Korea, Rep. of 5 5 4 5 11 30 2Brunei 2 20 20 16 2 60 13Chile 16 7 6 12 18 59 12Malaysia 7 15 17 7 4 50 6Mexico 15 18 14 2 3 52 9Russian Fed. 1 19 18 19 9 66 17
Thailand 13 8 8 8 14 51 7Peru 20 12 10 3 6 51 7China 12 11 12 20 5 60 13Philippines 18 6 7 11 16 58 11Indonesia 9 14 16 13 17 69 19Viet Nam 6 17 13 18 8 62 15Papua New Guinea na na na na na na na
a A higher ranking (that is, a number closer to 1) is associated with higher energy risks and/or costs based on the information content of the indicator. Rankings exclude Papua New Guinea due to lack of data. na Not availableSource: Based on IEA (2004a,b).

188 Energy security in APEC
indicating various aspects of the relative energy security position of indi-vidual economies in the APEC region.
The modeling analysis in this study used ABARE’s model of the world economy, GTEM, to quantify the economic impacts of various energy sup-ply disruptions over the outlook period (see chapters 5 and 6). The GTEM analysis captures key aspects of the short run adjustment in markets includ-ing demand restraint, fuel switching and surge production. This informa-tion may be used in energy security policy assessments since the economic benefi ts of short term and longer term policy response measures — such as stockpiling, diversifi cation of energy markets, R&D activity and technol-ogy adoption — includes the reduction in future energy supply disruption costs.
This study is complementary to the studies undertaken in recent years by APERC — see, in particular, the analysis of joint stockpiling options and associated costs (see APERC 2000, 2002a,b; 2003). See also papers asso-ciated with a major project that is currently being undertaken through the Energy Modeling Forum (EMF) in the United States on oil security issues (see www.stanford.edu; earlier work in this area is given in EIA 1990).
Future energy security policy assessments would be enhanced by under-taking further research using GTEM or a similar framework to examine particular policy options in greater detail. For example, inclusion of energy stocks in GTEM would provide useful results on the costs and benefi ts of future stockpiling policy options in the APEC region. The relative economic costs and benefi ts of diversifi cation, technology adoption and other longer term policy options may also be quantifi ed in future research.
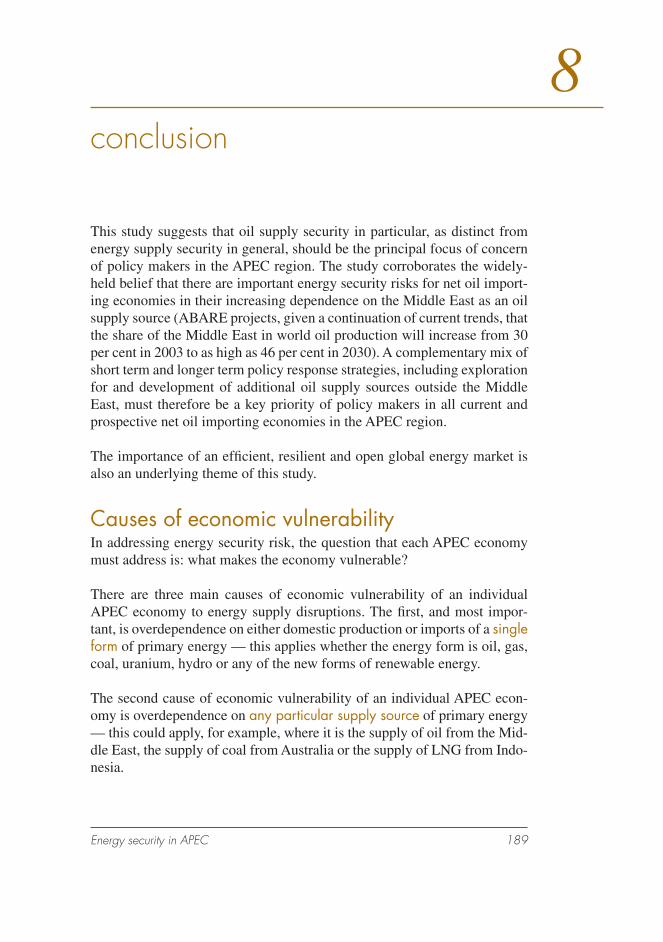
Energy security in APEC 189
conclusion
This study suggests that oil supply security in particular, as distinct from energy supply security in general, should be the principal focus of concern of policy makers in the APEC region. The study corroborates the widely-held belief that there are important energy security risks for net oil import-ing economies in their increasing dependence on the Middle East as an oil supply source (ABARE projects, given a continuation of current trends, that the share of the Middle East in world oil production will increase from 30 per cent in 2003 to as high as 46 per cent in 2030). A complementary mix of short term and longer term policy response strategies, including exploration for and development of additional oil supply sources outside the Middle East, must therefore be a key priority of policy makers in all current and prospective net oil importing economies in the APEC region.
The importance of an effi cient, resilient and open global energy market is also an underlying theme of this study.
Causes of economic vulnerabilityIn addressing energy security risk, the question that each APEC economy must address is: what makes the economy vulnerable?
There are three main causes of economic vulnerability of an individual APEC economy to energy supply disruptions. The fi rst, and most impor-tant, is overdependence on either domestic production or imports of a single form of primary energy — this applies whether the energy form is oil, gas, coal, uranium, hydro or any of the new forms of renewable energy.
The second cause of economic vulnerability of an individual APEC econ-omy is overdependence on any particular supply source of primary energy — this could apply, for example, where it is the supply of oil from the Mid-dle East, the supply of coal from Australia or the supply of LNG from Indo-nesia.
8

190 Energy security in APEC
The third cause of vulnerability is overdependence on a single energy infrastructure facility — this could apply, for example, where the economy depends on a single oil or gas pipeline, a single oil or gas storage facility or a single electricity transmission grid.
Policy responses by APEC economiesIrrespective of the range of energy supply risks that affect all or any APEC economies, it is suggested that continued promotion of an open global energy market should be considered as one of the overarching policy responses. Despite a doubling of global energy demand over the past 25 years, increased competition in global and domestic energy markets in the same period has counterbalanced the supply vulnerabilities of energy importing economies, and most of the world has continued to prosper from available and affordable energy supplies.
As well as promoting the need for a more open global energy market, all APEC economies will be well served by participating in the APEC Energy Security Initiative process which covers both short term and longer term measures to enhance energy security in the region. The broad areas covered by the APEC Energy Security Initiative include: contributing monthly data to the global Joint Oil Data Initiative (JODI); taking measures to enhance sea lane security; participating in the APEC real time emergency informa-tion sharing system; developing an energy emergency response; and devel-oping a range of longer term responses.
Additionally, for an individual APEC economy, what might be the ‘best’ response will depend on the combination of particular energy security risks that it faces. Emergency stockpiling systems have an important balancing role to play, albeit only as a temporary response to shortages. There are four main policy responses that individual APEC economies can consider:
■ adoption of a diversifi ed portfolio of interchangeable energy forms and energy supply sources – this is a principal response that all econo-mies need to consider; it will entail, for example, increased investment in domestic exploration for oil and other energy forms, investment in fuel switching systems and, in many economies, increased utilisation of natural gas.
■ interconnection of energy systems – interconnection reduces vulner-ability to system failure.

Energy security in APEC 191
■ encouragement of timely investment in energy production, transport and storage facilities – these facilities will include pipelines, other transport facilities, power stations and electricity transmission and dis-tribution networks.
■ encouragement of investment in more effi cient energy technologies – these technologies will reduce the energy intensity of economies by, for example, reducing fuel use in transport.
Table 24 sets out a list of energy supply risks and a choice of risk reduction strategies that are open to any economy.
In summary, in addition to the paramount policy of continuing to promote the need for a more open global energy market, the reduction of energy supply vulnerability in APEC economies requires a diversifi ed portfo-lio approach to energy policy and planning. Each APEC economy must decide for itself what are the most appropriate, cost effective and affordable responses for its particular circumstances. It is hoped that this study will assist them in making the optimal choice.
24 Main energy security risks and basic reduction strategies
Security risk Risk reduction strategies
1 Heavy dependence on oil ■ Diversify the energy mix (increase share of natural gas, coal and ‘old’ and ‘new’ renew-ables)
■ Utilise fuel switching systems
2 Heavy dependence on ■ Diversify the energy mix (increase share of natural gas oil, coal, nuclear and ‘old’ and ‘new’
renewables) ■ Utilise new conversion technologies such as
gas to liquids (GTL), if viable ■ Utilise fuel switching systems
3 Heavy dependence on coal ■ Diversify the energy mix (increase share of oil, natural gas, nuclear and ‘old’ and ‘new’ renewables)
■ Utilise liquefaction and gasifi cation technolo-gies, if viable
■ Utilise fuel switching systems
continued…
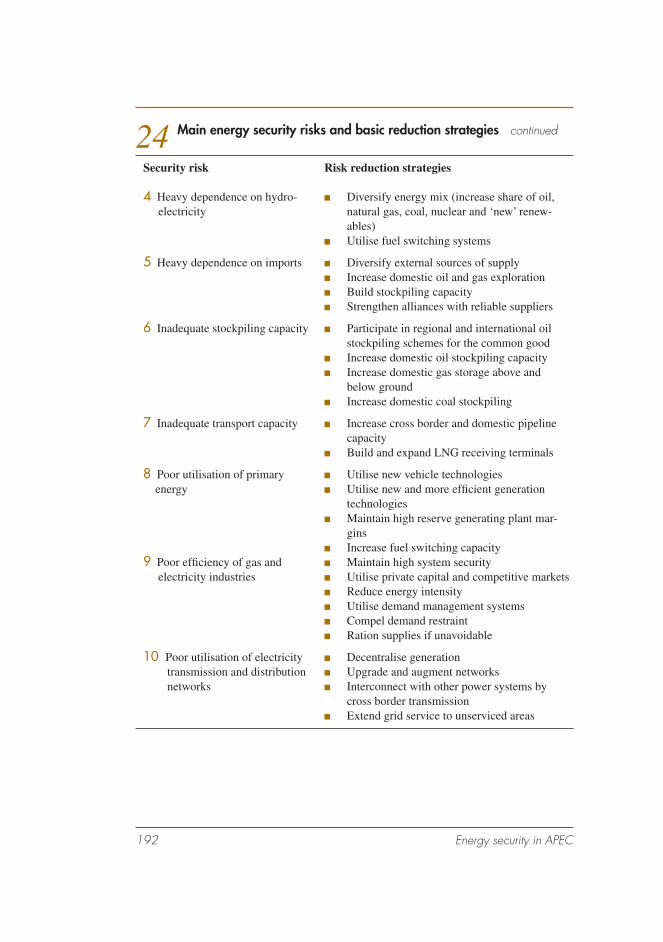
192 Energy security in APEC
24 Main energy security risks and basic reduction strategies continued
Security risk Risk reduction strategies
4 Heavy dependence on hydro- ■ Diversify energy mix (increase share of oil, electricity natural gas, coal, nuclear and ‘new’ renew-
ables) ■ Utilise fuel switching systems
5 Heavy dependence on imports ■ Diversify external sources of supply ■ Increase domestic oil and gas exploration ■ Build stockpiling capacity ■ Strengthen alliances with reliable suppliers
6 Inadequate stockpiling capacity ■ Participate in regional and international oil stockpiling schemes for the common good
■ Increase domestic oil stockpiling capacity ■ Increase domestic gas storage above and
below ground ■ Increase domestic coal stockpiling
7 Inadequate transport capacity ■ Increase cross border and domestic pipeline capacity ■ Build and expand LNG receiving terminals
8 Poor utilisation of primary ■ Utilise new vehicle technologies energy ■ Utilise new and more effi cient generation
technologies ■ Maintain high reserve generating plant mar-
gins ■ Increase fuel switching capacity9 Poor effi ciency of gas and ■ Maintain high system security electricity industries ■ Utilise private capital and competitive markets ■ Reduce energy intensity ■ Utilise demand management systems ■ Compel demand restraint ■ Ration supplies if unavoidable
10 Poor utilisation of electricity ■ Decentralise generation transmission and distribution ■ Upgrade and augment networks networks ■ Interconnect with other power systems by
cross border transmission ■ Extend grid service to unserviced areas

Energy security in APEC 193
appendix
current energy policy settings in selected APEC economiesIn this appendix, information is provided on the energy policies in each of the study’s six focus economies — China, Japan, the Republic of Korea, Mexico, Thailand and the United States. These focus economies are selected to be representative of the economic and geographic diversity of economies within the APEC forum and, based on IMF data, include two high income economies (the United States and Japan), three middle income economies (the Republic of Korea, Mexico and Thailand) and one low income econ-omy (China).
ChinaChina’s 10th Five-Year Plan 2001 establishes China’s energy policy frame-work (People’s Republic of China 2001). China recognises that its rapid economic development can only be sustained if it can maintain access to adequate supplies of reliable energy at a reasonable cost. To achieve this, China promotes demand restraint, encouraging the adoption of petroleum substitutes and effi ciency improvements in energy use. China is also looking to stabilise energy supplies by improving the reliability of energy imports, effectively exploiting domestic energy resources, and opening up energy markets to private investment.
To raise the security of its oil and gas imports, China is diversifying import sources. China, together with the Russian Federation and the Republic of Korea, have been considering the option of a pipeline to export natural gas from Irkutsk in southern Russia to China and Korea. However Russian exports from Irkutsk are not likely to commence before 2010 (FACTS Inc. 2003b). Meanwhile China is building LNG receiving terminals in Fujian and Guangdong, with the prospect of LNG imports from Australia and Indonesia beginning around 2007.
China is also looking to enhance its infl uence over energy resources out-side of China by investing in foreign fi elds. For instance, China National Offshore Oil Corporation (CNOOC) became Indonesia’s largest offshore oil producer in January 2002. Also in 2002, CNOOC secured a 12.5 per
A

194 Energy security in APEC
cent stake in Indonesia’s Tangguh fi eld, which is to supply LNG to China’s Fugian province for 25 years, commencing around the end of this decade. Similarly CNOOC has become a minor partner in Australia’s North West Shelf, which will supply Guangdong province with LNG from 2007.
To guarantee reliable energy supplies, China is aiming to exploit indig-enous primary energy resources as much as is economically feasible (Peo-ple’s Republic of China 2001). For this reason, China intends to continue to rely on Chinese coal as its most important source of energy. This will involve opening new large scale coal mines in the coal rich western prov-inces. This coal will be used to generate electricity in mine-mouth power stations, which will then be transmitted to the high energy consuming areas in the east.
To achieve this, an enormous West–East Power Transmission scheme which will transmit both coal fi red and hydro power from the west to the centres of rapid growth in China’s coastal provinces, is under construction. By 2020, this west–east network may be carrying over 100 GW (FACTS Inc. 2003b). This is roughly equivalent to Canada’s entire current generating capacity (IEA 2003).
While continuing to rely heavily on coal and hydro, China is also looking to expand gas production. China aims to intensify exploration and exploita-tion of gas reserves, located mainly in the western provinces of Sichuan, Xinjiang and Shaanxi. At the same time, China is expanding its west–east gas pipeline network to bring Chinese gas to Beijing, Shanghai and the neighboring provinces. By 2007, 12 billion cubic metres are expected to be fl owing along the west–east pipeline to Shanghai (FACTS Inc. 2003b). Pipelines to Beijing and surrounding cities will have a similar capacity.
China is implementing signifi cant energy market reforms in order to attract the private investment that China’s energy sector needs to achieve rapid growth in domestic energy output. As a result of reforms, independent power producers generate over half of total electricity, and while they are currently obliged to sell to state owned utilities, in the future they will com-pete with state owned utilities to supply a single wholesaler (Fairhead et al. 2002). Foreign participation in the oil and gas sectors is less well advanced. Upstream activities in these sectors are dominated by state owned enter-prises, with foreign involvement limited to minority shares in production sharing arrangements. It is likely that foreign investment opportunities will

Energy security in APEC 195
improve as China seeks to expand its exploration and production activi-ties.
JapanIn the 1980s, Japanese policy makers were particularly concerned to allevi-ate Japan’s vulnerability to oil price shocks and other energy supply disrup-tions. This motivated Japan’s shift out of oil fi red power, the rapid rise in effi ciency of energy use, the growth of nuclear, and the policy of diversify-ing both fuel types and fuel suppliers.
Oil stockpiles are fundamental for Japan’s capacity to respond to an emer-gency energy supply disruption. As of 1 July 2002, oil stockpiles were equivalent to 119 days worth of imports, which is larger than the IEA requirement of 90 days import equivalent (JNOC 2003). The private sector is required to maintain 70 days worth of stocks, and the government main-tains the rest through the Japan National Oil Corporation.
Japan is now also expanding its Liquid Petroleum Gas stockpiles, targeting public stockpiles equivalent to 30 days of imports by 2010, in addition to the 50 days worth that the private sector is already obliged to hold under the Petroleum Stockpiling Law (JNOC 2003).
Japan pursues a policy of cooperation with major oil and gas producing countries, in order to improve the security of energy import supplies. Apart from investment and joint ventures in oil and gas exploration and production activities, Japan supports development in oil and gas producing countries outside of the energy sector, in accordance with the needs and priorities of the recipient countries (ANRE 2002b). Japan’s objective is to strengthen its ties with major oil and gas exporting countries to improve Japan’s access to oil and gas supplies.
In the 1990s, economic stagnation turned the focus of energy policy in Japan to the effi ciency of energy supply industries. Japan began along a path of substantial market reform that continues today. Oil refi ning industries were deregulated in the mid-1990s, resulting in consolidation of the refi ning industry, which continues today. Liberalisation of the electricity and gas sectors has proceeded at a slower pace, but signifi cant progress has been made. Privately owned utilities that once operated as regional monopolists, now compete with each other and with independent power producers (IPPs)

196 Energy security in APEC
to supply large users. Furthermore, in the electricity sector by 2009, all new thermal power stations will be subject to competitive bidding.
Public resistance to new nuclear plants has led to the government scaling down its nuclear power target. Only four new nuclear reactors are expected by 2010, and these are already under construction. An additional six nuclear plants are planned by 2030 (Facts Inc 2004).
Republic of KoreaThe framework for Korea’s energy policies is provided by Korea’s 2nd National Energy Plan 2002–2011 (MOCIE 2002). In the light of Korea’s heavy dependence on energy imports, this plan places considerable empha-sis on energy security initiatives, and takes a broad view of the measures that can contribute to stabilising Korea’s energy supply.
Under Korea’s National Energy Plan, it is the government’s role to guaran-tee a stable energy system, and to maintain Korea’s capacity to respond to energy crises. Various measures have been implemented to secure Korea’s energy supplies.
Strategic stocks of oil and gas are key energy security initiatives. Through the state owned Korea National Oil Corporation (KNOC), Korea maintains a stockpile of petroleum to cushion its economy against supply disruptions. Strategic stocks are equivalent to 90 days of petroleum imports (EIA 2003). In 2001, stocks were expanded from the equivalent of 60 days imports to enable Korea to join the IEA.
Gas storage is regarded as important to stabilise gas demand and shipments of LNG, particularly in the event of a short term supply disruption. Korea is therefore expanding its gas storage capacity from 27 tanks in 2002 to 78 tanks by 2015 (EIA 2003).
In the interests of Korea’s long term energy security, KNOC is invest-ing in exploration and production projects around the world, as well as in domestic offshore blocks. KNOC aims to supply 10 per cent of Korea’s oil requirements by 2010 (EIA 2003). KNOC is presently involved in 18 gas and oil projects across 13 countries. However in the future, KNOC will select and focus activities in target regions such as in the Caspian Sea and

Energy security in APEC 197
Central Asia, while also expanding domestic continental shelf exploration and drilling (MOCIE 2002).
Korea places a high emphasis on international cooperation in order to enhance its energy security (MOCIE 2002). In recent developments, Korea became a member of the IEA in 2001, and an observer to the Energy Char-ter Treaty of Europe in 2002. The Energy Charter Treaty provides a frame-work of rules for energy cooperation including trade and investment. Korea is also seeking to enhance its relationships with OPEC and other oil export-ing economies.
To diversify and improve energy import supplies, Korea is considering the possibility of pipeline gas from Irkutsk in the Russian Federation. However, this pipeline is not likely to come on line until after 2010 (FACTS Inc. 2003b). In the meantime, Korea is seeking to improve the conditions of its LNG import contracts by alleviating the take or pay principle and by devel-oping a mix of both short and long term contracts (MOCIE 2002).
Korea is proactively promoting cooperation in the energy sector with North Korea and other north east Asian neighbors so as to foster closer ties, thereby improving stability and economic prosperity for the region (MOCIE 2002). For example, Korea and North Korea are jointly evaluating a natural gas pipeline route from China through North Korea to Korea (EIA 2003).
Apart from policies related to energy security, Korean energy policy devel-opments are focused on reforming energy markets. Korea is a net exporter of refi ned petroleum products. Deregulation of the petroleum refi nery industry in 1998 opened up the industry to foreign investment and substantial con-solidation, improving the competitiveness of the industry.
Substantial market reforms have also been implemented in the electricity supply sector. The government intends to separate and partially privatise KEPCO’s generation, transmission and distribution arms, and ultimately establish a capacity credit market system to coordinate power supply and demand (MOCIE 2002). Some initial steps were taken in 2001 when the generation capacity of Korea Electric Power Company was split into six subsidiaries. Five of these subsidiaries are to be privatised. The sixth is KEPCO’s nuclear generating capacity and will remain government owned.

198 Energy security in APEC
Much less progress has been made toward reforming the gas sector. Legis-lation has yet to be passed to allow the monopoly LNG importer, Kogas to be privatised. In recent developments, corporations can now apply to import LNG directly, including for distribution to third parties, ending Kogas’ monopoly power over the import of LNG (Energy Economist 2004).
MexicoWhile Mexico is a major net oil and gas exporter, inadequate investment in Mexico’s energy sector is creating energy shortages. Mexico’s 2001–06 National Energy Plan aims to remove the constraints on investment in energy. However, efforts to reform constitutional impediments to private investment and to otherwise attract investment to the energy sector have been slow because of resistance from congress.
State owned monopolists dominate Mexico’s energy sectors. These enter-prises tend to be inadequately resourced. Efforts to open up the sectors to competition and private investment have been seriously hampered by Mexico’s Constitution, which prohibits any private ownership of Mexico’s energy reserves or of Mexico’s power sector (EIA 2004c).
Petroleos Mexicanos (Pemex), the state owned oil and gas company, has exclusive rights to oil and gas exploration and production in Mexico (EIA 2004c). The company’s fi nancial capacity to invest in exploration and pro-duction has been severely curtailed by its fi nancial responsibility to the Mexican Government. As a result, there has been insuffi cient investment in the upstream oil and gas sectors, contributing to the sharp and recent declines in proven reserves of both oil and gas.
It is the current administration’s policy to increase gas and oil output (EIA 2004c). However, this requires the participation of private investors. In 2002, the government extended the coverage of ‘multiple service contracts’ in an effort to open up the oil and gas sectors to private investment within the confi nes of the Constitution. Under multiple service contracts, private companies undertake oil or gas industry activities on behalf of Pemex, but have no rights to any of the oil or gas. Instead companies are paid fees for services. Nine multiple service contracts have been awarded to date to develop Mexico’s gas resources. These developments will not be suf-fi cient to supply Mexico’s domestic gas and oil requirements, with Mexico already planning to import LNG. Pemex anticipates that Mexico will also

Energy security in APEC 199
commence importing oil in the next decade unless substantial investment is undertaken in exploration.
In the electricity sector, the Federal Electricity Commission (CFE) has a monopoly over all stages, with the exception of generation which was opened up to independent power producers (IPPs) in 1992. In addition, IPPs close to the border have the option of exporting power to the United States, providing a check on the monopoly power retained by CFE over the downstream sector. As of May 2004, IPPs accounted for 14.3 per cent of generation capacity, CFE for 74 per cent and the rest is generated by other state enterprises, self suppliers or cogeneration (EIA 2004c).
As in the oil and gas sectors, there is a need for private investment to help expand Mexico’s electricity supply capacity. There have been serious power outages in recent years because of inadequate capacity in the transmission system and because of a heavy reliance on hydro power during consecu-tive years of drought. Without private investment, power shortages can be expected to increase as demand continues to expand rapidly to keep pace with expected relatively strong economic growth and a rise in Mexico’s electrifi cation rate, which is currently 95 per cent.
Developments that could help to ease power supply constraints are the con-struction of power plants by US fi rms to serve markets in both the United States and Mexico.
ThailandThailand’s energy strategy has the twin aims of enhancing energy secu-rity and improving economic competitiveness. There are four plans in the strategy — a plan to raise energy effi ciency, a plan to increase the role of commercial renewable energy, a plan to enhance energy security directly, and a plan to develop Thailand into a regional energy hub (Energy Policy and Planning Offi ce 2003). There are measures in each of these plans that would contribute to greater energy security.
Measures that raise energy effi ciency will reduce Thailand’s dependence on energy, and potentially reduce the cost of energy intensive activities. To increase effi ciency in the transport sector, Thailand is seeking to achieve greater use of rail instead of personal motor vehicles, more careful planning of transport networks, and is introducing tax measures to encourage con-

200 Energy security in APEC
servation. To achieve an improvement in effi ciency in the industry sector, Thailand is relying on tax measures that reward energy conservation, the introduction of energy effi cient technologies such as cogeneration and the operation of a system of minimum effi ciency standards and labeling.
Diversifying fuel sources is another aspect to Thailand energy policy that will reinforce Thailand’s energy security. Thailand plans to increase the role of commercial renewables in electricity generation from 0.5 per cent to 8 per cent by 2011. Various measures have this objective, including the requirement that 4 per cent of all new generating capacity be renewables, combined with the introduction of incentives to purchase power generated by renewable sources.
To directly enhance the security of Thailand’s power supplies, a fund has been established to help gain the support of local communities for the con-struction of new power plants. Siting of new plants has been a problem in the past because of local resistance.
To strengthen its access to fossil fuel resources, Thailand is increasing domestic exploration for fossil fuels, while also assisting Thai companies to invest in projects outside of Thailand. In addition, Thailand is seeking to cooperate more closely with its neighboring countries in the development of joint energy resources. At a regional level, Thailand is looking to foster greater regional cooperation, including speeding up the trans-ASEAN gas pipeline project.
Thailand envisages itself as a major hub of energy trade for its region. To achieve this, Thailand is introducing tax measures that encourage energy trade, including tax free zones in two coastal regions, and the removal of trade barriers on energy. In terms of infrastructure, Thailand is looking to connect the oil pipeline network in the north with that of the north east, and to connect its energy networks with those of southern China.
On a bolder level, Thailand proposes a ‘Strategic Energy Landbridge’ — a system of pipelines and road transport that will run from its west coast to its east coast, together with a substantial stockpile depot system. This would provide Thailand with greater control over energy resources while reducing the wider region’s dependence on the Malacca Strait. Thailand is trying to foster interest and funding from other major importers such as Japan, the Republic of Korea, China and India.

Energy security in APEC 201
United States
Generally, energy policy initiatives in the United States have been con-centrated on managing the liberalisation of energy sectors, and managing energy transformation and consumption. But energy security is gaining prominence as an important policy objective because the United States is facing growing resource constraints. Compounding energy security con-cerns in the United States, the traditional sources of US energy imports — Canada and Mexico — are also facing constraints, forcing the United States to look elsewhere to satisfy its growing demand for fuels.
Despite decades of reform initiatives, the regulation of energy sectors varies considerably across the United States (Fairhead et al. 2002). In the natu-ral gas sector, the United States has implemented considerable reforms to enhance the degree of competition between utilities. In particular, there is open access to interstate pipelines, and utilities may negotiate directly with large users. Some states have also introduced retail competition. The oil industry is characterised by private ownership and a high degree of vertical integration. The Department of Energy controls the strategic level of petro-leum reserves. Similarly the US coal sector is lightly regulated.
Electricity market regulations vary widely. Some states have implemented a market based system for the generation and supply of power, including competitive wholesale markets such as the Pennsylvania – New Jersey – Maryland market. However, the electricity system in many other states is characterised by vertical integration and disparate ownership of the grid.
In the longer term, the focus of the United States on developing new energy technologies is also designed to enhance energy security by facilitating the use of domestic and internationally abundant coal reserves (EIA 2005).
Short term response measures to an energy supply disruption are also key elements of energy security policy in the United States. The US Strategic Petroleum Reserve is the largest emergency oil stockpile in the world. In October 2004 the reserve contained 670 million barrels. By Presidential decree in November 2001, the reserve is due to be fi lled to its maximum capacity of 700 million barrels by 2005 (EIA 2005). However, this time-frame may be revised given that drawdown of the reserve was initiated in late 2004 in response to the extensive damage done by Hurricane Ivan to the oil supply infrastructure in the Gulf of Mexico.

202 Energy security in APEC
Drawdown of the Strategic Petroleum Reserve is initiated by a Presidential decision that it is required by a severe energy disruption or by international obligations — for example, under the International Energy Agency (EIA 2005). Oil from the stockpile begins to arrive on the market around fi fteen days after the President’s decision and is distributed mainly by competitive sale to the highest bidders.

Energy security in APEC 203
appendix
decomposition of annual growth in total primary energy consumption in twenty APEC economiesDescriptive statistics relating to sources of APEC energy market volatil-ity since 1972, given in table 12 in chapter 4, are based on information presented in this appendix. The detailed decomposition analysis of annual growth in total primary energy consumption (TPEC) in twenty APEC econ-omies is given in tables 25–44 (in order of the ranking of economies used throughout this report; see table 1) .
TPEC in an economy may be defi ned by fuel type or by supply source. By fuel type, TPEC is equal to the sum of the consumption of individual pri-mary fuel types (where some minor adjustments in the IEA energy accounts, noted in table 3, are included in renewables energy consumption). By sup-ply source, TPEC is equal to domestic production plus net imports (defi ned as imports less exports less international marine bunkers) plus stock draw-down. These defi nitions may be expressed as follows:
by fuel type: TPEC = coal consumption + oil consumption+ natural gas consumption + nuclear power consumption + renewables energy consumption
by supply source: TPEC = production + imports – exports – international marine bunkers – change in stocks = production + net imports + stock drawdown
The decomposition analysis is based on the observation that the annual percentage change in TPEC in each APEC economy may be decomposed into the percentage point contributions of individual primary fuel types or supply sources. The percentage point contribution accounts for both the annual percentage change in consumption of an individual fuel type or sup-ply source as well as the share of the component in TPEC.
Footnotes to tables 25–44a Including international marine bunkers. b Maximum observation minus the minimum observation. c Number of years in which a negative observation occurs as a percentage of the total number of years. d Correlation coeffi cient between percentage change in TPEC and the variable indicated.Source: Based on IEA energy database; see IEA (2004a,b).
B

204 Energy security in APEC
25 Decomposition of annual growth in TPEC by fuel type and supply source United States Percentage point contributions
By fuel type Total By supply source primary Stock energy con- Pro- Net draw- Coal Oil Gas Nuclear Other sumption duction imports a down
% pt % pt % pt % pt % pt % % pt % pt % pt
1972 0.6 3.6 0.3 0.3 0.2 5.0 1.8 2.8 0.41973 1.3 2.4 –0.4 0.5 0.1 3.8 –0.5 4.4 –0.11974 0.1 –2.1 –0.9 0.5 0.2 –2.2 –1.6 –0.7 0.11975 –0.3 –0.3 –2.5 1.0 –0.1 –2.2 –1.2 0.8 –1.81976 2.1 3.4 0.7 0.3 0.3 6.8 0.6 3.7 2.51977 0.1 3.4 –0.9 0.9 –0.1 3.4 1.5 4.8 –2.91978 0.8 0.7 0.4 0.4 0.5 2.8 1.2 –1.5 3.11979 0.5 –1.6 0.9 –0.3 0.2 –0.2 3.2 –1.0 –2.41980 0.5 –4.2 0.0 –0.1 0.1 –3.7 1.5 –5.9 0.81981 0.6 –2.9 –0.8 0.3 0.0 –2.8 –0.3 –3.3 0.81982 –0.9 –1.8 –1.9 0.2 0.2 –4.2 –1.0 –2.6 –0.51983 1.0 –0.2 –1.3 0.2 0.4 0.1 –3.6 1.1 2.61984 1.3 1.2 0.8 0.6 0.5 4.3 7.1 1.0 –3.81985 0.9 0.0 –0.6 0.9 –0.2 1.1 –1.1 –1.4 3.51986 –0.7 1.5 –1.3 0.5 0.2 0.1 –0.6 3.1 –2.41987 1.4 0.9 1.2 0.6 0.2 4.3 1.9 1.9 0.51988 0.9 1.3 0.9 1.1 –0.3 3.9 1.5 1.5 1.01989 0.3 0.1 1.0 0.0 0.1 1.5 –0.1 1.3 0.31990 0.0 –1.8 –0.2 0.7 –0.2 –1.7 1.7 –0.6 –2.81991 –0.3 –0.8 1.0 0.5 0.3 0.8 –0.5 –1.1 2.51992 0.3 0.8 0.5 0.1 0.3 2.0 0.2 1.7 0.01993 0.8 0.8 0.7 –0.1 –0.2 2.0 –2.3 3.3 1.01994 0.3 0.8 0.5 0.4 0.1 2.0 3.1 1.6 –2.71995 –0.1 0.0 0.8 0.4 0.2 1.3 0.0 –0.8 2.11996 1.1 1.3 –0.2 0.0 0.3 2.5 1.2 1.7 –0.31997 0.7 1.0 0.2 –0.6 –0.2 1.1 –0.1 2.0 –0.81998 0.1 0.6 –0.4 0.6 –0.1 0.8 0.6 1.7 –1.41999 0.2 0.7 1.2 0.7 0.0 2.8 –0.8 1.2 2.32000 0.9 0.5 1.0 0.3 0.0 2.7 –0.3 1.4 1.52001 –0.3 0.5 –1.4 –0.1 –0.9 –2.1 0.8 2.0 –4.92002 0.3 –0.2 1.0 0.1 0.4 1.6 –1.2 –0.9 3.7
Descriptive statistics: 1972–2002Average 0.5 0.3 0.0 0.3 0.1 1.2 0.4 0.7 0.1Std deviation 0.6 1.8 1.0 0.4 0.3 2.7 1.9 2.3 2.2Range b 3.0 7.8 3.7 1.7 1.4 11.0 10.7 10.7 8.6– maximum 2.1 3.6 1.2 1.1 0.5 6.8 7.1 4.8 3.7– minimum –0.9 –4.2 –2.5 –0.6 –0.9 –4.2 –3.6 –5.9 –4.9% years < 0 c 23 35 45 16 35 26 52 35 42Correlation d 0.7 0.8 0.6 0.2 0.2 1.0 0.3 0.7 0.2

Energy security in APEC 205
26 Decomposition of annual growth in TPEC by fuel type and supply source Canada Percentage point contributions
By fuel type Total By supply source primary Stock energy con- Pro- Net draw- Coal Oil Gas Nuclear Other sumption duction imports a down
% pt % pt % pt % pt % pt % % pt % pt % pt
1972 0.4 3.4 2.7 0.5 0.8 7.9 14.8 –7.4 0.61973 –0.8 1.8 1.5 1.4 0.6 4.5 14.0 –8.5 –1.01974 –0.3 1.1 –0.2 0.0 0.9 1.5 –4.0 5.1 0.41975 0.7 2.6 0.7 –0.4 –1.1 2.7 –2.7 6.4 –1.01976 0.4 1.1 0.2 0.8 0.5 3.1 –3.2 3.6 2.71977 0.5 0.3 1.0 1.3 0.0 3.1 4.5 1.6 –3.11978 0.2 0.4 0.3 0.9 0.9 2.7 0.7 –1.7 3.71979 1.0 1.6 1.6 0.7 0.0 4.9 10.5 –2.2 –3.31980 0.7 –1.6 1.0 0.3 0.7 1.2 –1.4 1.6 1.01981 0.3 –2.3 –1.2 0.4 0.2 –2.5 –3.5 0.3 0.61982 0.6 –4.2 0.4 –0.1 –0.3 –3.6 1.1 –5.3 0.61983 0.7 –3.2 –0.3 1.4 0.6 –0.8 2.5 –4.6 1.31984 1.4 0.7 1.7 0.5 0.8 5.2 12.0 –3.3 –3.51985 –0.5 –1.0 1.7 1.0 1.0 2.2 6.6 –7.4 3.01986 –1.0 1.4 –1.0 1.5 0.8 1.7 –0.8 4.4 –1.81987 0.9 1.4 0.4 0.8 –0.1 3.4 6.6 –2.9 –0.41988 0.9 0.1 2.4 0.5 0.3 4.2 9.9 –6.3 0.71989 0.1 2.0 1.2 –0.3 –0.1 2.9 0.6 1.5 0.81990 –1.5 –1.4 –0.7 –0.9 0.4 –4.1 –0.1 –1.2 –2.81991 0.5 –2.2 0.3 1.5 –0.3 –0.1 5.5 –8.0 2.41992 0.5 1.1 1.4 –0.6 0.1 2.5 4.3 –3.6 1.81993 –1.0 0.9 1.7 1.6 0.2 3.3 10.1 –4.6 –2.31994 0.3 0.0 1.4 1.6 0.2 3.5 10.2 –5.9 –0.81995 0.2 0.7 1.0 –1.2 0.6 1.4 4.7 –5.7 2.31996 0.2 0.6 1.5 –0.6 0.7 2.4 4.1 –0.3 –1.41997 0.7 1.4 0.2 –1.1 –0.1 1.1 2.7 –0.5 –1.11998 0.5 1.2 –1.2 –1.2 –0.2 –0.9 1.5 –3.0 0.61999 0.0 0.6 1.2 0.2 0.9 2.9 –0.6 1.0 2.52000 0.9 0.4 1.3 –0.1 0.2 2.7 3.2 –1.8 1.32001 –0.1 0.3 –0.9 0.4 –0.7 –1.1 1.8 –0.3 –2.52002 –0.5 –1.0 1.4 –0.1 1.1 0.8 2.5 –3.1 1.3
Descriptive statistics: 1972–2002Average 0.2 0.3 0.7 0.4 0.3 1.9 3.8 –2.0 0.1Std deviation 0.7 1.7 1.0 0.9 0.5 2.6 5.2 4.0 2.0Range b 2.9 7.6 3.9 2.8 2.1 12.0 18.7 14.8 7.1– maximum 1.4 3.4 2.7 1.6 1.1 7.9 14.8 6.4 3.7– minimum –1.5 –4.2 –1.2 –1.2 –1.1 –4.1 –4.0 –8.5 –3.5% years < 0 c 26 29 23 39 26 23 26 71 42Correlation d 0.3 0.7 0.8 0.3 0.3 1.0 0.6 –0.1 –0.1

206 Energy security in APEC
27 Decomposition of annual growth in TPEC by fuel type and supply source Australia Percentage point contributions
By fuel type Total By supply source primary Stock energy con- Pro- Net draw- Coal Oil Gas Nuclear Other sumption duction imports a down
% pt % pt % pt % pt % pt % % pt % pt % pt
1972 1.8 –0.4 1.5 0.0 0.1 3.0 16.4 –5.2 –8.31973 1.0 4.9 1.5 0.0 –0.2 7.2 10.3 –8.1 5.01974 –0.7 2.6 0.9 0.0 0.5 3.3 –0.8 2.6 1.51975 2.8 –1.1 0.5 0.0 0.2 2.5 12.5 –7.6 –2.41976 –0.1 1.9 0.5 0.0 0.1 2.4 0.5 3.6 –1.71977 3.3 2.3 1.9 0.0 –0.3 7.1 11.2 –4.5 0.51978 –3.0 2.6 0.7 0.0 0.0 0.4 0.7 –3.5 3.21979 1.3 –0.3 1.2 0.0 0.0 2.2 3.9 0.8 –2.51980 3.8 –1.9 0.8 0.0 –0.2 2.4 1.1 –4.0 5.31981 0.4 –2.0 1.8 0.0 0.5 0.6 12.9 –4.6 –7.61982 1.4 1.6 1.3 0.0 0.2 4.4 5.9 0.5 –1.91983 –0.7 –3.7 0.6 0.0 –0.2 –4.1 6.1 –9.1 –1.01984 1.8 0.8 0.7 0.0 –0.1 3.1 11.7 –16.2 7.51985 1.2 –1.5 1.0 0.0 0.3 1.1 18.0 –20.7 3.71986 –0.8 1.3 1.4 0.0 –0.4 1.5 13.4 –6.2 –5.71987 3.0 1.2 0.5 0.0 0.0 4.7 13.4 –1.8 –7.01988 0.1 0.9 0.6 0.0 0.2 1.8 –9.0 –6.2 16.91989 3.8 2.2 0.5 0.0 0.2 6.7 8.7 7.7 –9.71990 0.0 1.1 1.5 0.0 0.1 2.7 14.7 –7.5 –4.61991 1.6 –1.6 –1.1 0.0 0.1 –0.9 6.3 –11.5 4.31992 0.6 0.9 0.6 0.0 –0.5 1.5 8.3 –7.1 0.31993 0.8 3.0 0.7 0.0 0.9 5.3 4.0 –1.2 2.51994 –0.5 0.1 0.7 0.0 –0.1 0.2 –0.5 0.1 0.61995 0.4 –0.3 1.2 0.0 0.2 1.6 14.5 –7.7 –5.21996 3.4 2.9 0.1 0.0 0.6 7.0 3.1 0.2 3.71997 2.4 –1.6 0.1 0.0 0.3 1.3 10.0 –5.9 –2.81998 1.6 –0.4 0.7 0.0 –0.2 1.6 13.2 –13.0 1.41999 2.2 0.5 0.7 0.0 0.1 3.5 –1.0 0.4 4.02000 0.4 0.8 0.9 0.0 0.1 2.1 18.5 –11.9 –4.52001 0.7 –3.0 0.9 0.0 0.0 –1.3 15.3 –12.4 –4.22002 0.6 1.4 0.3 0.0 1.7 4.0 5.7 –4.0 2.4
Descriptive statistics: 1972–2002Average 1.1 0.5 0.8 0.0 0.1 2.5 8.0 –5.3 –0.2Std deviation 1.5 1.9 0.6 0.0 0.4 2.5 6.7 6.1 5.5Range b 6.8 8.6 2.9 0.0 2.3 11.3 27.5 28.4 26.7– maximum 3.8 4.9 1.9 0.0 1.7 7.2 18.5 7.7 16.9– minimum –3.0 –3.7 –1.1 0.0 –0.5 –4.1 –9.0 –20.7 –9.7% years < 0 c 23 39 3 0 35 10 13 74 48Correlation d 0.5 0.8 0.2 – 0.2 1.0 0.0 0.4 0.0
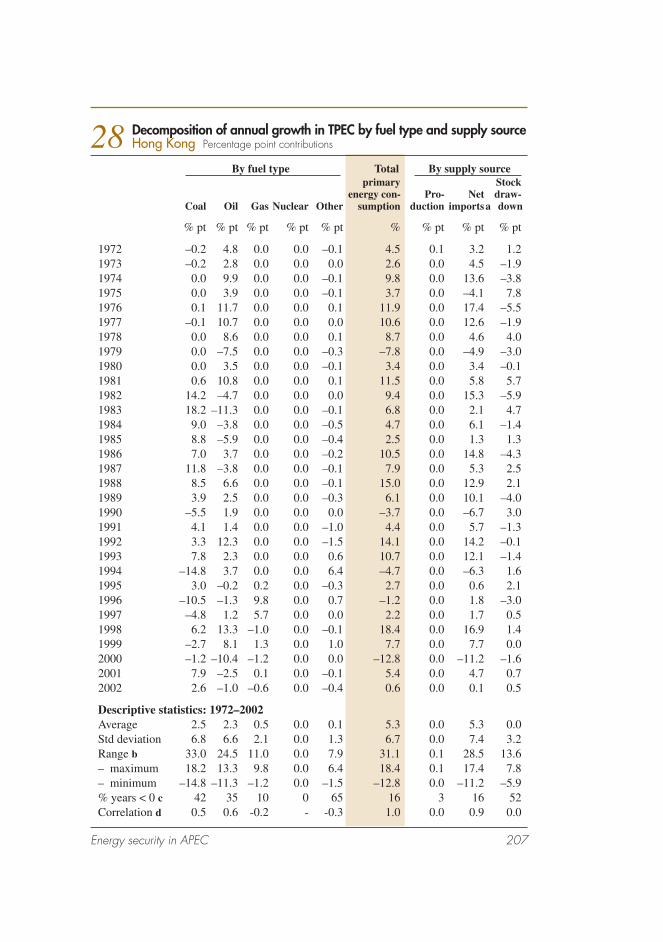
Energy security in APEC 207
28 Decomposition of annual growth in TPEC by fuel type and supply source Hong Kong Percentage point contributions
By fuel type Total By supply source primary Stock energy con- Pro- Net draw- Coal Oil Gas Nuclear Other sumption duction imports a down
% pt % pt % pt % pt % pt % % pt % pt % pt
1972 –0.2 4.8 0.0 0.0 –0.1 4.5 0.1 3.2 1.21973 –0.2 2.8 0.0 0.0 0.0 2.6 0.0 4.5 –1.91974 0.0 9.9 0.0 0.0 –0.1 9.8 0.0 13.6 –3.81975 0.0 3.9 0.0 0.0 –0.1 3.7 0.0 –4.1 7.81976 0.1 11.7 0.0 0.0 0.1 11.9 0.0 17.4 –5.51977 –0.1 10.7 0.0 0.0 0.0 10.6 0.0 12.6 –1.91978 0.0 8.6 0.0 0.0 0.1 8.7 0.0 4.6 4.01979 0.0 –7.5 0.0 0.0 –0.3 –7.8 0.0 –4.9 –3.01980 0.0 3.5 0.0 0.0 –0.1 3.4 0.0 3.4 –0.11981 0.6 10.8 0.0 0.0 0.1 11.5 0.0 5.8 5.71982 14.2 –4.7 0.0 0.0 0.0 9.4 0.0 15.3 –5.91983 18.2 –11.3 0.0 0.0 –0.1 6.8 0.0 2.1 4.71984 9.0 –3.8 0.0 0.0 –0.5 4.7 0.0 6.1 –1.41985 8.8 –5.9 0.0 0.0 –0.4 2.5 0.0 1.3 1.31986 7.0 3.7 0.0 0.0 –0.2 10.5 0.0 14.8 –4.31987 11.8 –3.8 0.0 0.0 –0.1 7.9 0.0 5.3 2.51988 8.5 6.6 0.0 0.0 –0.1 15.0 0.0 12.9 2.11989 3.9 2.5 0.0 0.0 –0.3 6.1 0.0 10.1 –4.01990 –5.5 1.9 0.0 0.0 0.0 –3.7 0.0 –6.7 3.01991 4.1 1.4 0.0 0.0 –1.0 4.4 0.0 5.7 –1.31992 3.3 12.3 0.0 0.0 –1.5 14.1 0.0 14.2 –0.11993 7.8 2.3 0.0 0.0 0.6 10.7 0.0 12.1 –1.41994 –14.8 3.7 0.0 0.0 6.4 –4.7 0.0 –6.3 1.61995 3.0 –0.2 0.2 0.0 –0.3 2.7 0.0 0.6 2.11996 –10.5 –1.3 9.8 0.0 0.7 –1.2 0.0 1.8 –3.01997 –4.8 1.2 5.7 0.0 0.0 2.2 0.0 1.7 0.51998 6.2 13.3 –1.0 0.0 –0.1 18.4 0.0 16.9 1.41999 –2.7 8.1 1.3 0.0 1.0 7.7 0.0 7.7 0.02000 –1.2 –10.4 –1.2 0.0 0.0 –12.8 0.0 –11.2 –1.62001 7.9 –2.5 0.1 0.0 –0.1 5.4 0.0 4.7 0.72002 2.6 –1.0 –0.6 0.0 –0.4 0.6 0.0 0.1 0.5
Descriptive statistics: 1972–2002Average 2.5 2.3 0.5 0.0 0.1 5.3 0.0 5.3 0.0Std deviation 6.8 6.6 2.1 0.0 1.3 6.7 0.0 7.4 3.2Range b 33.0 24.5 11.0 0.0 7.9 31.1 0.1 28.5 13.6– maximum 18.2 13.3 9.8 0.0 6.4 18.4 0.1 17.4 7.8– minimum –14.8 –11.3 –1.2 0.0 –1.5 –12.8 0.0 –11.2 –5.9% years < 0 c 42 35 10 0 65 16 3 16 52Correlation d 0.5 0.6 -0.2 - -0.3 1.0 0.0 0.9 0.0

208 Energy security in APEC
29 Decomposition of annual growth in TPEC by fuel type and supply source Japan Percentage point contributions
By fuel type Total By supply source primary Stock energy con- Pro- Net draw- Coal Oil Gas Nuclear Other sumption duction imports a down
% pt % pt % pt % pt % pt % % pt % pt % pt
1972 –0.5 7.2 0.0 0.1 0.0 6.9 –1.2 7.4 0.61973 1.1 11.1 0.6 0.0 –0.5 12.3 –1.1 14.7 –1.31974 1.1 –2.4 0.5 0.8 0.4 0.4 0.4 0.4 –0.31975 –1.4 –4.6 0.3 0.4 0.0 –5.2 –0.2 –7.1 2.11976 –0.2 5.1 0.4 0.8 0.0 6.2 1.0 5.7 –0.61977 –1.0 2.5 0.6 –0.2 –0.3 1.7 –0.3 3.1 –1.01978 –2.0 –0.8 1.4 2.2 0.0 0.8 1.3 –1.8 1.31979 1.4 2.2 0.9 0.9 0.4 5.7 1.0 6.0 –1.21980 2.4 –6.5 0.8 0.9 0.2 –2.3 1.1 –3.8 0.41981 1.6 –4.7 0.2 0.4 0.0 –2.6 0.4 –4.9 2.01982 –0.4 –1.8 0.2 1.1 1.1 0.2 2.1 –2.0 0.01983 –0.8 –0.5 0.4 0.9 0.2 0.1 0.9 –0.5 –0.21984 2.3 1.4 2.5 1.5 –0.2 7.6 1.2 7.3 –0.91985 0.9 –3.5 0.7 1.8 0.3 0.2 2.1 –1.7 –0.21986 –1.1 1.6 0.1 0.6 –0.1 1.2 0.5 1.2 –0.51987 –0.5 0.3 0.2 1.4 –0.1 1.3 0.8 0.6 –0.11988 2.0 4.8 0.4 –0.6 0.4 7.0 –0.5 6.5 1.11989 –0.1 2.8 0.8 0.3 0.1 3.9 0.2 4.8 –1.21990 1.1 3.6 0.9 1.2 0.4 7.3 1.4 5.2 0.71991 0.3 –0.5 0.6 0.7 0.2 1.2 0.9 –0.4 0.81992 –0.4 2.2 0.1 0.6 –0.3 2.1 0.2 2.3 –0.41993 0.1 –1.5 0.2 1.5 0.2 0.6 1.6 –1.0 –0.11994 1.2 3.2 0.7 1.1 –0.4 5.7 0.6 5.9 –0.81995 0.5 –0.4 0.2 1.2 0.5 2.0 1.6 –0.3 0.71996 0.2 1.1 0.7 0.6 0.1 2.6 0.6 2.3 –0.31997 0.7 –1.0 0.3 0.9 0.3 1.1 0.9 –0.2 0.41998 –0.9 –1.1 0.4 0.7 0.0 –1.0 0.6 –2.1 0.51999 0.2 0.6 0.6 –0.8 –0.1 0.5 –0.9 1.1 0.32000 0.9 –0.6 0.5 0.3 0.0 1.0 0.3 2.2 –1.52001 1.1 –1.9 0.1 –0.1 –0.1 –0.9 –0.2 –1.4 0.82002 0.6 0.6 0.0 –1.2 0.0 0.0 –1.5 1.9 –0.4
Descriptive statistics: 1972–2002Average 0.3 0.6 0.5 0.6 0.1 2.2 0.5 1.7 0.0Std deviation 1.1 3.6 0.5 0.7 0.3 3.6 0.9 4.4 0.9Range b 4.4 17.6 2.5 3.4 1.5 17.5 3.6 21.8 3.6– maximum 2.4 11.1 2.5 2.2 1.1 12.3 2.1 14.7 2.1– minimum –2.0 –6.5 0.0 –1.2 –0.5 –5.2 –1.5 –7.1 –1.5% years < 0 c 39 48 0 16 35 19 26 42 55Correlation d 0.3 0.9 0.3 0.0 –0.2 1.0 –0.2 1.0 –0.5

Energy security in APEC 209
30 Decomposition of annual growth in TPEC by fuel type and supply source Singapore Percentage point contributions
By fuel type Total By supply source primary Stock energy con- Pro- Net draw- Coal Oil Gas Nuclear Other sumption duction imports a down
% pt % pt % pt % pt % pt % % pt % pt % pt
1972 0.0 24.6 0.0 0.0 –0.1 24.5 0.0 79.5 –55.01973 0.0 10.8 0.0 0.0 –0.1 10.8 0.0 49.1 –38.31974 0.0 7.3 0.0 0.0 0.0 7.3 0.0 –2.4 9.61975 –0.1 –4.9 0.0 0.0 0.1 –4.9 0.0 20.8 –25.71976 0.0 7.3 0.0 0.0 0.0 7.4 0.0 27.4 –20.01977 0.0 8.4 0.0 0.0 0.1 8.5 0.0 –18.0 26.41978 0.0 24.9 0.0 0.0 –0.1 24.8 0.0 –42.2 67.01979 0.0 –0.9 0.0 0.0 –0.1 –1.0 0.0 –21.8 20.81980 0.0 1.3 0.0 0.0 –0.1 1.3 0.0 –41.0 42.31981 0.0 3.5 0.0 0.0 0.0 3.6 0.0 65.7 –62.21982 0.0 –0.6 0.0 0.0 0.0 –0.6 0.0 14.1 –14.71983 0.0 11.5 0.0 0.0 0.0 11.5 0.0 –4.2 15.71984 0.0 11.7 0.0 0.0 0.0 11.7 0.0 –14.4 26.11985 0.1 0.6 0.0 0.0 0.0 0.6 0.0 –14.7 15.31986 0.0 6.6 0.0 0.0 0.1 6.6 0.0 12.6 –5.91987 0.0 6.6 0.0 0.0 0.0 6.6 0.0 68.5 –61.91988 0.0 10.2 0.0 0.0 0.0 10.3 0.0 –0.3 10.51989 0.0 0.5 0.0 0.0 0.0 0.5 0.0 –6.4 6.81990 0.1 35.6 0.0 0.0 0.0 35.7 0.0 21.4 14.31991 –0.1 8.4 0.0 0.0 0.0 8.3 0.0 19.7 –11.41992 0.0 10.2 2.8 0.0 0.0 13.0 0.0 2.9 10.11993 0.0 18.8 4.8 0.0 0.0 23.6 0.0 35.1 –11.41994 0.0 21.5 1.1 0.0 0.0 22.6 0.0 10.2 12.41995 –0.1 –14.0 0.2 0.0 0.0 –13.7 0.0 –13.5 –0.21996 –0.1 6.2 –0.7 0.0 0.3 5.6 0.3 6.0 –0.61997 0.0 13.7 –0.1 0.0 0.0 13.6 0.0 18.8 –5.21998 0.0 –11.3 0.5 0.0 0.0 –10.8 0.0 –15.2 4.41999 0.0 –0.5 –1.2 0.0 0.0 –1.7 0.0 –7.6 5.92000 0.0 –0.8 0.1 0.0 0.0 –0.7 0.0 7.1 –7.82001 0.0 0.6 8.2 0.0 0.0 8.8 0.0 13.9 –5.12002 0.0 1.3 2.8 0.0 0.0 4.1 0.0 –2.9 7.0
Descriptive statistics: 1972–2002Average 0.0 7.1 0.6 0.0 0.0 7.7 0.0 8.6 –1.0Std deviation 0.0 10.5 1.8 0.0 0.1 10.6 0.0 28.9 27.8Range b 0.2 49.6 9.3 0.0 0.4 49.4 0.3 121.8 129.2– maximum 0.1 35.6 8.2 0.0 0.3 35.7 0.3 79.5 67.0– minimum –0.1 –14.0 –1.2 0.0 –0.1 –13.7 0.0 –42.2 –62.2% years < 0 c 29 23 10 0 45 23 0 45 48Correlation d 0.4 1.0 0.2 – –0.3 1.0 0.0 0.3 0.1

210 Energy security in APEC
31 Decomposition of annual growth in TPEC by fuel type and supply source Chinese Taipei Percentage point contributions
By fuel type Total By supply source primary Stock energy con- Pro- Net draw- Coal Oil Gas Nuclear Other sumption duction imports a down
% pt % pt % pt % pt % pt % % pt % pt % pt
1972 0.4 16.5 1.4 0.0 0.6 18.9 1.1 8.9 8.91973 –2.4 13.7 1.3 0.0 –0.2 12.4 –1.7 15.6 –1.51974 –1.1 –5.7 0.5 0.0 0.7 –5.6 –0.3 0.3 –5.61975 0.2 11.4 –0.1 0.0 0.2 11.7 1.1 0.8 9.81976 –0.2 23.1 1.7 0.0 –0.6 24.0 1.7 29.4 –7.11977 0.2 8.7 0.5 0.1 –0.2 9.3 –0.6 10.9 –1.11978 1.8 12.6 –0.1 3.3 0.3 18.0 3.3 11.3 3.41979 2.6 2.8 –0.2 4.0 –0.1 9.0 3.1 4.7 1.21980 2.8 5.3 0.2 1.9 –0.5 9.7 1.2 16.6 –8.21981 –1.1 –7.9 –0.8 2.3 0.6 –7.1 1.6 –7.1 –1.61982 2.1 –2.3 –0.8 2.4 0.0 1.4 1.2 –4.6 4.91983 5.7 1.6 0.2 5.6 0.1 13.1 5.5 5.1 2.51984 3.4 –1.6 0.0 4.9 –0.2 6.5 4.3 2.8 –0.61985 1.3 –0.3 –0.4 3.3 0.7 4.6 3.2 –0.6 2.01986 4.8 4.1 –0.3 –1.4 0.1 7.4 –1.8 8.2 1.01987 2.3 0.8 0.0 4.4 –0.1 7.5 4.1 7.0 –3.61988 3.7 7.3 0.4 –1.6 –0.2 9.4 –2.0 14.7 –3.31989 1.4 6.6 0.0 –1.4 0.1 6.6 –2.0 2.3 6.31990 –0.8 2.0 1.3 2.6 0.3 5.4 2.4 10.9 –7.91991 2.1 4.1 1.6 1.3 –0.5 8.7 0.0 0.2 8.41992 4.0 0.4 0.3 –0.7 0.5 4.5 –0.6 8.3 –3.21993 2.8 3.8 –0.2 0.2 –0.3 6.4 –0.1 6.9 –0.41994 1.5 1.7 1.5 0.2 0.3 5.3 0.6 6.2 –1.51995 0.8 5.1 0.3 0.2 0.0 6.4 0.2 7.8 –1.71996 3.6 0.6 0.1 1.0 0.0 5.3 0.9 3.6 0.81997 3.9 1.5 0.8 –0.6 0.1 5.7 –0.6 5.1 1.21998 2.6 1.5 1.4 0.2 0.1 5.8 0.3 6.0 –0.51999 1.6 2.2 0.0 0.5 –0.2 4.2 0.3 6.1 –2.32000 5.1 –1.5 0.3 0.0 0.0 3.9 –0.1 7.3 –3.32001 2.4 5.0 0.7 –0.9 0.0 7.2 –0.9 2.9 5.22002 2.1 1.1 1.0 1.2 –0.3 5.2 1.0 2.3 1.9
Descriptive statistics: 1972–2002Average 1.9 4.0 0.4 1.1 0.0 7.4 0.9 6.4 0.1Std deviation 1.9 6.4 0.7 1.9 0.3 6.0 1.9 6.8 4.6Range b 8.1 31.1 2.5 7.3 1.3 31.1 7.5 36.6 18.0– maximum 5.7 23.1 1.7 5.6 0.7 24.0 5.5 29.4 9.8– minimum –2.4 –7.9 –0.8 –1.6 –0.6 –7.1 –2.0 –7.1 –8.2% years < 0 c 16 19 29 19 48 6 35 10 55Correlation d 0.0 0.9 0.4 0.0 –0.4 1.0 0.2 0.7 0.2
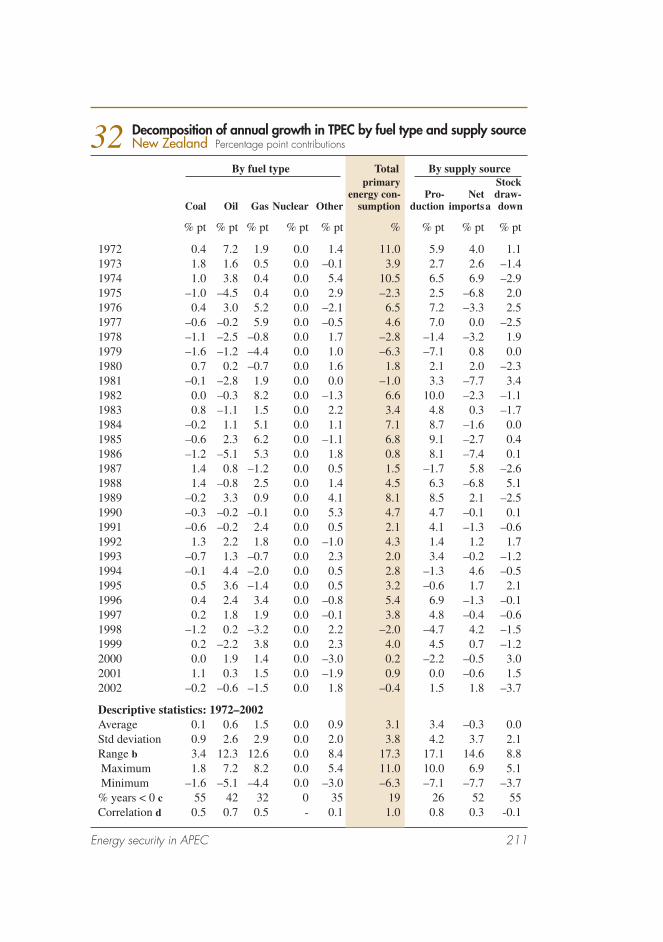
Energy security in APEC 211
32 Decomposition of annual growth in TPEC by fuel type and supply source New Zealand Percentage point contributions
By fuel type Total By supply source primary Stock energy con- Pro- Net draw- Coal Oil Gas Nuclear Other sumption duction imports a down
% pt % pt % pt % pt % pt % % pt % pt % pt
1972 0.4 7.2 1.9 0.0 1.4 11.0 5.9 4.0 1.11973 1.8 1.6 0.5 0.0 –0.1 3.9 2.7 2.6 –1.41974 1.0 3.8 0.4 0.0 5.4 10.5 6.5 6.9 –2.91975 –1.0 –4.5 0.4 0.0 2.9 –2.3 2.5 –6.8 2.01976 0.4 3.0 5.2 0.0 –2.1 6.5 7.2 –3.3 2.51977 –0.6 –0.2 5.9 0.0 –0.5 4.6 7.0 0.0 –2.51978 –1.1 –2.5 –0.8 0.0 1.7 –2.8 –1.4 –3.2 1.91979 –1.6 –1.2 –4.4 0.0 1.0 –6.3 –7.1 0.8 0.01980 0.7 0.2 –0.7 0.0 1.6 1.8 2.1 2.0 –2.31981 –0.1 –2.8 1.9 0.0 0.0 –1.0 3.3 –7.7 3.41982 0.0 –0.3 8.2 0.0 –1.3 6.6 10.0 –2.3 –1.11983 0.8 –1.1 1.5 0.0 2.2 3.4 4.8 0.3 –1.71984 –0.2 1.1 5.1 0.0 1.1 7.1 8.7 –1.6 0.01985 –0.6 2.3 6.2 0.0 –1.1 6.8 9.1 –2.7 0.41986 –1.2 –5.1 5.3 0.0 1.8 0.8 8.1 –7.4 0.11987 1.4 0.8 –1.2 0.0 0.5 1.5 –1.7 5.8 –2.61988 1.4 –0.8 2.5 0.0 1.4 4.5 6.3 –6.8 5.11989 –0.2 3.3 0.9 0.0 4.1 8.1 8.5 2.1 –2.51990 –0.3 –0.2 –0.1 0.0 5.3 4.7 4.7 –0.1 0.11991 –0.6 –0.2 2.4 0.0 0.5 2.1 4.1 –1.3 –0.61992 1.3 2.2 1.8 0.0 –1.0 4.3 1.4 1.2 1.71993 –0.7 1.3 –0.7 0.0 2.3 2.0 3.4 –0.2 –1.21994 –0.1 4.4 –2.0 0.0 0.5 2.8 –1.3 4.6 –0.51995 0.5 3.6 –1.4 0.0 0.5 3.2 –0.6 1.7 2.11996 0.4 2.4 3.4 0.0 –0.8 5.4 6.9 –1.3 –0.11997 0.2 1.8 1.9 0.0 –0.1 3.8 4.8 –0.4 –0.61998 –1.2 0.2 –3.2 0.0 2.2 –2.0 –4.7 4.2 –1.51999 0.2 –2.2 3.8 0.0 2.3 4.0 4.5 0.7 –1.22000 0.0 1.9 1.4 0.0 –3.0 0.2 –2.2 –0.5 3.02001 1.1 0.3 1.5 0.0 –1.9 0.9 0.0 –0.6 1.52002 –0.2 –0.6 –1.5 0.0 1.8 –0.4 1.5 1.8 –3.7
Descriptive statistics: 1972–2002Average 0.1 0.6 1.5 0.0 0.9 3.1 3.4 –0.3 0.0Std deviation 0.9 2.6 2.9 0.0 2.0 3.8 4.2 3.7 2.1Range b 3.4 12.3 12.6 0.0 8.4 17.3 17.1 14.6 8.8 Maximum 1.8 7.2 8.2 0.0 5.4 11.0 10.0 6.9 5.1 Minimum –1.6 –5.1 –4.4 0.0 –3.0 –6.3 –7.1 –7.7 –3.7% years < 0 c 55 42 32 0 35 19 26 52 55Correlation d 0.5 0.7 0.5 - 0.1 1.0 0.8 0.3 -0.1

212 Energy security in APEC
33 Decomposition of annual growth in TPEC by fuel type and supply source Republic of Korea Percentage point contributions
By fuel type Total By supply source primary Stock energy con- Pro- Net draw- Coal Oil Gas Nuclear Other sumption duction imports a down
% pt % pt % pt % pt % pt % % pt % pt % pt
1972 1.5 7.0 0.0 0.0 0.0 8.6 –1.1 7.2 2.41973 8.6 8.5 0.0 0.0 0.0 17.1 3.1 8.5 5.61974 2.3 6.0 0.0 0.0 0.2 8.6 4.1 9.3 –4.71975 0.6 3.9 0.0 0.0 –0.1 4.5 3.3 4.4 –3.21976 3.6 7.5 0.0 0.0 0.0 11.2 –2.5 7.9 5.71977 2.8 13.3 0.0 0.1 –0.1 16.0 1.3 16.6 –1.91978 –0.6 8.2 0.0 1.9 0.1 9.6 1.8 6.8 1.11979 5.4 9.2 0.0 0.6 0.1 15.4 0.9 15.1 –0.71980 3.5 –0.2 0.0 0.2 –0.1 3.4 0.6 1.7 1.11981 4.6 –5.7 0.0 –0.4 0.2 –1.3 1.1 2.4 –4.81982 1.1 4.7 0.0 0.6 –0.1 6.2 0.7 2.0 3.51983 3.1 2.3 0.0 3.1 0.1 8.7 3.0 3.5 2.11984 7.7 0.5 1.6 –0.1 9.6 2.9 2.8 4.01985 4.1 –2.1 0.0 2.5 0.2 4.7 3.7 4.9 –3.91986 2.0 6.7 0.0 5.6 0.1 14.5 7.0 8.3 –0.91987 –0.1 0.3 0.1 4.6 0.2 7.9 4.8 3.2 –0.11988 2.5 9.0 3.0 0.3 –0.2 12.4 0.1 12.6 –0.31989 –0.1 4.3 0.8 2.5 0.1 6.7 0.6 8.2 –2.11990 0.1 13.1 –0.1 1.8 0.2 15.6 0.0 12.1 3.51991 –0.5 7.1 0.4 1.0 0.1 8.1 0.0 11.5 –3.41992 –2.6 13.2 0.5 0.1 0.1 11.7 –1.7 15.7 –2.31993 1.8 8.4 0.9 0.4 0.2 11.7 –0.2 11.8 0.21994 0.7 5.6 1.0 0.1 0.0 7.7 –0.5 10.1 –1.91995 0.8 6.1 1.4 1.6 0.1 9.7 1.3 7.2 1.21996 2.5 4.8 1.1 1.2 0.2 10.4 1.2 9.1 0.21997 1.4 4.7 1.8 0.5 0.2 8.2 0.9 6.9 0.41998 0.6 –10.2 1.5 1.9 0.2 –8.0 2.0 –10.3 0.21999 0.9 5.1 –0.5 2.1 0.1 10.0 2.2 6.4 1.32000 2.6 2.3 1.7 0.9 0.2 6.9 1.1 6.7 –0.92001 1.9 –1.7 1.0 0.4 0.1 1.6 0.4 –0.5 1.62002 1.6 0.9 0.9 0.9 0.2 4.9 1.0 3.9 0.1
Descriptive statistics: 1972–2002Average 2.1 4.6 0.5 1.2 0.1 8.5 1.4 7.0 0.1Std deviation 2.3 5.3 0.5 1.4 0.1 5.2 2.0 5.3 2.7Range b 11.2 23.5 0.8 5.9 0.5 25.1 9.5 26.8 10.6– maximum 8.6 13.3 3.4 5.6 0.2 17.1 7.0 16.6 5.7– minimum –2.6 –10.2 3.0 –0.4 –0.2 –8.0 –2.5 –10.3 –4.8% years < 0 c 16 16 –0.5 3 26 6 19 6 45Correlation d 0.2 0.9 6 0.1 –0.3 1.0 0.0 0.8 0.3

Energy security in APEC 213
34 Decomposition of annual growth in TPEC by fuel type and supply source Brunei Darussalam Percentage point contributions
By fuel type Total By supply source primary Stock energy con- Pro- Net draw- Coal Oil Gas Nuclear Other sumption duction imports a down
% pt % pt % pt % pt % pt % % pt % pt % pt
1972 0.0 –2.2 3.9 0.0 0.0 1.7 1 516.3 –2060.7 544.91973 0.0 5.5 106.6 0.0 0.6 112.7 2 122.1 –1891.7 –117.11974 0.0 3.4 74.3 0.0 0.0 77.7 127.0 26.8 –76.11975 0.0 1.0 25.9 0.0 0.1 27.0 102.0 –121.1 46.21976 0.0 1.2 30.5 0.0 0.0 31.6 395.7 –391.3 27.01977 0.0 –0.3 8.8 0.0 0.0 8.5 107.5 –66.7 –32.41978 0.0 0.6 –7.1 0.0 0.1 –6.4 2.1 –12.9 4.41979 0.0 1.6 2.3 0.0 0.0 3.9 122.2 –96.0 –22.41980 0.0 6.7 82.6 0.0 0.0 89.3 20.7 79.0 –10.51981 0.0 –0.8 –30.4 0.0 0.0 –31.3 –191.2 152.2 7.81982 0.0 1.7 13.6 0.0 0.0 15.4 16.3 8.5 –9.51983 0.0 –2.7 6.4 0.0 0.0 3.7 12.0 –19.5 11.21984 0.0 7.0 –33.0 0.0 0.0 –26.1 –41.4 15.3 0.11985 0.0 –0.1 6.4 0.0 –0.1 6.3 –24.2 27.6 2.91986 0.0 –0.3 –13.7 0.0 0.1 –13.9 –28.0 22.1 –8.11987 0.0 27.1 17.9 0.0 0.0 45.0 –9.6 16.9 37.81988 0.0 25.8 –15.4 0.0 0.0 10.4 –20.7 2.6 28.61989 0.0 –44.3 7.5 0.0 0.0 –36.8 6.4 3.7 –46.91990 0.0 –6.6 20.2 0.0 0.0 13.5 27.2 –12.1 –1.61991 0.0 0.1 15.8 0.0 –0.1 15.8 48.7 –40.4 7.51992 0.0 8.4 0.7 0.0 0.1 9.1 68.3 –48.6 –10.61993 0.0 –1.9 –2.0 0.0 0.0 –3.9 –18.9 6.9 8.11994 0.0 2.8 –10.3 0.0 –0.1 –7.6 24.4 –26.7 –5.21995 0.0 5.8 15.1 0.0 0.0 20.9 35.9 –14.3 –0.71996 0.0 1.2 –0.2 0.0 0.1 1.0 –28.7 22.3 7.31997 0.0 4.0 0.5 0.0 0.0 4.5 –6.1 26.1 –15.51998 0.0 –3.1 2.5 0.0 0.0 –0.6 –27.2 10.7 15.91999 0.0 –2.3 –24.8 0.0 0.0 –27.1 46.8 –67.5 –6.42000 0.0 –6.4 37.2 0.0 –0.1 30.8 105.9 –80.9 5.92001 0.0 19.5 –10.3 0.0 0.1 9.3 25.9 –10.5 –6.12002 0.0 2.0 –2.6 0.0 0.0 –0.6 20.4 –24.8 3.8
Descriptive statistics: 1972–2002Average 0.0 1.8 10.6 0.0 0.0 12.4 147.0 –147.3 12.6Std deviation 0.0 11.6 30.6 0.0 0.1 32.8 462.2 496.1 103.6Range b 0.0 71.4 139.7 0.0 0.6 149.5 2 313.3 2 212.9 662.1– maximum 0.0 27.1 106.6 0.0 0.6 112.7 2 122.1 152.2 544.9– minimum 0.0 –44.3 –33.0 0.0 –0.1 –36.8 –191.2 –2 060.7 –117.1% years < 0 c 0 39 35 0 19 32 32 55 48Correlation d – 0.4 0.9 – 0.5 1.0 0.5 –0.4 –0.2

214 Energy security in APEC
35 Decomposition of annual growth in TPEC by fuel type and supply source Chile Percentage point contributions
By fuel type Total By supply source primary Stock energy con- Pro- Net draw- Coal Oil Gas Nuclear Other sumption duction imports a down
% pt % pt % pt % pt % pt % % pt % pt % pt
1972 –2.3 3.4 –0.1 0.0 0.5 1.5 0.7 2.9 –2.21973 0.9 –3.1 –1.2 0.0 –0.5 –3.9 –3.6 –6.4 6.11974 –0.5 –2.1 0.2 0.0 1.6 –0.8 0.2 8.3 –9.31975 –2.8 –7.6 0.7 0.0 0.2 –9.5 –1.3 –17.5 9.31976 0.3 4.0 0.5 0.0 1.2 5.9 2.6 5.8 –2.51977 0.6 1.6 0.3 0.0 1.2 3.7 1.1 3.0 –0.41978 0.2 2.5 –0.4 0.0 1.6 4.0 0.5 –1.5 5.01979 1.0 2.9 0.9 0.0 0.8 5.6 –3.4 15.8 –6.81980 1.3 0.7 0.1 0.0 1.3 3.4 8.4 –8.1 3.21981 –0.2 1.7 0.0 0.0 0.4 1.9 4.3 –1.8 –0.61982 –4.0 –5.9 0.2 0.0 1.3 –8.4 1.4 –14.2 4.31983 2.1 –2.3 0.5 0.0 2.8 3.1 1.5 3.1 –1.51984 3.2 0.2 0.0 0.0 1.8 5.2 2.8 2.0 0.41985 –0.5 –1.3 0.2 0.0 1.3 –0.3 0.6 –1.0 0.21986 0.5 3.4 –0.7 0.0 1.6 4.9 2.1 8.9 –6.21987 –0.2 1.8 –0.1 0.0 1.9 3.3 0.6 –3.0 5.81988 4.9 4.7 2.3 0.0 0.6 12.5 1.6 13.1 –2.21989 4.7 1.8 3.9 0.0 –1.3 9.1 1.6 7.5 –0.11990 1.7 2.0 0.5 0.0 0.9 5.1 1.5 5.4 –1.81991 –3.7 3.4 –1.3 0.0 5.0 3.5 3.1 2.6 –2.31992 –1.5 5.5 1.3 0.0 4.7 9.9 2.4 4.1 3.41993 0.0 4.1 –0.4 0.0 –0.9 2.8 –2.6 2.9 2.61994 2.2 4.7 0.3 0.0 0.7 7.9 0.7 10.8 –3.61995 1.0 4.7 –0.3 0.0 1.8 7.2 0.1 5.4 1.71996 4.8 3.5 0.0 0.0 0.8 9.2 –0.3 11.4 –1.81997 4.7 1.7 3.5 0.0 –0.2 9.7 –0.1 6.8 3.01998 –2.2 0.3 4.4 0.0 0.0 2.5 –1.1 5.7 –2.11999 2.2 1.9 7.6 0.0 –0.3 11.5 –0.8 7.9 4.42000 –3.9 –5.1 2.3 0.0 2.6 –4.1 2.7 –2.9 –3.92001 –2.9 –2.6 3.0 0.0 0.9 –1.6 1.5 –4.1 0.92002 0.7 2.1 0.2 0.0 0.9 3.8 0.5 4.1 –0.7
Descriptive statistics: 1972–2002Average 0.4 1.1 0.9 0.0 1.1 3.5 0.9 2.5 0.1Std deviation 2.5 3.3 1.9 0.0 1.4 5.3 2.3 7.4 4.1Range b 8.8 13.0 8.8 0.0 6.3 22.0 12.0 33.3 18.6– maximum 4.9 5.5 7.6 0.0 5.0 12.5 8.4 15.8 9.3– minimum –4.0 –7.6 –1.3 0.0 –1.3 –9.5 –3.6 –17.5 –9.3% years < 0 c 39 26 29 0 16 23 26 32 55Correlation d 0.7 0.8 0.3 - 0.0 1.0 0.1 0.8 –0.2

Energy security in APEC 215
36 Decomposition of annual growth in TPEC by fuel type and supply source Malaysia Percentage point contributions
By fuel type Total By supply source primary Stock energy con- Pro- Net draw- Coal Oil Gas Nuclear Other sumption duction imports a down
% pt % pt % pt % pt % pt % % pt % pt % pt
1972 –0.1 0.3 0.5 0.0 1.0 1.7 20.7 –19.0 0.01973 0.1 –0.9 0.0 0.0 0.7 –0.1 –0.9 0.8 0.01974 0.1 10.9 1.8 0.0 0.7 13.4 –5.4 11.2 7.61975 0.0 5.0 0.6 0.0 1.1 6.7 15.0 –6.6 –1.61976 0.1 6.9 0.6 0.0 0.0 7.6 45.2 –44.2 6.61977 0.0 1.2 –0.3 0.0 0.2 1.1 12.1 –0.7 –10.31978 0.1 8.4 19.1 0.0 0.8 28.5 49.3 –17.4 –3.31979 0.1 11.9 4.3 0.0 0.3 16.6 37.1 –23.7 3.11980 0.2 2.1 –2.1 0.0 0.5 0.7 –5.1 10.3 –4.51981 0.4 9.2 –2.6 0.0 0.5 7.4 –9.9 11.2 6.21982 0.0 –2.2 3.4 0.0 0.3 1.4 21.7 –18.3 –2.01983 1.2 8.0 6.4 0.0 0.5 16.1 55.1 –38.4 –0.71984 0.1 –3.0 4.6 0.0 1.4 3.2 40.4 –37.2 –0.11985 0.6 0.1 –0.8 0.0 0.3 0.2 5.3 –7.5 2.41986 –0.6 –0.5 12.4 0.0 0.4 11.7 37.8 –25.0 –1.11987 0.3 0.5 –0.1 0.0 0.9 1.6 4.9 –1.5 –1.71988 –0.6 4.3 0.6 0.0 0.6 5.0 15.7 –12.1 1.31989 3.0 0.5 4.3 0.0 –0.3 7.6 16.9 –8.9 –0.41990 0.3 11.4 –1.7 0.0 0.1 10.2 8.0 2.5 –0.31991 0.4 2.9 13.3 0.0 0.3 16.8 17.8 1.5 –2.51992 0.2 10.1 2.4 0.0 0.2 12.8 5.5 0.1 7.21993 0.1 9.7 0.1 0.0 0.3 10.2 7.5 7.6 –4.81994 –0.1 –1.3 0.4 0.0 0.6 –0.4 5.8 –5.7 –0.61995 0.1 13.2 3.9 0.0 0.0 17.2 19.1 –2.8 0.81996 1.2 –1.9 3.8 0.0 –0.1 3.0 14.4 –12.2 0.71997 –1.1 9.7 7.5 0.0 –0.3 15.7 9.2 7.3 –0.81998 0.1 –5.5 0.5 0.0 0.2 –4.7 2.0 –6.2 –0.61999 –1.2 –4.9 2.0 0.0 0.7 –3.4 –4.1 1.8 –1.02000 2.0 1.7 12.3 0.0 0.0 16.0 7.8 6.6 1.62001 0.6 6.0 –1.0 0.0 –0.2 5.4 1.8 2.3 1.22002 0.8 0.4 0.4 0.0 –0.1 1.5 6.6 –2.9 –2.3
Descriptive statistics: 1972–2002Average 0.3 3.7 3.1 0.0 0.4 7.4 14.8 –7.3 0.0Std deviation 0.8 5.4 5.1 0.0 0.4 7.6 16.8 14.6 3.7Range b 4.2 18.7 21.8 0.0 1.6 33.2 65.0 55.5 18.0– maximum 3.0 13.2 19.1 0.0 1.4 28.5 55.1 11.2 7.6– minimum –1.2 –5.5 –2.6 0.0 –0.3 –4.7 –9.9 –44.2 –10.3% years < 0 c 29 26 23 0 16 13 16 61 58Correlation d 0.1 0.7 0.7 – –0.1 1.0 0.5 –0.1 0.2
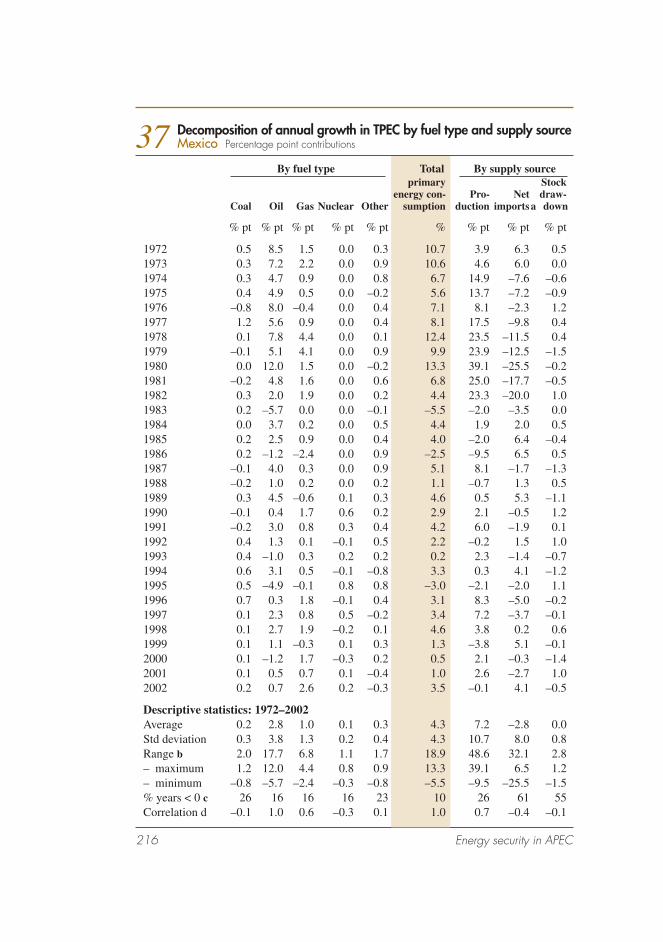
216 Energy security in APEC
37 Decomposition of annual growth in TPEC by fuel type and supply source Mexico Percentage point contributions
By fuel type Total By supply source primary Stock energy con- Pro- Net draw- Coal Oil Gas Nuclear Other sumption duction imports a down
% pt % pt % pt % pt % pt % % pt % pt % pt
1972 0.5 8.5 1.5 0.0 0.3 10.7 3.9 6.3 0.51973 0.3 7.2 2.2 0.0 0.9 10.6 4.6 6.0 0.01974 0.3 4.7 0.9 0.0 0.8 6.7 14.9 –7.6 –0.61975 0.4 4.9 0.5 0.0 –0.2 5.6 13.7 –7.2 –0.91976 –0.8 8.0 –0.4 0.0 0.4 7.1 8.1 –2.3 1.21977 1.2 5.6 0.9 0.0 0.4 8.1 17.5 –9.8 0.41978 0.1 7.8 4.4 0.0 0.1 12.4 23.5 –11.5 0.41979 –0.1 5.1 4.1 0.0 0.9 9.9 23.9 –12.5 –1.51980 0.0 12.0 1.5 0.0 –0.2 13.3 39.1 –25.5 –0.21981 –0.2 4.8 1.6 0.0 0.6 6.8 25.0 –17.7 –0.51982 0.3 2.0 1.9 0.0 0.2 4.4 23.3 –20.0 1.01983 0.2 –5.7 0.0 0.0 –0.1 –5.5 –2.0 –3.5 0.01984 0.0 3.7 0.2 0.0 0.5 4.4 1.9 2.0 0.51985 0.2 2.5 0.9 0.0 0.4 4.0 –2.0 6.4 –0.41986 0.2 –1.2 –2.4 0.0 0.9 –2.5 –9.5 6.5 0.51987 –0.1 4.0 0.3 0.0 0.9 5.1 8.1 –1.7 –1.31988 –0.2 1.0 0.2 0.0 0.2 1.1 –0.7 1.3 0.51989 0.3 4.5 –0.6 0.1 0.3 4.6 0.5 5.3 –1.11990 –0.1 0.4 1.7 0.6 0.2 2.9 2.1 –0.5 1.21991 –0.2 3.0 0.8 0.3 0.4 4.2 6.0 –1.9 0.11992 0.4 1.3 0.1 –0.1 0.5 2.2 –0.2 1.5 1.01993 0.4 –1.0 0.3 0.2 0.2 0.2 2.3 –1.4 –0.71994 0.6 3.1 0.5 –0.1 –0.8 3.3 0.3 4.1 –1.21995 0.5 –4.9 –0.1 0.8 0.8 –3.0 –2.1 –2.0 1.11996 0.7 0.3 1.8 –0.1 0.4 3.1 8.3 –5.0 –0.21997 0.1 2.3 0.8 0.5 –0.2 3.4 7.2 –3.7 –0.11998 0.1 2.7 1.9 –0.2 0.1 4.6 3.8 0.2 0.61999 0.1 1.1 –0.3 0.1 0.3 1.3 –3.8 5.1 –0.12000 0.1 –1.2 1.7 –0.3 0.2 0.5 2.1 –0.3 –1.42001 0.1 0.5 0.7 0.1 –0.4 1.0 2.6 –2.7 1.02002 0.2 0.7 2.6 0.2 –0.3 3.5 –0.1 4.1 –0.5
Descriptive statistics: 1972–2002Average 0.2 2.8 1.0 0.1 0.3 4.3 7.2 –2.8 0.0Std deviation 0.3 3.8 1.3 0.2 0.4 4.3 10.7 8.0 0.8Range b 2.0 17.7 6.8 1.1 1.7 18.9 48.6 32.1 2.8– maximum 1.2 12.0 4.4 0.8 0.9 13.3 39.1 6.5 1.2– minimum –0.8 –5.7 –2.4 –0.3 –0.8 –5.5 –9.5 –25.5 –1.5% years < 0 c 26 16 16 16 23 10 26 61 55Correlation d –0.1 1.0 0.6 –0.3 0.1 1.0 0.7 –0.4 –0.1

Energy security in APEC 217
38 Decomposition of annual growth in TPEC by fuel type and supply source Russian Federation Percentage point contributions
By fuel type Total By supply source primary Stock energy con- Pro- Net draw- Coal Oil Gas Nuclear Other sumption duction imports a down
% pt % pt % pt % pt % pt % % pt % pt % pt
1972 – – – – – – – – –1973 – – – – – – – – –1974 – – – – – – – – –1975 – – – – – – – – –1976 – – – – – – – – –1977 – – – – – – – – –1978 – – – – – – – – –1979 – – – – – – – – –1980 – – – – – – – – –1981 – – – – – – – – –1982 – – – – – – – – –1983 – – – – – – – – –1984 – – – – – – – – –1985 – – – – – – – – –1986 – – – – – – – – –1987 – – – – – – – – –1988 – – – – – – – – –1989 – – – – – – – – –1990 – – – – – – – – –1991 – – – – – – – – –1992 – – – – – – – – –1993 0.2 –2.7 –1.1 0.0 –0.1 –3.7 –9.5 4.7 1.01994 –1.1 –6.7 –3.8 –0.7 –0.4 –12.7 –8.8 –2.8 –1.11995 –1.3 –0.6 –1.7 0.1 0.0 –3.5 –4.0 –0.1 0.61996 0.4 –2.3 0.3 0.4 –0.6 –1.9 –1.1 –3.1 2.31997 –2.0 –0.4 –1.1 0.0 0.0 –3.5 –4.2 –0.9 1.61998 –1.0 –1.0 –0.1 –0.1 –0.1 –2.3 1.1 –1.1 –2.31999 1.4 0.5 0.6 0.7 0.4 3.7 3.8 –0.9 0.82000 0.3 0.5 0.7 0.4 0.0 1.8 2.6 0.5 –1.32001 –0.7 0.5 1.0 0.3 0.1 1.2 4.8 –3.2 –0.42002 0.0 –0.7 0.1 0.2 –0.1 –0.6 6.2 –6.9 0.2
Descriptive statistics: 1993-2002Average –0.4 –1.3 –0.5 0.1 –0.1 –2.1 –0.9 –1.4 0.1Std deviation 1.0 2.2 1.5 0.4 0.3 4.5 5.5 3.0 1.4Range b 3.4 7.2 4.8 1.5 0.9 16.4 15.6 11.7 4.6– maximum 1.4 0.5 1.0 0.7 0.4 3.7 6.2 4.7 2.3– minimum –2.0 –6.7 –3.8 –0.7 –0.6 –12.7 –9.5 –6.9 –2.3% years < 0 c 50 70 50 40 80 70 50 80 40Correlation d 0.6 0.9 0.9 0.9 0.6 1.0 0.8 0.0 0.1

218 Energy security in APEC
39 Decomposition of annual growth in TPEC by fuel type and supply source Thailand Percentage point contributions
By fuel type Total By supply source primary Stock energy con- Pro- Net draw- Coal Oil Gas Nuclear Other sumption duction imports a down
% pt % pt % pt % pt % pt % % pt % pt % pt
1972 –0.2 6.1 0.0 0.0 0.9 6.8 0.5 3.4 2.81973 0.0 7.4 0.0 0.0 1.3 8.7 1.3 9.5 –2.21974 0.3 –2.7 0.0 0.0 3.5 1.0 3.7 –4.1 1.41975 0.0 1.1 0.0 0.0 8.1 9.2 8.1 2.7 –1.61976 0.1 5.6 0.0 0.0 2.6 8.3 2.7 4.2 1.41977 0.1 3.7 0.0 0.0 2.0 5.7 2.1 6.5 –2.91978 0.2 4.9 0.0 0.0 –1.2 3.9 –1.1 2.8 2.21979 1.0 1.3 0.0 0.0 3.6 5.8 4.3 0.2 1.31980 0.2 2.5 0.0 0.0 –2.5 0.2 –2.4 6.5 –4.01981 0.2 –2.9 1.1 0.0 2.7 1.0 4.3 –5.7 2.51982 0.9 –4.8 3.5 0.0 2.1 1.7 7.0 –5.9 0.51983 –0.1 3.8 0.9 0.0 –12.2 –7.6 –9.7 4.5 –2.41984 0.7 2.7 2.9 0.0 3.8 10.2 9.3 0.2 0.71985 3.4 –4.7 4.3 0.0 5.1 8.1 15.4 –5.6 –1.71986 0.2 1.5 –0.4 0.0 3.9 5.3 3.7 0.2 1.41987 1.6 3.0 4.2 0.0 1.7 10.5 7.1 3.7 –0.31988 0.6 7.6 2.4 0.0 1.8 12.5 7.3 3.7 1.51989 1.4 7.8 0.0 0.0 4.6 13.7 5.7 8.8 –0.81990 2.7 9.4 1.1 0.0 1.2 14.3 6.0 7.9 0.41991 1.7 2.0 2.8 0.0 1.7 8.1 7.0 0.4 0.71992 0.6 5.3 0.9 0.0 0.4 7.2 2.5 5.7 –1.11993 0.8 6.1 1.6 0.0 –3.1 5.3 –1.3 7.0 –0.41994 1.3 5.8 1.5 0.0 –0.7 7.9 2.7 3.6 1.61995 1.7 8.5 0.8 0.0 1.0 12.0 2.3 9.4 0.21996 2.6 5.1 2.3 0.0 –0.2 9.9 5.1 7.3 –2.61997 0.1 –0.5 3.2 0.0 0.2 2.9 4.8 –3.2 1.31998 –2.2 –4.6 1.6 0.0 –1.0 –6.3 –0.5 –6.0 0.21999 0.5 2.6 1.8 0.0 0.6 5.6 2.1 2.6 0.82000 0.3 –1.6 3.4 0.0 1.0 3.1 3.9 –0.1 –0.82001 1.5 1.3 3.9 0.0 –1.8 4.9 –1.0 5.6 0.32002 0.5 3.1 1.9 0.0 1.1 6.6 3.2 2.0 1.3
Descriptive statistics: 1972–2002Average 0.7 2.8 1.5 0.0 1.0 6.0 3.4 2.5 0.1Std deviation 1.0 4.0 1.5 0.0 3.4 5.0 4.4 4.7 1.7Range b 5.7 14.2 4.7 0.0 20.3 21.9 25.1 15.6 6.8– maximum 3.4 9.4 4.3 0.0 8.1 14.3 15.4 9.5 2.8– minimum –2.2 –4.8 –0.4 0.0 –12.2 –7.6 –9.7 –6.0 –4.0% years < 0 c 10 23 6 0 26 6 19 23 39Correlation d 0.6 0.6 0.1 – 0.6 1.0 0.6 0.5 0.1

Energy security in APEC 219
40 Decomposition of annual growth in TPEC by fuel type and supply source Peru Percentage point contributions
By fuel type Total By supply source primary Stock energy con- Pro- Net draw- Coal Oil Gas Nuclear Other sumption duction imports a down
% pt % pt % pt % pt % pt % % pt % pt % pt
1972 0.1 –0.5 –0.1 0.0 0.4 0.0 1.8 –2.5 0.71973 0.2 3.5 0.0 0.0 0.7 4.3 3.8 2.2 –1.61974 0.1 5.0 0.1 0.0 0.9 6.1 4.4 0.0 1.71975 0.1 2.8 0.9 0.0 –0.7 3.0 –2.4 5.8 –0.41976 –0.4 1.2 0.4 0.0 0.4 1.7 2.9 –2.7 1.51977 0.2 3.0 –0.3 0.0 0.5 3.4 8.1 –1.5 –3.21978 –0.2 –3.1 0.2 0.0 0.2 –3.0 27.5 –33.0 2.61979 0.1 –0.1 –0.3 0.0 0.2 –0.2 17.6 –16.8 –1.01980 0.1 6.9 0.4 0.0 –0.3 7.1 2.5 2.9 1.61981 0.0 –1.1 0.7 0.0 1.0 0.6 0.9 1.3 –1.61982 0.2 –0.4 0.3 0.0 1.4 1.5 3.2 –2.7 1.01983 –0.2 –6.5 –1.3 0.0 0.1 –7.9 –11.5 4.0 –0.31984 –0.3 0.8 0.9 0.0 0.8 2.2 9.6 –6.3 –1.01985 0.1 –2.1 0.1 0.0 –0.8 –2.8 0.4 –4.1 0.91986 0.5 3.2 0.0 0.0 –1.7 2.1 –6.7 9.3 –0.51987 0.1 4.2 –0.3 0.0 –1.2 2.8 –9.4 10.5 1.71988 0.0 0.3 –0.2 0.0 –2.0 –1.9 –11.8 12.0 –2.11989 0.2 –6.5 –0.5 0.0 –1.1 –7.9 –6.9 –3.2 2.31990 –0.5 –1.5 –0.1 0.0 –0.8 –3.0 –1.9 0.6 –1.71991 1.4 –2.9 –0.2 0.0 –0.1 –1.8 –7.7 6.3 –0.41992 –0.1 0.4 –0.5 0.0 –2.5 –2.7 –2.4 –0.6 0.31993 1.2 6.0 –1.2 0.0 0.9 6.8 5.0 –0.5 2.41994 –0.3 4.4 –0.5 0.0 0.4 4.0 0.4 4.8 –1.11995 0.2 5.3 2.0 0.0 –0.1 7.3 –0.8 13.0 –4.81996 0.2 2.6 0.3 0.0 0.0 3.1 –0.5 –0.5 4.11997 0.1 –2.3 –0.9 0.0 –0.1 –3.1 –1.8 5.2 –6.51998 0.3 3.7 0.5 0.0 0.4 5.0 0.4 2.2 2.51999 –0.3 5.5 1.0 0.0 0.4 6.5 –2.2 –2.8 11.52000 1.8 –3.7 –0.3 0.0 1.2 –1.1 –1.7 8.4 –7.82001 –0.5 –4.2 0.1 0.0 1.2 –3.3 0.4 –5.5 1.72002 1.7 –3.2 0.4 0.0 0.4 –0.7 –1.1 2.3 –2.0
Descriptive statistics: 1972–2002Average 0.2 0.7 0.1 0.0 0.0 0.9 0.6 0.3 0.0Std deviation 0.6 3.7 0.7 0.0 1.0 4.1 7.8 8.6 3.4Range b 2.3 13.3 3.3 0.0 3.9 15.2 39.3 46.0 19.3– maximum 1.8 6.9 2.0 0.0 1.4 7.3 27.5 13.0 11.5– minimum –0.5 –6.5 –1.3 0.0 –2.5 –7.9 –11.8 –33.0 –7.8% years < 0 c 32 45 48 0 39 45 48 45 52Correlation d 0.0 0.9 0.5 – 0.3 1.0 0.2 0.2 0.2

220 Energy security in APEC
41 Decomposition of annual growth in TPEC by fuel type and supply source China Percentage point contributions
By fuel type Total By supply source primary Stock energy con- Pro- Net draw- Coal Oil Gas Nuclear Other sumption duction imports a down
% pt % pt % pt % pt % pt % % pt % pt % pt
1972 2.3 1.5 0.2 0.0 1.1 5.2 5.2 –0.1 0.01973 0.9 1.6 0.2 0.0 1.0 3.7 4.0 –0.3 0.01974 –0.4 1.8 0.3 0.0 0.9 2.6 3.4 –0.9 0.01975 7.8 1.6 0.3 0.0 0.7 10.4 11.7 –1.2 0.01976 0.3 2.4 0.2 0.0 0.6 3.4 3.0 0.4 0.01977 6.9 1.2 0.3 0.0 0.5 8.9 8.9 0.0 0.01978 6.2 1.5 0.2 0.0 0.4 8.3 8.8 –0.5 0.01979 1.3 –0.2 0.1 0.0 0.5 1.7 2.4 –0.8 0.01980 –0.3 –0.5 0.0 0.0 0.5 –0.3 –0.5 –0.5 0.71981 –0.2 –0.8 –0.2 0.0 0.5 –0.7 –0.5 –0.2 0.01982 2.9 –0.1 –0.1 0.0 0.5 3.1 4.3 –0.2 –0.91983 3.2 0.3 0.0 0.0 0.5 4.0 5.1 0.0 –1.11984 5.5 0.3 0.1 0.0 0.2 6.1 7.5 –1.3 –0.21985 2.7 0.8 0.4 0.0 0.3 4.2 5.7 –1.3 –0.21986 2.4 0.8 0.1 0.0 0.3 3.6 2.8 0.5 0.31987 3.9 0.9 0.0 0.0 0.4 5.1 3.1 –0.1 2.11988 4.2 0.9 0.0 0.0 0.4 5.5 4.3 0.1 1.21989 0.8 0.6 0.1 0.0 0.4 2.0 5.2 0.7 –3.91990 7.0 –0.7 0.0 0.0 0.4 6.7 3.6 –0.5 3.61991 –2.3 1.2 0.1 0.0 0.2 –0.8 1.0 0.5 –2.21992 2.1 1.3 0.0 0.0 0.2 3.5 2.2 0.7 0.61993 3.6 1.6 0.1 0.0 0.3 5.6 3.0 2.2 0.41994 4.0 –0.1 0.1 0.4 0.2 4.6 5.5 –1.1 0.21995 5.4 1.2 0.0 –0.1 0.2 6.8 7.5 0.1 –0.81996 2.7 1.4 0.1 0.0 0.1 4.3 3.6 0.0 0.71997 –1.5 1.7 0.0 0.0 0.1 0.3 0.1 1.6 –1.41998 –0.6 –0.3 0.2 0.0 0.2 –0.5 –1.3 –0.2 1.01999 –1.5 1.5 0.2 0.0 0.3 0.5 –1.7 0.8 1.42000 0.1 1.5 0.2 0.0 0.3 2.2 1.5 1.2 –0.52001 –1.6 0.5 0.3 0.0 0.5 –0.2 2.7 –2.4 –0.62002 6.1 1.2 0.2 0.2 0.2 8.0 7.2 1.5 –0.7
Descriptive statistics: 1972–2002Average 2.4 0.9 0.1 0.0 0.4 3.8 3.9 0.0 0.0Std deviation 2.8 0.8 0.1 0.1 0.2 3.0 3.1 1.0 1.3Range b 10.1 3.2 0.6 0.4 1.0 11.2 13.3 4.6 7.6– maximum 7.8 2.4 0.4 0.4 1.1 10.4 11.7 2.2 3.6– minimum –2.3 –0.8 –0.2 –0.1 0.1 –0.8 –1.7 –2.4 –3.9% years < 0 c 26 23 16 6 0 16 13 55 39Correlation d 0.9 0.3 0.3 0.1 0.1 1.0 0.9 0.0 0.2

Energy security in APEC 221
42 Decomposition of annual growth in TPEC by fuel type and supply source Phillipines Percentage point contributions
By fuel type Total By supply source primary Stock energy con- Pro- Net draw- Coal Oil Gas Nuclear Other sumption duction imports a down
% pt % pt % pt % pt % pt % % pt % pt % pt
1972 0.0 –0.8 0.0 0.0 0.4 –0.5 0.0 3.9 –4.51973 0.0 9.4 0.0 0.0 0.1 9.5 0.0 1.1 8.41974 0.1 –1.8 0.0 0.0 2.5 0.8 2.5 1.7 –3.41975 0.1 5.2 0.0 0.0 –0.3 5.0 –0.2 3.6 1.61976 0.1 3.5 0.0 0.0 1.9 5.5 2.0 4.2 –0.71977 0.9 3.0 0.0 0.0 0.4 4.3 0.8 2.0 1.51978 0.3 0.0 0.0 0.0 0.8 1.1 0.7 1.4 –1.01979 0.0 2.4 0.0 0.0 3.0 5.4 9.0 0.9 –4.51980 0.4 –4.0 0.0 0.0 7.0 3.4 4.1 0.2 –0.91981 –0.4 –3.0 0.0 0.0 2.7 –0.7 1.5 –7.6 5.41982 0.4 –0.3 0.0 0.0 3.6 3.8 5.4 –3.6 2.01983 1.4 3.2 0.0 0.0 3.3 7.9 5.2 5.9 –3.21984 1.3 –15.3 0.0 0.0 2.6 –11.4 2.4 0.6 –14.41985 1.4 1.0 0.0 0.0 3.0 5.4 2.3 –13.4 16.61986 –1.2 2.1 0.0 0.0 –1.4 –0.4 –1.1 0.6 0.11987 0.5 6.2 0.0 0.0 –1.0 5.8 –1.9 8.6 –0.81988 0.9 3.7 0.0 0.0 1.1 5.7 1.6 4.9 –0.81989 –0.8 4.9 0.0 0.0 2.6 6.8 2.4 3.1 1.21990 0.7 2.3 0.0 0.0 0.8 3.9 0.5 3.7 –0.41991 0.2 –1.6 0.0 0.0 0.5 –0.9 0.2 –1.6 0.51992 –0.5 6.7 0.0 0.0 –0.5 5.7 1.2 6.7 –2.21993 0.1 4.9 0.0 0.0 –0.6 4.4 –0.3 0.1 4.71994 1.0 4.5 0.0 0.0 2.4 8.0 1.3 9.2 –2.61995 1.0 4.9 0.0 0.0 4.0 10.0 3.2 8.2 –1.51996 1.5 1.8 0.0 0.0 2.6 6.0 2.3 2.3 1.31997 2.5 7.0 0.0 0.0 1.9 11.4 1.7 5.5 4.21998 –1.1 –4.8 0.0 0.0 2.7 –3.2 2.7 –1.9 –4.01999 2.2 –2.3 0.0 0.0 4.8 4.7 4.8 –1.0 0.82000 3.4 –1.6 0.0 0.0 2.6 4.5 3.1 2.1 –0.62001 0.5 –1.6 0.2 0.0 –2.1 –2.9 –1.9 0.5 –1.42002 –0.8 –0.7 3.2 0.0 0.2 1.9 4.4 –4.3 1.8
Descriptive statistics: 1972–2002Average 0.5 1.3 0.1 0.0 1.7 3.6 1.9 1.5 0.1Std deviation 1.0 4.7 0.6 0.0 2.0 4.5 2.3 4.7 5.0Range b 4.6 24.7 3.2 0.0 9.1 22.7 10.9 22.7 31.0– maximum 3.4 9.4 3.2 0.0 7.0 11.4 9.0 9.2 16.6– minimum –1.2 –15.3 0.0 0.0 –2.1 –11.4 –1.9 –13.4 –14.4% years < 0 c 26 39 6 0 19 23 19 23 55Correlation d 0.3 0.9 –0.1 – 0.1 1.0 0.2 0.4 0.5

222 Energy security in APEC
43 Decomposition of annual growth in TPEC by fuel type and supply source Indonesia Percentage point contributions
By fuel type Total By supply source primary Stock energy con- Pro- Net draw- Coal Oil Gas Nuclear Other sumption duction imports a down
% pt % pt % pt % pt % pt % % pt % pt % pt
1972 0.0 3.3 0.1 0.0 0.5 3.9 28.3 –25.2 0.81973 –0.1 3.7 0.2 0.0 0.6 4.3 36.2 –23.2 –8.71974 0.1 2.9 0.5 0.0 –0.3 3.2 5.1 –13.3 11.31975 0.1 2.2 0.2 0.0 1.8 4.3 –6.8 5.6 5.51976 –0.1 1.8 1.8 0.0 1.2 4.8 28.0 –23.7 0.51977 0.0 5.2 5.4 0.0 1.4 12.0 30.1 –16.1 –2.01978 0.0 3.6 2.6 0.0 1.5 7.6 3.9 –2.7 6.41979 0.0 2.9 0.6 0.0 1.0 4.6 3.2 5.0 –3.61980 0.0 3.9 –0.5 0.0 0.9 4.3 7.0 1.6 –4.21981 0.0 3.3 0.7 0.0 1.3 5.4 4.3 2.4 –1.41982 0.0 1.1 –0.1 0.0 1.2 2.3 –22.6 21.0 3.81983 0.0 –1.2 1.7 0.0 1.3 1.7 4.7 –2.4 –0.71984 0.1 –0.4 3.9 0.0 1.1 4.6 28.2 –24.4 0.81985 0.6 1.4 0.4 0.0 0.9 3.3 –9.3 14.1 –1.51986 1.8 4.4 2.1 0.0 0.9 9.1 11.3 –2.5 0.31987 0.7 –0.2 –0.7 0.0 1.1 0.9 –2.2 2.7 0.41988 0.5 0.3 1.5 0.0 1.5 3.8 4.3 0.2 –0.61989 0.9 2.6 2.5 0.0 1.0 7.0 12.8 –4.4 –1.41990 0.7 6.3 7.2 0.0 2.9 17.1 17.6 –2.1 1.51991 0.1 0.4 3.2 0.0 0.8 4.5 15.3 –10.6 –0.21992 0.3 2.0 1.0 0.0 0.8 4.1 4.3 –0.5 0.41993 0.5 6.1 0.9 0.0 0.5 8.1 7.3 3.0 –2.31994 1.2 –2.9 2.9 0.0 0.9 2.1 11.7 –10.8 1.21995 0.1 7.1 2.4 0.0 0.8 10.4 6.1 3.7 0.61996 1.1 0.1 1.1 0.0 0.3 2.6 7.1 –3.7 –0.71997 0.5 1.9 1.4 0.0 0.4 4.2 3.6 –0.2 0.71998 0.7 –1.1 –1.2 0.0 1.0 –0.6 1.9 –2.5 0.01999 1.1 1.3 2.1 0.0 0.0 4.4 7.3 –2.3 –0.62000 0.7 2.7 –1.9 0.0 0.7 2.4 –4.7 6.4 0.62001 3.5 –0.3 0.5 0.0 1.2 4.8 4.0 0.8 0.02002 0.8 2.0 0.7 0.0 0.9 4.3 5.6 –1.2 0.0
Descriptive statistics: 1972–2002Average 0.5 2.1 1.4 0.0 1.0 5.0 8.2 –3.4 0.2Std deviation 0.7 2.3 1.9 0.0 0.6 3.5 12.4 10.8 3.4Range b 3.6 10.0 9.1 0.0 3.2 17.7 58.8 46.3 20.0– maximum 3.5 7.1 7.2 0.0 2.9 17.1 36.2 21.0 11.3– minimum –0.1 –2.9 –1.9 0.0 –0.3 –0.6 –22.6 –25.2 –8.7% years < 0 c 13 19 16 0 6 3 16 61 48Correlation d 0.0 0.8 0.8 – 0.5 1.0 0.4 –0.1 0.0

Energy security in APEC 223
44 Decomposition of annual growth in TPEC by fuel type and supply source Viet Nam Percentage point contributions
By fuel type Total By supply source primary Stock energy con- Pro- Net draw- Coal Oil Gas Nuclear Other sumption duction imports a down
% pt % pt % pt % pt % pt % % pt % pt % pt
1972 –1.8 0.4 0.0 0.0 1.4 0.1 –1.4 1.5 0.01973 2.4 –0.6 0.0 0.0 1.5 3.3 4.3 –1.0 0.01974 1.5 –12.1 0.0 0.0 1.5 –9.1 4.3 –13.4 0.01975 3.9 –1.2 0.0 0.0 1.7 4.4 5.4 –0.9 0.01976 –0.7 –12.3 0.0 0.0 1.7 –11.3 2.8 –14.2 0.01977 1.4 0.2 0.0 0.0 1.9 3.5 3.9 –0.4 0.01978 –0.5 1.1 0.0 0.0 1.9 2.5 1.3 1.2 0.01979 0.5 0.8 0.0 0.0 1.9 3.1 0.3 2.8 0.01980 –2.1 4.1 0.0 0.0 1.9 3.9 1.0 4.4 –1.51981 1.1 –1.2 0.0 0.0 1.5 1.4 3.8 –2.0 –0.41982 1.6 0.1 0.0 0.0 1.4 3.1 2.2 0.8 0.11983 0.1 1.3 0.2 0.0 1.2 2.8 1.5 2.1 –0.71984 0.0 –0.2 0.0 0.0 1.6 1.4 –1.9 –0.4 3.61985 –0.1 0.2 –0.1 0.0 1.5 1.5 3.0 –0.2 –1.31986 1.3 1.0 0.0 0.0 1.8 4.2 3.2 1.0 0.01987 1.6 1.5 0.0 0.0 1.9 4.9 2.4 2.5 0.01988 –0.9 0.5 0.0 0.0 2.0 1.5 4.2 –2.8 0.01989 –2.7 –0.8 –0.1 0.0 2.5 –1.0 3.7 –4.8 0.01990 –1.5 1.5 0.0 0.0 2.3 2.3 6.3 –3.1 –1.01991 –0.3 –0.1 0.1 0.0 2.1 1.7 8.6 –7.6 0.71992 0.0 1.9 0.0 0.0 2.0 3.9 7.9 –5.1 1.01993 –0.3 3.9 0.0 0.0 1.9 5.5 7.0 1.5 –3.01994 0.8 1.7 0.0 0.0 1.9 4.4 4.5 –2.6 2.51995 3.6 0.3 0.6 0.0 1.8 6.3 9.6 –3.9 0.61996 0.8 2.4 0.3 0.0 3.7 7.2 10.6 –2.6 –0.81997 3.0 0.7 0.7 0.0 1.3 5.6 8.8 –2.0 –1.11998 0.1 2.8 1.0 0.0 1.3 5.2 10.0 –4.9 0.11999 –1.0 1.7 0.3 0.0 –0.9 0.1 4.6 –6.3 1.82000 0.4 2.5 0.5 0.0 1.0 4.4 7.7 0.8 –4.22001 1.7 2.1 0.0 0.0 1.6 5.5 5.2 –3.3 3.62002 1.2 2.9 3.0 0.0 0.7 8.0 7.9 0.5 –0.4
Descriptive statistics: 1972–2002Average 0.5 0.2 0.2 0.0 1.7 2.6 4.6 –2.0 0.0Std deviation 1.6 3.6 0.6 0.0 0.7 4.0 3.2 4.2 1.5Range b 6.5 16.3 3.1 0.0 4.6 19.3 12.6 18.6 7.8– maximum 3.9 4.1 3.0 0.0 3.7 8.0 10.6 4.4 3.6– minimum –2.7 –12.3 –0.1 0.0 –0.9 –11.3 –1.9 –14.2 –4.2% years < 0 c 35 26 19 0 3 10 6 65 35Correlation d 0.3 0.9 0.4 – 0.1 1.0 0.4 0.7 –0.1

224 Energy security in APEC
appendix
decomposition of annual growth in total fi nal energy consumption in twenty APEC economiesDescriptive statistics relating to sources of APEC energy market volatil-ity since 1972, given in table 13 in chapter 4, are based on information presented in this appendix. The detailed decomposition analysis of annual growth in total fi nal energy consumption (TFEC) in twenty APEC econo-mies is given in tables 45–64 (in order of the ranking of economies used throughout this report; see table 1) .
TFEC in an economy may be defi ned by fuel type or by end use sector. By fuel type, TFEC is equal to the sum of the consumption of individual fi nal fuel types (where renewables and heat are included in a single cat-egory of other energy consumption; see table 5). By end use sector, TPEC is equal to the sum of energy consumption in end use activities, including nonenergy use (for brevity, only industry, transport and other end use sec-tors are included in the decomposition; see table 6). These defi nitions may be expressed as follows:
by fuel type: TFEC = coal consumption + oil consumption + gas consumption + electricity output + other energy consumption
by end use sector: TFEC = industry energy consumption + transport energy consumption + energy consumption in other end use sectors
The decomposition analysis is based on the observation that the annual per-centage change in TFEC in each APEC economy may be decomposed into the percentage point contributions of individual fi nal fuel types or end use sectors. The percentage point contribution accounts for both the annual per-centage change in consumption, by fi nal fuel type or end use sector, as well as the share of the component in TFEC.
Footnotes to tables 45–64a Other sectors and non-energy use. b Maximum observation minus the minimum observation. c Num-ber of years in which a negative observation occurs as a percentage of the total number of years. d Cor-relation coeffi cient between percentage change in TFEC and the variable indicated.Source: Based on IEA energy database; see IEA (2004a,b).
C

Energy security in APEC 225
45 Decomposition of annual growth in TFEC by fuel type and end use sector United States Percentage point contributions
By fuel type Total By end use sector fi nal Elec- energy con- In- Trans Coal Oil Gas tricty Other sumption dustry port Other a
% pt % pt % pt % pt % pt % % pt % pt % pt
1972 –0.2 3.1 0.4 0.8 0.1 4.2 1.1 1.9 1.21973 –0.2 1.8 0.3 0.7 0.0 2.7 1.5 1.4 –0.21974 –0.1 –2.3 –1.0 0.0 0.0 –3.3 –1.5 –0.8 –1.11975 –0.5 –0.7 –2.3 0.2 –0.1 –3.4 –3.6 0.4 –0.21976 –0.3 4.1 0.5 0.7 0.4 5.4 1.8 1.4 2.11977 0.0 3.4 –0.9 0.6 0.2 3.3 2.1 1.1 0.01978 0.1 0.6 0.3 0.4 0.4 1.8 –0.7 1.2 1.41979 0.2 –0.8 0.8 0.3 0.2 0.6 1.8 –0.7 –0.51980 –0.8 –4.1 0.3 0.2 0.1 –4.3 –0.4 –1.5 –2.41981 0.3 –2.0 –0.5 0.3 0.0 –1.8 –0.4 –0.1 –1.21982 –0.7 –1.5 –2.0 –0.4 0.1 –4.7 –4.0 –0.2 –0.51983 0.3 –1.1 –1.3 0.4 0.4 –1.2 –1.5 0.4 –0.11984 0.3 2.2 1.7 0.9 0.6 5.7 3.1 1.1 1.61985 –0.2 0.0 –1.0 0.3 –0.1 –1.0 –1.4 0.3 0.11986 –0.2 1.2 –1.1 0.1 0.1 0.2 –0.6 0.9 –0.11987 –0.1 1.5 0.8 0.7 0.5 3.4 1.2 1.2 1.01988 0.2 1.5 2.0 0.8 –0.1 4.4 1.2 1.7 1.51989 –0.2 –0.4 –0.4 0.5 –2.5 –3.1 –4.0 0.3 0.61990 0.2 –1.2 –0.8 0.4 –1.0 –2.5 –0.4 –0.1 –1.91991 –0.1 –1.1 –0.2 0.9 0.5 0.1 0.1 –0.7 0.71992 –1.6 1.4 0.3 0.0 0.5 0.6 –0.3 0.8 0.11993 –0.2 0.7 1.1 0.6 –0.4 1.8 0.1 0.8 0.91994 0.0 1.8 0.1 0.5 0.0 2.4 0.7 1.4 0.31995 –0.1 0.4 0.5 0.5 0.3 1.6 0.2 0.9 0.61996 0.0 1.8 1.0 0.5 –0.1 3.2 0.5 0.9 1.71997 0.1 0.5 0.6 0.3 –0.1 1.4 1.0 0.7 –0.41998 0.0 0.4 –1.3 0.6 0.2 –0.1 0.0 0.9 –1.01999 0.1 1.7 –0.1 0.5 1.5 3.7 1.4 1.2 1.12000 0.0 1.0 2.0 0.7 0.0 3.7 2.2 0.7 0.82001 0.0 0.6 –1.6 –0.2 –0.5 –1.8 –2.1 0.0 0.42002 –0.2 0.5 0.6 0.3 –0.1 1.2 0.0 0.8 0.3
Descriptive statistics: 1972–2002Average –0.1 0.5 0.0 0.4 0.0 0.8 0.0 0.6 0.2Std deviation 0.4 1.7 1.1 0.3 0.6 2.9 1.7 0.8 1.1Range b 1.9 8.1 4.3 1.4 4.0 10.4 7.0 3.4 4.5– maximum 0.3 4.1 2.0 0.9 1.5 5.7 3.1 1.9 2.1– minimum –1.6 –4.1 –2.3 –0.4 –2.5 –4.7 –4.0 –1.5 –2.4% years < 0 c 61 32 45 6 39 35 42 26 39Correlation d 0.3 0.9 0.7 0.7 0.4 1.0 0.8 0.8 0.8
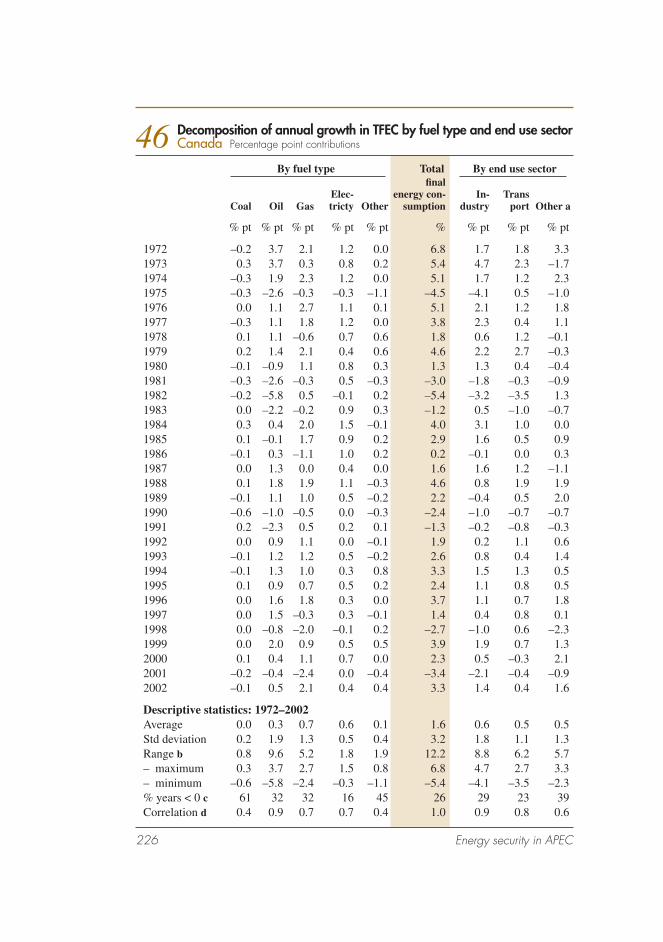
226 Energy security in APEC
46 Decomposition of annual growth in TFEC by fuel type and end use sector Canada Percentage point contributions
By fuel type Total By end use sector fi nal Elec- energy con- In- Trans Coal Oil Gas tricty Other sumption dustry port Other a
% pt % pt % pt % pt % pt % % pt % pt % pt
1972 –0.2 3.7 2.1 1.2 0.0 6.8 1.7 1.8 3.31973 0.3 3.7 0.3 0.8 0.2 5.4 4.7 2.3 –1.71974 –0.3 1.9 2.3 1.2 0.0 5.1 1.7 1.2 2.31975 –0.3 –2.6 –0.3 –0.3 –1.1 –4.5 –4.1 0.5 –1.01976 0.0 1.1 2.7 1.1 0.1 5.1 2.1 1.2 1.81977 –0.3 1.1 1.8 1.2 0.0 3.8 2.3 0.4 1.11978 0.1 1.1 –0.6 0.7 0.6 1.8 0.6 1.2 –0.11979 0.2 1.4 2.1 0.4 0.6 4.6 2.2 2.7 –0.31980 –0.1 –0.9 1.1 0.8 0.3 1.3 1.3 0.4 –0.41981 –0.3 –2.6 –0.3 0.5 –0.3 –3.0 –1.8 –0.3 –0.91982 –0.2 –5.8 0.5 –0.1 0.2 –5.4 –3.2 –3.5 1.31983 0.0 –2.2 –0.2 0.9 0.3 –1.2 0.5 –1.0 –0.71984 0.3 0.4 2.0 1.5 –0.1 4.0 3.1 1.0 0.01985 0.1 –0.1 1.7 0.9 0.2 2.9 1.6 0.5 0.91986 –0.1 0.3 –1.1 1.0 0.2 0.2 –0.1 0.0 0.31987 0.0 1.3 0.0 0.4 0.0 1.6 1.6 1.2 –1.11988 0.1 1.8 1.9 1.1 –0.3 4.6 0.8 1.9 1.91989 –0.1 1.1 1.0 0.5 –0.2 2.2 –0.4 0.5 2.01990 –0.6 –1.0 –0.5 0.0 –0.3 –2.4 –1.0 –0.7 –0.71991 0.2 –2.3 0.5 0.2 0.1 –1.3 –0.2 –0.8 –0.31992 0.0 0.9 1.1 0.0 –0.1 1.9 0.2 1.1 0.61993 –0.1 1.2 1.2 0.5 –0.2 2.6 0.8 0.4 1.41994 –0.1 1.3 1.0 0.3 0.8 3.3 1.5 1.3 0.51995 0.1 0.9 0.7 0.5 0.2 2.4 1.1 0.8 0.51996 0.0 1.6 1.8 0.3 0.0 3.7 1.1 0.7 1.81997 0.0 1.5 –0.3 0.3 –0.1 1.4 0.4 0.8 0.11998 0.0 –0.8 –2.0 –0.1 0.2 –2.7 –1.0 0.6 –2.31999 0.0 2.0 0.9 0.5 0.5 3.9 1.9 0.7 1.32000 0.1 0.4 1.1 0.7 0.0 2.3 0.5 –0.3 2.12001 –0.2 –0.4 –2.4 0.0 –0.4 –3.4 –2.1 –0.4 –0.92002 –0.1 0.5 2.1 0.4 0.4 3.3 1.4 0.4 1.6
Descriptive statistics: 1972–2002Average 0.0 0.3 0.7 0.6 0.1 1.6 0.6 0.5 0.5Std deviation 0.2 1.9 1.3 0.5 0.4 3.2 1.8 1.1 1.3Range b 0.8 9.6 5.2 1.8 1.9 12.2 8.8 6.2 5.7– maximum 0.3 3.7 2.7 1.5 0.8 6.8 4.7 2.7 3.3– minimum –0.6 –5.8 –2.4 –0.3 –1.1 –5.4 –4.1 –3.5 –2.3% years < 0 c 61 32 32 16 45 26 29 23 39Correlation d 0.4 0.9 0.7 0.7 0.4 1.0 0.9 0.8 0.6

Energy security in APEC 227
47 Decomposition of annual growth in TFEC by fuel type and end use sector Australia Percentage point contributions
By fuel type Total By end use sector fi nal Elec- energy con- In- Trans Coal Oil Gas tricty Other sumption dustry port Other a
% pt % pt % pt % pt % pt % % pt % pt % pt
1972 –0.7 –0.3 1.9 0.6 0.2 1.7 –0.3 1.1 0.91973 0.5 5.5 1.1 1.1 –0.3 8.0 2.1 3.3 2.51974 –0.9 –0.1 1.2 1.2 0.1 1.6 2.6 1.2 –2.21975 0.5 0.6 0.7 0.7 0.0 2.5 0.3 1.3 0.81976 –0.5 0.7 0.6 0.5 0.1 1.3 0.1 1.1 0.11977 –0.2 3.5 1.1 1.0 0.1 5.3 1.7 2.3 1.41978 –1.3 1.5 0.9 0.6 –0.1 1.5 –0.9 2.0 0.41979 0.4 0.8 1.0 0.8 –0.3 2.7 0.9 0.9 0.91980 0.2 0.0 1.5 0.7 0.2 2.6 1.3 1.0 0.31981 –0.5 –2.1 0.9 0.8 0.5 –0.5 –0.9 0.5 –0.11982 0.3 –0.1 0.4 0.6 0.2 1.4 –0.7 1.1 0.91983 –0.9 –3.2 0.5 0.1 0.0 –3.5 –2.4 –0.4 –0.61984 0.3 2.4 0.4 1.1 –0.2 4.0 1.5 1.6 1.01985 1.2 0.6 1.6 0.8 0.2 4.4 2.8 1.3 0.31986 –0.6 0.8 0.9 1.1 –1.9 0.3 –1.7 1.0 0.91987 0.2 0.4 0.8 0.8 0.1 2.4 1.1 0.8 0.51988 0.0 3.1 0.2 1.1 0.1 4.5 1.6 1.7 1.21989 0.1 2.2 0.5 1.1 0.3 4.2 1.9 1.5 0.81990 0.1 1.2 0.8 1.0 0.2 3.3 1.3 0.8 1.21991 0.1 –1.2 0.1 0.4 0.0 –0.7 –0.5 –0.7 0.51992 0.0 1.1 0.3 0.2 –0.5 1.0 –0.4 1.1 0.31993 0.1 1.6 0.4 0.6 1.1 3.8 1.5 0.9 1.41994 –0.1 1.3 0.7 0.5 –0.2 2.3 1.3 1.1 –0.11995 –0.1 2.1 0.8 0.6 0.3 3.7 0.9 1.8 1.01996 –0.2 2.0 0.1 0.5 0.8 3.3 0.7 1.6 1.01997 0.3 0.7 0.2 0.6 0.3 2.2 0.7 0.8 0.71998 –0.1 0.6 0.5 1.2 –0.2 1.9 0.8 0.4 0.71999 –0.1 0.7 0.3 0.7 0.0 1.5 0.5 0.7 0.32000 –0.3 1.6 0.7 0.5 0.1 2.7 0.8 1.1 0.82001 –0.3 –0.1 0.9 0.9 0.0 1.3 0.9 0.1 0.32002 –1.4 –1.3 –1.5 1.1 0.1 –3.0 –3.1 –0.1 0.2
Descriptive statistics: 1972–2002Average –0.1 0.9 0.7 0.8 0.0 2.2 0.5 1.1 0.6Std deviation 0.5 1.7 0.6 0.3 0.5 2.2 1.4 0.8 0.8Range b 2.6 8.7 3.3 1.1 3.0 11.4 5.9 4.0 4.7– maximum 1.2 5.5 1.9 1.2 1.1 8.0 2.8 3.3 2.5– minimum –1.4 –3.2 –1.5 0.1 –1.9 –3.5 –3.1 –0.7 –2.2% years < 0 c 55 26 3 0 39 13 29 10 13Correlation d 0.6 0.9 0.4 0.4 0.2 1.0 0.8 0.8 0.6

228 Energy security in APEC
48 Decomposition of annual growth in TFEC by fuel type and end use sector Hong Kong Percentage point contributions
By fuel type Total By end use sector fi nal Elec- energy con- In- Trans Coal Oil Gas tricty Other sumption dustry port Other a
% pt % pt % pt % pt % pt % % pt % pt % pt
1972 –0.3 0.8 0.1 0.5 0.0 1.1 –1.5 3.4 –0.81973 –0.2 –2.0 0.1 2.0 0.0 –0.1 –2.8 2.8 –0.11974 0.0 21.0 0.2 –0.3 –0.1 20.8 16.8 –0.2 4.11975 0.0 –6.2 0.1 1.4 –0.2 –4.9 –5.2 1.1 –0.91976 0.1 14.7 0.2 2.5 0.2 17.6 10.1 5.0 2.61977 –0.1 9.6 0.1 2.4 0.0 12.1 7.4 –0.2 4.81978 –0.1 1.2 0.2 1.8 0.0 3.2 1.2 1.7 0.41979 0.0 –10.6 0.3 1.6 0.1 –8.6 –15.0 8.4 –2.11980 –0.1 –3.0 0.3 2.4 0.0 –0.3 –3.1 –0.8 3.51981 0.9 5.9 0.3 1.5 0.0 8.6 1.9 3.5 3.11982 –0.9 9.0 0.4 1.9 0.1 10.5 4.2 2.2 4.21983 0.0 –2.2 0.5 3.1 0.0 1.4 0.8 0.3 0.31984 0.0 3.5 0.5 1.9 0.0 5.8 3.6 0.3 1.91985 0.0 –5.1 0.5 1.6 0.0 –3.0 –3.0 –1.8 1.71986 0.0 11.2 0.5 3.2 0.0 14.9 3.6 8.1 3.21987 0.0 1.5 0.6 6.1 0.0 8.2 5.1 0.1 3.11988 0.0 12.0 0.6 2.2 0.0 14.8 4.3 8.6 1.91989 0.0 2.6 0.5 –0.7 0.0 2.4 –2.5 2.6 2.31990 0.0 3.4 0.4 1.8 0.0 5.6 –4.6 7.9 2.31991 0.0 –2.5 0.3 1.8 0.0 –0.3 –3.4 1.6 1.61992 0.0 18.3 0.6 1.0 0.0 19.9 6.5 11.1 2.31993 0.0 3.5 0.3 1.6 0.0 5.3 –2.9 6.5 1.81994 0.0 8.2 0.4 1.4 0.0 9.9 0.6 6.8 2.51995 0.0 –0.6 0.3 0.6 0.0 0.3 –1.5 0.9 0.91996 0.0 –1.5 0.2 1.5 0.0 0.2 –1.0 –0.4 1.61997 0.0 1.9 0.2 0.5 0.0 2.6 –0.4 2.3 0.61998 0.0 17.9 0.0 2.2 0.0 20.1 5.5 12.3 2.21999 0.0 10.9 0.1 0.0 0.0 11.0 3.6 6.5 0.92000 0.0 –13.4 0.2 0.9 0.0 –12.2 –3.7 –9.3 0.72001 0.0 –3.5 0.1 0.7 0.0 –2.7 –1.6 –2.6 1.52002 0.0 –1.6 0.0 0.6 0.0 –0.9 –2.4 0.0 1.6
Descriptive statistics: 1972–2002Average 0.0 3.4 0.3 1.6 0.0 5.3 0.7 2.9 1.7Std deviation 0.2 8.3 0.2 1.2 0.1 8.4 5.6 4.5 1.5Range b 1.7 34.4 0.6 6.8 0.3 33.0 31.8 21.6 6.9– maximum 0.9 21.0 0.6 6.1 0.2 20.8 16.8 12.3 4.8– minimum –0.9 –13.4 0.0 –0.7 –0.2 –12.2 –15.0 –9.3 –2.1% years < 0 c 39 39 0 10 39 29 52 26 13Correlation d 0.0 1.0 0.2 0.1 0.0 1.0 0.8 0.6 0.6

Energy security in APEC 229
49 Decomposition of annual growth in TFEC by fuel type and end use sector Japan Percentage point contributions
By fuel type Total By end use sector fi nal Elec- energy con- In- Trans Coal Oil Gas tricty Other sumption dustry port Other a
% pt % pt % pt % pt % pt % % pt % pt % pt
1972 1.0 4.1 0.1 1.6 0.0 6.8 3.8 0.9 2.21973 –0.5 9.0 0.3 1.5 0.0 10.3 4.8 1.9 3.51974 0.3 –2.3 0.2 –0.2 0.0 –2.0 –1.4 0.0 –0.61975 –0.1 –5.0 0.1 0.5 0.0 –4.6 –5.6 0.9 0.11976 –0.3 4.5 0.2 1.2 0.0 5.7 3.1 1.1 1.51977 –0.3 0.8 0.2 0.7 0.0 1.4 –0.6 0.9 1.01978 –0.7 2.1 0.0 0.9 0.0 2.4 –0.6 1.4 1.61979 0.8 1.4 0.3 0.9 0.0 3.3 2.0 0.9 0.41980 0.8 –6.9 0.1 –0.3 0.0 –6.2 –5.5 0.3 –1.01981 0.7 –3.4 0.2 0.1 0.0 –2.4 –2.9 –0.4 0.91982 –0.6 –0.4 0.0 –0.1 1.0 –0.1 –0.2 –0.5 0.51983 –0.7 1.3 0.2 1.2 0.0 1.9 –0.5 0.8 1.71984 0.9 3.5 0.5 1.0 0.1 6.0 3.1 0.8 2.21985 0.3 –1.0 0.1 0.7 0.0 0.0 –0.1 0.3 –0.21986 –0.5 1.8 0.2 0.1 –0.1 1.6 –0.6 0.9 1.31987 –0.6 2.2 0.1 1.3 0.0 2.9 0.9 1.0 1.01988 0.7 3.7 0.4 1.1 0.0 6.0 2.1 1.4 2.51989 0.2 2.1 0.2 1.3 0.0 3.8 1.9 1.8 0.11990 –0.5 1.3 0.3 1.8 0.5 3.4 –2.3 2.1 3.61991 –0.8 1.5 0.4 0.7 0.0 1.7 –0.4 1.2 1.01992 0.0 2.2 0.2 0.2 0.0 2.6 1.0 0.9 0.71993 –0.2 –0.4 0.4 0.2 –0.1 –0.2 –1.4 0.2 1.01994 0.5 3.0 0.1 1.5 0.0 5.1 3.4 1.1 0.61995 –0.2 1.5 0.4 0.6 0.0 2.3 –0.1 1.1 1.41996 0.5 2.7 0.2 0.5 0.0 4.0 2.6 1.0 0.41997 0.6 0.5 0.2 0.6 0.0 2.0 1.4 0.4 0.21998 –1.4 –0.8 0.0 0.2 –0.1 –2.1 –2.9 –0.2 1.11999 0.3 1.9 0.3 0.6 0.0 3.0 2.2 0.2 0.72000 0.4 0.0 0.3 0.6 0.1 1.4 0.8 0.0 0.72001 –0.2 –0.7 0.0 –0.3 –0.1 –1.3 –1.2 0.1 –0.32002 0.3 1.0 0.4 0.4 0.0 2.2 1.1 –0.3 1.3
Descriptive statistics: 1972–2002Average 0.0 1.0 0.2 0.7 0.1 2.0 0.3 0.7 1.0Std deviation 0.6 2.9 0.1 0.6 0.2 3.4 2.5 0.7 1.0Range b 2.4 15.8 0.5 2.1 1.1 16.5 10.4 2.6 4.6– maximum 1.0 9.0 0.5 1.8 1.0 10.3 4.8 2.1 3.6– minimum –1.4 –6.9 0.0 –0.3 –0.1 –6.2 –5.6 –0.5 –1.0% years < 0 c 48 32 10 13 16 26 52 16 13Correlation d 0.1 1.0 0.4 0.8 0.0 1.0 0.9 0.6 0.7

230 Energy security in APEC
50 Decomposition of annual growth in TFEC by fuel type and end use sector Singapore Percentage point contributions
By fuel type Total By end use sector fi nal Elec- energy con- In- Trans Coal Oil Gas tricty Other sumption dustry port Other a
% pt % pt % pt % pt % pt % % pt % pt % pt
1972 0.0 13.7 0.2 3.2 –0.2 16.9 0.2 8.2 8.41973 0.0 12.6 0.1 2.1 –0.1 14.6 4.1 5.6 4.91974 0.0 10.7 0.2 –0.2 –0.1 10.7 3.1 1.4 6.21975 0.0 –0.4 0.2 1.5 0.1 1.3 1.1 6.0 –5.61976 0.0 12.2 0.3 1.6 0.1 14.1 4.1 10.0 –0.11977 0.0 14.3 0.1 1.6 0.2 16.2 –0.3 13.3 3.01978 0.0 9.2 0.2 2.3 –0.1 11.5 4.2 5.5 1.81979 0.0 5.7 0.1 1.1 0.0 7.0 0.6 6.7 –0.21980 0.0 –0.7 0.1 1.4 –0.1 0.7 0.0 –0.5 1.21981 0.0 3.4 0.0 1.1 0.0 4.5 1.0 1.4 2.11982 0.0 6.6 0.0 0.8 0.0 7.4 –1.0 5.1 3.31983 0.0 4.6 0.0 1.4 0.0 6.1 0.7 3.8 1.61984 0.0 8.0 0.0 1.6 0.0 9.6 11.7 1.9 –3.91985 0.0 17.7 –0.1 1.1 –0.1 18.6 16.2 –1.5 3.91986 0.0 1.4 0.0 1.0 0.0 2.4 –1.6 3.3 0.71987 0.0 9.1 0.0 2.0 0.0 11.1 7.2 2.6 1.31988 0.0 0.6 0.1 1.7 0.0 2.5 1.0 1.2 0.21989 0.0 6.2 0.1 1.0 0.0 7.3 2.6 4.1 0.51990 0.0 14.6 0.1 1.8 0.0 16.5 4.1 8.3 4.21991 0.0 –3.1 0.1 0.8 0.0 –2.3 –2.4 –0.4 0.61992 0.0 –3.8 0.1 1.4 0.0 –2.3 –2.9 1.0 –0.51993 0.0 8.4 0.1 1.5 0.0 10.0 2.8 7.4 –0.11994 0.0 9.2 0.1 2.0 0.0 11.2 0.9 8.7 1.61995 0.0 5.8 0.0 1.3 0.0 7.1 5.0 1.4 0.71996 0.0 4.1 0.1 1.5 0.0 5.7 3.8 1.8 0.11997 0.0 19.5 0.1 2.3 0.0 21.9 21.9 –1.8 1.91998 0.0 –8.5 0.0 1.2 0.0 –7.2 –6.5 –1.4 0.61999 0.0 –0.2 0.0 1.2 0.0 1.0 –1.7 2.5 0.22000 0.0 –1.8 0.0 1.7 0.0 –0.1 –3.9 2.8 1.12001 0.0 18.7 0.0 0.4 0.0 19.1 4.1 –0.1 15.12002 0.0 11.7 0.0 1.0 0.0 12.7 10.8 0.7 1.2
Descriptive statistics: 1972–2002Average 0.0 6.8 0.1 1.4 0.0 8.2 2.9 3.5 1.8Std deviation 0.0 7.0 0.1 0.6 0.1 7.2 5.8 3.7 3.6Range b 0.0 28.1 0.3 3.4 0.4 29.2 28.4 15.2 20.7– maximum 0.0 19.5 0.3 3.2 0.2 21.9 21.9 13.3 15.1– minimum 0.0 –8.5 –0.1 –0.2 –0.2 –7.2 –6.5 –1.8 –5.6% years < 0 c 0 23 6 3 35 13 29 19 19Correlation d – 1.0 0.1 0.3 –0.2 1.0 0.7 0.3 0.5

Energy security in APEC 231
51 Decomposition of annual growth in TFEC by fuel type and end use sector Chinese Taipei Percentage point contributions
By fuel type Total By end use sector fi nal Elec- energy con- In- Trans Coal Oil Gas tricty Other sumption dustry port Other a
% pt % pt % pt % pt % pt % % pt % pt % pt
1972 0.1 16.0 1.7 2.4 0.3 20.5 10.2 8.3 1.91973 –1.8 8.5 1.7 1.6 0.0 10.0 3.8 2.2 4.01974 –2.5 –3.9 0.1 0.8 –0.2 –5.7 –1.1 –4.2 –0.31975 –1.9 11.2 0.6 2.0 –0.3 11.6 5.4 3.7 2.41976 0.9 14.3 1.7 2.7 0.0 19.5 12.6 3.5 3.31977 –0.9 8.6 1.3 1.9 –0.2 10.7 8.2 3.0 –0.41978 2.8 10.0 0.6 2.5 –0.1 15.8 11.5 1.3 3.01979 –0.5 7.1 –0.6 1.7 0.0 7.7 5.8 1.2 0.71980 1.3 3.0 0.0 1.2 0.0 5.5 2.9 1.0 1.51981 0.3 –3.1 –0.8 –0.2 0.0 –3.9 –4.1 0.1 0.11982 3.9 –1.5 –1.3 0.7 0.0 1.8 –0.2 0.7 1.21983 2.3 4.0 0.1 1.9 0.0 8.3 4.5 1.9 1.91984 –1.1 5.0 0.1 1.4 0.0 5.3 2.4 1.6 1.31985 –1.2 4.2 –0.5 0.8 0.0 3.3 1.3 0.9 1.11986 1.0 6.2 –0.3 2.2 0.0 9.1 6.1 1.8 1.21987 0.6 4.8 0.1 1.9 0.0 7.5 3.3 2.5 1.81988 3.4 4.2 0.2 2.2 0.0 10.2 5.7 2.8 1.71989 –0.5 4.1 0.0 1.8 0.0 5.2 0.4 2.6 2.31990 0.0 3.4 0.1 1.5 0.0 5.0 1.8 2.1 1.11991 0.5 1.1 0.6 2.1 0.0 4.3 1.6 1.4 1.21992 1.0 4.1 0.4 1.5 0.0 6.9 2.7 3.9 0.31993 0.9 2.8 0.1 2.0 0.0 5.8 2.4 1.8 1.51994 0.5 5.3 0.2 1.7 0.0 7.7 4.3 2.1 1.21995 –0.2 1.8 0.4 1.8 0.0 3.8 1.7 1.6 0.51996 0.3 2.9 0.2 1.5 0.0 4.9 1.7 1.1 2.11997 0.5 0.5 0.1 1.7 0.0 2.8 2.0 0.6 0.11998 1.3 1.6 0.0 1.4 0.0 4.3 1.2 1.4 1.71999 –0.6 3.2 –0.2 1.8 0.0 4.3 1.1 1.4 1.92000 1.0 0.3 –0.1 2.6 0.0 3.9 2.1 0.3 1.42001 0.8 7.5 0.0 0.5 0.0 8.7 9.2 –0.2 –0.32002 0.6 4.7 0.4 1.4 0.0 7.1 5.2 1.1 0.8
Descriptive statistics: 1972–2002Average 0.4 4.6 0.2 1.6 0.0 6.8 3.7 1.7 1.4Std deviation 1.4 4.4 0.7 0.6 0.1 5.4 3.7 1.9 1.0Range b 6.4 20.0 3.0 2.9 0.5 26.1 16.8 12.5 4.5– maximum 3.9 16.0 1.7 2.7 0.3 20.5 12.6 8.3 4.0– minimum –2.5 –3.9 –1.3 –0.2 –0.3 –5.7 –4.1 –4.2 –0.4% years < 0 c 35 10 29 3 58 6 10 6 10Correlation d 0.2 1.0 0.7 0.7 0.2 1.0 0.9 0.8 0.5

232 Energy security in APEC
52 Decomposition of annual growth in TFEC by fuel type and end use sector New Zealand Percentage point contributions
By fuel type Total By end use sector fi nal Elec- energy con- In- Trans Coal Oil Gas tricty Other sumption dustry port Other a
% pt % pt % pt % pt % pt % % pt % pt % pt
1972 0.3 7.0 0.8 3.1 0.0 11.2 5.0 3.7 2.61973 0.6 0.3 0.3 1.3 0.0 2.5 1.9 0.2 0.41974 0.6 1.7 1.0 0.5 5.6 9.3 5.7 1.9 1.71975 –0.8 0.0 0.3 1.8 0.3 1.5 –2.0 1.4 2.11976 0.4 0.4 0.9 1.3 0.2 3.2 1.9 0.3 1.01977 0.0 0.7 0.0 0.2 0.6 1.6 1.2 0.2 0.21978 –1.6 –0.3 0.3 0.1 0.1 –1.4 –1.7 1.0 –0.61979 –0.2 –0.7 –0.4 0.1 –0.2 –1.4 –0.3 0.4 –1.51980 0.8 0.4 1.3 0.6 0.7 3.8 2.7 0.1 1.01981 –0.1 –2.3 0.8 0.7 0.0 –1.0 –0.4 –0.4 –0.21982 –0.1 0.0 1.7 1.5 –0.3 2.9 0.9 0.4 1.51983 –0.4 –1.6 2.4 2.0 0.0 2.4 1.8 0.3 0.31984 0.2 1.8 6.3 1.1 0.7 10.0 7.5 2.2 0.41985 –0.4 –0.7 1.7 0.3 0.0 0.8 0.7 0.6 –0.51986 –0.3 1.4 –0.1 1.1 0.0 2.0 –0.3 1.8 0.51987 1.3 1.9 0.1 0.5 0.3 4.0 1.9 2.2 –0.11988 2.5 2.0 0.0 0.9 0.3 5.7 3.6 1.9 0.21989 –0.5 2.2 –0.1 0.6 0.1 2.3 –0.7 1.9 1.11990 0.1 2.0 –0.1 0.5 3.4 5.8 2.7 1.5 1.61991 –0.6 –1.2 2.5 0.7 –0.1 1.2 1.9 –0.3 –0.41992 0.6 2.9 –0.7 –0.7 0.7 2.9 1.4 1.6 –0.11993 0.0 0.0 1.1 1.6 0.1 2.8 1.1 0.9 0.81994 0.0 4.0 1.7 0.6 –0.2 6.0 2.0 2.5 1.51995 –0.4 2.3 2.2 0.1 0.3 4.6 2.2 2.4 –0.11996 –0.4 0.4 3.1 0.7 0.0 3.8 3.1 0.7 0.01997 –0.5 1.1 0.8 0.1 0.6 2.1 0.3 1.3 0.51998 0.0 –0.1 –0.5 0.7 0.9 1.1 0.5 0.5 0.11999 –0.5 1.8 2.2 0.7 1.9 6.1 2.8 1.6 1.72000 0.0 1.1 1.8 0.1 0.1 3.1 3.2 1.0 –1.12001 0.9 –0.1 –1.0 –0.4 0.0 –0.7 –1.9 0.5 0.72002 –0.2 3.9 1.3 1.1 0.2 6.3 1.9 3.4 1.0
Descriptive statistics: 1972–2002Average 0.0 1.0 1.0 0.8 0.5 3.4 1.6 1.2 0.5Std deviation 0.7 1.8 1.4 0.8 1.2 3.1 2.1 1.0 0.9Range b 4.0 9.3 7.3 3.8 5.9 12.6 9.5 4.1 4.0– maximum 2.5 7.0 6.3 3.1 5.6 11.2 7.5 3.7 2.6– minimum –1.6 –2.3 –1.0 –0.7 –0.3 –1.4 –2.0 –0.4 –1.5% years < 0 c 48 29 23 6 23 13 23 6 29Correlation d 0.3 0.8 0.4 0.4 0.4 1.0 0.9 0.7 0.6

Energy security in APEC 233
53 Decomposition of annual growth in TFEC by fuel type and end use sector Republic of Korea Percentage point contributions
By fuel type Total By end use sector fi nal Elec- energy con- In- Trans Coal Oil Gas tricty Other sumption dustry port Other a
% pt % pt % pt % pt % pt % % pt % pt % pt
1972 0.7 0.2 0.0 1.1 0.0 2.0 –0.3 –1.1 3.41973 8.9 16.8 0.0 1.2 0.0 26.9 11.1 4.5 11.21974 2.3 0.2 0.0 1.1 0.0 3.6 3.1 –0.9 1.41975 0.4 3.2 0.0 0.8 0.0 4.3 2.3 0.4 1.61976 2.5 7.9 0.0 1.4 0.0 11.8 6.4 1.4 3.91977 3.5 11.6 0.0 1.3 0.0 16.5 1.2 6.3 8.91978 0.6 8.5 0.0 1.6 0.0 10.7 6.1 2.9 1.71979 2.3 9.1 0.0 1.2 0.0 12.6 6.2 4.0 2.41980 2.6 –0.3 0.0 0.4 0.0 2.8 0.4 –2.6 5.01981 2.4 –2.7 0.0 0.7 0.0 0.5 –1.0 –3.1 4.61982 –1.0 –1.2 0.0 0.7 0.0 –1.5 –2.3 1.7 –1.01983 2.3 4.6 0.0 1.3 0.0 8.2 2.5 4.0 1.71984 3.0 4.9 0.0 1.1 0.0 9.0 2.1 1.7 5.21985 2.3 2.7 0.0 0.9 0.0 5.9 1.1 1.6 3.11986 1.4 6.6 0.0 1.2 0.0 9.2 3.0 3.0 3.21987 –0.3 7.1 0.0 1.6 0.0 8.5 3.8 3.6 1.21988 0.1 8.8 0.2 1.9 0.0 11.1 4.8 3.2 3.11989 –2.7 8.6 0.3 1.3 0.0 7.6 2.7 3.3 1.61990 –0.7 15.0 0.4 1.9 0.0 16.6 7.9 3.8 5.01991 –2.5 11.5 0.5 1.3 0.4 11.3 7.0 2.9 1.41992 –2.5 14.3 0.6 1.3 0.2 13.9 8.2 2.7 3.01993 –1.0 8.5 0.6 1.3 0.1 9.8 4.1 3.0 2.71994 –0.7 7.2 0.9 1.8 0.4 9.6 3.7 3.1 2.81995 –0.2 5.9 0.8 1.5 0.2 8.6 1.7 3.2 3.71996 0.2 4.4 1.2 1.6 0.3 7.7 2.9 2.2 2.71997 –0.2 3.8 1.3 1.4 0.2 6.3 4.0 0.3 2.11998 –0.6 –9.4 1.2 –0.5 0.1 –9.9 –0.8 –3.5 –5.61999 0.2 6.5 0.4 1.6 0.3 10.3 3.0 2.1 5.22000 0.8 0.7 1.8 1.4 0.3 4.6 2.8 1.9 –0.12001 0.4 –0.7 1.4 1.1 1.6 3.0 1.8 0.8 0.42002 1.1 1.2 0.5 2.9 –0.2 6.2 3.2 1.6 1.4
Descriptive statistics: 1972–2002Average 0.8 5.3 0.4 1.3 0.1 8.0 3.3 1.9 2.8Std deviation 2.2 5.6 0.4 0.6 0.3 6.4 2.9 2.2 2.9Range b 11.6 26.1 0.5 3.4 1.8 36.8 13.4 9.8 16.8– maximum 8.9 16.8 1.8 2.9 1.6 26.9 11.1 6.3 11.2– minimum –2.7 –9.4 1.8 –0.5 –0.2 –9.9 –2.3 –3.5 –5.6% years < 0 c 35 16 0.0 3 26 6 13 16 10Correlation d 0.4 0.9 0 0.5 –0.1 1.0 0.8 0.8 0.8

234 Energy security in APEC
54 Decomposition of annual growth in TFEC by fuel type and end use sector Brunei Darussalam Percentage point contributions
By fuel type Total By end use sector fi nal Elec- energy con- In- Trans Coal Oil Gas tricty Other sumption dustry port Other a
% pt % pt % pt % pt % pt % % pt % pt % pt
1972 0.0 –4.0 0.0 0.0 0.0 –4.0 1.0 –7.1 2.01973 0.0 11.6 0.0 0.0 0.0 11.6 –1.1 13.7 –1.11974 0.0 10.4 0.0 0.0 1.9 12.3 4.7 8.5 0.01975 0.0 6.7 0.0 0.0 0.0 6.7 –0.8 7.6 0.01976 0.0 7.9 0.0 0.0 0.0 7.9 0.8 7.9 –0.81977 0.0 –2.9 0.0 0.0 0.7 –2.2 –10.9 8.0 0.01978 0.0 5.2 0.0 0.0 0.0 5.2 3.7 1.5 0.01979 0.0 12.8 0.0 0.0 0.0 12.8 6.4 7.1 0.01980 0.0 50.9 0.0 3.8 0.0 54.7 15.1 30.8 8.21981 0.0 –6.9 0.0 4.1 –0.4 –3.3 –4.9 –0.8 2.81982 0.0 10.5 0.0 2.9 0.0 13.4 2.9 5.9 4.21983 0.0 6.7 0.0 3.3 0.0 10.0 3.3 3.3 3.31984 0.0 –3.0 0.0 1.7 0.0 –1.3 –3.4 1.3 0.31985 0.0 4.8 0.0 0.3 0.3 5.5 1.4 3.1 1.41986 0.0 2.3 0.0 0.3 –0.3 2.3 –1.3 4.5 –0.61987 0.0 4.1 0.0 6.0 0.3 10.4 1.6 3.8 4.71988 0.0 7.4 0.0 1.4 –0.3 8.6 2.0 4.9 2.01989 0.0 2.6 0.0 0.5 0.3 3.4 1.1 0.5 1.31990 0.0 2.8 0.0 0.8 0.0 3.6 0.8 3.1 –0.31991 0.0 4.7 0.0 0.5 –0.2 4.9 0.5 4.9 0.01992 0.0 11.7 0.0 2.1 0.2 14.1 2.8 6.3 4.71993 0.0 5.1 0.0 3.9 –0.2 8.8 1.0 3.1 4.71994 0.0 4.5 0.0 2.6 0.0 7.2 0.9 3.8 2.51995 0.0 6.3 0.0 3.5 0.2 10.1 1.1 4.6 4.41996 0.0 6.6 0.0 3.2 0.0 9.8 1.3 5.0 3.51997 0.0 5.5 0.0 4.2 –0.1 9.6 1.5 4.1 4.21998 0.0 –8.4 0.0 1.1 0.0 –7.3 –2.8 –4.3 –0.41999 0.0 –4.0 0.0 –0.9 0.0 –4.9 –1.4 –2.6 –0.92000 0.0 –1.1 0.0 1.4 0.0 0.3 –1.1 0.0 1.42001 0.0 –0.3 0.0 –3.2 0.2 –3.3 –1.5 2.1 –3.92002 0.0 4.4 0.0 1.2 –0.2 5.5 0.8 3.9 0.8
Descriptive statistics: 1972–2002Average 0.0 5.3 0.0 1.5 0.1 6.8 0.8 4.5 1.6Std deviation 0.0 10.1 0.0 1.9 0.4 10.7 4.1 6.3 2.5Range b 0.0 59.3 0.0 9.2 2.3 62.0 26.0 37.9 12.1– maximum 0.0 50.9 0.0 6.0 1.9 54.7 15.1 30.8 8.2– minimum 0.0 –8.4 0.0 –3.2 –0.4 –7.3 –10.9 –7.1 –3.9% years < 0 c 0 26 0 6 23 23 32 13 23Correlation d – 1.0 – 0.4 0.1 1.0 0.8 0.9 0.6

Energy security in APEC 235
55 Decomposition of annual growth in TFEC by fuel type and end use sector Chile Percentage point contributions
By fuel type Total By end use sector fi nal Elec- energy con- In- Trans Coal Oil Gas tricty Other sumption dustry port Other a
% pt % pt % pt % pt % pt % % pt % pt % pt
1972 –0.8 2.2 0.3 0.5 –0.6 1.6 0.9 –0.7 1.41973 –0.1 –1.8 0.3 –0.2 –0.4 –2.1 –0.4 –2.1 0.41974 –0.1 –1.3 0.4 0.7 1.1 0.8 2.9 –1.5 –0.71975 –2.1 –7.3 0.1 –0.7 0.2 –9.8 –5.1 –3.6 –1.11976 0.0 2.1 0.2 0.7 1.0 4.0 2.3 0.6 1.11977 0.4 3.2 0.0 0.6 1.1 5.3 2.5 1.5 1.21978 –0.4 3.6 0.1 0.7 1.6 5.6 2.4 3.3 0.01979 –0.4 1.5 0.1 0.7 0.7 2.7 0.5 1.9 0.21980 0.7 2.0 –0.1 0.5 1.1 4.2 1.8 2.2 0.21981 0.2 1.2 0.0 0.4 0.1 1.9 –1.1 2.1 0.91982 –2.6 –4.1 0.1 –0.2 0.7 –6.1 –4.6 –1.8 0.31983 1.2 –0.2 0.2 0.4 2.2 3.8 4.3 –0.2 –0.31984 1.4 0.6 0.1 1.0 1.8 4.8 3.6 0.0 1.31985 0.5 –1.2 –0.1 0.5 0.5 0.2 –0.1 –0.4 0.71986 0.9 3.3 0.1 0.8 0.8 5.9 1.8 1.3 2.81987 –0.4 2.2 –0.1 0.5 1.3 3.5 0.8 2.0 0.81988 0.8 6.1 0.1 1.1 0.8 8.9 3.1 3.7 2.11989 0.2 4.9 0.0 1.0 0.2 6.3 2.1 2.2 2.01990 0.6 2.2 0.1 0.5 1.7 4.9 0.9 1.3 2.81991 0.5 2.9 0.1 1.3 3.0 7.7 3.1 2.1 2.51992 1.3 5.1 0.1 1.8 2.3 10.6 5.8 2.1 2.71993 –0.5 4.9 0.0 0.7 –2.0 3.1 –1.1 2.8 1.51994 –0.7 3.7 0.1 0.7 1.0 4.9 0.0 3.2 1.71995 0.0 5.1 0.1 1.7 1.4 8.2 3.9 2.9 1.31996 0.7 4.1 0.1 1.5 1.2 7.6 2.9 3.0 1.61997 2.4 5.4 1.7 1.5 –0.2 10.9 7.0 2.1 1.71998 –2.3 –0.8 0.1 0.7 1.0 –1.2 –2.5 1.8 –0.51999 0.0 –0.6 0.4 1.9 1.1 2.8 1.1 0.6 1.22000 –1.0 0.3 2.3 0.9 1.4 3.9 2.7 0.3 1.02001 0.9 –1.6 0.8 1.3 –0.9 0.5 0.7 –1.2 1.02002 –0.8 0.2 0.5 0.7 0.7 1.3 0.0 1.1 0.2
Descriptive statistics: 1972–2002Average 0.0 1.5 0.3 0.8 0.8 3.4 1.4 1.1 1.0Std deviation 1.1 3.0 0.5 0.6 1.0 4.4 2.6 1.8 1.0Range b 5.0 13.4 2.3 2.6 5.0 20.6 12.1 7.3 3.9– maximum 2.4 6.1 2.3 1.9 3.0 10.9 7.0 3.7 2.8– minimum –2.6 –7.3 –0.1 –0.7 –2.0 –9.8 –5.1 –3.6 –1.1% years < 0 c 45 29 10 10 16 13 23 29 13Correlation d 0.7 0.9 0.1 0.8 0.4 1.0 0.9 0.8 0.7

236 Energy security in APEC
56 Decomposition of annual growth in TFEC by fuel type and end use sector Malaysia Percentage point contributions
By fuel type Total By end use sector fi nal Elec- energy con- In- Trans Coal Oil Gas tricty Other sumption dustry port Other a
% pt % pt % pt % pt % pt % % pt % pt % pt
1972 –0.2 –3.9 0.1 0.8 0.9 –2.4 –5.5 1.1 2.01973 0.1 1.1 0.0 0.7 0.8 2.8 –2.4 4.2 1.01974 0.1 12.1 0.2 0.7 0.8 13.9 8.6 2.0 3.41975 0.0 3.3 0.1 0.7 1.2 5.3 0.2 2.8 2.31976 0.1 2.8 0.1 0.9 –0.1 3.7 2.4 1.0 0.31977 0.0 –3.9 –0.1 1.4 0.3 –2.3 –2.2 –1.8 1.81978 0.2 6.9 0.1 0.9 0.7 8.8 3.1 0.7 5.01979 0.2 9.5 0.0 1.3 –0.1 10.9 5.1 3.4 2.41980 0.3 7.8 0.0 0.9 0.3 9.3 4.1 3.9 1.31981 0.6 6.8 0.1 0.7 0.4 8.7 4.9 2.6 1.21982 –0.1 2.4 0.1 0.8 0.4 3.6 –0.6 2.6 1.61983 1.9 4.7 0.0 0.8 0.3 7.7 1.7 4.6 1.51984 0.2 –0.1 0.9 0.9 0.5 2.5 –0.1 1.5 1.01985 1.0 0.5 3.7 0.7 0.0 5.8 3.9 0.8 1.11986 –1.0 2.4 5.0 0.9 0.2 7.5 2.5 3.7 1.31987 0.6 3.8 0.7 0.8 0.7 6.5 3.6 1.9 0.91988 –1.2 5.0 –0.6 1.3 0.3 4.6 –0.2 3.2 1.61989 3.5 7.3 0.1 1.3 0.3 12.5 8.6 3.5 0.41990 –0.6 9.3 0.2 1.3 0.3 10.4 4.2 5.5 0.71991 0.6 7.6 0.2 1.4 0.0 9.8 3.6 2.9 3.31992 0.5 6.5 1.4 1.8 0.2 10.3 4.3 2.7 3.31993 0.2 5.3 1.8 1.3 0.2 8.8 8.1 1.2 –0.51994 –0.6 4.3 0.7 2.5 0.1 7.0 –1.0 3.7 4.31995 0.6 10.5 0.3 2.2 0.1 13.7 9.2 2.7 1.71996 0.1 4.9 2.1 1.7 0.1 9.0 0.3 4.8 3.81997 0.0 5.4 0.0 2.8 0.0 8.3 4.3 4.9 –0.91998 0.1 –4.0 0.9 1.4 0.0 –1.6 –0.2 –1.5 0.11999 –0.6 4.8 1.0 –0.1 0.1 5.2 –0.2 5.9 –0.52000 1.3 2.8 2.7 1.5 0.1 8.4 5.1 2.4 0.92001 0.0 2.4 2.2 1.1 –0.2 5.5 1.6 3.5 0.42002 0.3 1.0 2.8 1.0 0.2 5.3 3.2 0.9 1.2
Descriptive statistics: 1972–2002Average 0.3 4.2 0.9 1.2 0.3 6.8 2.6 2.6 1.5Std deviation 0.9 4.0 1.3 0.6 0.3 4.1 3.5 1.8 1.4Range b 4.7 16.1 5.6 3.0 1.4 16.3 14.7 7.7 5.9– maximum 3.5 12.1 5.0 2.8 1.2 13.9 9.2 5.9 5.0– minimum –1.2 –4.0 –0.6 –0.1 –0.2 –2.4 –5.5 –1.8 –0.9% years < 0 c 32 13 13 3 16 10 29 6 10Correlation d 0.3 0.9 0.0 0.3 –0.1 1.0 0.8 0.5 0.2

Energy security in APEC 237
57 Decomposition of annual growth in TFEC by fuel type and end use sector Mexico Percentage point contributions
By fuel type Total By end use sector fi nal Elec- energy con- In- Trans Coal Oil Gas tricty Other sumption dustry port Other a
% pt % pt % pt % pt % pt % % pt % pt % pt
1972 0.3 6.1 1.1 0.7 0.1 8.4 3.1 3.5 1.81973 0.4 3.4 2.0 0.6 0.5 7.0 3.1 2.9 1.01974 0.1 6.1 0.2 0.7 0.3 7.4 3.0 3.2 1.31975 –0.1 6.9 1.0 0.5 0.0 8.3 3.5 2.1 2.71976 0.2 5.9 0.5 0.6 0.0 7.3 3.2 2.9 1.21977 0.3 1.2 0.7 0.6 0.2 3.0 0.5 2.0 0.61978 0.2 5.4 3.8 0.8 0.6 10.7 6.4 2.8 1.61979 0.0 5.3 2.4 0.6 0.3 8.6 2.7 4.5 1.41980 –0.2 5.8 1.8 0.6 0.0 7.9 1.1 4.2 2.61981 0.1 6.8 3.0 0.6 –0.1 10.5 5.5 4.1 0.91982 –0.2 1.6 0.8 0.7 0.2 3.1 1.7 –0.1 1.51983 0.5 –3.1 1.3 0.1 0.1 –1.1 3.5 –3.6 –0.91984 0.0 3.8 –2.4 0.5 0.3 2.1 –0.5 1.6 1.01985 0.0 3.0 0.4 0.5 0.0 3.9 2.8 0.4 0.81986 –0.4 –0.9 –2.7 0.3 0.2 –3.5 –2.6 –0.3 –0.61987 0.2 2.5 1.4 0.5 0.3 4.9 3.0 0.8 1.01988 –0.5 0.9 –0.4 0.5 –0.3 0.1 –1.2 0.4 1.01989 0.4 4.5 –0.6 0.7 0.0 4.9 1.6 3.4 –0.11990 –0.1 1.5 1.4 0.5 –0.1 3.2 –0.7 2.6 1.31991 –0.2 2.4 0.9 0.3 0.4 3.7 0.6 2.6 0.61992 0.1 2.6 –0.5 0.3 –0.1 2.3 –0.2 0.8 1.81993 0.0 –0.2 0.0 0.0 0.3 0.1 0.2 0.8 –1.01994 0.2 1.5 0.9 0.8 –0.3 3.0 0.9 0.9 1.21995 0.2 –3.2 1.4 0.4 0.3 –1.0 1.8 –1.4 –1.41996 0.2 –1.7 –1.2 0.8 0.0 –1.9 –1.0 –1.1 0.21997 0.2 1.1 –1.5 0.9 0.2 0.9 –0.4 0.9 0.41998 0.0 1.5 –2.0 0.5 –0.4 –0.3 –2.2 1.3 0.61999 –0.9 –0.9 –1.2 0.7 –0.5 –2.9 –1.9 0.1 –1.02000 0.0 2.9 –0.4 1.0 0.0 3.5 –0.2 1.9 1.82001 –0.3 0.1 –2.0 0.1 0.1 –2.0 –2.6 0.7 0.02002 –0.1 –1.0 0.6 0.4 0.0 –0.1 –0.8 0.6 0.1
Descriptive statistics: 1972–2002Average 0.0 2.3 0.3 0.5 0.1 3.3 1.1 1.5 0.7Std deviation 0.3 2.9 1.6 0.2 0.3 4.0 2.3 1.8 1.0Range b 1.4 10.1 6.4 0.9 1.1 14.3 9.0 8.1 4.1– maximum 0.5 6.9 3.8 1.0 0.6 10.7 6.4 4.5 2.7– minimum –0.9 –3.2 –2.7 0.0 –0.5 –3.5 –2.6 –3.6 –1.4% years < 0 c 42 23 39 0 35 26 39 16 23Correlation d 0.4 0.9 0.7 0.4 0.3 1.0 0.8 0.8 0.7

238 Energy security in APEC
58 Decomposition of annual growth in TFEC by fuel type and end use sector Russian Federation Percentage point contributions
By fuel type Total By end use sector fi nal Elec- energy con- In- Trans Coal Oil Gas tricty Other sumption dustry port Other a
% pt % pt % pt % pt % pt % % pt % pt % pt
1972 – – – – – – – – –1973 – – – – – – – – –1974 – – – – – – – – –1975 – – – – – – – – –1976 – – – – – – – – –1977 – – – – – – – – –1978 – – – – – – – – –1979 – – – – – – – – –1980 – – – – – – – – –1981 – – – – – – – – –1982 – – – – – – – – –1983 – – – – – – – – –1984 – – – – – – – – –1985 – – – – – – – – –1986 – – – – – – – – –1987 – – – – – – – – –1988 – – – – – – – – –1989 – – – – – – – – –1990 – – – – – – – – –1991 – – – – – – – – –1992 – – – – – – – – –1993 0.1 –3.5 1.0 –0.7 –0.5 –3.7 15.0 –3.0 –15.71994 –1.1 –4.8 –3.1 –1.1 –4.0 –14.1 –8.0 –2.0 –4.01995 0.8 –0.6 –1.3 –0.3 –2.9 –4.3 –0.5 –1.3 –2.41996 –1.1 –1.1 –0.9 –0.3 –6.4 –9.8 –5.1 –0.8 –3.91997 –1.0 –0.1 –1.3 –0.2 –1.6 –4.2 –1.0 –1.4 –1.71998 –0.1 –2.1 0.8 –0.2 –0.4 –2.1 –2.6 2.7 –2.21999 0.5 2.0 0.7 0.3 0.4 3.9 1.5 0.2 2.22000 0.3 2.3 0.6 0.3 0.0 3.4 3.6 –0.9 0.72001 0.2 0.3 0.0 0.2 –0.1 0.6 –0.3 0.6 0.32002 –0.3 –0.9 –0.4 0.0 –1.5 –3.0 –0.6 0.5 –2.9
Descriptive statistics: 1993–2002Average –0.2 –0.9 –0.4 –0.2 –1.7 –3.3 0.2 –0.6 –3.0Std deviation 0.7 2.2 1.3 0.4 2.2 5.5 6.1 1.6 4.9Range b 1.9 7.0 4.1 1.4 6.8 18.0 23.1 5.6 17.9– maximum 0.8 2.3 1.0 0.3 0.4 3.9 15.0 2.7 2.2– minimum –1.1 –4.8 –3.1 –1.1 –6.4 –14.1 –8.0 –3.0 –15.7% years < 0 c 50 70 50 60 90 70 70 60 70Correlation d 0.7 0.8 0.8 0.9 0.8 1.0 0.5 0.4 0.4

Energy security in APEC 239
59 Decomposition of annual growth in TFEC by fuel type and end use sector Thailand Percentage point contributions
By fuel type Total By end use sector fi nal Elec- energy con- In- Trans Coal Oil Gas tricty Other sumption dustry port Other a
% pt % pt % pt % pt % pt % % pt % pt % pt
1972 –0.1 6.4 0.0 0.7 0.9 7.9 1.5 4.6 1.81973 0.1 5.9 0.0 0.8 1.2 7.9 1.2 3.5 3.21974 0.1 –2.0 0.0 0.3 4.1 2.5 1.3 –3.0 4.21975 –0.1 2.5 0.0 0.7 10.0 13.1 –3.5 2.1 14.51976 0.1 5.2 0.0 0.7 2.2 8.1 4.0 3.3 0.81977 0.1 1.7 0.0 0.8 1.9 4.6 2.5 0.7 1.31978 0.1 2.5 0.0 0.8 –2.1 1.3 –1.0 1.2 1.11979 0.1 4.4 0.0 0.6 2.9 8.0 4.7 2.2 1.11980 0.1 –1.8 0.0 0.4 –2.9 –4.2 –2.6 –0.7 –0.91981 0.0 0.0 0.0 0.3 3.2 3.4 2.4 0.8 0.21982 0.7 –0.6 0.0 0.6 3.1 3.8 2.3 0.2 1.31983 0.0 4.5 0.2 0.9 –13.0 –7.4 –0.2 4.0 –11.21984 0.3 4.7 0.9 1.0 3.3 10.2 2.4 4.5 3.31985 0.8 0.8 –0.1 0.7 4.4 6.5 1.6 1.6 3.31986 0.4 3.0 –0.4 0.9 2.4 6.2 0.4 2.0 3.81987 0.9 5.4 –0.2 1.2 1.3 8.7 1.6 4.6 2.51988 0.7 6.7 0.1 1.4 1.2 10.2 2.1 5.1 3.01989 1.2 9.3 0.2 1.7 5.3 17.6 7.1 6.5 4.01990 0.9 6.9 0.5 1.7 0.6 10.6 3.3 4.2 3.01991 0.7 1.9 0.3 1.4 1.3 5.7 2.7 0.9 2.01992 0.5 5.6 0.2 1.6 1.4 9.3 5.0 3.1 1.31993 2.3 5.6 0.1 1.7 –3.2 6.4 2.0 4.9 –0.51994 1.5 6.7 0.2 1.4 –0.7 9.1 5.7 4.2 –0.81995 1.4 7.4 0.4 1.8 1.1 12.1 5.9 5.9 0.31996 1.7 6.7 0.3 1.1 0.1 10.0 5.5 3.3 1.21997 –0.9 0.9 0.0 0.9 0.4 1.2 –2.0 0.2 3.01998 –1.5 –5.2 –0.1 –0.3 –1.4 –8.5 –4.6 –3.8 0.01999 1.1 3.1 0.5 0.2 0.9 5.8 5.4 –0.1 0.52000 –0.6 1.2 0.5 1.1 0.5 2.7 2.1 –0.4 1.12001 1.4 2.5 0.3 0.7 –1.3 3.6 1.4 1.1 1.12002 1.5 2.1 0.3 1.3 1.1 6.3 3.8 1.7 0.9
Descriptive statistics: 1972–2002Average 0.5 3.4 0.1 0.9 1.0 5.9 2.1 2.2 1.6Std deviation 0.8 3.2 0.3 0.5 3.6 5.5 2.8 2.5 3.6Range b 3.7 14.4 1.4 2.2 23.0 26.1 11.7 10.3 25.7– maximum 2.3 9.3 0.9 1.8 10.0 17.6 7.1 6.5 14.5– minimum –1.5 –5.2 –0.4 –0.3 –13.0 –8.5 –4.6 –3.8 –11.2% years < 0 c 19 16 13 3 23 10 19 16 16Correlation d 0.5 0.7 0.3 0.6 0.6 1.0 0.6 0.7 0.6

240 Energy security in APEC
60 Decomposition of annual growth in TFEC by fuel type and end use sector Peru Percentage point contributions
By fuel type Total By end use sector fi nal Elec- energy con- In- Trans Coal Oil Gas tricty Other sumption dustry port Other a
% pt % pt % pt % pt % pt % % pt % pt % pt
1972 –0.2 –0.5 0.0 0.4 0.4 0.1 1.1 1.6 –2.61973 0.3 2.8 0.0 0.2 0.5 3.8 1.4 2.8 –0.31974 –0.1 4.9 0.0 0.4 0.5 5.7 1.1 –0.4 5.01975 0.0 2.8 0.3 0.3 –1.0 2.4 3.1 1.5 –2.21976 –0.1 0.7 0.0 0.3 0.3 1.2 0.2 –0.6 1.51977 0.0 –2.7 0.1 0.6 0.4 –1.6 0.2 –1.5 –0.21978 0.0 –0.6 0.0 0.1 0.1 –0.5 –0.1 –1.1 0.61979 0.0 2.0 –0.1 0.4 –0.1 2.2 1.4 0.8 0.11980 0.1 2.7 0.0 0.6 –0.3 3.0 0.6 2.2 0.31981 0.2 3.5 0.0 0.6 0.3 4.7 0.3 2.7 1.71982 –0.1 –1.1 0.1 0.6 1.1 0.5 –0.7 –0.6 1.81983 0.0 –8.3 –0.4 –0.4 0.4 –8.7 –3.4 –2.0 –3.21984 –0.1 1.0 0.6 0.9 0.4 2.8 0.7 0.1 2.01985 0.4 –1.2 –0.1 0.1 –0.2 –0.9 1.0 –1.6 –0.41986 0.1 4.1 0.0 0.6 –2.6 2.1 –0.5 1.5 1.11987 –0.1 6.1 –0.2 0.6 –2.1 4.3 1.0 3.5 –0.21988 0.1 0.1 0.1 –0.5 –2.0 –2.2 –2.2 0.1 –0.11989 0.1 –6.9 –0.1 –0.6 –1.4 –9.0 –3.1 –2.5 –3.31990 –0.3 0.1 –0.1 1.0 –1.0 –0.2 0.1 1.6 –1.91991 1.1 –1.7 0.0 0.9 –1.1 –1.0 1.4 –3.1 0.71992 1.1 0.2 –0.4 –2.1 –1.0 –2.2 –3.5 1.8 –0.61993 –0.1 3.2 –0.2 1.4 –1.1 3.1 2.6 0.8 –0.21994 0.1 4.3 0.0 0.5 –0.5 4.3 –1.0 4.0 1.31995 0.0 8.3 0.0 0.5 –0.3 8.3 3.8 2.7 1.81996 0.2 3.5 0.0 1.0 –0.4 4.4 2.1 2.0 0.31997 0.1 –0.7 0.0 0.6 –0.1 –0.1 0.0 –0.1 0.01998 0.4 –1.6 0.0 0.9 0.0 –0.2 1.3 0.5 –2.01999 –0.1 7.7 0.0 0.5 –0.2 7.8 4.3 1.8 1.72000 0.8 –2.9 0.0 0.6 0.0 –1.4 0.4 –0.9 –1.02001 –0.5 –3.8 0.0 0.7 0.2 –3.3 –1.6 –1.7 0.02002 0.8 –0.1 0.0 0.9 0.0 1.6 1.9 –1.9 1.6
Descriptive statistics: 1972–2002Average 0.1 0.8 0.0 0.4 –0.4 1.0 0.4 0.5 0.1Std deviation 0.4 3.7 0.2 0.6 0.9 3.9 1.9 1.9 1.7Range b 1.6 16.6 1.1 3.5 3.7 17.3 7.7 7.1 8.3– maximum 1.1 8.3 0.6 1.4 1.1 8.3 4.3 4.0 5.0– minimum –0.5 –8.3 –0.4 –2.1 –2.6 –9.0 –3.5 –3.1 –3.3% years < 0 c 39 42 52 13 58 42 29 42 48Correlation d –0.2 1.0 0.3 0.4 0.1 1.0 0.8 0.7 0.7

Energy security in APEC 241
61 Decomposition of annual growth in TFEC by fuel type and end use sector China Percentage point contributions
By fuel type Total By end use sector fi nal Elec- energy con- In- Trans Coal Oil Gas tricty Other sumption dustry port Other a
% pt % pt % pt % pt % pt % % pt % pt % pt
1972 4.0 1.8 0.2 0.5 0.0 6.6 3.3 0.8 2.51973 1.1 1.9 0.2 0.5 0.0 3.7 1.5 0.7 1.51974 –0.7 4.0 0.3 0.1 0.0 3.6 2.3 0.8 0.51975 12.6 1.4 0.4 0.9 0.0 15.3 8.7 0.9 5.71976 1.0 3.2 0.2 0.2 0.0 4.5 3.7 0.2 0.71977 9.3 2.9 0.4 0.6 0.0 13.1 7.9 0.9 4.41978 6.0 2.3 0.4 0.8 0.0 9.5 5.5 0.7 3.31979 1.3 –1.6 0.1 0.6 0.0 0.4 –1.2 0.3 1.31980 –1.1 –3.4 0.0 0.4 2.3 –1.7 3.6 –0.3 –5.11981 0.6 –1.1 –0.1 0.2 0.1 –0.3 –1.7 0.0 1.31982 3.8 0.2 –0.1 0.5 0.0 4.5 3.0 0.5 1.01983 4.0 0.7 0.0 0.6 0.1 5.4 3.4 0.5 1.51984 6.9 1.0 0.1 0.5 0.1 8.7 5.5 0.6 2.61985 2.3 0.3 0.6 –0.1 0.2 3.3 –0.9 0.3 3.81986 3.0 1.5 0.2 0.6 0.2 5.5 2.8 0.6 2.11987 4.4 1.4 0.0 0.8 0.3 6.9 4.2 0.5 2.21988 4.2 1.3 0.2 0.7 0.0 6.5 3.6 0.5 2.31989 –0.4 0.6 0.2 0.5 0.3 1.1 0.5 0.3 0.31990 1.9 0.0 0.1 0.8 0.1 2.9 1.6 –0.4 1.71991 1.3 1.8 0.0 0.8 0.3 4.1 3.0 0.7 0.31992 0.9 1.2 –0.1 1.0 0.2 3.2 3.0 0.6 –0.31993 0.5 1.8 0.1 1.0 0.5 3.9 2.3 1.2 0.51994 2.1 0.9 0.1 1.2 38.7 43.1 5.2 –0.6 38.51995 1.5 1.5 0.0 0.5 –0.3 3.2 2.4 0.5 0.31996 1.5 1.9 0.0 0.7 0.4 4.6 2.6 0.3 1.71997 –7.0 1.4 0.0 0.3 0.1 –5.1 –4.9 0.7 –1.01998 –1.4 0.8 0.2 0.4 0.2 0.2 1.4 0.7 –2.01999 –5.9 1.3 0.1 0.6 0.5 –3.4 –4.9 0.6 1.02000 –2.5 1.5 0.2 1.1 0.5 0.8 –0.6 0.6 0.82001 –0.7 0.6 0.3 1.0 0.4 1.6 0.3 0.2 1.02002 0.2 1.7 0.2 1.4 0.6 4.1 2.2 0.6 1.3
Descriptive statistics: 1972–2002Average 1.8 1.1 0.2 0.6 1.5 5.1 2.2 0.5 2.4Std deviation 3.8 1.4 0.2 0.3 6.9 8.2 3.0 0.4 7.0Range b 19.6 7.4 0.8 1.5 39.0 48.2 13.6 1.7 43.5– maximum 12.6 4.0 0.6 1.4 38.7 43.1 8.7 1.2 38.5– minimum –7.0 –3.4 –0.1 –0.1 –0.3 –5.1 –4.9 –0.6 –5.1% years < 0 c 26 10 10 3 13 13 19 10 13Correlation d 0.5 0.2 0.2 0.4 0.8 1.0 0.6 –0.3 0.9
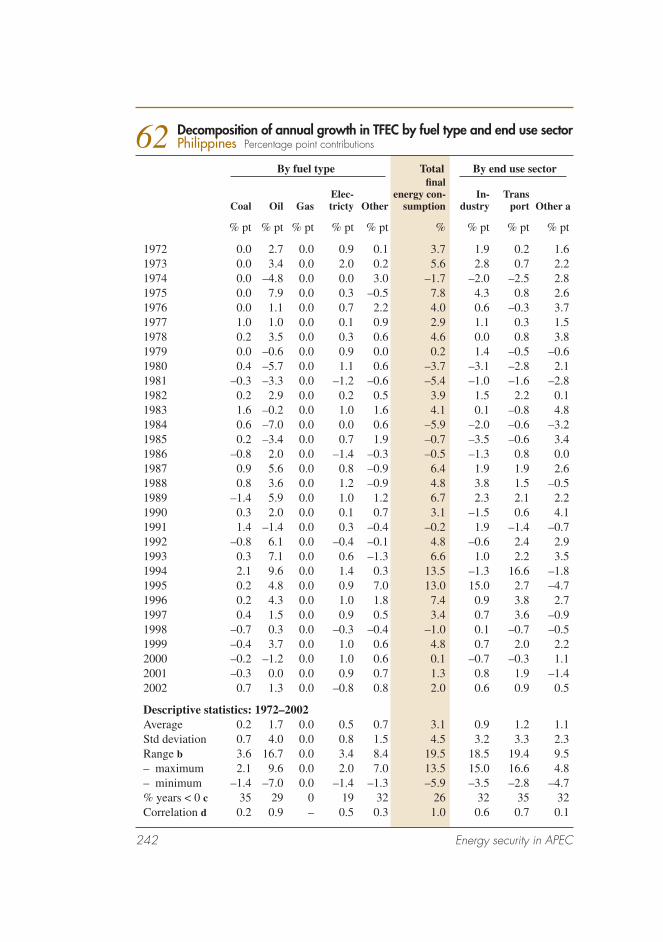
242 Energy security in APEC
62 Decomposition of annual growth in TFEC by fuel type and end use sector Philippines Percentage point contributions
By fuel type Total By end use sector fi nal Elec- energy con- In- Trans Coal Oil Gas tricty Other sumption dustry port Other a
% pt % pt % pt % pt % pt % % pt % pt % pt
1972 0.0 2.7 0.0 0.9 0.1 3.7 1.9 0.2 1.61973 0.0 3.4 0.0 2.0 0.2 5.6 2.8 0.7 2.21974 0.0 –4.8 0.0 0.0 3.0 –1.7 –2.0 –2.5 2.81975 0.0 7.9 0.0 0.3 –0.5 7.8 4.3 0.8 2.61976 0.0 1.1 0.0 0.7 2.2 4.0 0.6 –0.3 3.71977 1.0 1.0 0.0 0.1 0.9 2.9 1.1 0.3 1.51978 0.2 3.5 0.0 0.3 0.6 4.6 0.0 0.8 3.81979 0.0 –0.6 0.0 0.9 0.0 0.2 1.4 –0.5 –0.61980 0.4 –5.7 0.0 1.1 0.6 –3.7 –3.1 –2.8 2.11981 –0.3 –3.3 0.0 –1.2 –0.6 –5.4 –1.0 –1.6 –2.81982 0.2 2.9 0.0 0.2 0.5 3.9 1.5 2.2 0.11983 1.6 –0.2 0.0 1.0 1.6 4.1 0.1 –0.8 4.81984 0.6 –7.0 0.0 0.0 0.6 –5.9 –2.0 –0.6 –3.21985 0.2 –3.4 0.0 0.7 1.9 –0.7 –3.5 –0.6 3.41986 –0.8 2.0 0.0 –1.4 –0.3 –0.5 –1.3 0.8 0.01987 0.9 5.6 0.0 0.8 –0.9 6.4 1.9 1.9 2.61988 0.8 3.6 0.0 1.2 –0.9 4.8 3.8 1.5 –0.51989 –1.4 5.9 0.0 1.0 1.2 6.7 2.3 2.1 2.21990 0.3 2.0 0.0 0.1 0.7 3.1 –1.5 0.6 4.11991 1.4 –1.4 0.0 0.3 –0.4 –0.2 1.9 –1.4 –0.71992 –0.8 6.1 0.0 –0.4 –0.1 4.8 –0.6 2.4 2.91993 0.3 7.1 0.0 0.6 –1.3 6.6 1.0 2.2 3.51994 2.1 9.6 0.0 1.4 0.3 13.5 –1.3 16.6 –1.81995 0.2 4.8 0.0 0.9 7.0 13.0 15.0 2.7 –4.71996 0.2 4.3 0.0 1.0 1.8 7.4 0.9 3.8 2.71997 0.4 1.5 0.0 0.9 0.5 3.4 0.7 3.6 –0.91998 –0.7 0.3 0.0 –0.3 –0.4 –1.0 0.1 –0.7 –0.51999 –0.4 3.7 0.0 1.0 0.6 4.8 0.7 2.0 2.22000 –0.2 –1.2 0.0 1.0 0.6 0.1 –0.7 –0.3 1.12001 –0.3 0.0 0.0 0.9 0.7 1.3 0.8 1.9 –1.42002 0.7 1.3 0.0 –0.8 0.8 2.0 0.6 0.9 0.5
Descriptive statistics: 1972–2002Average 0.2 1.7 0.0 0.5 0.7 3.1 0.9 1.2 1.1Std deviation 0.7 4.0 0.0 0.8 1.5 4.5 3.2 3.3 2.3Range b 3.6 16.7 0.0 3.4 8.4 19.5 18.5 19.4 9.5– maximum 2.1 9.6 0.0 2.0 7.0 13.5 15.0 16.6 4.8– minimum –1.4 –7.0 0.0 –1.4 –1.3 –5.9 –3.5 –2.8 –4.7% years < 0 c 35 29 0 19 32 26 32 35 32Correlation d 0.2 0.9 – 0.5 0.3 1.0 0.6 0.7 0.1

Energy security in APEC 243
63 Decomposition of annual growth in TFEC by fuel type and end use sector Indonesia Percentage point contributions
By fuel type Total By end use sector fi nal Elec- energy con- In- Trans Coal Oil Gas tricty Other sumption dustry port Other a
% pt % pt % pt % pt % pt % % pt % pt % pt
1972 0.0 2.3 0.1 0.0 1.1 3.5 0.4 0.7 2.41973 –0.1 1.9 0.0 0.0 1.1 2.9 0.4 0.6 2.01974 0.1 3.1 0.3 0.1 0.8 4.4 0.8 1.4 2.11975 0.1 3.9 0.3 0.1 1.4 5.8 1.8 1.1 2.91976 –0.1 1.9 0.1 0.1 1.2 3.2 0.3 0.8 2.11977 0.0 3.7 1.5 0.1 1.3 6.5 3.0 0.9 2.61978 0.0 4.6 1.2 0.1 1.2 7.2 3.3 1.4 2.51979 0.0 3.7 1.2 0.2 1.1 6.2 2.6 0.8 2.81980 0.1 4.4 1.1 0.2 1.0 6.7 2.9 1.6 2.21981 0.0 2.8 0.6 0.2 1.1 4.6 1.3 1.2 2.01982 0.0 0.7 0.0 0.2 1.0 2.0 0.1 0.7 1.21983 0.0 –0.8 1.0 0.2 1.0 1.4 1.2 –0.5 0.71984 0.0 –1.6 1.1 0.2 1.0 0.6 –0.1 0.2 0.51985 0.2 1.1 2.1 0.2 0.9 4.5 3.2 0.4 0.91986 0.0 0.0 1.0 0.3 0.9 2.2 0.3 0.8 1.11987 0.0 1.2 0.3 0.3 0.9 2.8 0.4 1.4 1.01988 0.2 3.1 0.2 0.4 0.9 4.9 1.4 1.2 2.31989 0.4 2.8 –0.9 0.5 0.8 3.7 –0.4 1.3 2.71990 0.0 4.1 0.2 0.6 3.4 8.3 3.7 2.3 2.31991 0.1 1.8 0.7 0.5 0.8 3.9 1.2 1.3 1.41992 0.0 2.6 1.1 0.4 0.8 4.9 1.1 1.3 2.51993 0.1 2.9 0.7 0.4 0.8 4.9 1.9 1.3 1.71994 0.7 3.5 –0.1 0.6 0.6 5.3 1.4 2.3 1.61995 0.2 2.8 1.1 0.7 0.5 5.2 2.5 1.4 1.41996 –0.2 3.5 0.4 0.7 0.3 4.8 0.7 2.2 1.91997 0.8 2.1 0.2 0.7 1.1 5.0 1.0 2.3 1.71998 0.9 –0.7 0.3 0.1 0.5 1.1 0.5 –0.3 0.91999 0.6 2.5 2.3 0.5 0.5 6.4 4.3 –0.4 2.52000 1.9 3.6 1.1 0.7 0.2 7.4 3.7 1.8 1.92001 –0.1 1.4 –0.7 0.4 0.5 1.5 –0.6 1.2 0.92002 0.3 –0.4 1.5 0.2 1.1 2.7 1.8 0.1 0.8
Descriptive statistics: 1972–2002Average 0.2 2.2 0.6 0.3 1.0 4.3 1.5 1.1 1.8Std deviation 0.4 1.6 0.7 0.2 0.5 2.0 1.3 0.7 0.7Range b 2.1 6.2 3.2 0.7 3.2 7.6 4.8 2.8 2.4– maximum 1.9 4.6 2.3 0.7 3.4 8.3 4.3 2.3 2.9– minimum –0.2 –1.6 –0.9 0.0 0.2 0.6 –0.6 –0.5 0.5% years < 0 c 32 13 10 0 0 0 10 10 0Correlation d 0.2 0.9 0.3 0.4 0.3 1.0 0.8 0.5 0.7

244 Energy security in APEC
64 Decomposition of annual growth in TFEC by fuel type and end use sector Viet Nam Percentage point contributions
By fuel type Total By end use sector fi nal Elec- energy con- In- Trans Coal Oil Gas tricty Other sumption dustry port Other a
% pt % pt % pt % pt % pt % % pt % pt % pt
1972 –5.5 1.3 0.0 –0.1 0.0 –4.3 –0.1 –2.6 –1.71973 6.5 –1.8 0.0 0.2 0.0 4.9 0.0 –1.3 6.21974 5.5 –35.5 0.0 –0.3 0.0 –30.3 0.0 –18.3 –12.01975 13.2 –4.6 0.0 0.5 0.0 9.1 0.1 –2.2 11.21976 –5.4 –45.0 0.0 0.7 0.0 –49.7 0.2 –26.6 –23.31977 4.1 1.3 0.0 1.3 0.0 6.7 –0.3 –3.6 10.51978 –2.5 6.8 0.0 0.3 0.0 4.6 0.1 0.9 3.61979 5.1 4.6 0.0 0.0 0.0 9.8 –0.3 1.2 8.81980 –13.0 17.7 0.0 –0.3 0.0 4.4 46.4 12.8 –54.81981 7.0 –7.7 0.0 0.2 0.0 –0.4 –0.7 –3.5 3.81982 7.0 –0.3 0.0 0.5 –0.1 7.1 4.3 0.6 2.21983 –1.8 5.8 0.0 0.3 0.0 4.3 6.5 1.7 –3.81984 –2.7 –0.8 0.0 1.2 0.0 –2.4 5.5 –0.4 –7.51985 –0.5 –0.4 0.0 0.6 0.0 –0.3 –1.9 9.7 –8.11986 4.7 5.3 0.0 0.7 0.0 10.7 4.9 3.1 2.71987 5.0 7.2 0.0 1.0 0.0 13.1 4.7 4.1 4.21988 –12.1 1.3 0.0 0.8 0.0 –10.0 –10.5 2.1 –1.61989 –3.3 –2.0 0.0 1.4 0.0 –3.9 –2.0 –2.6 0.71990 –3.9 8.5 0.0 1.1 0.0 5.7 –2.5 4.7 3.41991 6.5 –1.7 0.2 0.8 0.0 5.9 4.1 –1.8 3.61992 3.8 9.5 0.1 0.7 0.0 14.0 3.2 3.8 7.11993 0.3 19.0 0.0 1.5 0.0 20.8 3.1 16.3 1.41994 0.7 6.3 0.0 2.0 324.6 333.6 1.5 3.9 328.21995 2.9 1.0 0.0 0.6 1.2 5.8 3.1 –0.2 2.91996 0.3 2.3 0.0 0.7 3.4 6.6 0.9 0.9 4.81997 2.1 0.1 0.0 0.6 1.4 4.1 2.0 0.7 1.41998 –0.1 1.7 0.0 0.7 1.5 3.8 0.7 0.6 2.51999 –0.4 2.1 0.0 0.5 –1.6 0.5 0.4 0.9 –0.72000 0.2 1.7 0.0 0.8 0.9 3.4 1.1 0.9 1.42001 1.5 2.0 0.0 0.8 0.8 5.3 1.8 0.9 2.62002 0.8 3.7 0.0 1.0 0.8 6.3 2.1 2.5 1.7
Descriptive statistics: 1972–2002Average 0.8 0.3 0.0 0.7 10.7 12.6 2.5 0.3 9.7Std deviation 5.5 12.2 0.0 0.5 58.3 61.0 8.7 7.5 60.3Range b 26.3 64.0 0.2 2.3 326.3 383.3 56.9 42.8 383.0– maximum 13.2 19.0 0.2 2.0 324.6 333.6 46.4 16.3 328.2– minimum –13.0 –45.0 0.0 –0.3 –1.6 –49.7 –10.5 –26.6 –54.8% years < 0 c 39 32 19 10 29 26 26 35 29Correlation d 0.1 0.3 0.1 0.5 1.0 1.0 0.0 0.3 1.0

Energy security in APEC 245
appendix
impacts of oil supply disruption scenarios for nineteen APEC economiesDetailed GTEM simulation results for the oil supply disruptions in 2005 and 2020 are reported for nineteen APEC economies in tables 65 and 66 respectively. See chapter 6 for a discussion of the simulation results.
65 Impacts of 2005 oil supply disruption scenario, by APEC economy relative to the reference case
Primary energy consumption Real Electricity GNP Total Oil Gas Coal consumption
% % % % % %
Australia –0.3 –3.4 –15.0 –0.1 0.9 0.5
Canada 0.3 –2.9 –11.0 0.2 0.2 0.3
Japan –0.5 –2.8 –2.4 –7.0 0.1 0.1
New Zealand –0.7 –1.4 –7.7 0.8 1.2 0.6
United States –0.2 –2.3 –6.1 0.4 0.9 0.4
Hong Kong, China –0.3 –1.0 na 4.3 0.0 0.0
Republic of Korea –1.4 –2.4 –6.0 –8.7 1.1 1.2
Singapore –2.1 –4.6 –13.8 12.5 na 0.7
Chinese Taipei –0.7 –3.7 –6.8 –16.1 0.4 0.0
Chile –1.1 –2.1 –6.4 2.0 0.2 0.8
China –0.3 –0.2 –3.2 0.1 1.3 0.9
Indonesia 3.4 4.4 4.4 0.3 6.3 0.8
Malaysia 1.4 –2.5 –11.4 2.9 0.0 0.3
Mexico 0.9 –1.5 –8.1 6.7 2.8 –2.5
Peru 0.1 –21.7 –12.0 0.0 –0.2 –1.0
Philippines –1.6 0.4 –4.9 –14.1 0.1 –0.7
Russian Federation 1.6 –6.4 –20.7 –0.8 –2.5 –2.1
Thailand –1.1 –2.7 –7.2 1.1 0.6 0.5
Viet Nam 2.4 –3.9 na 0.9 –0.6 1.2
na Not available.
D

246 Energy security in APEC
66 Impacts of 2020 oil supply disruption scenario, by APEC economy relative to the reference case
Primary energy consumption Real Electricity GNP Total Oil Gas Coal consumption
% % % % % %
Australia –0.3 –2.1 –11.3 0.8 0.9 0.8
Canada 0.1 –2.2 –8.6 0.1 0.4 0.4
Japan –0.4 –2.8 –2.3 –5.8 0.0 0.1
New Zealand –0.5 –1.4 –7.3 0.7 1.0 0.5
United States –0.2 –3.0 –8.1 0.3 1.0 0.5
Hong Kong, China 0.2 –0.8 na 4.2 0.0 0.3
Republic of Korea –1.0 –2.2 –5.4 –8.2 0.7 1.2
Singapore –1.8 –4.9 –10.8 6.7 na 1.0
Chinese Taipei –0.6 –4.6 –6.6 –15.0 0.4 –0.3
Chile –1.2 –1.8 –6.6 2.0 0.3 1.2
China –0.4 –1.6 –10.7 1.0 1.2 0.7
Indonesia 1.8 0.0 –3.1 1.0 3.1 1.1
Malaysia 0.3 –3.8 –11.2 0.4 0.0 0.7
Mexico 0.3 –1.4 –7.1 4.2 1.3 –1.6
Peru –0.9 –9.4 –14.8 2.8 0.1 0.1
Philippines –1.5 1.1 –1.2 –13.4 0.1 –0.5
Russian Federation 0.9 –6.4 –20.6 –0.7 –2.1 –1.5
Thailand –1.1 –3.0 –7.4 0.5 0.3 0.2
Viet Nam 0.7 –4.1 na 1.1 –0.8 0.7
na Not available.

Energy security in APEC 247
references
ABARE 2004, Australian Commodity Statistics 2004, Canberra.
ABS (Australian Bureau of Statistics) 2004a, Research and Experimen-tal Development: Government and Non-profi t Organisations, Australia, 2002-03, cat. no. 8109.0, Canberra.
—— 2004b, Research and Experimental Development: Businesses Austra-lia, 2002-03, cat. no. 8104.0, Canberra.
ANRE (Agency for Natural Resources and Energy, Ministry of Economy, Trade and Industry, Japan) 2002a, Necessary measures for reaching tar-geted levels of energy supply and demand, Tokyo (www.enecho.meti.gov.jp/english/policy/policy/measures.html).
—— 2002b, Concrete measures and future concerns, Tokyo (www.enecho.meti.go.jp/english/policy/oil/future_concerns.html).
APEC 2002, APEC Energy Security Initiative: Recommendations Endorsed by the Fifth Meeting of APEC Energy Ministers, Mexico City, 23 July (www.apecenergy.org.au).
—— 2003a, Energy Security Initiative Implementation Plan, Prepared by the APEC Energy Working Group for the Third APEC Senior Offi cials’ Meeting, 14–23 August (www.apecenergy.org.au).
—— 2003b, APEC Action Plan to Enhance Energy Security in APEC, Sub-mitted by the United States for consideration at the Concluding Senior Offi cials’ Meeting, Bangkok, Thailand, 14–15 October (www.apecen-ergy.org.au).
—— 2004a, ‘Declaration’, Sixth Meeting of APEC Energy Ministers on Energy Security in APEC: Cooperation for a Sustainable Future, Manila, the Philippines, 10 June (www.apecenergy.org.au).

248 Energy security in APEC
—— 2004b, ‘Report to Ministers by the Lead Shepherd of the APEC Energy Working Group’, Sixth Meeting of APEC Energy Ministers on ‘Energy Security in APEC: Cooperation for a Sustainable Future’, Manila, the Philippines, 10 June (www.apecenergy.org.au).
—— 2004c, ‘Best practice principles for the establishment and manage-ment of strategic oil stocks’, Annex 5, Sixth Meeting of APEC Energy Ministers on Energy Security in APEC: Cooperation for a Sustainable Future, Manila, the Philippines, 10 June (www.apecenergy.org.au).
—— 2004d, Comprehensive Action Initiative Recognising the Need for Strengthening the APEC Energy Security Initiative – Energy Security, Sustainable Development and Common Prosperity (CAIRNS), 28th Meet-ing of the APEC Energy Working Group, Port Douglas, Australia, 3–4 November (www.apecenergy.org.au).
—— 2005, ‘Third report on implementation of the Energy Security Initia-tive’, Attachment B, Prepared by the EWG Secretariat for the 29th Meet-ing of the Energy Working Group, Hanoi, Viet Nam, 16–17 March.
APERC (Asia Pacifi c Energy Research Centre) 2000, Emergency Oil Stocks and Energy Security in the APEC Region, Tokyo, March.
—— 2002a, Energy Security Initiative: Emergency Oil Stocks as an Option to Respond to Oil Supply Disruptions, Tokyo.
—— 2002b, Energy Demand and Supply Outlook 2002, Tokyo.
—— 2003, Energy Security Initiative: Some Aspects of Oil Security, Tokyo.
ASCOPE (ASEAN Council on Petroleum) 2004, ‘The current status of the ASEAN Petroleum Security Agreement (APSA): the coordinated emer-gency response measures (CERM) and associated interim steps’, 2nd IEA/ASEAN/ASCOPE Workshop on ‘Oil Security Disruption Management Issues’, Siem Reap, Kingdom of Cambodia, 5 April (www.iea.org).
Ball, A., Schneider, K., Mélanie, J., Curtotti, R., Changwon Park, Jaesung Kang and Jaekyu Lim 2003, LNG in Korea: Opportunities for Growth, ABARE and Korean Energy Economics Institute, ABARE Research Report 03.4, Canberra, August.

Energy security in APEC 249
Ball, A., Schneider, K., Fairhead, L. and Short, C. 2004, The Asia Pacifi c LNG Market: Issues and Outlook, ABARE Research Report 04.1, Can-berra, November.
Bielecki, J. 2002, ‘Energy security: is the wolf at the door?’, Quarterly Review of Economics and Finance, vol. 42, no. 2, pp. 235–50.
Bohi, D.R. 1993, ‘Searching for consensus on energy security policy’, in H.H. Landsberg (ed.), Making National Energy Policy, Resources for the Future, Washington DC, pp. 41–59.
Borenstein, S. 2002, ‘The trouble with electricity markets: understanding California’s restructuring disaster’, Journal of Economic Perspectives, vol. 16, no. 1, pp. 191–211.
BP 2004, BP Statistical Review of World Energy 2004, London, June (www.bp.com/statisticalreview2004).
Brennan, M.J. 1958, ‘The supply of storage’, American Economic Review, vol. 48, pp. 50–72.
Cleveland, C.J. and Kaufmann, R.K. 2003, ‘Oil supply and oil politics: déjà vu all over again’, Energy Policy, vol. 31, no. 6, pp. 485–9.
Doh, H.J. 2001, ‘Shutdown of Indonesian gas fi elds and its impact on Korean LNG supply’, Korea Energy Review Monthly, Korean Energy Economics Institute, Seoul, March, pp. 23–6.
EIA (Energy Information Agency, US Department of Energy) 1990, An Analysis of Increasing the Size of the Strategic Petroleum Reserve to One Billion Barrels, EIA Service Report, Washington DC.
—— 2003, South Korea Country Analysis Brief, Washington DC, Decem-ber (www.eia.doe.gov/cabs/skorea.html).
—— 2004a, World Oil Transit Chokepoints, Washington DC, April (www.eia.doe.gov/cabs/choke.html).
—— 2004b, Indonesia Country Analysis Brief, Washington DC, July (www.eia.doe.gov/cabs/indonesia.html).

250 Energy security in APEC
—— 2004c, Mexico Country Analysis Brief, Washington DC, November (www.eia.doe.gov/cabs/mexico.html).
—— 2005, United States of America Country Analysis Brief, Washington DC, January (www.eia.doe.gov/cabs/usa.html).
Energy Economist 2004, ‘South Korea considers gas reform plans, but puts power privatisation on hold’, Energy Economist, issue 271, May, pp. 15–18.
Energy Policy and Planning Offi ce, Ministry of Energy, Thailand 2003, Energy Strategy: Energy for Thailand’s Competitiveness, Bangkok, November (www.eppo.go.th/doc/strategy2546/strategy.doc).
Facts Inc. 2003a, ‘Changing LNG market structure in Asia: the role of the Chinese buyers’, Gas Insights, no. 17, Singapore, February.
—— 2003b, China Energy Update: A Quarterly Briefi ng on Energy and Economic Developments in China, FACTS Inc., Singapore, November.
—— 2004, ‘Japan’s energy policy and energy security’, Facts Gas Advi-sory, no. 26, Singapore, December.
Fairhead, L., Mélanie, J., Holmes, L., Ye Qiang, Ahammad, H. and Sch-neider, K. 2002, Deregulating Energy Markets in APEC: Economic and Sectoral Impacts, APEC#202-RE-01.3, ABARE Research Report 02.5, Canberra.
Fujime, K. 2002, LNG Market and Price Formulation in East Asia, A Report, Institute of Energy Economics, Japan, April.
Heaney, A., Hester, S., Gurney, A., Fairhead, F., Beare, S., Mélanie, J. and Schneider, K. 2005, New Energy Technologies: Measuring Potential Impacts in APEC, ABARE Research Report 05.1, Canberra.
Heyhoe, E. and Levantis, T. 2003, Issues Arising from the Rationing of Petroleum Products, ABARE report for the Australian Government Department of Industry, Tourism and Resources, Canberra, July.

Energy security in APEC 251
Hogan, L. 2003a, Australia’s Petroleum Resource Rent Tax: An Economic Assessment of Fiscal Settings, ABARE eReport 03.1 Prepared for the Department of Industry, Tourism and Resources, Canberra, January (available free of charge on www.abare.gov.au).
—— 2003b, Public Geological Surveys in Australia, ABARE eReport 03.19 Prepared for the Department of Industry, Tourism and Resources, Canberra, August (available free of charge on www.abare.gov.au).
IEA (International Energy Agency, Organisation for economic Cooperation and Development) 2001, Oil Supply Security: The Emergency Response Potential of IEA Countries in 2000, Paris.
—— 2002, Energy Policies of IEA Countries, 2002 Review, Paris.
—— 2003, Electricity Information 2003, Paris.
—— 2004a, Energy Balances of OECD Countries, 2001-2002, Paris.
—— 2004b, Energy Balances of Non-OECD Countries, 2001-2002, Paris.
—— 2004c, World Energy Outlook, 2004, Paris.
IEEJ (Institute of Energy Economics, Japan) 2004, Handbook of Energy and Economic Statistics in Japan, Tokyo, February.
IMF (International Monetary Fund) 2004a, World Economic Outlook Data-base, Washington DC, September (www.imf.org).
—— 2004b, International Financial Statistics, Yearbook 2004, Washington DC.
JNOC (Japan National Oil Corporation) 2003, Crude Oil & LPG Stockpil-ing, Tokyo (www.jnoc.go.jp/english/stock/index.html).
Lowry, M.N. 1988, ‘Precautionary storage of refi nery products: the case of distillate fuel oil’, Energy Economics, vol. 10, no. 4, pp. 254–60.
Lynch, M.C. 1997, ‘The nature of energy security’, in International Associa-tion for Energy Economics, Energy and Economic Growth: Is Sustainable

252 Energy security in APEC
Growth Possible?, Proceedings of the 20th Annual International Confer-ence, vol. 3, Tata Energy Research Institute, New Delhi, pp. 857–66.
MOCIE (Ministry of Commerce, Industry and Energy, Republic of Korea) 2002, The Second National Energy Plan (2002~2011), Seoul.
Newbery, D.M.G. and Stiglitz, J.E. 1981, The Theory of Commodity Price Stabilization: A Study in the Economics of Risk, Clarendon Press, Oxford.
OPEC (Organization of the Petroleum Exporting Countries) 2002, General Information: Organization of the Petroleum Exporting Countries 2002, OPEC Secretariat, Vienna, Austria, August (www.opec.org).
Owen, A.D. 2004, ‘Oil supply insecurity: control versus damage costs’, Energy Policy, vol. 32, no. 16, pp. 1879–82.
People’s Republic of China 2001, 10th Five-Year National Economic and So-cial Development Plan of the People’s Republic of China, Beijing, March.
Rey, F.B. 1996, ‘On the use of oil stocks data for empirical research’, Jour-nal of Energy Literature, vol 11, no. 2, pp. 33–47.
Schneider, K., Graham, B., Millsteed, C., Saunders, M. and Stuart, R. 2000, Trade and Investment Liberalisation in APEC: Economic and Energy Sector Impacts, ABARE Research Report 2000.2, Canberra.
Williams, J.C. and Wright, B.D. 1991, Storage and Commodity Markets, Cambridge University Press, Cambridge.
Wolak, F.A. 2003, ‘Measuring unilateral market power in wholesale elec-tricity markets: the California market, 1998–2000’, American Economic Review, vol. 93, no. 2, pp. 425–30.
World Bank 2004, World Development Indicators 2004, Washington DC.
World Nuclear Association 2004, World Uranium Mining, London, June (www.world-nuclear.org).