

Energy Security and Climate Change: The Loop that Binds the World Conference on Climate Change and...
32
Energy Security and Climate Change: The Loop that Binds the World Conference on Climate Change and Security By RSIS and the Embassy of Switzerland in Singapore Youngho Chang S. Rajaratnam School of International Studies, Nanyang Technological University 11-12 October 2007 Traders Hotel, Singapore
Transcript of Energy Security and Climate Change: The Loop that Binds the World Conference on Climate Change and...

Energy Security and Climate Change:The Loop that Binds the World
Conference on Climate Change and SecurityBy RSIS and the Embassy of Switzerland in Singapore
Youngho ChangS. Rajaratnam School of International Studies,
Nanyang Technological University
11-12 October 2007Traders Hotel, Singapore

2
Agenda
• Introduction• Energy Security
– Definition– Determinants of Energy Supply– Ways of Ensuring Energy Security
• Technology and Energy Diversification Measures
• Economy, Energy, and Environment• Technology, Energy Security and Climate
Change• Concluding Remarks

3
Introduction• Energy security and climate change are a global
phenomenon• Inherent asymmetry of cost bearing in ensuring
efforts for energy security and mitigation efforts for climate change is a stumbling block for implementing an efficient, effective and equitable policy in a global scale to tackle both phenomena
• Is renewable energy (or technology) a way of ensuring energy security and of mitigating or halting climate change due to anthropogenic causes of atmospheric build-up of greenhouse gases?

4
What is Energy Security?
• Adequate and reliable supply of energy at a reasonable price– Adequacy is associated with production and
generation capacity– Reliability is associated with transportation
and transmission capability– A reasonable price is related with the cost of
supplying energy and affordability
• This definition could be extended to examine the status of energy security by computable measures

5
Energy Security Measures: Application to Electricity Market
Adequacy Reliability Price
Present (Normal)
Reserve Margin
SAIDI and SAIFI
Lerner Index
Present (Emergency)
SMA Feature Checklist
RSI
Future % Growth Investment
% Growth Investment
Policy Checklist

6
Factors of Determining Energy Supply
• Availability of resource– The stock of a resource must exist
• Applicability of technology– A technology that enables the supply of the
stock must exist
• Acceptability by society– The resource must be accepted by a society
• Environmental, social or political
• These factors could be applied to examine the perspectives on fossil fuels

7
Measures of Availability
• AV – 1 : Proved reserves replacement ratio (RRR) of each firm
• AV – 2 : Proved hydrocarbon reserves owned by each firm
• AV – 3 : Capital expenditure on exploration and production incurred by each firm

8
Measures of Applicability
• AP – 1 : Expenditure on research and development (R&D) invested by each firm
• AP – 2 : Number of alternative energy technologies employed in each of the firms’ production
• AP – 3 : Projected market share of renewables (excluding nuclear power) in the energy supply mix within the scenario horizon made by each firm

9
Measures of Acceptability
• AC – 1 : Expenditure on social development incurred by each firm
• AC – 2 : Amount of greenhouse gas (GHG) emissions per unit of hydrocarbons production of each firm
• AC – 3 : Percentage of major operations of each firm certified ISO 14001 (an internationally recognized environmental management standard)

10
The 3-A Triangle Grid
FIGURE 3.3. THE 3- A TRIANGLE GRID
Availability of resources
Applicability of technology
Isoline for Applicability of technology
Isoline for Availability of resources
Acceptability by society
Isoline for Acceptability by society

11
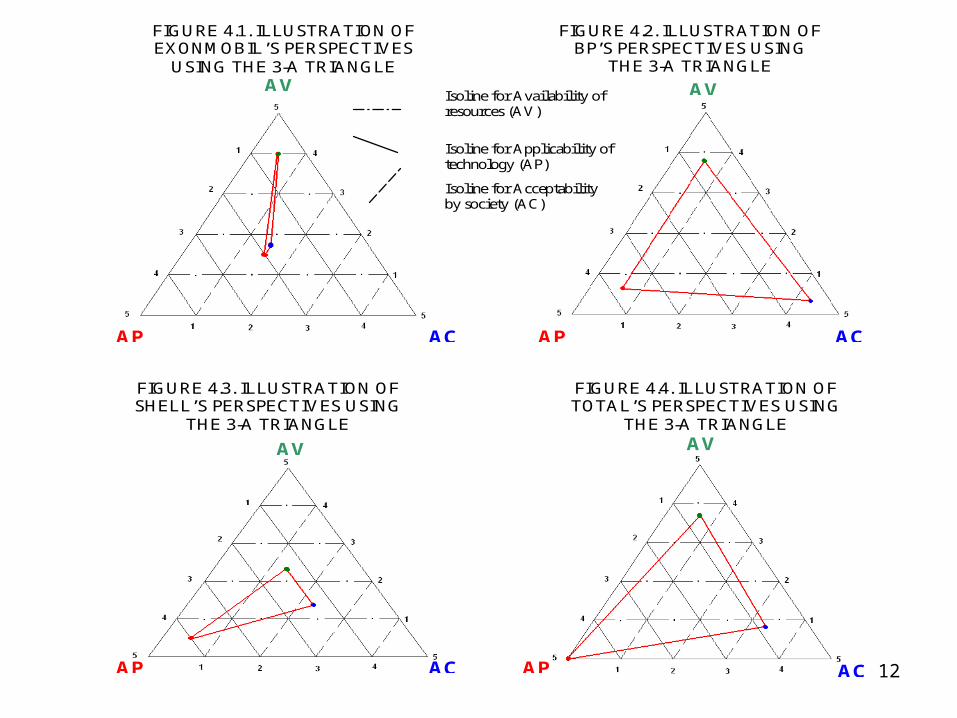
Application of the 3-A Triangle Grid
ExxonMobil BP Shell Total
AV-1 5 2 2 5
AV-2 5 4 3 3
AV-3 2 5 2 3
AVG 4 3.7 2.3 3.7
AP-1 2 2 3 5
AP-2 1 4 4 5
AP-3 3 5 5 5
AVG 2 3.7 4 5
AC-1 2 3 3 4
AC-2 1 5 1 3
AC-3 1 5 3 3
AVG 1.3 4.3 2.3 3.3
12
AV AV
AP AP AC AC
AV
AP AC AC AP
AV
FIGURE 4.1. ILLUSTRATION OF EXONMOBIL’S PERSPECTIVES
USING THE 3-A TRIANGLE
FIGURE 4.2. ILLUSTRATION OF BP’S PERSPECTIVES USING
THE 3-A TRIANGLE
FIGURE 4.3. ILLUSTRATION OF SHELL’S PERSPECTIVES USING
THE 3-A TRIANGLE
FIGURE 4.4. ILLUSTRATION OF TOTAL’S PERSPECTIVES USING
THE 3-A TRIANGLE
Isoline for Availability of resources (AV)
Isoline for Applicability of technology (AP)
Isoline for Acceptability by society (AC)

13
Ways of Ensuring Energy Security
• Supply side– Increase potential supply or economic resources
• Demand side– Improve energy efficiency– Encourage energy conservation
• Integration of energy market (in a regional scale)• Backstop technology
– An ultimate and abundant resource• Must be economically and technologically viable
– Act as a price ceiling on the resources currently in use– Renewable energy resources fit into this definition

14
Price Components• Conventional fuels
– Extraction, transportation and conversion cost• Resources need to be extracted, transported and processed
(or converted) to meet end-use criteria as a fuel or energy• Is supposed to be constant for the simplicity of analysis
– Scarcity rent (the implicit value reflecting the depletion of a resource)
• Is supposed to increase at an interest rate
• Backstop technology– No scarcity rent, but conversion cost– Is supposed to be constant

15
Effects of A Backstop Technologyon Resource Switch
Time
Supply Price Path for fossil fuel
New Backstop Price
Acceleration of Resource Switch
Price
Technological advancement
Original Backstop Price

16
Effects of A Sustained Hike in Fossil Fuel Prices on Resource Switch
Time
Backstop Price
Price
Original Supply Price Path for fossil fuel
Acceleration of Resource Switch
Sustained hike in price
New Supply Price Path for fossil fuel

17
Backstop Technology and Renewable Energy
• Is renewable energy a backstop technology? – It would have not been used unless it had met
the 3-A criteria
• Candidates for a backstop technology– Fission power, Wind power, Solar power– Fuel cell or hydrogen, Fusion power
• Is the usage of renewable energy a measure of energy security?

18
Ensuring Energy Security:Energy Diversification Measures
• EDM1– (TES – TFFS)/TES = 1 – (TFFS/TES)– Represents the degree of fossil fuel independence
• EDM2– (TES – TFFS – TNES)/TES = 1- (TFFS + TNES)/TES – Close to reality
• EDM3– (TES – TFFS – TNES – THPS)/TES– 1 – (TFFS + TNES + THPS)/TES– Most stringent, but a true measure?

19
Energy Diversification Measures
• An Illustration– Out of total primary energy supply in 2006 (BP
Statistical Review of World Energy), the share of nuclear energy is 0.058 and hydro-power 0.063
• Total primary energy supply: 10,878.5 million toe• Nuclear energy: 635.5; Hydro-power: 688.1
– This statistics shows EDM1 can be calculated as about 0.12
– How can this statistics be interpreted?

20
An Analytical Framework
• An Economy, Energy and Environment (E3) model incorporates – An economic growth model, – An aggregate representation of the carbon
dynamics and – Endogenous substitution of energy use in an
economy
• E3 combines top-down economic approach and bottom-up engineering approach

21
A Backstop Technology in the E3 Model
• Different rates of advancement or diffusion in a backstop technology have startling but distinguishable influences on the paths of atmospheric concentration of greenhouse gases vis-à-vis of temperature change
• Solar energy is chosen as a backstop technology and all end-usage are eventually met (but different time scales) by electricity harnessed from solar energy.

22
Degree of Solar Energy Utilization and Temperature Change
• Assumptions– Two sectors in a global economy
• Capital goods and consumption goods producing sector
– Three production factors: capital, labor and energy– Four energy sources
• Three fossil fuels (finite) and solar energy (infinite)• A representative technology is employed for calculating the
cost of using energy in each sector• The costs of using these energy sources are different by
sector (2x4 matrix, i.e., 8 different cost parameters)
– The cost of generating electricity from solar energy is decreasing at 5%, 10%, 30% and 50% per decade

23
Resource Switching Time by Sector
BAU BAU 5% 5% 10% 10% 30% 30% 50% 50%
Cap Con Cap Con Cap Con Cap Con Cap Con
1965 oil gas oil gas oil gas oil gas oil gas
1995 gas/oil gas/oil gas/oil gas/oil gas/oil
2015 oil/coal oil/coal oil/coal oil/coal solar
2025 coal coal coal coal coal coal coal solar solar
2055 solar
2125 solar
2175 solar
2255 solar
2265 solar
2345 coal solar solar solar
2355 coal solar solar solar solar coal solar coal solar coal

24
Greenhouse Gas Emissions Paths
Emissions (CO2 equivalent)
0
5
10
15
20
25
30
35
40
45
YEAR
Bil
lio
n t
on
of
Ca
rbo
n
Baseline
5%
10%
30%
50%

25
Temperature Change Paths by Different Harnessing Cost
Global Mean Temperature Change
0
1
2
3
4
5
6
7
1965
1985
2005
2025
2045
2065
2085
2105
2125
2145
2165
2185
2205
2225
2245
2265
2285
2305
2325
2345
YEAR
C D
eg
rees
Baseline
5%
10%
30%
50%
Stabilization

26
Concluding Remarks I
• Energy (i.e., energy use) is in the loop of energy security and climate change that binds the world– Efforts for ensuring energy security through exploring
more conventional energy sources or technological developments in harnessing various alternative energy sources affect climate change by altering mainly the extent of greenhouse gas contributions
– Movements for mitigating or halting climate change chiefly by limiting energy use or altering energy use behavior also influence the availability of energy, the applicability of relevant technology and the societal acceptability towards the energy

27
Concluding Remarks II
• Unless the concentrations of greenhouse gases in the atmosphere are stabilized within or at a threshold level, a vicious cycle of using more energy and putting more damage onto the world keeps going and a breakdown of the harmless or benign natural cycle would occur
• In addition, severing the loop is not possible as this goes against natural laws
• However, the loop or cycle can be less vicious if the world switches to a backstop technology, an ultimate, clean and abundant energy source

28
Concluding Remarks III
• To make such a switch happen– We need to be clear about the definition of energy
security and how energy supply is determined– We need to identify ways of ensuring energy security
and mitigating climate change through supply and demand side instruments and implement them
– We need to develop a backstop technology and make a smooth transition to such a stage in which all or as much as energy sources are harnessed from an ultimate, clean and abundant energy source

29
Concluding Remarks IV
• Renewable energy could fit into a backstop technology
• Energy Diversification Measure (i.e., how much energy is harnessed from renewable sources) can show the degree of energy security
• A simulation study shows that successful developments of such a backstop technology could stabilize the atmospheric concentrations of greenhouse gases and prevent a drastic situation in climate change

30
Bibliography
• Bielecki, J. (2002) “Energy Security: Is the Wolf at the Door?,” The Quarterly Review of Economics and Finance, 42:235-250.
• Bohi, D. R. and M. A. Toman (1996). The Economics Of Energy Security, Kluwer Academic Publishers, Boston.
• Chakravorty, U., J. A. Roumasset, and K.-P. Tse (1997). “Endogenous Substitution among Energy Resources and Global Warming,” Journal of Political Economy. 105(6): 1201-1234.
• Chang, Y. H. and W. Toh. (2007). “Efficiency of generation companies in the deregulated electricity market of Singapore: Parametric and non-parametric approaches,” International Journal of Electronic Business Management (to be published).

31
Bibliography
• Chang, Y. H. and J. Yong (2007). “Differing perspectives of major oil firms on future energy developments: An illustrative framework,” Energy Policy 35 (11): 5466-5480 (2007).
• Harris, D. P. (1993). “Mineral Resource Stocks and Information,” in Handbook of Natural Resource and Energy Economics by A. Kneese and J. L. Sweeney (eds.), North-Holland.
• Nordhaus, W. D. (1979), The Efficient Use of Energy Resources. Yale University Press.
• Nordhaus, W. D. (1994). Managing the Global Commons. Cambridge, MA: MIT Press.
• Nordhaus, W. D., and J. Boyer (2000). Warming the World: Economic Models of Global Warming. Cambridge, MA: MIT Press.


