
Energy Research & Social...
16
Energy Research & Social Science 3 (2014) 30–45 Contents lists available at ScienceDirect Energy Research & Social Science journal h om epage: www.elsevier.com/locate/erss Original research article Electricity load profiles in Europe: The importance of household segmentation Marian Hayn ∗ , Valentin Bertsch, Wolf Fichtner Chair of Energy Economics, Institute for Industrial Production (IIP), Karlsruhe Institute of Technology (KIT), Hertzstr. 16, 76187 Karlsruhe, Germany a r t i c l e i n f o Article history: Received 4 March 2014 Received in revised form 7 July 2014 Accepted 7 July 2014 Keywords: Household segmentation Residential electricity demand and load profiles Lifestyles and socio-demographic factors Electric appliances and technologies for electricity and heat supply a b s t r a c t In the current market design, the increasing use of renewable energy sources for electricity generation leads to new challenges in balancing supply and demand. While households are responsible for 29% of total electricity demand in Europe, a good understanding of their consumption and load profiles is missing. Similar to existing clustering methodologies from marketing science, this paper proposes an approach for the segmentation of households. The approach particularly focusses on the impact of socio-demographic factors and the equipment with electric appliances as well as new technologies for electricity and heat sup- ply on residential load profiles. In addition to these three factors themselves, the dependencies between them are identified as crucial. Therefore, in order to adequately assess the future development of residen- tial load profiles, on the one hand, a qualitative analysis of socio-demographic factors is carried out and, on the other hand, the influence of selected technologies is quantitatively modeled. Beyond the mere impact on households’ annual energy demand, in focus of most existing research in the field, particu- lar emphasis will be given to the peak load development, which is considered increasingly relevant for balancing supply and demand and maintaining security of supply. © 2014 Elsevier Ltd. All rights reserved. 1. Introduction Many European energy systems are undergoing significant changes. The increasing share of renewable energy sources (RES) leads to more distributed and fluctuating power generation. From systems with a limited number of large players with conventional power plants being responsible for power generation, they move to systems where many small players participate in the market. Even households, formerly classic electricity consumers, nowadays take part in power generation through photovoltaic (PV) and micro-CHP (combined heat and power). Responsible for 29% of total electric- ity demand in Europe (cf. Fig. 1 [1]), households play an important role in future electricity systems as they provide an increasing share of power generation capacity and are at the same time an impor- tant electricity consumer. Nowadays, neither their generation nor their consumption are well controllable for external parties but they strongly influence the electricity system, especially in low voltage grids, to which they are attached. To enable electricity mar- kets to cope with these upcoming challenges on a macro-, e.g., ∗ Corresponding author. Tel.: +49 721 608 44649; fax: +49 721 608 44682. E-mail address: [email protected] (M. Hayn). security of supply, and micro-economic level, e.g., capacity pricing, households’ load profiles need to be better understood. Especially in Germany these effects can be observed due to the so called “Energiewende” (energy transition mainly based on RES). Addition- ally, the German government decided the nuclear phase-out until 2022 resulting in even less predictable power generation capac- ity [2]. Hence, potential solutions developed for Germany might become a role model for other countries and are in special interest of research. Overall, electricity markets strive to a cost structure similar to today’s ICT (information and communication technology) markets. In ICT markets, the single bite or phone call create only negligible variable costs while the investment in the required infrastructure, e.g., fiber optic cables and mobile transmission towers, are the key cost drivers. Consequently, most existing internet tariffs consist of a fix price component based on the chosen transmission capacity whereas the data volume is often for free, i.e., so called flat-rate tariffs. Obviously, in electricity markets flat-rate tariffs are undesirable due to environmental reasons. Moreover, the variable costs constitute a significant cost component in markets dominated by fossil power generation. Nevertheless, the variable costs of electricity generation constantly decrease in electricity markets driven by RES. Contrariwise, the investments in market http://dx.doi.org/10.1016/j.erss.2014.07.002 2214-6296/© 2014 Elsevier Ltd. All rights reserved.
Transcript of Energy Research & Social...

O
Es
MC
a
ARRA
KHRpLEe
1
clspshp(irotttvk
h2
Energy Research & Social Science 3 (2014) 30–45
Contents lists available at ScienceDirect
Energy Research & Social Science
journa l h om epage: www.elsev ier .com/ locate /erss
riginal research article
lectricity load profiles in Europe: The importance of householdegmentation
arian Hayn ∗, Valentin Bertsch, Wolf Fichtnerhair of Energy Economics, Institute for Industrial Production (IIP), Karlsruhe Institute of Technology (KIT), Hertzstr. 16, 76187 Karlsruhe, Germany
r t i c l e i n f o
rticle history:eceived 4 March 2014eceived in revised form 7 July 2014ccepted 7 July 2014
eywords:ousehold segmentationesidential electricity demand and loadrofiles
a b s t r a c t
In the current market design, the increasing use of renewable energy sources for electricity generationleads to new challenges in balancing supply and demand. While households are responsible for 29% oftotal electricity demand in Europe, a good understanding of their consumption and load profiles is missing.Similar to existing clustering methodologies from marketing science, this paper proposes an approach forthe segmentation of households. The approach particularly focusses on the impact of socio-demographicfactors and the equipment with electric appliances as well as new technologies for electricity and heat sup-ply on residential load profiles. In addition to these three factors themselves, the dependencies betweenthem are identified as crucial. Therefore, in order to adequately assess the future development of residen-
ifestyles and socio-demographic factorslectric appliances and technologies forlectricity and heat supply
tial load profiles, on the one hand, a qualitative analysis of socio-demographic factors is carried out and,on the other hand, the influence of selected technologies is quantitatively modeled. Beyond the mereimpact on households’ annual energy demand, in focus of most existing research in the field, particu-lar emphasis will be given to the peak load development, which is considered increasingly relevant forbalancing supply and demand and maintaining security of supply.
© 2014 Elsevier Ltd. All rights reserved.
shi“a2ibo
tIvekc
. Introduction
Many European energy systems are undergoing significanthanges. The increasing share of renewable energy sources (RES)eads to more distributed and fluctuating power generation. Fromystems with a limited number of large players with conventionalower plants being responsible for power generation, they move toystems where many small players participate in the market. Evenouseholds, formerly classic electricity consumers, nowadays takeart in power generation through photovoltaic (PV) and micro-CHPcombined heat and power). Responsible for 29% of total electric-ty demand in Europe (cf. Fig. 1 [1]), households play an importantole in future electricity systems as they provide an increasing sharef power generation capacity and are at the same time an impor-ant electricity consumer. Nowadays, neither their generation norheir consumption are well controllable for external parties but
hey strongly influence the electricity system, especially in lowoltage grids, to which they are attached. To enable electricity mar-ets to cope with these upcoming challenges on a macro-, e.g.,∗ Corresponding author. Tel.: +49 721 608 44649; fax: +49 721 608 44682.E-mail address: [email protected] (M. Hayn).
cflavdcm
ttp://dx.doi.org/10.1016/j.erss.2014.07.002214-6296/© 2014 Elsevier Ltd. All rights reserved.
ecurity of supply, and micro-economic level, e.g., capacity pricing,ouseholds’ load profiles need to be better understood. Especially
n Germany these effects can be observed due to the so calledEnergiewende” (energy transition mainly based on RES). Addition-lly, the German government decided the nuclear phase-out until022 resulting in even less predictable power generation capac-
ty [2]. Hence, potential solutions developed for Germany mightecome a role model for other countries and are in special interestf research.
Overall, electricity markets strive to a cost structure similar tooday’s ICT (information and communication technology) markets.n ICT markets, the single bite or phone call create only negligibleariable costs while the investment in the required infrastructure,.g., fiber optic cables and mobile transmission towers, are theey cost drivers. Consequently, most existing internet tariffsonsist of a fix price component based on the chosen transmissionapacity whereas the data volume is often for free, i.e., so calledat-rate tariffs. Obviously, in electricity markets flat-rate tariffsre undesirable due to environmental reasons. Moreover, the
ariable costs constitute a significant cost component in marketsominated by fossil power generation. Nevertheless, the variableosts of electricity generation constantly decrease in electricityarkets driven by RES. Contrariwise, the investments in market
M. Hayn et al. / Energy Research & Social Science 3 (2014) 30–45 31
consu
itadgflwtctmmelg2Ddotm6pcdrghaowccdeh
utts
re
d
et
kictftttciowtrastoohaoto
w(gau
Fig. 1. European electricity
nfrastructure, e.g., grid technologies, increase in order to ensurehe required transport capacity from the many distributed gener-tion sites to the consumers. In the existing “energy-only” marketesign in Germany’s electricity market the pure availability ofeneration capacity is not rewarded, except from the share ofexible capacity traded at the balancing markets. With decreasingholesale electricity prices and less operating hours of conven-
ional power plants due to RES feed-in, covering the fix costs ofonventional plants becomes more challenging. The profitability ofhose plants is at risk leading to the ongoing discussion on capacity
echanisms in Germany [3]. Besides capacity mechanisms, alsoeans to increase demand flexibility are in focus of research,
specially demand response1 (DR), in order to decrease the peakoad of the entire system aiming at a reduced need in conventionaleneration capacity [5]. For households, responsible for around9% of Europe’s electricity demand (cf. Fig. 1), currently discussedR measures are, for instance, based on electricity tariffs withynamic electricity prices (per kWh) with the purpose to shiftr reduce load in times of high prices and increase demand inimes of low prices. The technical load reduction potential of these
easures in Germany’s residential sector is estimated at around.7 GW on average [5]. If this technically available load reductionotential coincides with the peak load of a country, less installedonventional power plant capacity would be required to fulfillemand. Even if only one-tenth of the technical potential could beealized during peak load times, it may still substitute some smalleras power plants. The use of new technologies for electricity andeat supply in households in the course of technological changend innovation may further alter the DR potential. Additionally,ther forms of residential electricity tariffs, for instance, tariffsith variable capacity prices2 (in kW) similar to industrial tariffs,
an reveal further opportunities for load reduction. These tariffsan also help to increase overall system stability if households’
emand can be reduced in critical peak times. To analyze theffect of those DR measures a better understanding of house-olds’ electricity consumption over time, i.e., their load profiles3,1 Definition according to the U.S. Department of Energy [4]: “Changes in electricsage by end-use customers from their normal consumption patterns in responseo changes in the price of electricity over time, or to incentive payments designedo induce lower electricity use at times of high wholesale market prices or whenystem reliability is jeopardized.”
2 The term “variable capacity prices” is used in this paper to describe the occur-ence of different prices for different levels of secured capacity in households’lectricity tariffs.3 A load profile represents the electricity use of a unit in watt, e.g., a household, a
evice or a plant, over time, e.g., in minutes, hours or days.
peso(lstodlcto
mption by sector, 2011 [1].
specially in conjunction with the increasing penetration of newechnologies, such as PV, micro-CHP and heat pumps, is required.
A recently published study of the German VKU (Verbandommunaler Unternehmen e.V.) proposes a new market designntroducing a decentralized capacity market with capacity certifi-ates. In this model, electricity contract providers are requestedo purchase enough certificates to ensure the security of supplyor their customers [6]. In industry tariffs, it is already commono include a price component for capacity. The VKU now suggestso extend this model to trade, commerce and services as well as tohe residential sector in order to better predict the required marketapacity (cf. Fig. 1). Therefore, electricity tariffs with variable capac-ty prices can be an adequate means to capture the individual levelf desired supply security. A similar concept is discussed by Oren [7]ho suggests electricity tariffs with different prices depending on
he level of contracted service reliability. Based on such tariffs loadeduction potentials can be realized in case of generation shortagess every customer can be restricted to its contracted level of supplyecurity. This would increase the market’s ability to balance elec-ricity demand and supply. To enable households or intermediariesffering such kind of contracts to define the appropriate heightf required capacity ensuring the desired level of supply security,ouseholds’ load profiles need to be better understood. Besides thenalysis of new tariffs as described above, a better understandingf household’s electricity consumption is also required to evaluatehe impact of changing consumer behavior or technological trendsn low voltage grids or residential load management potentials [8].
In energy systems modeling, households are often representedith a standard load profile (SLP), e.g., the H0 profile of the BDEW
German Association of Energy and Water Industries), or based onuideline VDI 4655. As these profiles are based on historical datand do not reflect the ongoing changes they are only of limitedsability for modeling and predicting load profiles of small sam-les or technological trends. However, the ongoing changes inlectricity systems require to analyze more distributed and con-equently smaller systems. Also new technologies like PV, e-carsr heat pumps will alter the electricity consumption of householdscf. Section 5). Hence, even in large samples the existing standardoad profiles might not be appropriate anymore. A more detailedegmentation of residential electricity consumption enables a bet-er reflection of future energy systems and allows for a wide rangef related analyses, e.g., the need for grid expansion or load pre-iction for electricity markets, and might even be used for new
oad profiles [9]. Creating household segments based on replicableharacteristics with comparable load profiles would help to bet-er model households’ electricity consumption. The developmentf these segments through the analysis of the influence of different

3 ch & S
ft
tiicAwIgbpaah
iacihuia
shgfeihptsatc
oichncrm
coethfach
2
fio
pkp[
bhtallscf
aca
ttscctidlNrtpd
tuMnee[Ph
3
dilnnMsKtd
demographic factors in the reviewed studies. The shown factorsare not necessarily independent from each other but a separatedconsideration can make sense as they might add further insights
2 M. Hayn et al. / Energy Resear
actors on residential electricity consumption and load profiles ishe objective of this paper.
Market segmentation is a central element in marketing in ordero identify consumers with similar needs and behaviors [10]. Thedea of market segmentation goes back to Smith [11] who statedn 1956 that it is critical for companies to better understand theirustomers in order to cope with the diversity on the demand side.s shown above, this diversity is neglected in electricity marketshen using SLPs to represent households’ electricity consumption.
mportant determinants with regard to market segmentation areeneral characteristics such as socio-demographics and lifestylesut also situation specific characteristics such as product usageatterns and responses to new products [12]. Therefore, this papernalyses the effect of lifestyles, socio-demographic factors, electricppliances and new technologies for electricity and heat supply onouseholds’ electricity consumption and load profiles.
In doing so, we intend to contribute to several topics of interestn the context of energy research and social science [13]. The chosenpproach considers the human dimension of energy use (human-entered research, social psychology and behavior) as well as thempact of new, evolving technologies for residential electricity andeat supply (R&D and innovation). The results of this paper can besed to derive appropriate means and mechanisms supporting the
ntegration of RES and consequently belongs to the topic of politicsnd political economy.
Since the penetration of new technologies in householdstrongly depends on their socio-demographic characteristics,ousehold segmentation and impact assessment of new technolo-ies cannot be treated independently. Therefore, the analysis doneor this paper combines these two parts. On the one hand, anxtensive literature review was performed to identify key driversnfluencing households’ electricity consumption. On the otherand, the impact of new technologies for electricity and heat sup-ly was modeled as there is little evidence in literature coveringheir impact on load profiles. The results will help to better under-tand and model energy systems even in small samples and couldllow to create customer specific incentive schemes for householdso change their consumption patterns influencing both, electricityonsumption (kWh) and capacity demand (kW).
The focus of most studies reviewed for this paper lays onlyn households’ total electricity consumption. Nevertheless, thesensights are also valuable with regard to load profiles as totalonsumption is the result of the accumulated load profiles of house-olds. Even though concrete conclusions on load profiles cannotecessarily be drawn, it is very likely that factors influencing totalonsumption also influence load profiles at some point. However,elated literature is considered whenever possible and comple-ented with own thoughts.In Section 2, the impact of lifestyles on households’ electricity
onsumption and load profiles is reviewed, followed by the impactf socio-demographic factors (Section 3) and the equipment withlectric appliances (Section 4). To illustrate possible effects of newechnologies such as PV, micro-CHP and battery storage on house-olds’ load profiles, a model-based analysis is shown for a single
amily house (SFH) in Section 5. The modeling approach was chosens hardly any literature was found covering this topic. The paperoncludes with a proposal on adequate segmentation factors forouseholds and an outlook on further research (Section 6).
. Segmentation based on lifestyles
The idea of lifestyle segmentation is prominently used in theeld of marketing communication and combines the two conceptsf lifestyle patterns and market segmentation. First, lifestyle o
ocial Science 3 (2014) 30–45
atterns are identified and then used to perform an in-depth mar-et segmentation. A very common approach to identify lifestyleatterns is based on AIO surveys (activities, interests and opinions)14].
Several studies already analyzed the interdependenciesetween lifestyles and electricity consumption [15–17]. They allave in common that they develop a certain household segmen-ation based on lifestyle clusters. Nevertheless, as every authornalyses data collected with a different method, the resultingifestyle clusters differ as well. In Otte [18] common shortfalls inifestyle research are criticized based on a meta-analysis of varioustudies. To overcome these shortfalls Otte [18] developed a con-eptual typology with nine lifestyle clusters but without a specialocus on the impact of these clusters on electricity consumption.
Besides, the term lifestyle is used differently in various studiess no common definition of this term exists [19]. Consequently theoncept of lifestyle segmentation is broadly discussed and regularlydopted to specific needs of research projects [20–22].
In all reviewed studies clear lifestyle clusters are identified byhe authors, but still the impact of lifestyles on electricity consump-ions remains vague [19]. The Austrian Energy Agency [23] eventates that there is no significant difference of the annual electricityonsumption per household or per person in the identified lifestylelusters. Hauser et al. [24] refer in their study to Otte’s lifestyleypology mentioned before [18]. Focus of their analysis is not thempact of lifestyles on total electricity consumption but on resi-ential load profiles. The published findings conclude that different
ifestyles do influence the load profile of the respective households.evertheless, in their explanation of the differences they rather
efer to socio-demographic criteria like the age of the persons andhe equipment with electric appliances in those lifestyle clusters. Aroper distinction of the impact of lifestyles and underlying socio-emographic factors is not feasible.
Also other reviewed studies can only explain a very little part ofhe variance between households’ electricity consumption by these of lifestyle segmentation, attitudes and behaviors [19,25–27].ore often, only the impact of socio-demographic factors like
umber of persons per household and net income on households’lectricity consumption occurs evident. Also the equipment withlectric appliances seems to be more important as Sanquist et al.17] identify usage patterns of television, air condition, laundry,C, etc. as main drivers for electricity consumption in Americanouseholds.
. Segmentation based on socio-demographic factors
As already mentioned above, the impact of households’ socio-emographic factors on their electricity consumption is described
n various studies [23,26–29]. Almost all reviewed studies ana-yze only the impact on the electricity consumption in total andot possible effects on the load profile of a household. Only Yoha-is et al. [30] directly measured the impact on load profiles;cLoughlin et al. [31] at least observed the impact of different
ocio-demographic factors on households’ maximum load4 andavousian et al. [32] analyzed the impact on selected features of
he consumption data, e.g., daily average, minimum and maximumemand.
Table 1 shortly summarizes the incidence of different socio-
4 The maximum load is the largest value of electricity demand in a specific periodf time [31].

M.
Hayn
et al.
/ Energy
Research
& Social
Science 3
(2014) 30–45
33
Table 1Incidence of socio-demographic factors in reviewed studies and their impact on energy demand.
Research focus Source Criteria
Householdsize
Dwellingsize
Income Age of referenceperson
Employmentstatus/occupancy
Education Rural vs. urbanhousing
Ownershipstructure/Dwelling type
Other
Electricity, measured
Kavousian et al.[32]
+ + - + + +Zip code
- −Building age
McLoughlinet al. [31]
+ +No. ofbedrooms
+Socialclass
+ +Social classa
− + +Householdcomposition
STATISTIKAUSTRIA [28]
+ + + + − + − +Year ofconstruction
Yohanis et al.[30]
+ + + + + + + +No. ofbedrooms
Electricity, surveyAustrianEnergy Agency[23]
+ + + + − +
Gram-Hanssen[33]
+ + + − −
Electricity and heat,measured
Brandon andLewis [26]
+ + + +
Electricity and heat,survey
Abrahamse andSteg [29]
+ + − −Gender
Gaterslebenet al. [27]
+ + − −
Electricity and heat,meta-analysis
Schipper et al.[15]
+ + + + + − +Familycomposition
+ = significant impact on energy demand; − = low to no significant impact on energy demand; Empty field = not analyzed.a Employment status not evaluated individually due to high correlation to social class.
34 M. Hayn et al. / Energy Research & S
Fh
tsreuticcAr
htgis
3
hhsihattbibamf[
schaatt
mhtlc
3
ahiisopc
nhsh
tttrifgcr
obad
diimetstwd
icnp
3
iti[
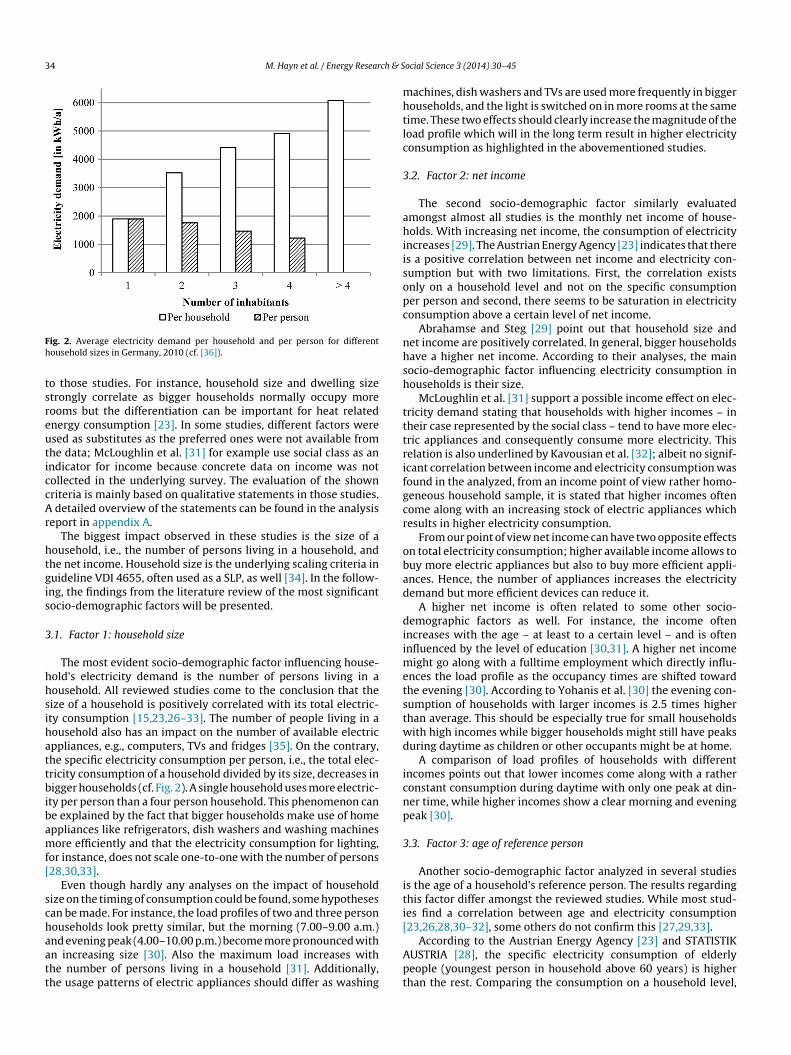
ig. 2. Average electricity demand per household and per person for differentousehold sizes in Germany, 2010 (cf. [36]).
o those studies. For instance, household size and dwelling sizetrongly correlate as bigger households normally occupy moreooms but the differentiation can be important for heat relatednergy consumption [23]. In some studies, different factors weresed as substitutes as the preferred ones were not available fromhe data; McLoughlin et al. [31] for example use social class as anndicator for income because concrete data on income was notollected in the underlying survey. The evaluation of the shownriteria is mainly based on qualitative statements in those studies.
detailed overview of the statements can be found in the analysiseport in appendix A.
The biggest impact observed in these studies is the size of aousehold, i.e., the number of persons living in a household, andhe net income. Household size is the underlying scaling criteria inuideline VDI 4655, often used as a SLP, as well [34]. In the follow-ng, the findings from the literature review of the most significantocio-demographic factors will be presented.
.1. Factor 1: household size
The most evident socio-demographic factor influencing house-old’s electricity demand is the number of persons living in aousehold. All reviewed studies come to the conclusion that theize of a household is positively correlated with its total electric-ty consumption [15,23,26–33]. The number of people living in aousehold also has an impact on the number of available electricppliances, e.g., computers, TVs and fridges [35]. On the contrary,he specific electricity consumption per person, i.e., the total elec-ricity consumption of a household divided by its size, decreases inigger households (cf. Fig. 2). A single household uses more electric-
ty per person than a four person household. This phenomenon cane explained by the fact that bigger households make use of homeppliances like refrigerators, dish washers and washing machinesore efficiently and that the electricity consumption for lighting,
or instance, does not scale one-to-one with the number of persons28,30,33].
Even though hardly any analyses on the impact of householdize on the timing of consumption could be found, some hypothesesan be made. For instance, the load profiles of two and three personouseholds look pretty similar, but the morning (7.00–9.00 a.m.)
nd evening peak (4.00–10.00 p.m.) become more pronounced withn increasing size [30]. Also the maximum load increases withhe number of persons living in a household [31]. Additionally,he usage patterns of electric appliances should differ as washingApt
ocial Science 3 (2014) 30–45
achines, dish washers and TVs are used more frequently in biggerouseholds, and the light is switched on in more rooms at the sameime. These two effects should clearly increase the magnitude of theoad profile which will in the long term result in higher electricityonsumption as highlighted in the abovementioned studies.
.2. Factor 2: net income
The second socio-demographic factor similarly evaluatedmongst almost all studies is the monthly net income of house-olds. With increasing net income, the consumption of electricity
ncreases [29]. The Austrian Energy Agency [23] indicates that theres a positive correlation between net income and electricity con-umption but with two limitations. First, the correlation existsnly on a household level and not on the specific consumptioner person and second, there seems to be saturation in electricityonsumption above a certain level of net income.
Abrahamse and Steg [29] point out that household size andet income are positively correlated. In general, bigger householdsave a higher net income. According to their analyses, the mainocio-demographic factor influencing electricity consumption inouseholds is their size.
McLoughlin et al. [31] support a possible income effect on elec-ricity demand stating that households with higher incomes – inheir case represented by the social class – tend to have more elec-ric appliances and consequently consume more electricity. Thiselation is also underlined by Kavousian et al. [32]; albeit no signif-cant correlation between income and electricity consumption wasound in the analyzed, from an income point of view rather homo-eneous household sample, it is stated that higher incomes oftenome along with an increasing stock of electric appliances whichesults in higher electricity consumption.
From our point of view net income can have two opposite effectsn total electricity consumption; higher available income allows touy more electric appliances but also to buy more efficient appli-nces. Hence, the number of appliances increases the electricityemand but more efficient devices can reduce it.
A higher net income is often related to some other socio-emographic factors as well. For instance, the income often
ncreases with the age – at least to a certain level – and is oftennfluenced by the level of education [30,31]. A higher net income
ight go along with a fulltime employment which directly influ-nces the load profile as the occupancy times are shifted towardhe evening [30]. According to Yohanis et al. [30] the evening con-umption of households with larger incomes is 2.5 times higherhan average. This should be especially true for small householdsith high incomes while bigger households might still have peaksuring daytime as children or other occupants might be at home.
A comparison of load profiles of households with differentncomes points out that lower incomes come along with a ratheronstant consumption during daytime with only one peak at din-er time, while higher incomes show a clear morning and eveningeak [30].
.3. Factor 3: age of reference person
Another socio-demographic factor analyzed in several studiess the age of a household’s reference person. The results regardinghis factor differ amongst the reviewed studies. While most stud-es find a correlation between age and electricity consumption23,26,28,30–32], some others do not confirm this [27,29,33].
According to the Austrian Energy Agency [23] and STATISTIKUSTRIA [28], the specific electricity consumption of elderlyeople (youngest person in household above 60 years) is higherhan the rest. Comparing the consumption on a household level,

ch & S
myftCehSmehthfhi
Gtfl
aiiaa[rt
3
iessSe
acmS
bouihf
potsao
saafia
twcw
3
aittv
tdtmAiYmtt
sscdblo[tth
ebtbd
3
ssv[ebda
mem3
v
M. Hayn et al. / Energy Resear
iddle-aged households (reference person between 35 and 60ears) use most electricity. Reasons for these results can be derivedrom the family lifecycle. Elderly people, in general, spend moreime at home as they do not have to leave for work or studies [28].onsequently, they use more electricity for lighting and consumerlectronics. Additionally, elderly people more often live in singleouseholds so the specific consumption per person is higher (cf.ection 3.1) [28]. Besides, younger households tend to have moreodern and energy efficient household appliances, which lower
lectricity consumption. The highest consumption of middle-agedouseholds on a household level can be explained by the facthat middle-aged households have the biggest share in non-singleouseholds. Hence, the higher electricity consumption follows
rom their size (cf. Section 3.1) [28]. Additionally middle agedouseholds often have children living at home which also results
n higher electricity use [31].Even though Gram-Hanssen [33], Abrahamse and Steg [29] and
atersleben et al. [27] do not observe similar effects in their studies,he rationale described by STATISTIK AUSTRIA [28] is plausible. Dif-erences in the observations of the studies can have various reasonsike size and characteristics of the sample.
The impact on the load profile is difficult to predict but is prob-bly rather related to the family lifecycle than to the age itself. Fornstance, McLoughlin et al. [31] prove that the maximum load isnfluenced by household’s composition which also depends on thege of the inhabitants – a family has a higher maximum load thann adult single household. Yohanis et al. [30] and Kavousian et al.32] explain the differences in load profiles for different ages witheference to the occupancy times of households that often base onhe employment status.
.4. Factor 4: employment status
The electricity use of households differs considerably depend-ng on their occupants’ employment status. Households without anmployment, i.e., retired persons, students and unemployed per-ons, have the highest electricity consumption in the reviewedtudies, followed by households of self-employed persons [28].alaried employees and public servants have roughly the samelectricity consumption while workers have the lowest [28].
As the employment status directly influences the net income of household, one reason for differences in electricity consumptionan be derived from this. Households with better paid employ-ents have a higher net income and thus use more electricity (cf.
ection 3.2) [31].Additionally, the time spend at home varies significantly
etween different employment status. Household members with-ut an employment spend more time at home and consequentlyse more electricity for lighting and consumer electronics. Accord-
ng to STATISTIK AUSTRIA [28] households without an employmentave the biggest share in single households which is another reason
or higher electricity consumption (cf. Section 3.1).A possible reason for the higher consumption of self-employed
ersons might be that self-employed persons work at home moreften than others. Hence, they spend more time at home using elec-ricity and might even have more office equipment like printers,ervers or copying machines at home. Of course this is not valid forll self-employed persons as they might have dedicated businessr office space outside their residential buildings.
The different occupancy times depending on the employmenttatus also impact the load profile of a household. Households with
ll occupants at work or at school show a high peak in the morningnd in the evening [30]. The typical lunch peak in standard load pro-les should not occur in most households with fulltime employeess lunch is normally taken at work. Having that said, a load shiftingacsb
ocial Science 3 (2014) 30–45 35
oward the evening is observable as washing machines and dishashers are used more often after work [30]. The morning peak
an be explained through showers using electricity to producearm water and the preparation of breakfast [30].
.5. Other socio-demographic factors
Besides the beforehand described factors, several others werenalyzed by different authors. For instance, in [23,27,28,31,33] thempact of the educational level of the surveyed reference person onhe household’s electricity consumption was analyzed but none ofhe studies identified a significant correlation between these twoariables.
Some authors additionally looked into the effect of the loca-ion where the household lives [23,28,30]. STATISTIK AUSTRIA [28]istinguishes between rural and urban areas based on the popula-ion density of Austrian provinces. The Austrian Energy Agency [23]
akes a more detailed distinction based on the population size ofustrian cities. Both see a slight decline of electricity consumption
n households in more urbanized areas. This thesis is supported byohanis et al. [30], stating that homes in the countryside have auch higher daytime demand – a possible explanation according
o their studies is the existence of farms with higher occupancyimes during the day and an active business.
Albeit dwelling size and type was analyzed separately in sometudies, they will not be reviewed in detail here. The dwelling size istrongly correlated to the household size [23] so its effect is alreadyovered. Additionally, larger households in general inhabit largerwellings which also affects the dwelling type at some point. Theigger the dwelling or respectively the household size, the more
ikely it is that the dwelling is a house and not an apartment. Alsother variables like number of bedrooms – used by Yohanis et al.30] and McLoughlin et al. [31] – are, in our opinion, less suitablehan household size. The number of bedrooms strongly correlateso the number of persons living in a household [31] and thus house-old size is the determining factor.
Some studies refer to some more socio-demographic factors,.g., year of construction or ownership structure of residentialuildings [28,30], but as those factors have only a minor impact onhe electricity consumption of households – or are also reflectedy other mentioned factors – they are excluded from a detailedescription in this paper.
.6. Summary on socio-demographic factors
The review of several studies shows that there existocio-demographic factors influencing households’ electricity con-umption. The studies are able to explain about one third of theariance in electricity consumption between different households27,29,33]. Consequently, two third of the variance cannot bexplained. Nevertheless, socio-demographic factors prove to beetter qualified then lifestyles to predict households’ electricityemand [23]. The impact on households’ load profiles was hardlynalyzed in former research.
Summing up the findings on socio-demographic factors, theost important ones seem to be household size, net income and
mployment status. We do not suggest considering age in a seg-entation approach due to the reasons stated before (cf. Section
.3).As some factors influence the characteristics of others and vice
ersa, e.g., the relation between net income, age, level of education
nd employment status, it might make sense to construct familyycles as seen in [15]. The author distinguishes between singles,ingles with children, couples, etc. These segments can be describedy the mentioned socio-demographic factors and should show
36 M. Hayn et al. / Energy Research & Social Science 3 (2014) 30–45
Fig. 3. Electricity consumption in German households by application type, 2012 [44].
0500
100015002000250030003500
0 5 10 15 20 25 30 35 40 45 50 55 60 65 70 75
Eff
ectiv
e po
wer
[W]
Time of use [in minutes]
Refrigerator Tumble drye r Dish washer (50° C)
F year 22
dttal
4a
etibbillb
eedu[ba
ircdfor
ia[dutt
SianbTadeadct[stlai
•
•
ig. 4. Measured load profiles of an illustrative refrigerator (No-name, max. 90 W,
400 W, year 2007) – own measurements.
ifferent load profiles as they should be characterized by differentimes of electricity use based on their work and family life. Addi-ionally, the data required for such segments, e.g., household sizend employment status, is widely available from public sourcesike federal statistical offices which facilitates a broader use.
. Segmentation based on the equipment with electricppliances
Lifestyle and socio-demographic characteristics can partiallyxplain the differences between households’ electricity consump-ion, but the existence and use of electric appliances in householdss the core of the resulting load profiles. This finding is underlinedy the fact that bottom-up models for synthetic load profiles, whichase their simulation on the use of appliances, provide very satisfy-
ng results. According to Gobmaier [37], his developed bottom-upoad model achieved an R2 value of 96.9% compared to measuredoad profiles. Therefore, appliances as a segmentation criterion wille reviewed in this chapter.
In general the use of electricity is not driven by the will to uselectricity but to consume a service provided by using the relatedlectric appliance, e.g., watching TV, washing clothes, or cookinginner [38]. Hence, the number of electric appliances and theirse correlates strongly with households’ electricity consumption31,33]. Consequentially, households’ electricity consumption cane described through the type and number of electric appliancesnd their specific time of use [39].
As the pure existence of electric appliances does not necessarilymply electricity consumption, the user practices, sometimes calledoutines, are an important factor affecting households’ electricityonsumption. Unfortunately, these routines are only to some part
etermined by objective characteristics like socio-demographicactors of households. Gram-Hanssen [33] shows that the numberf electric appliances and their type, e.g., their efficiency and size, iselated to the net income of a household. Households with higher•
007), tumble dryer (Miele, max. 2850 W, year 2007) and dish washer (Miele, max.
ncomes are less reluctant to spend money on additional electricppliances, e.g., a second refrigerator, TV or entertainment system31,33]. The employment status as well as household size stronglyetermine the time of use of an appliance as the likelihood of itstilization increases in general with a larger number of persons andhe employment status affects the time spend at home allowing forhe use of that appliance [39].
Various approaches exist to categorize appliances. Yao andteemers [40] define five categories based on functional sim-larities, i.e., brown goods (electronic consumer goods), coldppliances, cooking appliances, wet appliances and miscella-eous appliances. Lünsdorf and Sonnenschein [41] differentiateetween task-driven, user-driven and program-driven appliances.ask-driven appliances, e.g., dish washers, are used to perform
task at a given time; user-driven appliances, e.g., TVs, are usedepending on user preferences and program-driven appliances,.g., refrigerators, have to maintain a specific target state. Zeilingernd Einfalt [42] and Esslinger and Witzmann [43] use a veryetailed categorization with up to eleven categories, e.g., lighting,old appliances, dish washers, office appliances. With regard tohis paper the best categorization has been done by Firth et al.39] as their approach is based on use patterns and underlyingimilarities in the load profiles of the categorized appliances. Ashe objective of this paper is to identify reasons leading to similaroad profiles on household level, the categorization of electricppliances according to their load profiles proves beneficial. Thedentified categories of Firth et al. [39] are:
Continuous appliances: Continuously switched on with constantpower consumption, e.g., broadband modems;Standby appliances: Actively switched on by household members
but remaining power consumption when not in use, e.g., DVDrecorder;Cold appliances: Continuously switched on with alternating con-sumption between zero and a set power level, e.g., refrigerator;
M. Hayn et al. / Energy Research & S
Fm
•
FntsGptttthbiaadrstaav
fiaahiatdWrute
hbh
lldNcdbditf
5e
heCshitmtte
hmdatc
cthtobcahietcobdpfing regarding the impact of e-cars please refer to Jochem et al. [49]for instance.
To illustrate the impact of the abovementioned upcoming tech-nologies on households’ total consumption and their load profile, a
5 The term self-consumption describes the share of used self-produced electricity
ig. 5. Illustrative peak demand of selected electric appliances – own measure-ents.
Active appliances: Actively switched on by household membersbut no power consumption when not in use, e.g., dish washer.
Based on this high level differentiation and their research,irth et al. [39] state that the equipment of households, theumber of occupants and occupancy patterns are important fac-ors determining households’ electricity consumption. The averageplit of households’ electricity consumption by application type inermany is shown in Fig. 3. Due to the high utilization time of com-uters, notebooks and TVs the cluster “TV/audio + office”, belongingo active appliances, represents about one quarter of total elec-ricity consumption. Additionally, many households possess morehan one of these appliances at a time and even use them athe same time. According to the German Federal Statistical Officeouseholds own on average 1.6 TVs and 1.5 computers or note-ooks [35]. Not surprisingly the next biggest electricity consumers
n a household are appliances for “Cooling + freezing” (cold appli-nces), “Washing, drying, dish washing” and “Warm water” (activeppliances). While the cold appliances produce such a high demandue to their high utilization time, the other two application typesequire high power peaks, mainly for heating purposes. This can beeen in the selected load profiles in Fig. 4; while the load profiles ofhe tumble dryer and the dish washer have very high peaks (activeppliances with heating process), the refrigerator’s load profile has
very steady, alternating consumption over the entire time withery low effective power demand (cold appliance).
Very important in terms of creating variances in load pro-les and total electricity consumption between households areppliances with extremely high peak demand. Nowadays theseppliances are mainly electric space heating systems, boilers forot water, electric cooks and ovens as well as tumble dryers, wash-
ng machines and dish washers [31]. The peak demand of selectedppliances is shown in Fig. 5. This is also a reason for the iden-ified peaks at dinnertime and in the morning – most probablyetermined through electric showers and kitchen equipment [30].hile currently electric space heating systems play only a minor
ole in German households – only about 3.5% of German householdsse electric space heating systems [45] – in the future it is likelyo detect new technologies having a huge impact on households’lectricity consumption, e.g., heat pumps.
The findings of this section highlight that the equipment ofouseholds with electronic goods and their specific time of use,oth depending on socio-demographic characteristics of a house-old, are the basis for residential electricity consumption and
tu
[
ocial Science 3 (2014) 30–45 37
oad profiles. Even though it seems difficult in practice to col-ect this information on household equipment, much statisticalata regarding this topic is available from federal statistical offices.evertheless, electric appliances cannot be the only segmentationriteria for households due to the strong correlation to the socio-emographic characteristics of households. However, combiningoth approaches might lead to valuable insights. Moreover, theecision to adopt new technologies or technological innovations
s also linked to households’ characteristics [46]. Consequently,he impact of some selected technologies will be analyzed in theollowing.
. Segmentation based on new technologies for residentiallectricity and heat supply
Upcoming technologies for electricity and heat supply on house-old level with the potential to significantly change households’lectricity demand and load profile are mainly heat pumps, micro-HPs, PV systems, batteries and e-cars (cf. [47–49]). In the heatingector heat pumps might become more common, resulting in aigher market penetration. Though their use might have a pos-
tive effect on primary energy use of households they will leado an increasing electricity demand [50,51]. On the other side,
icro-CHPs and PV systems might produce additional electricityhat can be used in households directly. This effect is reflected byhe introduction of the term “prosumer”, i.e., electricity consumersquipped with new technologies producing electricity [52].
On the production side the increasing use of PV systems inouseholds can change their electricity demand from the grid ifore self-produced electricity would be used directly by the pro-
ucing households. This leads to an increasing self-consumptions well as an increasing self-coverage of households5. In combina-ion with storage systems, in this case batteries, it can even furtherhange the load profile [48,53].
Last but not least, e-cars might change households’ electricityonsumption. Depending on their utilization in the power sys-em they could act as batteries but could as well strongly increaseouseholds’ electricity demand as well as their load shifting poten-ial if they are recharged at home. In Germany, for instance, thebjective exists to have around one million e-cars in the markety 2020 [54]. Assuming an annual mileage6 of 15000 km one e-ar would require around 3000 kWh per year7 equaling almost thennual electricity consumption of an average German two personousehold (cf. [56]). The peak load of e-cars during the charg-
ng process depends on various factors like technical restrictions,.g., the battery capacity, and the charging strategy and infrastruc-ure, e.g., fast charging. Lunz et al. [57] calculated for different useases loads between 0.7 kW and 170 kW. Due to this high varietyf possible charging loads and the uncertainty of where e-cars wille charged – at home, at work or at public charging stations – aetailed consideration of the impact of e-cars on households’ loadrofiles would go beyond the scope of this paper. We thereforeocus on PV, heat pumps, micro-CHP and batteries. For further read-
o total self-produced electricity. The term self-coverage is defined as the share ofsed self-produced electricity to total electricity demand of a household [53].6 The annual average mileage in Germany for a petrol-engine vehicle is 14,652 km
36].7 Assuming a consumption of 20 kWh per 100 km [55].

38 M. Hayn et al. / Energy Research & Social Science 3 (2014) 30–45
Table 2Specifications of model elements used in PLEXOS® Integrated Energy Model.
Model elements Specifications Sources
Household electricity load profile (SLP) Single family house VDI 46554950 kWh/a1.83 kWpeak
Hourly resolution
Household heat load profile Single family house VDI 465510,000 kWh/a5.6 kWpeak
Hourly resolution
Local grid Nominal capacity: 20 kW Assumption
PV panels Nominal capacity: 4.9 kWpeak AssumptionHourly resolutionGeneration profile of year 2011
Battery Capacity: 5.4 kWh AssumptionDepth of discharge (DoD): 80%Charging efficiency: 90%Maximum charging capacity: 5 kW
Heat pump with heat storage Maximum nominal power consumption: 5 kWel AssumptionCoefficient of Performance (COP): 2–3 kWth/kWel
Storage capacity: 10 kWhth
Storage loss rate: 1% per h
Micro-CHP with heat storage Nominal capacity: 1.7 kWel AssumptionHeat rate: 15 MJ/kWhPower to heat ratio: 0.3Heat storage capacity: 10 kWhth
Storage loss rate: 1% per h
Wh
Wh
mlwpdt[p
5
Bitoa[TVcetvctp(F
t
aH
m
wctte
5
cg
•••••
•
Electricity tariff Flat: 0.25 D /k
Gas tariff Flat: 0.07 D /k
odel was set up with PLEXOS® Integrated Energy Model8 as onlyimited literature was found analyzing these effects. While the soft-
are is normally used for energy market modeling, e.g., electricityrice forecasting or capacity expansion planning, it has been scaledown for this paper to optimize a single household. The basic func-ionalities of the software are described, e.g., by Drayton-Bright58]. The model setup for our analyses and selected results will beresented in the following.
.1. Model setup
The developed model is derived from a model developed byertsch et al. [59]. It is based on one single-family house (SFH) that
s equipped with different technologies depending on the respec-ive use case. The required electricity is provided by the local grid,wn PV panels, a battery or a micro-CHP. If own electricity gener-tion exceeds local demand, defined through guideline VDI 465534], the electricity not used in the household is fed into the grid.he heat demand of the household, specified as well by guidelineDI 4655, is covered either by a heat pump or a micro-CHP, bothombined with heat storage. The specifications of the used modellements are given in Table 2. The assumptions for the specifica-ions of the different model elements are based on typical marketalues that are similarly used in other literature (cf. [53]). The useases are modeled as classical linear programming problems withhe objective to minimize variable costs for electricity and heat sup-
ly. The optimization problem is described by the target function1). The model runs on hourly time steps for the period of one year.or more details on the calculated optimization problem and the8 See: http://www.energyexemplar.com. The authors thank Energy Exemplar forhe provision of the software and their support.
(avloba
Assumption
Assumption
ssociated constraints see Bertsch et al. [59] and more specificallyayn et al. [60].
in
(∑t ∈ T
∑i ∈ I
(Et,i ∗ pt,i) +∑t ∈ T
(ft ∗ pt,gas)
)(1)
ith: Et,i: electricity supply of resource i at time t (variable); ft: fuelonsumption (gas) at time t (variable)); pt,i: price of resource i atime t (parameter)); pt,gas: fuel price (gas) at time t (parameter));: time index of hour t ∈ T = {1, 2, . . ., 8760} of one year); i: index oflectricity supply resource i ∈ I = {PV, Grid}.
.2. Use cases and selected results
Six different use cases were modeled and analyzed. Each usease is defined by a combination of the abovementioned technolo-ies and can be described as follows:
UC1: Base case without any new technologies equaling the SLP;UC2: SFH with own PV panels;UC3: SFH with own PV panels and battery;UC4: SFH with own PV panels, heat pump and heat storage;UC5: SFH with own PV panels, battery, heat pump and heat stor-age;UC6: SFH with micro-CHP and heat storage.
The impact of a PV system in combination with battery storageUC3) on households’ load profile is already shown by Staudachernd Eller [53]. Own calculations with the described model provideery similar results. For instance, Staudacher and Eller [53] calcu-
ated a self-consumption of 56% and a self-coverage of 54% basedn a flat electricity tariff while the results of the model developedy the authors of this paper indicate a self-consumption of 57% andself-coverage of 37%. The differences probably rely on different

M. Hayn et al. / Energy Research & Social Science 3 (2014) 30–45 39
0.00
0.25
0.50
0.75
1.00
1.25
1.50
1.75
2.00
Loa
d fr
om g
rid
[in k
W]
Time of day [h]
UC1: SL P UC2: PVUC3: PV+BAT UC4: PV+H P
AT
e SFH
ppuatbml
soliahgTfoiiacPufe7olTdcgntl
wc
ppbetoobpawd
pogaiy
•
•
tateeolo
UC5: PV+HP+B
Fig. 6. Modeled load profiles of load demand from the grid for on
arameter values used in the models, e.g., for the PV generationrofile or the battery itself. Bertsch et al. [59] use a similarly buildp model but focus in their analysis on the optimal size of heat stor-ges. Elsland et al. [51] developed a bottom-up model to simulatehe load profile of the German residential sector until the year 2040ut did not analyze a households’ individual load profile. Otherodels analyzing the effect of new technologies on households’
oad profiles similar to the other defined use cases were not found.The resulting load profiles of the six modeled use cases for one
elected winter day are visualized in Fig. 6. On first sight, it becomesbvious that the different technologies result in huge variations inoad over time. Already the simple modification of the household bynstalling a PV system (UC2) leads to a significant change in demandround noon because the produced electricity is used directly in theousehold. Adding a battery to store parts of the electricity surplusenerated by the PV system (UC3) further modifies the load profile.he electricity demand in the morning can now partly be satisfiedrom the battery. Adding a heat pump with heat storage insteadf a battery to the PV system significantly increases the electric-ty demand of the household as the heat pump converts electricitynto heat. Nevertheless, the installed PV capacity is sufficient tolso lower the demand around noon, similar to UC2 and UC3. Theombination of UC3 and UC4 is represented by UC5, including aV system, a battery and a heat pump with heat storage in onese case. While the resulting load profile is very similar to the onerom UC4, especially from 10 a.m. onwards where it is the same, theffect of the battery can be seen in the morning hours. The peak at
a.m. is covered with electricity from the battery. Finally, the usef a micro-CHP with heat storage is modeled in UC6 leading to aoad profile that is different to UC1 at all times of the selected day.he co-production of electricity, a consequence of the satisfied heatemand of the household, is in many hours of the day sufficient toover all electricity demand. Consequently no electricity from therid is consumed in these hours. Summing the described results up,ew technologies have a significant impact on both, the total elec-ricity demand from the grid, e.g., by the use of heat pumps, and the
oad in a specific hour of the day from the grid, e.g., by the use of PV.Nevertheless, the use of new technologies in combinationith flat electricity tariffs does not lead to a decrease of the peak
onsumption per se as shown in Fig. 7. As the time of households’
oftb
UC6: CH P
for defined use cases of one selected winter day on January 18th.
eak demand does not overlap with times of PV generation, theeak demand from the grid is not lowered in UC2. Also an installedattery (UC3) does not change the peak demand because the flatlectricity tariff used by the model does not incentivize a specificime for the utilization of the battery. Consequently, it would benly by chance that the battery is used in times of peak demandf households. The increased peak demand in UC4 and UC5 cane explained by the additional electricity demand of the heatump and the effects described for UC2 and UC3. Only the use of
micro-CHP (UC6) lowers the maximum load taken from the gridhich can be explained by the correlation of heat and electricityemand in households.
As described above, flat electricity tariffs do not incentivize aeak load reduction. Therefore, in order to demonstrate the impactf different electricity tariffs in combination with new technolo-ies on electricity load profiles, particularly the peak load, twodditional use cases were modeled. For illustrative purposes, UC3ncluding PV and battery storage, was used as a basis for this anal-sis. The additional use cases are:
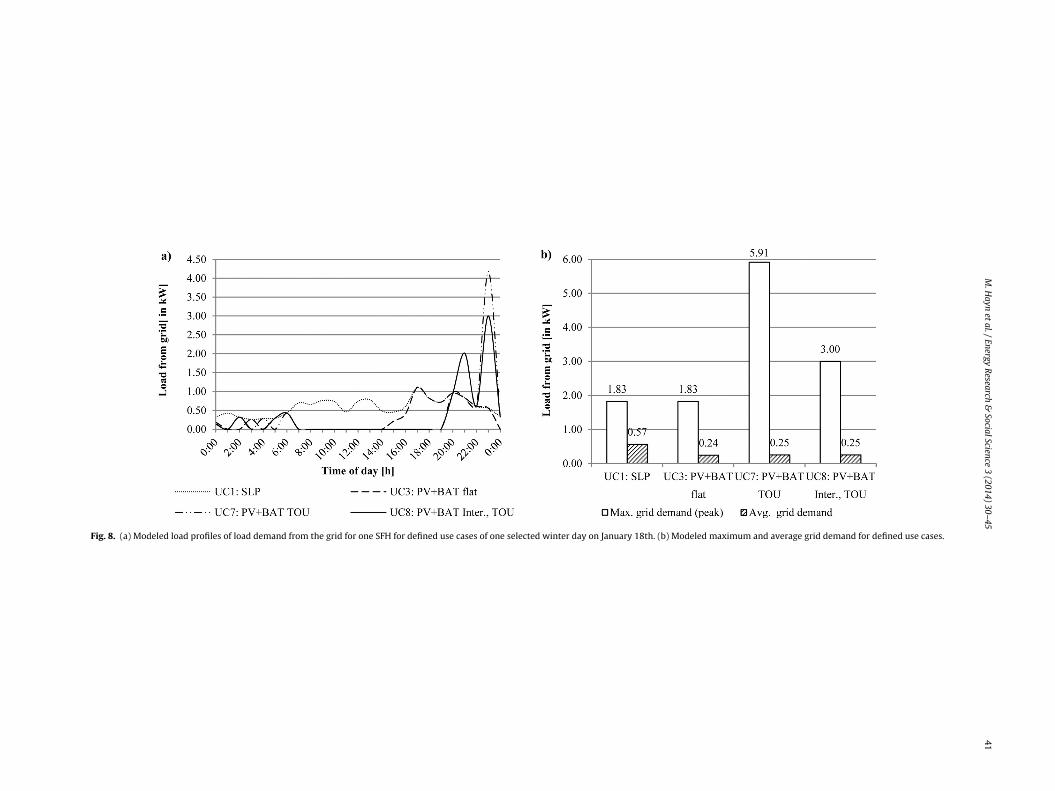
UC7: Same as UC3 (PV + BAT) but instead of a flat electricity tariffa simple time-of-use tariff with a peak (0.25 D /kWh) and off-peakprice (0.20 D /kWh) is simulated;UC8: Same as UC3 (PV + BAT) but instead of a flat electricity tar-iff an interruptible load tariff with time-of-use prices as aboveis simulated (max. grid demand set to 3 kW as in Italian house-holds).
Fig. 8(a) shows the resulting load profiles of the abovemen-ioned use cases, UC1 and UC3. Fig. 8(b) compares their averagend peak demand. The simulated time-of-use tariff leads to a fur-her load shift in UC7 and UC8. The battery is now used to storelectricity from the grid during off-peak periods in order to reducelectricity demand from the grid during peak price periods. Thisperating strategy is beneficial in this simplified battery model as iteads to reduced variable costs (arbitrage effect). In real life, wherether effects, e.g., irreversible capacity loss, would occur, another
perating strategy might be better. As long as capacity demandrom the grid is not priced or limited, e.g., due to interruptibleariffs, the charging load of the battery is limited neither. This cane seen in Fig. 8(b); the peak demand in UC7 is three times higher
40 M. Hayn et al. / Energy Research & Social Science 3 (2014) 30–45
ge gri
tootucanaa
5h
roroibehietoapnttaiasiebnH
rtCfbotl
6
eiftttttaetlouta
sh
1
Fig. 7. Modeled maximum and avera
han in UC1 or UC3 due to the fast charging of the battery. Time-f-use tariffs alone do not necessarily lead to more predictabler reduced peak demand. Contrariwise, in UC8 the utilization ofhe grid is limited to maximum 3 kW. Hence, in order to furtherse the battery to store cheaper off-peak electricity, the battery isharged more frequently with a lower maximum load, cf. Fig. 8(a)nd (b). While in this analysis the grid capacity was limited exoge-ously, similar effects of peak load reduction may be achieved byn introduction of capacity-based price components in householdss described in Section 1.
.3. Summary on new technologies for residential electricity andeat supply
The presented results clearly show that new technologies foresidential electricity and heat supply influence the load profilesf households. Depending on the available technologies, load iseduced through an increased self-consumption, e.g., by using PVr micro-CHP, increased due to additional electricity consumers,.e., heat pumps, or even shifted due to storage technologies, i.e.,atteries and heat storage. However, also the limitations of thexisting electricity market design regarding a load reduction onousehold level become obvious. Flat electricity tariffs provide no
ncentive for households to reduce their peak load; hence, newlectricity tariffs need to be analyzed. Time-of-use and real timeariffs are in focus of many studies, e.g., Hillemacher et al. [61], butften require active interventions of households as long as electricppliances do not automatically react to different electricityrices. Nevertheless, even though such active interventions wereecessary, Hillemacher et al. [61] have shown that time of useariffs change households’ electricity consumption visibly. Whilehe differences in consumption observed by Hillemacher et al.re based on the price elasticity of demand, the modeled resultsn this paper point out the effect of new technologies for heatnd electricity supply, more specifically the effect of the relatedtorage technologies. It is shown that also automated technolog-cal solutions can be used in order to increase the flexibility of
lectricity consumption in households. Due to these reasons it cane stated, that new technologies for electricity and heat supplyeed to be considered in household segmentation approaches.ence, the market penetration rates of new technologies and their2
d demand for defined use cases [60].
elation to the socio-demographic background of households needo be understood in order to analyze the evolution of load profiles.oncerning the penetration of PV systems, for instance, the reasons
or households to install PV modules have been already analyzedy Schelly [46]. According to her findings such a decision is notnly driven by its environmental or economic value but also byhe household dependent characteristics like socio-demographics,ifestyles and available communities of information.
. Conclusion and outlook
Summing up the reviewed methods to describe households’lectricity demand it becomes obvious that households’ electric-ty consumption is not easy to capture by one single method. Allour characteristics – lifestyles, socio-demographic factors, elec-ric appliances and new residential heat and electricity generationechnologies – influence households’ load profiles and total elec-ricity consumption. While data on socio-demographic factors andhe equipment of households with electric appliances and newechnologies is comparable on an objective level, lifestyle clusterslways appear subjective. This is mainly due to the four reasonsxplained in detail by Otte [18] – lacking comparability of iden-ified clusters, questionable correspondence to reality of selectedifestyles, lack of supporting theoretic approaches, and high effortf data collection. Nevertheless, lifestyles at least partly result fromnderlying socio-demographic characteristics like age or income ofhe household members and are as such included in segmentationpproaches based on socio-demographic factors.
According to our findings presented in this paper, there are threeocio-demographic factors with the biggest influence on house-olds’ electricity consumption and load profiles:
. Household size: With an increasing number of persons livingtogether the overall amount of used electricity increases, whilethe per capita amount decreases. Also the likelihood of havingpeople spending time at home during the day and using moreappliances at the same time increases and influences the load
profile. Additionally the number of electric appliances and theiruse is affected by households’ size.. Net income: Within some limitations, an increasing incomecorrelates with higher electricity consumption. This can be
M.
Hayn
et al.
/ Energy
Research
& Social
Science 3
(2014) 30–45
41
Fig. 8. (a) Modeled load profiles of load demand from the grid for one SFH for defined use cases of one selected winter day on January 18th. (b) Modeled maximum and average grid demand for defined use cases.
4 ch & S
3
acaap
shhstslisee
aiedwstirsts
itudtto
As
srmtst
•••
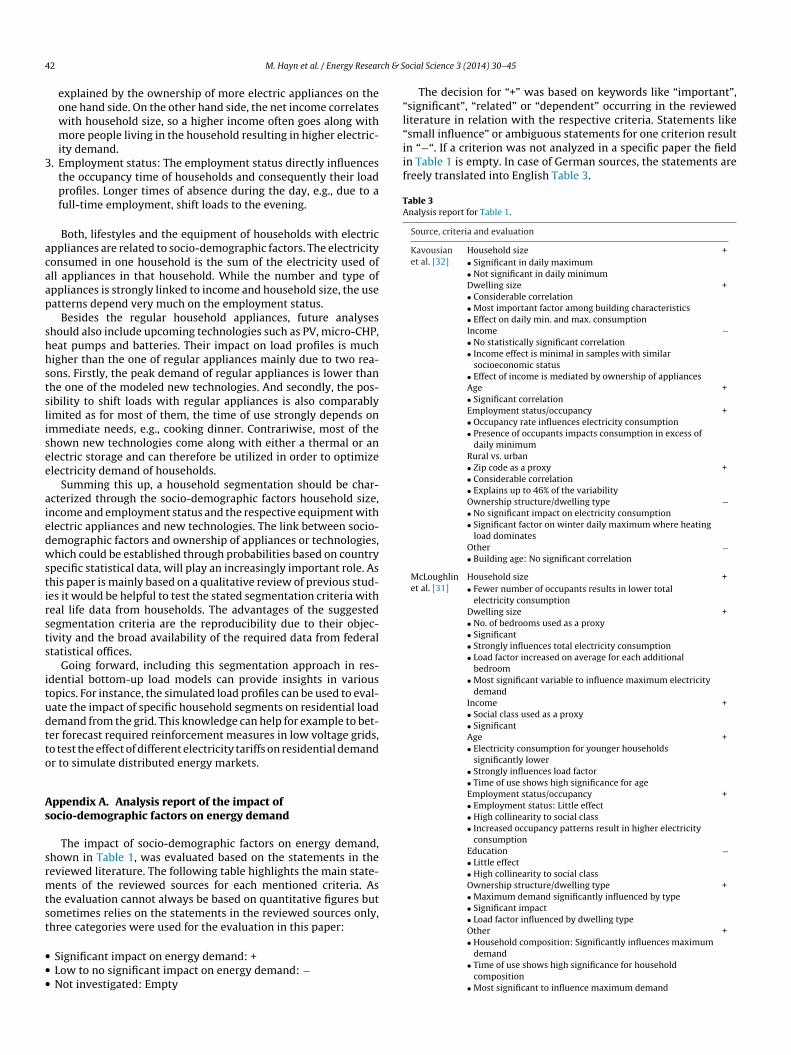
“l“small influence” or ambiguous statements for one criterion resultin “−“. If a criterion was not analyzed in a specific paper the fieldin Table 1 is empty. In case of German sources, the statements arefreely translated into English Table 3.
Table 3Analysis report for Table 1.
Source, criteria and evaluation
Kavousianet al. [32]
Household size +• Significant in daily maximum• Not significant in daily minimumDwelling size +• Considerable correlation• Most important factor among building characteristics• Effect on daily min. and max. consumptionIncome −• No statistically significant correlation• Income effect is minimal in samples with similar
socioeconomic status• Effect of income is mediated by ownership of appliancesAge +• Significant correlationEmployment status/occupancy +• Occupancy rate influences electricity consumption• Presence of occupants impacts consumption in excess of
daily minimumRural vs. urban• Zip code as a proxy +• Considerable correlation• Explains up to 46% of the variabilityOwnership structure/dwelling type −• No significant impact on electricity consumption• Significant factor on winter daily maximum where heating
load dominatesOther −• Building age: No significant correlation
McLoughlinet al. [31]
Household size +• Fewer number of occupants results in lower total
electricity consumptionDwelling size +• No. of bedrooms used as a proxy• Significant• Strongly influences total electricity consumption• Load factor increased on average for each additional
bedroom• Most significant variable to influence maximum electricity
demandIncome +• Social class used as a proxy• SignificantAge +• Electricity consumption for younger households
significantly lower• Strongly influences load factor• Time of use shows high significance for ageEmployment status/occupancy +• Employment status: Little effect• High collinearity to social class• Increased occupancy patterns result in higher electricity
consumptionEducation −• Little effect• High collinearity to social classOwnership structure/dwelling type +• Maximum demand significantly influenced by type• Significant impact• Load factor influenced by dwelling typeOther +
2 M. Hayn et al. / Energy Resear
explained by the ownership of more electric appliances on theone hand side. On the other hand side, the net income correlateswith household size, so a higher income often goes along withmore people living in the household resulting in higher electric-ity demand.
. Employment status: The employment status directly influencesthe occupancy time of households and consequently their loadprofiles. Longer times of absence during the day, e.g., due to afull-time employment, shift loads to the evening.
Both, lifestyles and the equipment of households with electricppliances are related to socio-demographic factors. The electricityonsumed in one household is the sum of the electricity used ofll appliances in that household. While the number and type ofppliances is strongly linked to income and household size, the useatterns depend very much on the employment status.
Besides the regular household appliances, future analyseshould also include upcoming technologies such as PV, micro-CHP,eat pumps and batteries. Their impact on load profiles is muchigher than the one of regular appliances mainly due to two rea-ons. Firstly, the peak demand of regular appliances is lower thanhe one of the modeled new technologies. And secondly, the pos-ibility to shift loads with regular appliances is also comparablyimited as for most of them, the time of use strongly depends onmmediate needs, e.g., cooking dinner. Contrariwise, most of thehown new technologies come along with either a thermal or anlectric storage and can therefore be utilized in order to optimizelectricity demand of households.
Summing this up, a household segmentation should be char-cterized through the socio-demographic factors household size,ncome and employment status and the respective equipment withlectric appliances and new technologies. The link between socio-emographic factors and ownership of appliances or technologies,hich could be established through probabilities based on country
pecific statistical data, will play an increasingly important role. Ashis paper is mainly based on a qualitative review of previous stud-es it would be helpful to test the stated segmentation criteria witheal life data from households. The advantages of the suggestedegmentation criteria are the reproducibility due to their objec-ivity and the broad availability of the required data from federaltatistical offices.
Going forward, including this segmentation approach in res-dential bottom-up load models can provide insights in variousopics. For instance, the simulated load profiles can be used to eval-ate the impact of specific household segments on residential loademand from the grid. This knowledge can help for example to bet-er forecast required reinforcement measures in low voltage grids,o test the effect of different electricity tariffs on residential demandr to simulate distributed energy markets.
ppendix A. Analysis report of the impact ofocio-demographic factors on energy demand
The impact of socio-demographic factors on energy demand,hown in Table 1, was evaluated based on the statements in theeviewed literature. The following table highlights the main state-ents of the reviewed sources for each mentioned criteria. As
he evaluation cannot always be based on quantitative figures butometimes relies on the statements in the reviewed sources only,hree categories were used for the evaluation in this paper:
Significant impact on energy demand: +Low to no significant impact on energy demand: −Not investigated: Empty
ocial Science 3 (2014) 30–45
The decision for “+” was based on keywords like “important”,significant”, “related” or “dependent” occurring in the reviewediterature in relation with the respective criteria. Statements like
• Household composition: Significantly influences maximumdemand
• Time of use shows high significance for householdcomposition
• Most significant to influence maximum demand

M. Hayn et al. / Energy Research & Social Science 3 (2014) 30–45 43
Table 3 (Continued)
Source, criteria and evaluation
Yohanis et al.[30]
Household size +• Profiles for all groups are similar• Households with four or more occupantsconsume largest amount of electricityDwelling size +• Annual electricity consumption depends on dwelling sizeIncome +• Very important impact• Households with large incomes use 2.5 times more
electricity on average in the eveningsAge +• Influence on consumptionEmployment status/occupancy +• Higher average electricity consumption in homes with no
daytime occupantsRural vs. urban +• No significant impact on majority of daily profiles• Exception: high daytime demand of homes in the countryOwnership structure/dwelling type +• Average consumption on a per m2 basis is the same• Difference in demand of 24% in winter and 30% in
summer• Average 24-h profiles are very similar• Significant variation of total average load• Privately owned houses with demand profile over 100%
greater in the evenings compared to rented homes, 60%greater throughout the rest of day
Other +• No. of bedrooms: very similar profiles• Total consumption very much dependent
AustrianEnergy Agency[23]
Household size +• Electricity consumption increases with an increasing
household sizeDwelling size +• Positive correlation with total consumption• Specific consumption (per person) not correlatedIncome +• Evident correlation with total consumption• No evident correlation with specific consumptionAge +• Higher total consumption of middle aged reference
persons• Weaker correlation when considering household’s
average ageEducation −• Weak connection with total consumption• No correlation with specific consumptionRural vs. urban +• Higher total consumption in rural areas• Specific consumption not related
STATISTIKAUSTRIA [28]
Household size +• Important determinant• Total consumption increases with sizeDwelling size +• Total consumption increases with sizeAge +• Elderly households have on average a higher electricity
consumptionEmployment status/occupancy +• Households with unemployed persons have highest
electricity consumption per personEducation −• No significant impactRural vs. urban +• Higher electricity consumption in rural areasOwnership structure/dwelling type −• No significant differencesOther +• Year of construction: Total consumption on average 27%
lower in houses build after 1990
Table 3 (Continued)
Source, criteria and evaluation
Gram-Hanssen[33]
Household size +• Strongest explanation• R2 = 27.6%Dwelling size +• Third most important factor• R2 = 2.5%Income +• Second most important factor• R2 = 5.8%Age −• Little extra explanatory power• R2 = 1.3%Education −• Little extra explanatory power• R2 = 0.02%
Abrahamse andSteg [29]
Household size +• Positively associated• Related• Correlation = 0.40Income +• Related• Correlation = 0.41Age −• Correlation = 0.07Other −• Gender: Correlation = 0.13
Gaterslebenet al. [27]
Household size +• Primarily/most strongly related• Only significant predictorIncome +• Primarily/most strongly related• Only significant predictorAge −• Not significantly relatedEducation −• Not significantly related
Brandon andLewis [26]
Household size +• Proved significant• T-value of 3.89Income +• Proved significant• T-value of 4.78Age +• Proved significant• T-value of 2.36Ownership structure/dwelling type +• Renters t-value of 1.99• Owner-occupiers t-value of 2.52
Schipper et al.[15]
Household size +• Important/significant determinantDwelling size +• Key determinantIncome +• Certainly a determinant• May not drive important changes in energy use aloneAge +• Important/significant determinantEmployment status/occupancy +• Important/significant determinantOwnership structure/dwelling type −• Small influenceOther +• Family composition is an important determinant

4 ch & S
R
[
[
[
[
[
[
[
[
[
[
[
[
[
[
[
[
[
[
[
[
[
[
[
[
[
[
[
[
[
[
[
[
[
[
[
[
[
[
[
[
[
[
[
[
[
4 M. Hayn et al. / Energy Resear
eferences
[1] Eurostat European Commission. Energy balance sheets 2010–2011. 2013 ed.Luxembourg: Publications Office of the European Union; 2013.
[2] Deutscher Bundestag. Dreizehntes Gesetz zur Änderung des Atomgesetzes;2011.
[3] Cremer C. Vorschlag für ein Marktdesign der privatisierten Leistungsver-sorgung. Energiewirtschaftliche Tagesfragen 2013;63(1/2):40–4.
[4] U.S. Department of Energy (DOE). Benefits of Demand Response in ElectricityMarkets and Recommendations for Achieving Them: A Report to the UnitedStates Congress Pursuant to Section 1252 of the Energy Policy Act of 2005;2006.
[5] Deutsche Energie-Agentur GmbH (dena). dena-Netzstudie II – Integra-tion erneuerbarer Energien in die deutsche Stromversorgung im Zeitraum2015–2020 mit Ausblick 2025. Berlin; 2010.
[6] Verband kommunaler Unternehmen e.V. (VKU). Ein zukunftsfähigesEnergiemarktdesign für Deutschland. Langfassung. Berlin; 2013.
[7] Oren SS. Privatizing electric reliability through smart grid technologies andpriority service contracts. In: Power IEEE, Energy Society, editors. IEEE Powerand Energy Society general meeting, 2010: IEEE PES-GM 2010. Piscataway, NJ:IEEE; 2010.
[8] Dickert J, Schegner P. Lastgänge als Grundlage für die Analyse von Smart Grids –Anforderungen und Vergleich von Lastgangsynthesen. In: VDE-Kongress 2012– Intelligente Energieversorgung der Zukunft: Kongressbeitäge; 5–6 November2012, Internationales Congresscenter Stuttgart (ICS). Berlin: VDE-Verlag;2012.
[9] Gerblinger A, Finkel M, Witzmann R. Entwicklung und Evaluation vonneuen Standardlastprofilen für Haushaltskunden. In: Institut für Elektriz-itätswirtschaft und Energieinnovation, editor EnInnov 2014-13. SymposiumEnergieinnovation: Innehalten und Ausblick: Effektivität und Effizienz für dieEnergiewende. Graz: Verlag d. Technischen Universität Graz; 2014.
10] McDonald M, Dunbar I. Market segmentation: how to do it and how to profitfrom it. 4th ed. Chichester: John Wiley & Sons Ltd.; 2012.
11] Smith WR. Product differentiation and market segmentation as alternativemarketing strategies. J Mark 1956;21(1):3–8.
12] Wind Y. Issues and advances in segmentation research. J Mark Res1978;15(3):317–37.
13] Sovacool BK. What are we doing here? Analyzing fifteen years of energy schol-arship and proposing a social science research agenda. Energy Res Soc Sci2014;1:1–29.
14] Plummer JT. The concept and application of life style segmentation. J Mark Res1974;38(1):33–7.
15] Schipper L, Bartlett S, Hawk D, Vine E. Linking life-styles and energy use: amatter of time? Annu Rev Energy 1989;14(1):273–320.
16] Prose F, Wortmann K. Energiesparen: Verbraucheranalyse und Marktsegmen-tierung der Kieler Haushalte; 2014. Available from: http://www.nordlicht.uni-kiel.de/table/online-publikationen/3.-verbraucheranalyse-und-marktsegmentierung/ [accessed 28.08.13].
17] Sanquist TF, Orr H, Shui B, Bittner AC. Lifestyle factors in U.S. residential elec-tricity consumption. Energy Policy 2012;42:354–64.
18] Otte G. Entwicklung und Test einer integrativen Typologie der Lebensführungfür die Bundesrepublik Deutschland [Construction and Test of an Integra-tive Lifestyle-Typology for Germany]. Zeitschrift für Soziologie 2005;34(6):442–67.
19] Gram-Hanssen K, Nærvig Petersen K. Different everyday lives – different pat-terns of electricity use. In: Proceedings of the 2004 American Council for anEnergy Efficient Economy. 2004. p. 1–13.
20] Anderson Jr WT, Golden LL. Lifestyle and psychographics: a critical review andrecommendation. Adv Consum Res 1984;11(1):405–11.
21] Vyncke P. Lifestyle segmentation: from attitudes, interests and opinions, tovalues, aesthetic styles, life visions and media preferences. Eur J Commun2002;17(4):445–63.
22] Brunsø K, Scholderer J, Grunert KG. Closing the gap between valuesand behavior – a means–end theory of lifestyle. J Bus Res 2004;57(6):665–70.
23] Austrian Energy Agency. Outlook “Life Style 2030”: Determinanten für denStromverbrauch in österreichischen Haushalten. Wien; 2012.
24] Hauser W, Évora J, Kremers E. Modelling lifestyle aspects influencing theresidential load-curve. In: Troitzsch KG, Möhring M, Lotzmann U, editors. Pro-ceedings/26th European Conference on Modelling and Simulation, EMCS 2012.S.l: ECMS. 2012.
25] van Raaij WF, Verhallen TMM. Patterns of residential energy behavior. J EconPsychol 1983;4(1–2):85–106.
26] Brandon G, Lewis A. Reducing household energy consumption: a qualitativeand quantitative field study. J Environ Psychol 1999;19(1):75–85.
27] Gatersleben B, Steg L, Vlek C. Measurement and determinants of envi-ronmentally significant consumer behavior. Environ Behav 2002;34(3):335–62.
28] STATISTIK AUSTRIA. Modellierung des Stromverbrauchs in den privaten
Haushalten Österreichs nach unterschiedlichen Verwendungszwecken.Vienna; 2011.29] Abrahamse W, Steg L. How do socio-demographic and psychological factorsrelate to households’ direct and indirect energy use and savings? J Econ Psychol2009;30(5):711–20.
[
ocial Science 3 (2014) 30–45
30] Yohanis YG, Mondol JD, Wright A, Norton B. Real-life energy use in the UK: howoccupancy and dwelling characteristics affect domestic electricity use. EnergyBuild 2008;40(6):1053–9.
31] McLoughlin F, Duffy A, Conlon M. Characterising domestic electricity consump-tion patterns by dwelling and occupant socio-economic variables: an Irish casestudy. Energy Build 2012;48:240–8.
32] Kavousian A, Rajagopal R, Fischer M. Determinants of residential electric-ity consumption: using smart meter data to examine the effect of climate,building characteristics, appliance stock, and occupants’ behavior. Energy2013;55:184–94.
33] Gram-Hanssen K. Households’ energy use – which is the more important:efficient technologies or user practices? In: Moshfegh B, editor. World Renew-able Energy Congress-Sweden. Linköping: University Electronic Press; 2011. p.992–9.
34] Verein Deutscher Ingenieure e.V. (VDI). Referenzlastprofile von Ein-und Mehrfamilienhäusern für den Einsatz von KWK-Anlagen;27.100,91.140.10(VDI 4655). o. O. Beuth Verlag GmbH; 2008.
35] Statistisches Bundesamt (Destatis). Fachserie 15 Reihe 2 Wirtschaftsrech-nungen. Laufende Wirtschaftsrechnung. Ausstattung privater Haushalte mitausgewählten Gebrauchsgütern – 2012. Wiesbaden; 2013.
36] Rheinisch-Westfälisches Institut für Wirtschaftsforschung (RWI), forsaGesellschaft für Sozialforschung und statistische Analysen mbH. Erhebung desEnergieverbrauchs der privaten Haushalte für die Jahre 2009-2010. Teilbericht.Forschungsprojekt Nr. 54/09 des Bundesministeriums für Wirtschaft und Tech-nologie, BMWi; 2013.
37] Gobmaier TH. Entwicklung und Anwendung einer Methodik zur Synthesezukünftiger Verbraucherlastgänge, Munich; 2013 (dissertation).
38] Wilson C, Dowlatabadi H. Models of decision making and residential energyuse. Annu Rev Environ Resour 2007;32(1):169–203.
39] Firth S, Lomas K, Wright A, Wall R. Identifying trends in the use of domes-tic appliances from household electricity consumption measurements. EnergyBuild 2008;40(5):926–36.
40] Yao R, Steemers K. A method of formulating energy load profile for domesticbuildings in the UK. Energy Build 2005;37(6):663–71.
41] Lünsdorf O, Sonnenschein M. Lastadaption von Haushaltsgeräten durchVerbundsteuerung. In: Kurrat M, editor. Dezentrale Energiesysteme: 3. Sym-posium. 2009. p. 71–83.
42] Zeilinger F, Einfalt A. Modell für hochauflösende synthetische Haushalt-slastprofile. In: Institut für Elektrizitätswirtschaft und Energieinnovation,editor. EnInnov 2012-12. Symposium Energieinnovation: Alternativen für dieEnergiezukunft Europas. Graz: Verlag d. Technischen Universität Graz; 2012.
43] Esslinger P, Witzmann R. Entwicklung und Verifikation eines stochastischenVerbraucherlastmodells für Haushalte. In: Institut für Elektrizitätswirtschaftund Energieinnovation, editor. EnInnov 2012-12. Symposium Energieinnova-tion: Alternativen für die Energiezukunft Europas. Graz: Verlag d. TechnischenUniversität Graz; 2012.
44] Oberascher C. Stromverbrauch und Stromverwendung der privatenHaushalte in Deutschland: Ergebnisse einer Studie im Auftrag von HEA,BDEW und EnergieAgentur. NRW; 2012. Available from: http://www.hea.de/akademie/downloads/1301 Energieverbrauch und Energieverwendungim Haushalt.pdf [accessed 03.09.13].
45] Statistisches Bundesamt (Destatis). GESIS – Leibniz-Institut für Sozialwis-senschaften. Datenhandbuch zum Mikrozensus Scientific Use File 2010; 2013.
46] Schelly C. Residential solar electricity adoption: what motivates, and whatmatters? A case study of early adopters. Energy Res Soc Sci 2014;2:183–91.
47] Cockroft J, Kelly N. A comparative assessment of future heat and power sourcesfor the UK domestic sector. Energy Convers Manage 2006;47(15–16):2349–60.
48] Mulder G, Ridder FD, Six D. Electricity storage for grid-connected householddwellings with PV panels. Solar Energy 2010;84(7):1284–93.
49] Jochem P, Kaschub T, Fichtner W. How to integrate electric vehicles in thefuture energy system? In: Hülsmann M, Fornahl D, editors. Evolutionary pathstowards the mobility patterns of the future. Berlin, Heidelberg: Springer; 2014.p. 243–63.
50] Wagner U, Heilek C, Held A. Energiewirtschaftliche Bewertung derWärmepumpe in der Gebäudeheizung; 2014. Available from: http://www.haustec.cc/docs/Waermepumpenstudie2009.pdf [accessed 11.09.13].
51] Elsland R, Boßmann T, Hartel R, Gnann T, Genoese M, Wietschel M. Analysis ofstructural changes of the load profiles of the German residential sector due todecentralized electricity generation and e-mobility. In: Hakansson A, Höjer M,Howlett RJ, Jain LC, editors. Sustainability in energy and buildings: Proceedingsof the 4th International Conference in Sustainability in Energy and Buildings(SEB′12). Berlin, Heidelberg: Springer; 2013. p. 71–84.
52] Hoffknecht A, Wengeler F, Wunderer A. Herausforderungen und Chancen füreinen regionalen Versorger. In: Servatius H, Schneidewind U, Rohlfing D, edit-ors. Smart energy. Berlin, Heidelberg: Springer; 2012. p. 113–29.
53] Staudacher T, Eller S. Dezentrale Stromversorgung eines Einfamilien-hauses: Stromversorgung mit Photovoltaik, Batterie und Netzanschluss. BWK2012;64(6):38–45.
54] Bundesregierung. Nationaler Entwicklungsplan Elektromobilität der Bun-desregierung; 2009.
55] Helms H, Pehnt M, Lambrecht U, Liebich A. Electric vehicle and plug-in hybridenergy efficiency and life cycle emissions. In: 18th International SymposiumTransport and Air Pollution: Session 3: Electro and Hybrid Vehicles. 2010. p.113–24.

ch & S
[
[
[
[
[
M. Hayn et al. / Energy Resear
56] Bundesverband der Energie- und Wasserwirtschaft e.V. (BDEW). Stromver-brauch im Haushalt. Berlin; 2013.
57] Lunz B, De Doncker RW, Sauer DU. Analyse von Ladeinfrastrukturkonzeptenfür Elektromobilität: Analysis of Charging Infrastructure Concepts for ElectricMobility. In: VDE Verband der Elektrotechnik Elektronik Informationstechnike.V., editor. VDE-Kongress 2010 – E-Mobility: Technologien-Infrastruktur-Märkte: Kongressbeiträge – 8–9 November 2010 Congress Center Leipzig.
Berlin: VDE-Verlag; 2010.58] Drayton-Bright GR. Coordinating energy and reserves in a wholesale electricitymarket; 1997 (dissertation).
59] Bertsch V, Schwarz H, Fichtner W. Layout optimisation of decentralised energysystems under uncertainty. In: Operations Research Proceedings 2013. Berlin,
[
ocial Science 3 (2014) 30–45 45
Heidelberg: Springer; 2014, http://dx.doi.org/10.1007/978-3-319-07001-8 5(in press).
60] Hayn M, Bertsch V, Fichtner W. Einfluss neuer Technologien auf denLeistungsbezug von Haushalten aus dem Netz. In: Institut für Elektriz-itätswirtschaft und Energieinnovation, editor. EnInnov 2014-13. SymposiumEnergieinnovation: Innehalten und Ausblick: Effektivität und Effizienzfür die Energiewende. Graz: Verlag d. Technischen Universität Graz;
2014.61] Hillemacher L, Hufendiek K, Bertsch V, Wiechmann H, Gratenau J,Jochem P, et al. Ein Rollenmodell zur Einbindung der Endkunden ineine smarte Energiewelt. Zeitschrift für Energiewirtschaft 2013;37(3):195–210.
![Personal Assistant / Secretary - NUST Secretaries Blogsecretaryblog.nust.na/sites/default/files/Secretaries-Profiles.pdf · [ 1 ] PERSONAL ASSISTANT / SECRETARY PROFILES Angela Apollus](https://static.fdocuments.in/doc/165x107/5abe04077f8b9ad8278c9d53/personal-assistant-secretary-nust-secretaries-1-personal-assistant-secretary.jpg)