ENERGY, POWER & INFRASTRUCTURE - … · Ulterra Drilling Technologies, a subsidiary of ESCO...
23
www.harriswilliams.com Investment banking services are provided by Harris W illiams LLC, a registered broker-dealer and member of FINRA and SIPC, and Harris W illiams & Co. Ltd, which is authorised and regulat ed by the Financial Conduct Authority. Harris Williams & Co. is atrade name underwhich Harris Williams LLC and Harris Williams & Co. Ltd conduct business. ENERGY, POWER & INFRASTRUCTURE INDUSTRY UPDATE │ JULY 2016
Transcript of ENERGY, POWER & INFRASTRUCTURE - … · Ulterra Drilling Technologies, a subsidiary of ESCO...

www.harriswilliams.com
Investment banking services are provided by Harris W illiams LLC, a registered broker-dealer and member of FINRA and SIPC, and Harris W illiams & Co. Ltd, which is authorised andregulat ed bythe Financial Conduct Authority. HarrisWilliams &Co.is atrade name underwhich HarrisWilliams LLC and HarrisWilliams &Co. Ltd conduct business.
ENERGY, POWER & INFRASTRUCTURE
INDUSTRY UPDATE │ JULY 2016

PAGE |
www.harriswilliams.com
SUMMARY
1
CONTENTS
WHAT WE’RE READING
M &A TRANSACTIONS
PUBLIC M ARKETS INDUSTRY
PUBLIC COM PARABLES
CONTACTS
UNITED STATES
Drew SpitzerM anaging Directoraspitzer@harrisw illiams.com +1 (804) 915-0174
Brian LucasM anaging Directorblucas@harrisw illiams.com +1 (804) 932-1323
Matt WhiteM anaging Directormw [email protected]+1 (804) 915-0131
Luke [email protected]+1 (804) 915-0158
Chris BurnhamVice Presidentcburnham@harrisw illiams.com +1 (804) 915-0142
Ian ThomasVice [email protected]+1 (804) 932-1384
EUROPE
Jeffery PerkinsM anaging Directorjperkins@harrisw illiams.com+49 (0) 69 3650638 00
M&A | SELECT RECENT ACTIVITY
AmQuip Crane Rental, a portfolio company of Clearlake Capital, has been
acquired by Apollo Global Management. AmQuip prov ides complex lifting solutions to the petrochemical, refining, and div ersified industrial sectors. The
transaction closed in conjunction with Apollo’s acquisition of Maxim Crane, creating a global crane and lifting solutions prov ider v alued at approximately $1.4
billion. HW&Co. serv ed as the lead financial adv isor to AmQuip.Source | Instapaper
Rev enew International, a portfolio company of Lev ine Leichtman Capital Partners, has been acquired by Sentinel Capital Partners. Rev enew is a leading prov ider of
cost containment and cost recov ery serv ices primarily to the energy industry. HW&Co. serv ed as the exclusiv e financial adv isor to Rev enew.Source | Instapaper
RelaDyne, a portfolio company of AEA Inv estors, has been acquired by AudaxPriv ate Equity. RelaDyne is a leading distributor of fuels and lubricants, as well as
prov ider of industrial liability serv ices. HW&Co. serv ed as the lead financial adv isor to RelaDyne.Source | Instapaper
Ulterra Drilling Technologies, a subsidiary of ESCO Corporation, has been acquired by American Securities. Headquartered in Fort Worth, Texas, Ulterra designs and manufactures matrix and steel PDC bits used in the drilling of oil and gas wells, as well as downhole tools.Source | Instapaper
ENERGY, POWER & INFRASTRUCTURE
INDUSTRY UPDATE │ JULY 2016
PUBLIC MARKETS | KEY TRADING STATISTICS
Stock Price % Change TEV / EBITDA
1 Month 12 Month Jul-15 Jan-16 Current 2015 2016E
Energy Services and Equipment
Large Cap Service (3.2%) (14.1%) 8.1x 10.3x 16.0x 12.8x 19.8x
Equipment (9.0%) (16.1%) 6.0x 5.7x 8.2x 6.0x 10.6x
Small-Cap Service (11.7%) (39.0%) 5.6x 5.9x 7.6x 7.2x 11.5x
OCTG 4.2% (31.8%) 6.3x 6.8x 11.1x 8.6x 11.7x
Distribution (3.5%) (1.0%) 17.6x 6.4x 9.5x 7.3x NM
Logistics (8.2%) (59.0%) 6.3x 6.9x 7.5x 7.5x 8.6x
Offshore Drillers (7.7%) (27.3%) 4.5x 3.2x 3.5x 3.2x 5.8x
Land Drillers (8.3%) 4.0% 3.9x 4.3x 7.8x 5.7x 14.9x
E&C 0.9% (1.1%) 7.4x 3.7x 4.7x 6.0x 5.2x
Power Services and Equipment
Large Cap PS&E 6.1% (0.1%) 10.4x 8.8x 10.9x 10.9x 10.6x
Small-Cap PS&E 2.9% (0.9%) 10.5x 9.2x 11.1x 11.2x 11.1x
EE and Cleantech 14.9% (0.6%) 9.0x 4.9x 7.2x 6.5x 7.8x
Industrial & Infrastructure Services
Large Cap 6.7% 9.7% 6.0x 5.0x 6.8x 6.5x 7.1x
Small-Cap (0.4%) 15.1% 8.0x 8.0x 9.7x 10.6x 7.4x
Utility Services 9.2% 17.3% 8.7x 8.3x 10.8x 10.6x 7.4x
Industrial Services 6.3% 0.7% 9.3x 9.0x 8.3x 10.0x 8.4x
Design/Professional Services 1.0% (9.5%) 10.2x 8.0x 9.5x 9.4x 8.7x
TEV / LTM EBITDA as of

PAGE |
www.harriswilliams.com
WHAT WE’RE READING
“Venture capital (VC) firms spent ov er $25 billion funding clean energy technology (cleantech) start-ups from 2006 to2011 and lost ov er half their money; as a result, funding has dried up in the cleantech sector. In this article, we presentthe most comprehensiv e account to date of the cleantech VC boom and bust, aggregating hundreds of inv estmentsto calculate the risk/return profile of cleantech, compared with those of medical and software technologyinv estments.”
M IT Energy Initiative | Instapaper
CLEAN TECHNOLOGY| VENTURE CAPITAL AND CLEAN TECHNOLOGY
ENERGY, POWER & INFRASTRUCTURE
INDUSTRY UPDATE │ JULY 2016
“It was only two years ago that Elroy Holtmann spent about $20,000 on a home solar array to help cov er the costs ofcharging his new electric car. With the sav ings on his monthly electric bills, he figured the inv estment would pay foritself in about a dozen years. But then the utilities regulators changed the equation. As a result, Pacific Gas & Elect ricrecently did away with the rate schedule chosen by Mr. Holtmann, a retired electrical engineer, and many other solarcustomers in this part of Californ ia [San Francisco Bay Area]. The new schedule will make them pay much more for theelectricity they draw from the grid in the ev ening, while paying those customers less for the excess power their solarpanels send back to the grid on sunny summer days. As a result, Mr. Holtmann’s solar setup may nev er pay for itself.”New York Times| Instapaper
RENEWABLES | A REVERSAL OF COURSE
“Counting the number of dril ling rigs in the oil patch used to be a good predictor of how many new barrels of crudethe energy industry could harv est ov er a stretch of time. Now the rig count is almost irrelev ant to calculating thenation’s future oil production.”
Fuel Fix | Instapaper
OIL & GAS | SAY IT AIN’T SO, RIG COUNTS
POWER | BECAUSE WE HAVE TO INCLUDE SOMETHING ABOUT POKÉMON
“Many of the laid-off mechanics and roustabouts that ran drilling rigs during the oil boom hav e found new jobs inconstruction, retail and other sectors and may not come back ev en if the industry recov ers. A small surv ey byresea rch firm Ev ercore ISI shows that more than half of a group of laid-off energy serv ice workers hav e found work inother industries, and 4 out of 5 hav e left the industry, saying they wouldn’t take a job in the oil patch again — ev en ifthey could get their old jobs back or could get a better one.”
Fuel Fix | Instapaper
OIL & GAS | WHEN THE MARKET REBOUNDS, WILL WORKERS RETURN?
OIL & GAS | IT TURNS OUT PEOPLE WERE STILL USING YAHOO!
“We'v e entered a strange new era for the electric power sector – for all of humanity, really. Utility workers are familiarwith obscure terms like differentiator circuits, ohmmeters and potentiometers. But they're now being forced to learnabout Charmanders, Bulbasaurs and Squirtles ov errunning the country's substations and power plants. The country'spower prov iders are on high alert.”
Greentech M edia | Instapaper
“Powerful forces hav e been roiling oil markets this year. There are the v agaries of Chinese demand, shifts in Americanproduction, the enigma of OPEC policy. And then, of course, there’s the imminent demise of Yahoo Messenger’s oldsoftware v ersion…For as long as many of them hav e been working in the field, tens of thousands of oil traders aroundthe globe hav e relied on the Yahoo system when logging trades for millions of barrels of crude and fuels such asgasoline ev ery day. But Yahoo’s new Messenger won’t separately arch iv e chats and will include the ability to“unsend” a message, making it incompatible with many trading companies’ regulatory requirements.”
The Wall Street Journal | Instapaper
2

PAGE |
M&A TRANSACTIONS
3
RECENT M&A TRANSACTIONS1,2
ENERGY, POWER & INFRASTRUCTURE
INDUSTRY UPDATE │ JULY 2016
Date Target Business Description Acquirer
7/29/2016 AmQuip Crane Rental U.S. based leading provider of highly specialized, complex lifting
solutions to the petrochemical, refining, and industrial sectors.
Apollo
7/25/2016 RelaDyne U.S. based distributor of fuel and lubricants for industrial and commercial
end markets.
Audax
7/20/2016 Revenew U.S. based provider of monetary and cost reduction serv ices to
companies in the energy and power industry.
Sentinel
7/18/2016 Ulterra Drilling
Technologies
U.S. based designer and manufacturer of drill bits. American Securities
7/14/2016 MHWirth Managed
Pressure Operations
U.S. based subsidiary of MHWirth prov iding managed pressure drilling
(MPD) equipment for both onshore and offshore applications.
AFGlobal
7/13/2016 Redneck Oilfield Serv ices Canada based supplier of rental equipment and serv ices to the oil and
gas industry.
Strad Energy Serv ices
7/11/2016 1Energy Systems U.S. based developer of optimization software for component-based
grid energy storage systems.
Doosan
7/8/2016 Lovejoy U.S. based manufacturer of power transmission components, shaft
couplings, and hydraulic components.
The Timken Co.
7/7/2016 Des-Case U.S. based provider of contamination control products. Industrial Growth Partners
7/7/2016 DGLogik U.S. based provider of software solutions with an emphasis on utilizing
the Internet of Everything for energy efficiency applications.
Acuity Brands
7/7/2016 Power Flame U.S. based manufacturer of gas, oil, and combination gas/oil burners
and combustion control systems.
Astec Industries
7/7/2016 CleanSpark U.S. based provider of energy software, control technology, and
microgrid-as-a-serv ice solutions.
Stratean
7/6/2016 Nortek U.S. based provider of air ventilation, home control, and ergonomic
solutions.
Melrose
7/1/2016 AmSpec U.S. prov ider of tesing and inspection serv ices for petroleum and
petrochemical products.
Olympus Partners
6/28/2016 AnchorPipe U.S. based provider of onshore and offshore pipeline anchoring and
foundation solutions to the oil and gas industry.
Torcsill Foundations
6/27/2016 WireCo WorldGroup U.S. based manufacturer and distributor of steel and synthetic ropes
used for electrical and industrial processes.
ONEX
6/27/2016 Dura Coat Products U.S. based provider of tube, coil, and spray coatings for general
industrial products.
Axalta Coating Systems

PAGE |
PUBLIC MARKETS OVERVIEW
4
ENERGY, POWER & INFRASTRUCTURE
INDUSTRY UPDATE │ JULY 2016
Energy Equipment and Services
TEV / LTM EBITDA TEV / 2016E EBITDA
AVERAGE REVENUE GROWTH (2012 – 2014) AVERAGE REVENUE GROWTH (2014 – 2016E)
AVERAGE EBITDA MARGIN (2012 – 2014) AVERAGE EBITDA MARGIN (2014 – 2016E)
3.5x
4.7x
7.5x
7.6x
7.8x
8.2x
9.5x
11.1x
16.0x
Offshore Drillers
E&C
Logistics
Small Cap Service
Land Drillers
Equipment
Distribution
OCTG
Large Cap Service
5.2x
5.8x
8.6x
10.6x
11.5x
11.7x
14.9x
19.8x
E&C
Offshore Drillers
Logistics
Equipment
Small Cap Service
OCTG
Land Drillers
Large Cap Service
(0.8%)
(0.7%)
3.2%
3.3%
3.5%
4.9%
5.4%
5.4%
5.7%
OCTG
E&C
Small Cap Service
Distribution
Equipment
Land Drillers
Offshore Drillers
Large Cap Service
Logistics
(44.2%)
(36.7%)
(31.9%)
(30.0%)
(28.6%)
(26.6%)
(26.3%)
(18.4%)
(5.9%)
Land Drillers
Small Cap Service
Large Cap Services
Equipment
Logistics
Distribution
OCTG
Offshore Drillers
E&C
6.5%
11.0%
18.5%
20.1%
20.5%
20.9%
32.0%
33.5%
42.4%
Distribution
E&C
OCTG
Small Cap Service
Large Cap Service
Equipment
Land Drillers
Logistics
Offshore Drillers
1.4%
6.4%
11.3%
11.7%
16.2%
17.4%
27.2%
27.9%
46.8%
Distribution
Small Cap Service
E&C
OCTG
Large Cap Service
Equipment
Logistics
Land Drillers
Offshore Drillers

PAGE |
PUBLIC MARKETS OVERVIEW
5
ENERGY, POWER & INFRASTRUCTURE
INDUSTRY UPDATE │ JULY 2016
Power Equipment and Services
TEV / LTM EBITDA TEV / 2016E EBITDA
AVERAGE REVENUE GROWTH (2012 – 2014) AVERAGE REVENUE GROWTH (2014 – 2016E)
AVERAGE EBITDA MARGIN (2012 – 2014) AVERAGE EBITDA MARGIN (2014 – 2016E)
7.2x
10.9x
11.1x
EE and Cleantech
Large Cap
Mid and Small-Cap
7.8x
10.6x
11.1x
EE and Cleantech
Large Cap
Mid and Small-Cap
2.6%
3.6%
12.2%
Mid and Small-Cap
Large Cap
EE and Cleantech
(6.0%)
1.8%
14.9%
Large Cap
Mid and Small-Cap
EE and Cleantech
(15.2%)
17.1%
17.5%
EE and Cleantech
Large Cap
Mid and Small-Cap
(18.8%)
16.7%
16.9%
EE and Cleantech
Mid and Small-Cap
Large Cap
PAGE |
PUBLIC MARKETS OVERVIEW
6
ENERGY, POWER & INFRASTRUCTURE
INDUSTRY UPDATE │ JULY 2016
Infrastructure Services
TEV / LTM EBITDA TEV / 2016E EBITDA
AVERAGE REVENUE GROWTH (2012 – 2014) AVERAGE REVENUE GROWTH (2014 – 2016E)
AVERAGE EBITDA MARGIN (2012 – 2014) AVERAGE EBITDA MARGIN (2014 – 2016E)
6.8x
8.3x
9.5x
9.7x
10.8x
Large Cap
Industrial Services
Design / Professional
Services
Mid and Small-Cap
Utility Services
7.1x
7.4x
7.4x
8.4x
8.7x
Large Cap
Utility Services
Mid and Small-Cap
Industrial Services
Design / Professional
Services
4.6%
7.1%
8.8%
11.6%
12.8%
Mid and Small-Cap
Large Cap
Design / Professional
Services
Utility Services
Industrial Services
(8.3%)
(4.8%)
2.9%
7.7%
7.9%
Large Cap
Industrial Services
Mid and Small-Cap
Utility Services
Design / Professional
Services
5.7%
6.5%
7.7%
9.1%
9.7%
Large Cap
Mid and Small-Cap
Industrial Services
Design / Professional
Services
Utility Services
6.0%
6.1%
6.9%
8.9%
9.3%
Large Cap
Mid and Small-Cap
Industrial Services
Utility Services
Design / Professional
Services

PAGE |
INDUSTRY STATISTICS
7
ENERGY, POWER & INFRASTRUCTURE
INDUSTRY UPDATE │ JULY 2016
(Indexed t o 100%)
TRAILING TWELVE MONTHS
Commodity Prices
Price Change From
Current Prior Month Prior Year Prior Month Prior Year
Natural Gas ($ per MMBtu) $2.69 $2.66 $2.78 0.9% (3.3%)
Crude Oil ($ per bbl) 43.21 47.64 48.14 (9.3%) (10.2%)
Coal (CAPP) ($ per ton) 39.50 39.50 43.08 0.0% (8.3%)
25%
50%
75%
100%
125%
Jul-15 Oct-15 Jan-16 Apr-16 Jul-16
Natural Gas (NYMEX:^NG) Crude Oil (NYMEX:^CL) Coal (NYMEX:^QL)

PAGE |
INDUSTRY STATISTICS
ENERGY, POWER & INFRASTRUCTURE
INDUSTRY UPDATE │ JULY 2016
U.S. RIG COUNTS INTERNATIONAL RIG COUNTS
Rig Counts3
INTERNATIONAL RIG COUNT BY COUNTRY
U.S. OIL VS. GAS RIG COUNT
U.S. HORIZONTAL/DIRECTIONAL VS. VERTICAL RIG COUNT
8
0
500
1,000
1,500
2,000
2,500
'00
'01
'02
'03
'04
'05
'06
'07
'08
'09
'10
'11
'12
'13
'14
'15
'16
400
600
800
1,000
1,200
1,400
'00
'01
'02
'03
'04
'05
'06
'07
'08
'09
'10
'11
'12
'13
'14
'15
'16
28
19
39
86
48
31
-
68
52
96
300
147
North Sea
Africa
Europe
Asia Pacific
Middle East
Latin America
Offshore Land
0
200
400
600
800
1,000
1,200
1,400
1,600
1,800
'00
'01
'02
'03
'04
'05
'06
'07
'08
'09
'10
'11
'12
'13
'14
'15
'16
Horizontal / Directional
Vertical
0
200
400
600
800
1,000
1,200
1,400
1,600
1,800
'00
'01
'02
'03
'04
'05
'06
'07
'08
'09
'10
'11
'12
'13
'14
'15
'16
Oil
Gas

PAGE |
INDUSTRY STATISTICS
9
ENERGY, POWER & INFRASTRUCTURE
INDUSTRY UPDATE │ JULY 2016
U.S. OIL RIG COUNT BY REGION U.S. GAS RIG COUNT BY REGION
Rig Counts3
YTD CHANGE IN U.S. OIL RIG COUNT BY REGION YTD CHANGE IN U.S. GAS RIG COUNT BY REGION
77
--
--
--
--
--
1
6
8
9
14
18
27
28
29
168
Others
Arkoma Woodford
Fayetteville
Marcellus
Haynesville
Utica
Ardmore Woodford
Mississippian
Barnett
Granite Wash
Gulf of Mexico
DJ-Niobrara
Williston
Cana Woodford
Eagle Ford
Permian
(33.6%)
(100.0%)
(100.0%)
(57.4%)
(50.0%)
(50.0%)
(49.1%)
(30.0%)
(21.7%)
(19.6%)
(17.6%)
29%
60%
--
--
--
Others
Arkoma Woodford
Utica
Eagle Ford
Ardmore Woodford
Mississippian
Williston
Gulf of Mexico
DJ-Niobrara
Permian
Cana Woodford
Granite Wash
Barnett
Fayetteville
Marcellus
Haynesville
29
--
--
--
--
--
--
--
--
--
2
4
6
12
16
24
Others
Mississippian
Williston
Ardmore Woodford
Permian
Fayetteville
Cana Woodford
DJ-Niobrara
Barnett
Granite Wash
Arkoma Woodford
Gulf of Mexico
Eagle Ford
Utica
Haynesville
Marcellus
(40.8%)
(100.0%)
(100.0%)
(100.0%)
(100.0%)
(100.0%)
(41.5%)
(36.0%)
(25.0%)
(20.0%)
(14.3%)
--
--
--
--
--
Others
Permian
Fayetteville
Cana Woodford
Barnett
Granite Wash
Marcellus
Haynesville
Eagle Ford
Gulf of Mexico
Utica
Mississippian
Williston
Ardmore Woodford
Arkoma Woodford
DJ-Niobrara

PAGE |
INDUSTRY STATISTICS
10
ENERGY, POWER & INFRASTRUCTURE
INDUSTRY UPDATE │ JULY 2016
Construction Spend4
% YoY CHANGE BY SECTOR % MoM CHANGE BY SECTOR
NON-RESIDENTIAL U.S. CONSTRUCTION SPEND
Seasonally Adjusted Annual Rate
($ in Millions)
$0
$100,000
$200,000
$300,000
$400,000
$500,000
$600,000
$700,000
$800,000
'02 '03 '04 '05 '06 '07 '08 '09 '10 '11 '12 '13 '14 '15 '16
Total Private Public
(10.1%)
(9.6%)
(6.9%)
(4.1%)
(4.0%)
(2.5%)
(1.3%)
(0.0%)
0.2%
1.5%
3.3%
4.7%
6.8%
7.6%
17.1%
19.5%
Water Supply
Communication
Manufacturing
Sewage & Waste
Transportation
Public Safety
Highway & Street
Educational
Conservation
Power
Healthcare
Commercial
Religious
Amusement
Office
Lodging
(10.4%)
(5.3%)
(5.2%)
(2.8%)
(2.0%)
(1.5%)
(0.5%)
(0.5%)
(0.2%)
(0.2%)
(0.2%)
0.2%
0.2%
1.6%
1.8%
7.7%
Religious
Educational
Sewage & Waste
Transportation
Manufacturing
Commercial
Amusement
Public Safety
Water Supply
Highway & Street
Power
Office
Healthcare
Lodging
Communication
Conservation

PAGE |
INDUSTRY STATISTICS
11
ENERGY, POWER & INFRASTRUCTURE
INDUSTRY UPDATE │ JULY 2016
HISTORICAL ARCHITECTURAL BILLINGS INDEX (ABI) C&I AND INSTITUTIONAL ABI SCORES
Construction Indicators5,6
NEW DESIGN CONTRACTS DODGE MOMENTUM INDEX (DMI)
Indexed to Year 2000
20
25
30
35
40
45
50
55
60
65
70
'03
'04
'05
'06
'07
'08
'09
'10
'11
'12
'13
'14
'15
'16
Commercial / Industrial Institutional
40
42
44
46
48
50
52
54
56
58
Ju
n-1
1
De
c-1
1
Ju
n-1
2
De
c-1
2
Ju
n-1
3
De
c-1
3
Ju
n-1
4
De
c-1
4
Ju
n-1
5
De
c-1
5
Ju
n-1
6
Seasonally Adjusted
Seasonally Adjusted Seasonally Adjusted
June: 52.6 58.6 50.3 52.7
June: 49.7 134.4
ABI: Derived from the AIA’s monthly Work-on-the-Boards survey, an index score above 50 denotes increased billing from prior month, and v ice versa.
DMI: 12-month indicator of future construction spending and demand for construction products / services.
20
25
30
35
40
45
50
55
60
65
70
'03
'04
'05
'06
'07
'08
'09
'10
'11
'12
'13
'14
'15
'16
Billings Inquiries
50
75
100
125
150
175
200
'02
'03
'04
'05
'06
'07
'08
'09
'10
'11
'12
'13
'14
'15
'16

PAGE |
OUR GROUP
Harris Williams & Co. is a leading adv isor to the energy, power, and infrastructure M&A market. Our Energy, Power &Infrastructure Group has experience across a broad range of sectors, including serv ices, products, and technologiesthat support or enhance energy and power infrastructure.
ENERGY, POWER & INFRASTRUCTURE
INDUSTRY UPDATE │ JULY 2016
SELECT RELEVANT EXPERIENCE
Oil & Gas Equipment and Services
Coal Products and Services
Energy
Pow er Products and Technology
Electric and Natural Gas Transmission and Distribution
Energy Efficiency and Clean Technology
Renew able Energy Services and Equipment
Power SELECT RELEVANT EXPERIENCE
Industrial and Infrastructure Services
Engineering and Construction
Environmental Services
Infrastructure SELECT RELEVANT EXPERIENCE
.
a portfolio company of
has been acquired by
.
a portfolio company of
has been acquired by
.
a subsidiary of
has been acquired by
.
a portfolio company of
has been acquired by
.
a portfolio company of
Tanglewood Investments, Inc.
has been acquired by
.has been acquired by
.
a portfolio company of
has been acquired by
12
.
a portfolio company of
has been acquired by
&.
a portfolio company of
has been acquired by
.
a portfolio company of
has been acquired by
.
holdings of
have been acquired by
and
.
a portfolio company of
has been acquired by

PAGE |
Energy, Pow er& Infrastructure
IndustrialsHealthcare & Life Sciences
Transportation & Logistics
Aerospace, Defense & Government
Services
Business Services
Building Products & M aterials
Technology, M edia & Telecom
Specialty Distribution
Consumer
HARRIS WILLIAMS & CO. OFFICE LOCATIONS
UNITED STATES EUROPE
BostonTw o International Place24th FloorBoston, M assachusetts 02110Phone: +1 (617) 482-7501
Cleveland1900 East 9th Street20th FloorCleveland, Ohio 44114Phone: +1 (216) 689-2400
Minneapolis222 South 9th StreetSuite 3350M inneapolis, M innesota 55402Phone: +1 (612) 359-2700
Richmond (Headquarters)1001 Haxall Point9th FloorRichmond, Virginia 23219Phone: +1 (804) 648-0072
San Francisco575 M arket Street31st FloorSan Francisco, California 94105Phone: +1 (415) 288-4260
FrankfurtBockenheimer Landstrasse 33-3560325 FrankfurtGermanyPhone: +49 069 3650638 00
London63 Brook StreetLondon W1K 4HS, EnglandPhone: +44 (0) 20 7518 8900
NETWORK OFFICES
Beijing
Hong Kong
Mumbai
New Delhi
Shanghai
Energy, Power& Infrastructure
Harris Williams & Co. has a broad range of industry expertise, which creates powerful opportunities.Our clients benefit from our deep-sector experience, integrated industry intelligence andcollaboration across the firm, and our commitment to learning what makes them unique. For moreinformation, visit our website at www.harriswilliams.com/industries.
ENERGY, POWER & INFRASTRUCTURE
INDUSTRY UPDATE │ JULY 2016
OUR FIRM
13
PAGE |
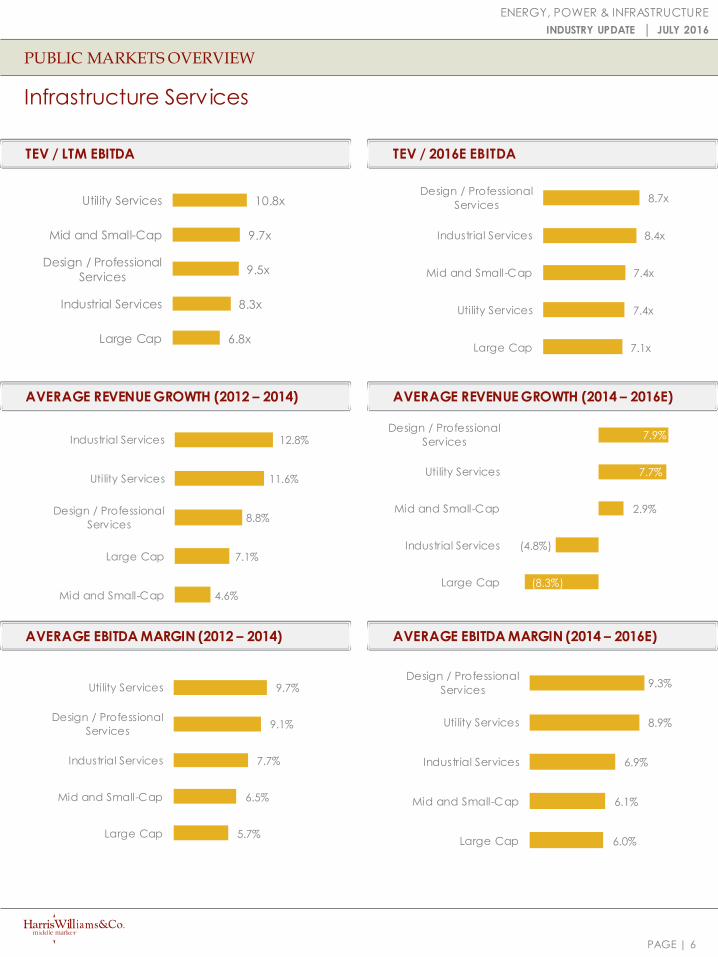
PUBLIC COMPARABLES
14
ENERGY, POWER & INFRASTRUCTURE
INDUSTRY UPDATE │ JULY 2016
Stock Performance
Stock Price Change from 52-Week TEV / EBITDA EBITDA
TEV Jul-16 Jun-16 Prior Month Prior Year High % of High Jul-15 Jan-16 Current 2015 2016E
Energy Services and Equipment
Large Cap Service
Schlumberger NV $108,821 $80.71 $76.66 5.3% (2.6%) $85.81 94.1% 8.9x 8.9x 12.8x 11.1x 16.5x
Halliburton Co. 46,402 42.54 43.92 (3.1%) 2.0% 46.69 91.1% 6.8x 8.2x 17.3x 12.6x 23.1x
Baker Hughes, Inc. 21,218 43.71 45.22 (3.3%) (25.5%) 60.17 72.6% 8.1x 11.7x 14.7x 13.0x NM
Weatherford International Plc 11,292 5.69 5.91 (3.7%) (46.5%) 11.49 49.5% 8.2x 14.4x 28.9x 14.2x NM
Median (3.2%) (14.1%) 81.9% 8.1x 10.3x 16.0x 12.8x 19.8x
Equipment
National Oilwell Varco, Inc. $13,387 $31.26 $34.06 (8.2%) (26.0%) $44.12 70.9% 4.5x 5.0x 7.1x 5.0x NM
FMC Technologies, Inc. 6,036 25.24 25.90 (2.5%) (23.1%) 35.93 70.2% 6.3x 5.1x 9.2x 5.8x 10.7x
Oceaneering International, Inc. 3,082 27.20 30.32 (10.3%) (30.5%) 48.11 56.5% 5.7x 5.4x 6.0x 4.8x 7.8x
Dril-Quip, Inc. 1,696 55.92 59.86 (6.6%) (9.0%) 69.43 80.5% 6.6x 6.0x 6.7x 6.2x 10.6x
Forum Energy Technologies, Inc. 1,634 15.12 16.83 (10.2%) 1.8% 19.32 78.3% 6.8x 8.9x 24.8x 12.8x NM
Oil States International, Inc. 1,499 28.86 32.02 (9.9%) (2.9%) 36.73 78.6% 5.7x 7.4x 11.5x 8.3x NM
Median (9.0%) (16.1%) 74.6% 6.0x 5.7x 8.2x 6.0x 10.6x
Mid and Small-Cap Service
Superior Energy Services, Inc. $3,554 $16.51 $18.55 (11.0%) (9.1%) $19.83 83.3% 4.2x 5.3x 11.8x 8.0x 26.1x
U.S. Silica Holdings, Inc. 1,874 33.94 34.39 (1.3%) 59.5% 37.18 91.3% 6.8x 12.5x NM 22.0x NM
TETRA Technologies, Inc. 1,500 6.07 6.02 0.8% 21.4% 9.44 64.3% 8.7x 6.6x 7.6x 6.5x 11.5x
Ensign Energy Services, Inc. 1,379 5.51 5.47 0.7% (27.6%) 8.29 66.5% 4.3x 4.7x 6.7x 5.5x 10.2x
C&J Energy Services Ltd. 1,183 0.33 0.71 (53.4%) (96.6%) 10.35 3.2% 11.2x NM NM NM NM
Basic Energy Services, Inc. 897 0.91 1.63 (44.2%) (84.0%) 7.18 12.7% 5.2x NM NM NM NM
Calfrac Well Services Ltd. 885 2.37 2.61 (9.1%) (48.7%) 5.14 46.2% 4.2x NM NM NM NM
Key Energy Services, Inc. 817 0.16 0.23 (29.0%) (86.6%) 1.36 12.0% NM NM NM NM NM
Trican Well Service Ltd. 422 1.51 1.73 (12.5%) (29.2%) 2.31 65.4% 5.6x NM NM NM NM
CARBO Ceramics, Inc. 297 11.94 13.83 (13.7%) (64.2%) 38.56 31.0% 16.0x NM NM NM NM
Median (11.7%) (39.0%) 55.2% 5.6x 5.9x 7.6x 7.2x 11.5x
OCTG
Tenaris SA $14,291 $13.30 $13.83 (3.8%) 7.3% $14.87 89.5% 6.3x 8.3x 15.5x 11.5x 17.8x
TMK PAO 3,369 2.86 2.75 4.2% (31.8%) 4.40 65.0% 5.2x 5.3x 6.7x 5.7x 5.5x
Vallourec SA 3,175 3.63 3.46 5.0% (65.3%) 10.83 33.5% 7.4x NM NM NM NM
Median 4.2% (31.8%) 65.0% 6.3x 6.8x 11.1x 8.6x 11.7x
Distribution
MRC Global, Inc. $2,051 $12.86 $14.02 (8.3%) (2.7%) $15.49 83.0% 6.7x 6.4x 9.5x 7.3x NM
NOW, Inc. 1,916 18.52 18.27 1.4% 0.7% 20.78 89.1% 28.5x NM NM NM NM
Median (3.5%) (1.0%) 86.1% 17.6x 6.4x 9.5x 7.3x NM
TEV / LTM EBITDA as of

PAGE |
PUBLIC COMPARABLES
15
ENERGY, POWER & INFRASTRUCTURE
INDUSTRY UPDATE │ JULY 2016
Revenue Revenue Growth EBITDA EBITDA Margin Avg. Margin
2012 2013 2014 2015 2016E '12-14 '14-16E 2012 2013 2014 2015 2016E 2012 2013 2014 2015 2016E '12-14 '14-16E
Energy Services and Equipment
Large Cap Service
Schlumberger NV $41,731 $45,266 $48,580 $35,475 $28,364 7.9% (23.6%) $10,746 $11,963 $13,679 $9,798 $6,585 25.8% 26.4% 28.2% 27.6% 23.2% 26.8% 26.3%
Halliburton Co. 28,503 29,402 32,870 23,633 15,924 7.4% (30.4%) 6,087 6,130 7,174 3,671 2,011 21.4% 20.8% 21.8% 15.5% 12.6% 21.3% 16.7%
Baker Hughes, Inc. 21,361 22,364 24,551 15,742 9,677 7.2% (37.2%) 3,824 3,668 4,904 1,627 512 17.9% 16.4% 20.0% 10.3% 5.3% 18.1% 11.9%
Weatherford International Plc 15,215 15,263 14,911 9,433 6,002 (1.0%) (36.6%) 2,445 2,148 2,514 798 301 16.1% 14.1% 16.9% 8.5% 5.0% 15.7% 10.1%
Total $106,810 $112,295 $120,912 $84,283 $59,966 5.4% (31.9%) $23,102 $23,909 $28,271 $15,894 $9,410 21.6% 21.3% 23.4% 18.9% 15.7% 20.5% 16.2%
Equipment
National Oilwell Varco, Inc. $20,035 $20,035 $21,414 $14,738 $7,439 3.4% (41.1%) $4,153 $4,153 $4,610 $2,657 $214 20.7% 20.7% 21.5% 18.0% 2.9% 21.0% 14.1%
FMC Technologies, Inc. 6,140 7,137 7,958 6,482 4,711 13.8% (23.1%) 701 925 1,310 1,038 565 11.4% 13.0% 16.5% 16.0% 12.0% 13.6% 14.8%
Oceaneering International, Inc. 2,783 3,287 3,660 3,063 2,381 14.7% (19.3%) 605 751 858 640 395 21.7% 22.8% 23.4% 20.9% 16.6% 22.7% 20.3%
Dril-Quip, Inc. 733 733 931 844 585 12.7% (20.8%) 188 188 305 274 160 25.6% 25.6% 32.8% 32.5% 27.4% 28.0% 30.9%
Forum Energy Technologies, Inc. 1,415 1,525 1,525 1,074 607 3.8% (36.9%) 290 274 274 127 (24) 20.5% 18.0% 18.0% 11.8% (3.9%) 18.8% 8.6%
Oil States International, Inc. 3,479 3,479 1,820 1,100 681 (27.7%) (38.8%) 699 699 435 182 40 20.1% 20.1% 23.9% 16.5% 6.0% 21.4% 15.5%
Total $34,585 $36,196 $37,307 $27,301 $16,403 3.5% (30.0%) $6,636 $6,990 $7,793 $4,918 $1,351 19.2% 19.3% 20.9% 18.0% 8.2% 20.9% 17.4%
Mid and Small-Cap Service
Superior Energy Services, Inc. $4,568 $4,568 $4,568 $2,775 $1,535 0.0% (42.0%) $1,246 $1,246 $1,246 $445 $136 27.3% 27.3% 27.3% 16.0% 8.9% 27.3% 17.4%
U.S. Silica Holdings, Inc. 442 546 546 643 501 11.2% (4.2%) 141 151 151 85 19 31.8% 27.6% 27.6% 13.2% 3.9% 29.0% 14.9%
TETRA Technologies, Inc. 881 909 1,078 1,130 793 10.6% (14.2%) 123 91 113 231 131 13.9% 10.0% 10.5% 20.4% 16.5% 11.5% 15.8%
Ensign Energy Services, Inc. 2,198 2,036 2,102 1,087 665 (2.2%) (43.7%) 565 469 499 251 135 25.7% 23.1% 23.7% 23.1% 20.4% 24.2% 22.4%
C&J Energy Services Ltd. 1,112 1,070 1,070 1,749 961 (1.9%) (5.2%) 336 189 189 12 (107) 30.2% 17.7% 17.7% 0.7% (11.1%) 21.9% 2.4%
Basic Energy Services, Inc. 1,375 1,263 1,491 806 519 4.1% (41.0%) 299 231 313 19 (37) 21.7% 18.3% 21.0% 2.4% (7.2%) 20.3% 5.4%
Calfrac Well Services Ltd. 1,596 1,518 2,261 1,169 601 19.0% (48.4%) 257 183 330 22 (12) 16.1% 12.0% 14.6% 1.9% (2.0%) 14.2% 4.8%
Key Energy Services, Inc. 1,960 1,592 1,427 792 423 (14.7%) (45.6%) 421 266 119 (132) (24) 21.5% 16.7% 8.3% (16.7%) (5.7%) 15.5% (4.7%)
Trican Well Service Ltd. 2,214 2,053 2,448 929 306 5.2% (64.7%) 240 188 236 (70) (25) 10.8% 9.2% 9.6% (7.6%) (8.1%) 9.9% (2.0%)
CARBO Ceramics, Inc. 646 667 648 280 115 0.2% (57.8%) 204 172 159 (40) (54) 31.6% 25.8% 24.5% (14.4%) (47.2%) 27.3% (12.4%)
Total $16,991 $16,223 $17,640 $11,359 $6,419 3.2% (36.7%) $3,831 $3,186 $3,354 $822 $162 22.5% 19.6% 19.0% 7.2% 2.5% 20.1% 6.4%
OCTG
Tenaris SA $10,834 $10,597 $10,338 $7,101 $5,114 (2.3%) (29.7%) $2,852 $2,781 $2,692 $1,240 $802 26.3% 26.2% 26.0% 17.5% 15.7% 26.2% 19.7%
TMK PAO 6,688 6,432 6,009 4,127 4,342 (5.2%) (15.0%) 1,001 916 777 592 613 15.0% 14.2% 12.9% 14.4% 14.1% 14.0% 13.8%
Vallourec SA 6,841 7,406 7,561 4,218 3,266 5.1% (34.3%) 989 1,230 1,102 (105) (255) 14.5% 16.6% 14.6% (2.5%) (7.8%) 15.2% 1.4%
Total $24,363 $24,435 $23,908 $15,445 $12,722 (0.8%) (26.3%) $4,842 $4,926 $4,571 $1,727 $1,160 19.9% 20.2% 19.1% 11.2% 9.1% 18.5% 11.7%
Distribution
MRC Global, Inc. $5,571 $5,231 $5,231 $4,529 $3,108 (3.1%) (22.9%) $475 $386 $386 $280 $66 8.5% 7.4% 7.4% 6.2% 2.1% 7.8% 5.2%
NOW, Inc. 3,414 4,296 4,105 3,010 1,995 9.7% (30.3%) 180 241 202 (79) (191) 5.3% 5.6% 4.9% (2.6%) (9.6%) 5.3% (2.4%)
Total $8,985 $9,527 $9,336 $7,539 $5,103 3.3% (26.6%) $655 $627 $588 $201 ($126) 7.3% 6.6% 6.3% 2.7% (2.5%) 6.5% 1.4%

PAGE |
PUBLIC COMPARABLES
16
ENERGY, POWER & INFRASTRUCTURE
INDUSTRY UPDATE │ JULY 2016
Stock Performance
Stock Price Change from 52-Week TEV / EBITDA EBITDA
TEV Jul-16 Jun-16 Prior Month Prior Year High % of High Jul-15 Jan-16 Current 2015 2016E
Energy Services and Equipment
Logistics
ATCO Ltd. $12,688 $36.61 $34.54 6.0% 25.1% $36.92 99.2% 8.6x 8.9x 10.4x 10.5x 8.6x
Tidewater, Inc. 1,588 4.36 4.68 (6.8%) (77.4%) 21.01 20.8% 6.2x 6.7x 7.5x 7.5x 20.6x
Bristow Group, Inc. 1,482 11.90 13.21 (9.9%) (73.8%) 47.06 25.3% 9.2x 7.1x 7.5x 7.5x 5.1x
Hornbeck Offshore Services 1,106 7.99 8.84 (9.6%) (52.3%) 20.98 38.1% 5.2x 5.2x 6.3x 5.3x 14.3x
Civeo Corp. 556 1.39 1.80 (22.8%) (31.2%) 2.40 57.9% 2.7x 3.7x 5.8x 4.2x 7.4x
GulfMark Offshore, Inc. 546 3.22 3.21 0.3% (65.7%) 10.68 30.1% 6.4x 9.6x 12.4x 9.5x NM
Median (8.2%) (59.0%) 34.1% 6.3x 6.9x 7.5x 7.5x 8.6x
Offshore Drillers
Transocean Ltd. $9,881 $11.09 $11.27 (1.6%) (16.4%) 17.19 64.5% 2.6x 2.8x 3.1x 2.9x 6.5x
Ensco Plc 6,600 9.12 9.94 (8.2%) (47.5%) 18.93 48.2% 3.6x 3.2x 3.5x 3.1x 5.0x
Noble Corp. Plc 6,470 7.57 8.68 (12.8%) (38.3%) 14.64 51.7% 6.9x 3.2x 3.5x 3.3x 6.7x
Diamond Offshore Drilling, Inc. 4,992 23.03 24.60 (6.4%) 7.6% 26.72 86.2% 4.9x 4.1x 4.8x 4.7x 7.1x
Rowan Cos. Plc 4,073 15.84 17.75 (10.8%) (5.7%) 21.83 72.6% 5.1x 3.5x 3.9x 4.0x 4.9x
Atwood Oceanics, Inc. 2,106 11.37 12.25 (7.2%) (46.3%) 22.99 49.5% 4.1x 2.5x 2.9x 2.7x 3.7x
Median (7.7%) (27.3%) 58.1% 4.5x 3.2x 3.5x 3.2x 5.8x
Land Drillers
Helmerich & Payne, Inc. $6,432 $62.92 $66.09 (4.8%) 12.5% 70.28 89.5% 3.9x 4.3x 7.8x 4.9x 16.0x
Nabors Industries Ltd. 5,924 9.23 10.06 (8.3%) (19.3%) 12.53 73.7% 4.1x 4.6x 6.8x 5.5x 10.7x
Patterson-UTI Energy, Inc. 3,551 19.83 20.41 (2.8%) 23.1% 22.12 89.6% 3.5x 4.1x 7.8x 6.1x 18.4x
Precision Drilling Corp. 2,512 4.40 5.13 (14.2%) (8.6%) 6.08 72.4% 4.4x 5.4x 9.2x 6.5x 13.7x
Pioneer Energy Services Corp. 624 3.90 4.39 (11.2%) 4.0% 5.05 77.2% 2.8x 4.2x 8.4x 5.7x NM
Median (8.3%) 4.0% 77.2% 3.9x 4.3x 7.8x 5.7x 14.9x
Engineering & Construction
Saipem SpA $10,428 $0.45 $0.40 12.5% (55.5%) 1.17 38.6% 20.8x 15.4x 19.3x 19.0x 7.4x
Petrofac Ltd. 4,877 10.01 10.09 (0.7%) (23.4%) 14.74 67.9% 12.4x 19.3x 19.0x 19.0x 6.6x
Technip SA 4,413 53.60 53.11 0.9% (1.1%) 61.37 87.3% 5.2x 3.7x 3.5x 3.7x 3.5x
Subsea 7 SA 2,844 10.26 9.31 10.2% 21.4% 10.75 95.4% 2.5x 1.0x 2.2x 2.2x 3.7x
McDermott International, Inc. 1,230 4.71 4.80 (1.9%) 9.5% 6.00 78.5% 7.4x 3.7x 4.7x 6.0x 5.2x
Median 0.9% (1.1%) 78.5% 7.4x 3.7x 4.7x 6.0x 5.2x
TEV / LTM EBITDA as of

PAGE |
PUBLIC COMPARABLES
17
ENERGY, POWER & INFRASTRUCTURE
INDUSTRY UPDATE │ JULY 2016
Revenue Revenue Growth EBITDA EBITDA Margin Avg. Margin
2012 2013 2014 2015 2016E '12-14 '14-16E 2012 2013 2014 2015 2016E 2012 2013 2014 2015 2016E '12-14 '14-16E
Energy Services and Equipment
Logistics
ATCO Ltd. $4,364 $4,230 $4,123 $3,229 $3,334 (2.8%) (10.1%) $1,642 $1,677 $1,537 $1,205 $1,469 37.6% 39.6% 37.3% 37.3% 44.1% 38.2% 39.6%
Tidewater, Inc. 1,244 1,435 1,496 979 644 9.6% (34.4%) 347 417 416 212 77 27.9% 29.1% 27.8% 21.6% 12.0% 28.3% 20.5%
Bristow Group, Inc. 1,508 1,670 1,859 1,716 1,542 11.0% (8.9%) 289 278 303 198 291 19.2% 16.6% 16.3% 11.6% 18.8% 17.4% 15.6%
Hornbeck Offshore Services, Inc. (Louisiana) 513 548 635 476 268 11.3% (35.1%) 209 255 284 209 77 40.7% 46.6% 44.7% 43.8% 28.9% 44.0% 39.1%
Civeo Corp. 1,109 1,109 943 518 400 (7.8%) (34.9%) 492 492 334 131 75 44.4% 44.4% 35.4% 25.3% 18.8% 41.4% 26.5%
GulfMark Offshore, Inc. 389 455 496 275 134 12.9% (48.0%) 103 159 172 58 14 26.5% 34.9% 34.7% 21.0% 10.3% 32.0% 22.0%
Total $9,127 $9,447 $9,551 $7,192 $6,321 5.7% (28.6%) $3,082 $3,279 $3,046 $2,012 $2,003 33.8% 34.7% 31.9% 28.0% 31.7% 33.5% 27.2%
Offshore Drillers
Transocean Ltd. $9,196 $9,196 $9,196 $7,386 $3,877 0.0% (35.1%) $2,808 $2,808 $2,808 $3,450 $1,510 30.5% 30.5% 30.5% 46.7% 38.9% 30.5% 38.7%
Ensco Plc 4,301 4,920 4,565 4,063 2,753 3.0% (22.3%) 2,123 2,373 2,355 2,098 1,311 49.4% 48.2% 51.6% 51.6% 47.6% 49.7% 50.3%
Noble Corp. Plc 3,547 3,547 3,233 3,352 2,018 (4.5%) (21.0%) 1,530 1,530 1,563 1,975 967 43.1% 43.1% 48.4% 58.9% 47.9% 44.9% 51.7%
Diamond Offshore Drilling, Inc. 2,987 2,920 2,815 2,419 1,646 (2.9%) (23.5%) 1,345 1,200 1,134 1,068 702 45.0% 41.1% 40.3% 44.1% 42.7% 42.1% 42.4%
Rowan Cos. Plc 1,393 1,579 1,824 2,137 1,736 14.5% (2.4%) 526 587 707 1,028 832 37.8% 37.2% 38.8% 48.1% 48.0% 37.9% 44.9%
Atwood Oceanics, Inc. 787 1,064 1,174 1,396 1,036 22.1% (6.0%) 390 547 550 779 577 49.6% 51.4% 46.9% 55.8% 55.7% 49.3% 52.8%
Total $22,210 $23,226 $22,806 $20,754 $13,065 5.4% (18.4%) $8,723 $9,044 $9,117 $10,398 $5,899 39.3% 38.9% 40.0% 50.1% 45.1% 42.4% 46.8%
Land Drillers
Helmerich & Payne, Inc. $3,152 $3,388 $3,720 $3,165 $1,404 8.6% (38.6%) $1,278 $1,393 $1,559 $1,310 $402 40.5% 41.1% 41.9% 41.4% 28.6% 41.2% 37.3%
Nabors Industries Ltd. 6,990 6,152 6,804 3,864 2,124 (1.3%) (44.1%) 1,974 1,639 1,749 1,079 555 28.2% 26.6% 25.7% 27.9% 26.1% 26.9% 26.6%
Patterson-UTI Energy, Inc. 2,723 2,716 3,182 1,891 881 8.1% (47.4%) 990 916 986 585 193 36.4% 33.7% 31.0% 30.9% 21.9% 33.7% 28.0%
Precision Drilling Corp. 2,041 1,970 2,128 1,216 700 2.1% (42.7%) 671 620 725 387 183 32.9% 31.5% 34.1% 31.8% 26.1% 32.8% 30.7%
Pioneer Energy Services Corp. 919 960 1,055 541 285 7.1% (48.0%) 246 235 263 109 18 26.8% 24.4% 24.9% 20.2% 6.3% 25.4% 17.1%
Total $15,826 $15,186 $16,890 $10,678 $5,394 4.9% (44.2%) $5,159 $4,803 $5,282 $3,470 $1,351 32.6% 31.6% 31.3% 32.5% 25.0% 32.0% 27.9%
Engineering & Construction
Saipem SpA $17,172 $15,720 $17,075 $12,760 $11,741 (0.3%) (17.1%) $2,813 $915 $1,596 $550 $1,415 16.4% 5.8% 9.3% 4.3% 12.0% 10.5% 8.6%
Petrofac Ltd. 6,240 6,329 6,241 6,844 7,870 0.0% 12.3% 843 1,014 882 257 737 13.5% 16.0% 14.1% 3.8% 9.4% 14.6% 9.1%
Technip SA 10,538 11,746 13,362 11,464 11,762 12.6% (6.2%) 1,283 1,343 1,352 1,181 1,261 12.2% 11.4% 10.1% 10.3% 10.7% 11.2% 10.4%
Subsea 7 SA 6,297 6,297 6,870 4,758 3,630 4.5% (27.3%) 1,084 844 1,353 1,268 761 17.2% 13.4% 19.7% 26.6% 21.0% 16.8% 22.4%
McDermott International, Inc. 3,642 2,659 2,301 3,070 2,712 (20.5%) 8.6% 441 (236) 66 204 236 12.1% (8.9%) 2.9% 6.6% 8.7% 2.0% 6.1%
Total $43,888 $42,752 $45,850 $38,897 $37,714 (0.7%) (5.9%) $6,464 $3,879 $5,248 $3,460 $4,410 14.7% 9.1% 11.4% 8.9% 11.7% 11.0% 11.3%

PAGE |
PUBLIC COMPARABLES
18
ENERGY, POWER & INFRASTRUCTURE
INDUSTRY UPDATE │ JULY 2016
Stock Performance
Stock Price Change from 52-Week TEV / EBITDA EBITDA
TEV Jul-16 Jun-16 Prior Month Prior Year High % of High Jul-15 Jan-16 Current 2015 2016E
Power Services and Equipment
Large Cap Equipment and Services
General Electric Co. $358,524 $31.64 $29.82 6.1% (1.3%) $33.00 95.9% 15.8x 17.0x 14.3x 14.7x 17.0x
Siemens 114,452 104.71 100.62 4.1% 0.6% 111.69 93.8% 10.5x 10.3x 11.8x 12.3x 10.4x
Honeywell International, Inc. 98,195 115.45 112.98 2.2% (0.1%) 120.02 96.2% 11.2x 10.2x 12.0x 12.1x 11.7x
ABB Ltd. 47,663 20.83 20.26 2.8% 0.1% 21.76 95.7% 9.9x 7.7x 9.9x 9.6x 10.3x
Schneider Electric SE 41,007 62.29 57.93 7.5% 0.8% 71.61 87.0% 9.6x 7.2x 8.5x 8.5x 9.5x
Emerson Electric Co. 39,804 55.49 50.83 9.2% (0.6%) 56.82 97.7% 8.0x 7.4x 9.4x 8.8x 10.6x
Eaton Corp. Plc 37,226 63.25 58.03 9.0% (0.2%) 64.71 97.7% 10.4x 8.8x 10.9x 10.9x 11.3x
Median 6.1% (0.1%) 95.9% 10.4x 8.8x 10.9x 10.9x 10.6x
Mid and Small-Cap Equipment and Services
AMETEK, Inc. $12,909 $46.89 $44.70 4.9% (1.0%) $57.67 81.3% 13.6x 11.6x 12.1x 11.8x 12.3x
Hubbell, Inc. 6,554 104.23 100.91 3.3% (1.3%) 111.23 93.7% 10.5x 9.1x 11.2x 11.2x 11.3x
Valmont Industries, Inc. 3,371 129.92 132.16 (1.7%) (1.1%) 145.94 89.0% 8.2x 9.2x 11.0x 11.1x 9.8x
Littelfuse, Inc. 2,791 118.88 116.04 2.4% (0.7%) 124.59 95.4% 12.1x 9.3x 11.6x 12.6x 12.1x
AZZ, Inc. 1,918 61.59 57.23 7.6% (0.9%) 63.35 97.2% 10.3x 9.3x 11.0x 11.2x 10.0x
ESCO Technologies, Inc. 1,151 42.00 39.43 6.5% (1.0%) 42.80 98.1% 12.0x 10.4x 13.1x 14.0x 10.9x
Badger Meter, Inc. 1,058 69.62 69.44 0.3% (2.8%) 78.72 88.4% 14.3x 13.3x 14.6x 16.8x 15.3x
Thermon Group Holdings, Inc. 674 20.25 19.43 4.2% (0.8%) 24.46 82.8% 10.4x 8.2x 8.2x 8.2x 10.7x
Babcock & Wilcox Enterprises, Inc. 473 15.20 19.73 (23.0%) 0.9% 23.99 63.4% NA 6.9x 6.7x 5.5x 5.7x
Powell Industries, Inc. 365 36.66 36.68 (0.1%) (0.1%) 40.05 91.5% 9.0x 5.1x 7.7x 9.5x 13.4x
Median 2.9% (0.9%) 90.3% 10.5x 9.2x 11.1x 11.2x 11.1x
Energy Efficiency and Clean Technology
SolarCity Corp. $6,359 $27.37 $22.20 23.3% 3.5% $61.72 44.3% NM NM NM NM NM
Itron, Inc. 1,910 42.79 41.95 2.0% (2.4%) 45.71 93.6% 12.0x 4.9x 6.5x 6.5x 9.5x
Silver Spring Networks, Inc. 509 12.54 10.91 14.9% 0.5% 16.18 77.5% NM 4.5x 11.3x 5.2x NM
Ameresco, Inc. 320 5.04 4.72 6.8% (1.4%) 7.27 69.3% 9.0x 8.6x 7.2x 8.4x 6.0x
EnerNOC, Inc. 213 7.10 6.13 15.8% (0.6%) 11.21 63.3% 3.8x NM NM NM NM
Median 14.9% (0.6%) 69.3% 9.0x 4.9x 7.2x 6.5x 7.8x
TEV / LTM EBITDA as of

PAGE |
PUBLIC COMPARABLES
19
ENERGY, POWER & INFRASTRUCTURE
INDUSTRY UPDATE │ JULY 2016
Revenue Revenue Growth EBITDA EBITDA Margin Avg. Margin
2012 2013 2014 2015 2016E '12-14 '14-16E 2012 2013 2014 2015 2016E 2012 2013 2014 2015 2016E '12-14 '14-16E
Power Services and Equipment
Large Cap Equipment and Services
General Electric Co. $144,909 $142,461 $148,940 $122,364 $125,520 1.4% (8.2%) $37,052 $33,285 $38,579 $24,357 $21,527 25.6% 23.4% 25.9% 19.9% 17.2% 24.9% 21.0%
Siemens AG 100,332 96,332 96,607 86,622 87,465 (1.9%) (4.8%) 11,669 10,538 11,319 9,297 10,969 11.6% 10.9% 11.7% 10.7% 12.5% 11.4% 11.7%
Honeywell International, Inc. 37,672 39,062 40,301 38,564 40,372 3.4% 0.1% 5,538 7,176 7,353 8,148 8,422 14.7% 18.4% 18.2% 21.1% 20.9% 17.1% 20.1%
ABB Ltd. 39,336 41,842 39,830 35,481 34,402 0.6% (7.1%) 5,530 6,113 5,152 4,982 4,631 14.1% 14.6% 12.9% 14.0% 13.5% 13.9% 13.5%
Schneider Electric SE 30,758 31,056 33,080 29,542 28,191 3.7% (7.7%) 5,209 5,200 5,363 4,825 4,309 16.9% 16.7% 16.2% 16.3% 15.3% 16.6% 15.9%
Emerson Electric Co. 24,409 24,645 24,527 22,304 20,640 0.2% (8.3%) 4,948 4,894 5,051 4,501 3,763 20.3% 19.9% 20.6% 20.2% 18.2% 20.2% 19.7%
Eaton Corp. Plc 16,311 22,046 22,552 20,855 19,927 17.6% (6.0%) 2,357 3,308 3,675 3,427 3,292 14.5% 15.0% 16.3% 16.4% 16.5% 15.3% 16.4%
Total $393,727 $397,444 $405,838 $355,732 $356,518 3.6% (6.0%) $72,302 $70,514 $76,491 $59,537 $56,913 18.4% 17.7% 18.8% 16.7% 16.0% 17.1% 16.9%
Mid and Small-Cap Equipment and Services
AMETEK, Inc. $3,334 $3,594 $4,022 $3,974 $3,944 9.8% (1.0%) $851 $934 $1,037 $1,094 $1,047 25.5% 26.0% 25.8% 27.5% 26.6% 25.8% 26.6%
Hubbell, Inc. 3,044 3,184 3,359 3,390 3,508 5.0% 2.2% 539 578 596 583 580 17.7% 18.1% 17.7% 17.2% 16.5% 17.9% 17.2%
Valmont Industries, Inc. 3,030 3,304 3,123 2,619 2,503 1.5% (10.5%) 453 558 459 305 343 15.0% 16.9% 14.7% 11.6% 13.7% 15.5% 13.3%
Littelfuse, Inc. 668 758 852 868 1,018 12.9% 9.3% 139 166 182 221 230 20.8% 21.9% 21.3% 25.5% 22.6% 21.3% 23.1%
AZZ, Inc. 571 752 817 903 956 19.6% 8.2% 127 149 157 171 191 22.3% 19.8% 19.2% 18.9% 20.0% 20.4% 19.4%
ESCO Technologies, Inc. 688 490 531 537 584 (12.2%) 4.9% 95 73 82 82 106 13.8% 14.9% 15.4% 15.3% 18.1% 14.7% 16.3%
Badger Meter, Inc. 320 334 365 378 414 6.8% 6.5% 58 53 62 63 69 18.0% 15.8% 17.0% 16.7% 16.7% 16.9% 16.8%
Thermon Group Holdings, Inc. 284 277 277 302 285 (1.2%) 1.3% 71 73 73 82 63 24.9% 26.2% 26.2% 27.2% 22.1% 25.8% 25.2%
Babcock & Wilcox Enterprises, Inc. 2,039 1,923 1,589 1,757 1,782 (11.7%) 5.9% 216 298 4 86 83 10.6% 15.5% 0.2% 4.9% 4.6% 8.8% 3.3%
Powell Industries, Inc. 717 675 648 662 544 (5.0%) (8.4%) 61 63 43 38 27 8.6% 9.4% 6.6% 5.8% 5.0% 8.2% 5.8%
Total $14,695 $15,291 $15,583 $15,390 $15,538 2.6% 1.8% $2,610 $2,944 $2,694 $2,724 $2,740 17.8% 19.3% 17.3% 17.7% 17.6% 17.5% 16.7%
Energy Efficiency and Clean Technology
SolarCity Corp. $127 $164 $255 $400 $612 41.8% 54.9% ($70) ($107) ($236) ($479) ($598) (55.3%) (65.3%) (92.5%) (120.0%) (97.7%) (71.0%) (103.4%)
Itron, Inc. 2,178 1,949 1,971 2,062 1,921 (4.9%) (1.3%) 265 172 169 292 201 12.2% 8.8% 8.6% 14.1% 10.4% 9.9% 11.1%
Silver Spring Networks, Inc. 197 327 191 490 302 (1.4%) 25.6% (81) (35) (79) 99 17 (41.4%) (10.7%) (41.4%) 20.1% 5.5% (31.2%) (5.2%)
Ameresco, Inc. 631 574 593 631 655 (3.1%) 5.1% 48 26 38 38 53 7.6% 4.5% 6.4% 6.0% 8.2% 6.2% 6.9%
EnerNOC, Inc. 287 383 472 400 386 28.3% (9.5%) 13 56 53 (42) (40) 4.7% 14.7% 11.2% (10.4%) (10.2%) 10.2% (3.2%)
Total $3,420 $3,397 $3,482 $3,981 $3,875 12.2% 14.9% $175 $113 ($55) ($93) ($366) 5.1% 3.3% (1.6%) (2.3%) (9.5%) (15.2%) (18.8%)

PAGE |
PUBLIC COMPARABLES
20
ENERGY, POWER & INFRASTRUCTURE
INDUSTRY UPDATE │ JULY 2016
Stock Performance
Stock Price Change from 52-Week TEV / EBITDA EBITDA
TEV Jul-16 Jun-16 Prior Month Prior Year High % of High Jul-15 Jan-16 Current 2015 2016E
Infrastructure Services
Large Cap Infrastructure Services
Fluor Corp. $7,379 $52.73 $48.78 8.1% 9.7% $55.69 94.7% 4.7x 4.6x 6.8x 6.5x 7.1x
Jacobs Engineering Group, Inc. 6,455 52.99 49.67 6.7% 33.9% 53.99 98.1% 6.1x 6.6x 9.4x 8.6x 9.7x
SNC-Lavalin Group, Inc. 6,183 41.92 40.60 3.2% 29.3% 44.21 94.8% 20.3x 9.6x 16.6x 16.2x 12.5x
Chicago Bridge & Iron Co. NV 5,713 35.35 34.13 3.6% (27.6%) 53.73 65.8% 5.8x 4.7x 4.9x 4.6x 5.5x
KBR, Inc. 1,292 14.57 13.12 11.1% (15.7%) 19.94 73.1% NM 5.0x 6.2x 6.2x 4.3x
Median 6.7% 9.7% 94.7% 6.0x 5.0x 6.8x 6.5x 7.1x
Mid and Small-Cap Infrastructure Services
Amec Foster Wheeler Plc $3,687 $5.96 $6.21 (4.1%) (51.4%) $13.28 44.9% 11.4x 6.3x 6.7x 6.7x 8.0x
Granite Construction, Inc. 1,990 49.06 42.91 14.3% 47.5% 50.53 97.1% 12.3x 9.4x 13.0x 12.4x 11.3x
Tutor Perini Corp. 1,893 24.52 22.84 7.4% 23.2% 25.98 94.4% 7.5x 7.3x 9.7x 11.1x 6.8x
Primoris Services Corp. 1,099 18.02 18.65 (3.4%) 7.1% 25.25 71.4% 7.8x 8.1x 8.0x 8.3x 6.8x
Aecon Group, Inc. 1,059 13.13 13.11 0.2% 55.8% 14.25 92.2% 8.6x 8.0x 9.9x 10.6x 8.0x
Great Lakes Dredge & Dock Corp. 620 4.46 4.50 (0.9%) (14.7%) 6.17 72.3% 8.0x 5.9x 6.4x 6.9x 6.8x
Orion Group Holdings, Inc. 260 5.34 5.06 5.5% (25.5%) 7.62 70.1% 6.4x 9.5x 11.1x 12.4x 4.9x
Willbros Group, Inc. 173 2.22 2.95 (24.7%) 172.7% 3.43 64.7% NM NM NM NM 8.1x
Median (0.4%) 15.1% 71.8% 8.0x 8.0x 9.7x 10.6x 7.4x
Utility Services
Quanta Services, Inc. $4,392 $25.42 $23.01 10.5% (5.9%) $27.93 91.0% 9.8x 7.7x 10.1x 8.8x 7.7x
Dycom Industries, Inc. 3,851 94.92 86.71 9.5% 48.5% 97.30 97.6% 12.3x 9.6x 11.5x 15.4x 10.1x
MasTec, Inc. 2,943 24.16 22.17 9.0% 40.5% 25.00 96.6% 7.5x 8.9x 13.3x 12.3x 7.0x
MYR Group, Inc. 456 24.51 23.35 5.0% (15.5%) 30.41 80.6% 6.0x 4.3x 6.1x 5.6x 6.2x
Median 9.2% 17.3% 93.8% 8.7x 8.3x 10.8x 10.6x 7.4x
Industrial Services
EMCOR Group, Inc. $3,057 $51.33 $47.63 7.8% 11.9% $52.49 97.8% 8.2x 7.1x 8.4x 8.5x 8.2x
Bilfinger SE 1,424 29.72 30.12 (1.3%) (27.8%) 49.13 60.5% 6.3x 8.9x 6.3x 6.3x 8.9x
Team, Inc. 1,001 27.19 25.22 7.8% (36.9%) 47.55 57.2% 13.2x 11.3x 13.7x 13.7x 8.6x
Aegion Corp. 972 20.20 18.30 10.4% 19.4% 22.41 90.1% 6.6x 6.5x 8.3x 8.1x 8.1x
MISTRAS Group, Inc. 839 25.14 24.00 4.8% 41.2% 26.47 95.0% 10.4x 9.7x 11.0x 11.5x 9.3x
Matrix Service Co. 370 16.22 15.77 2.9% (10.4%) 26.22 61.9% 12.8x 9.0x 5.4x 11.5x 5.7x
Median 6.3% 0.7% 76.0% 9.3x 9.0x 8.3x 10.0x 8.4x
Design / Professional Services
AECOM $9,449 $35.00 $30.87 13.4% 15.9% $35.21 99.4% 10.3x 8.0x 9.5x 9.4x 8.4x
WSP Global, Inc. 3,641 30.38 30.41 (0.1%) (6.8%) 37.99 80.0% 12.2x 9.0x 10.7x 10.7x 9.6x
Stantec, Inc. 2,678 25.04 24.79 1.0% (9.5%) 28.79 87.0% 11.2x 9.9x 11.9x 11.4x 8.7x
Tetra Tech, Inc. 2,153 32.37 30.31 6.8% 32.6% 33.03 98.0% 10.2x 8.0x 11.1x 11.5x 10.3x
Arcadis NV 1,848 15.20 14.97 1.5% (45.1%) 27.67 54.9% 10.0x 6.1x 6.5x 5.8x 6.8x
Atkins (WS) Plc 1,548 17.93 17.97 (0.2%) (23.9%) 24.87 72.1% 8.2x 7.2x 5.9x 5.9x 6.2x
RPS Group Plc 680 2.55 2.66 (4.3%) (24.7%) 3.83 66.5% 7.1x 7.9x 6.8x 6.8x 9.0x
Median 1.0% (9.5%) 80.0% 10.2x 8.0x 9.5x 9.4x 8.7x
TEV / LTM EBITDA as of

PAGE |
PUBLIC COMPARABLES
21
ENERGY, POWER & INFRASTRUCTURE
INDUSTRY UPDATE │ JULY 2016
Revenue Revenue Growth EBITDA EBITDA Margin Avg. Margin
2012 2013 2014 2015 2016E '12-14 '14-16E 2012 2013 2014 2015 2016E 2012 2013 2014 2015 2016E '12-14 '14-16E
Infrastructure Services
Large Cap Infrastructure Services
Fluor Corp. $27,577 $27,352 $21,532 $18,114 $18,587 (11.6%) (7.1%) $961 $1,399 $1,412 $1,127 $1,034 3.5% 5.1% 6.6% 6.2% 5.6% 5.1% 6.1%
Jacobs Engineering Group, Inc. 10,894 11,818 12,695 12,115 11,333 8.0% (5.5%) 703 768 776 752 663 6.5% 6.5% 6.1% 6.2% 5.8% 6.4% 6.1%
SNC-Lavalin Group, Inc. 7,979 7,569 7,304 7,371 6,856 (4.3%) (3.1%) 550 401 415 382 496 6.9% 5.3% 5.7% 5.2% 7.2% 6.0% 6.0%
Chicago Bridge & Iron Co. NV 5,485 11,095 12,975 12,930 11,420 53.8% (6.2%) 515 938 1,176 1,229 1,040 9.4% 8.5% 9.1% 9.5% 9.1% 9.0% 9.2%
KBR, Inc. 7,921 7,214 6,366 5,096 4,095 (10.4%) (19.8%) 512 246 (232) 209 298 6.5% 3.4% (3.6%) 4.1% 7.3% 2.1% 2.6%
Total $59,856 $65,048 $60,872 $55,625 $52,291 7.1% (8.3%) $3,240 $3,752 $3,547 $3,698 $3,530 5.4% 5.8% 5.8% 6.6% 6.8% 5.7% 6.0%
Mid and Small-Cap Infrastructure Services
Amec Foster Wheeler Plc $6,478 $6,212 $6,575 $8,334 $6,968 0.7% 2.9% $510 $511 $519 $550 $461 7.9% 8.2% 7.9% 6.6% 6.6% 8.0% 7.0%
Tutor Perini Corp. 4,111 4,176 4,492 4,944 5,338 4.5% 9.0% 214 260 295 171 277 5.2% 6.2% 6.6% 3.5% 5.2% 6.0% 5.1%
Granite Construction, Inc. 2,083 2,083 2,083 2,371 2,567 0.0% 11.0% 110 110 110 160 177 5.3% 5.3% 5.3% 6.8% 6.9% 5.3% 6.3%
Primoris Services Corp. 1,542 1,944 1,944 1,929 2,174 12.3% 5.8% 129 175 175 133 162 8.4% 9.0% 9.0% 6.9% 7.5% 8.8% 7.8%
Aecon Group, Inc. 2,888 2,978 2,367 2,281 2,367 (9.5%) 0.0% 121 119 97 100 133 4.2% 4.0% 4.1% 4.4% 5.6% 4.1% 4.7%
Great Lakes Dredge & Dock Corp. 630 731 807 857 850 13.2% 2.6% 86 78 75 89 92 13.7% 10.7% 9.3% 10.4% 10.8% 11.2% 10.2%
Orion Group Holdings, Inc. 292 355 386 466 627 14.9% 27.4% 7 21 33 21 53 2.5% 6.0% 8.6% 4.5% 8.5% 5.7% 7.2%
Willbros Group, Inc. 2,004 2,019 2,027 909 845 0.6% (35.4%) 76 76 40 (19) 21 3.8% 3.8% 2.0% (2.1%) 2.5% 3.2% 0.8%
Total $20,029 $20,498 $20,681 $22,092 $21,735 4.6% 2.9% $1,254 $1,352 $1,345 $1,206 $1,376 6.3% 6.6% 6.5% 5.5% 6.3% 6.5% 6.1%
Utility Services
Quanta Services, Inc. $5,920 $6,523 $7,851 $7,572 $7,695 15.2% (1.0%) $623 $689 $708 $497 $570 10.5% 10.6% 9.0% 6.6% 7.4% 10.0% 7.7%
Dycom Industries, Inc. 1,201 1,609 1,812 2,022 2,656 22.8% 21.1% 128 173 178 250 381 10.7% 10.8% 9.8% 12.4% 14.4% 10.4% 12.2%
MasTec, Inc. 3,727 4,325 4,612 4,208 4,878 11.2% 2.8% 331 427 404 239 419 8.9% 9.9% 8.8% 5.7% 8.6% 9.2% 7.7%
MYR Group, Inc. 999 903 944 1,062 1,097 (2.8%) 7.8% 80 88 92 81 74 8.0% 9.7% 9.7% 7.6% 6.7% 9.1% 8.0%
Total $11,847 $13,359 $15,219 $14,865 $16,326 11.6% 7.7% $1,162 $1,376 $1,381 $1,068 $1,444 9.8% 10.3% 9.1% 7.2% 8.8% 9.7% 8.9%
Industrial Services
EMCOR Group, Inc. $6,347 $6,417 $6,425 $6,719 $7,232 0.6% 6.1% $344 $289 $356 $362 $371 5.4% 4.5% 5.5% 5.4% 5.1% 5.2% 5.4%
Bilfinger SE 10,717 10,037 10,210 7,187 4,790 (2.4%) (31.5%) 562 564 368 225 161 5.2% 5.6% 3.6% 3.1% 3.4% 4.8% 3.4%
Team, Inc. 714 750 -- 980 1,272 NM NM 74 72 -- 73 117 10.4% 9.6% NA 7.5% 9.2% 10.0% 8.3%
Aegion Corp. 939 1,091 1,331 1,334 1,287 19.1% (1.7%) 87 109 126 120 120 9.3% 10.0% 9.5% 9.0% 9.3% 9.6% 9.3%
MISTRAS Group, Inc. 529 529 711 710 737 15.9% 1.8% 62 62 62 76 90 11.7% 11.7% 8.8% 10.7% 12.3% 10.7% 10.6%
Matrix Service Co. 739 893 1,263 1,343 1,291 30.7% 1.1% 43 50 82 32 65 5.8% 5.6% 6.5% 2.4% 5.0% 6.0% 4.6%
Total $19,985 $19,717 $19,941 $18,272 $16,608 12.8% (4.8%) $1,173 $1,145 $995 $888 $924 5.9% 5.8% 5.0% 4.9% 5.6% 7.7% 6.9%
Professional Services
AECOM $8,218 $8,153 $8,357 $17,990 $17,964 0.8% 46.6% $444 $447 $418 $1,004 $1,122 5.4% 5.5% 5.0% 5.6% 6.2% 5.3% 5.6%
WSP Global, Inc. 1,258 1,957 2,628 4,740 3,713 44.5% 18.9% 123 163 215 339 380 9.7% 8.3% 8.2% 7.2% 10.2% 8.8% 8.5%
Stantec, Inc. 1,871 2,170 2,291 2,249 2,512 10.7% 4.7% 222 247 264 235 307 11.8% 11.4% 11.5% 10.5% 12.2% 11.6% 11.4%
Tetra Tech, Inc. 2,022 2,025 1,860 1,719 1,908 (4.1%) 1.3% 205 134 149 187 209 10.1% 6.6% 8.0% 10.9% 11.0% 8.3% 10.0%
Arcadis NV 3,258 3,340 3,495 3,792 3,614 3.6% 1.7% 252 285 306 319 267 7.7% 8.5% 8.8% 8.4% 7.4% 8.3% 8.2%
Atkins (WS) Plc 2,694 2,778 2,828 2,804 2,691 2.5% (2.4%) 197 222 258 260 250 7.3% 8.0% 9.1% 9.3% 9.3% 8.1% 9.2%
RPS Group Plc 881 887 942 866 675 3.4% (15.4%) 112 116 127 99 75 12.8% 13.1% 13.5% 11.5% 11.2% 13.1% 12.1%
Total $20,201 $21,311 $22,400 $34,160 $33,077 8.8% 7.9% $1,554 $1,614 $1,738 $2,443 $2,610 7.7% 7.6% 7.8% 7.2% 7.9% 9.1% 9.3%

PAGE |
ENERGY, POWER & INFRASTRUCTURE
SOURCES
ENERGY, POWER & INFRASTRUCTURE
INDUSTRY UPDATE │ JULY 2016
1. Capital IQ.
2. MergerMarket.
3. Baker Hughes.
4. U.S. Department of Commerce
5. American Inst itute of Architects
6. Dodge Data & Analytics
DISCLOSURES
22
Harris W illiams & Co. (www.harriswilliams.com) is a preeminent middle market investment bank focused on the advisory needs of clients worldwide. The firm has deep industry knowledge, global t ransaction expertise, and an unw avering commitment to excellence. Harris Williams & Co. provides sell-side and acquisition advisory, restructuring advisory, board advisory, private placements, and capital markets advisory services.
Investment banking services are provided by Harris Williams LLC, a registered broker -dealer and member of FINRA and SIPC, and Harris Williams & Co. Ltd, w hich is authorised and regulated by the Financial Conduct Authority. Harris Williams & Co. is a t rade name under w hich Harris Williams LLC and Harris W illiams & Co. Ltd conduct business.
THIS REPORT MAY CONTAIN REFERENCES TO REGISTERED TRADEMARKS, SERVICE MARKS AND COPYRIGHTS OWNED BY THIRD-PARTY INFORMATION PROVIDERS. NONE OF THE THIRD-PARTY INFORMATION PROVIDERS IS ENDORSING THE OFFERING OF, AND SHALL NOT IN ANY WAY BE DEEMED AN ISS UER OR UNDERWRITER OF, THE SECURITIES, FINANCIAL INSTRUMENTS OR OTHER INVESTMENTS DISCUSSED IN THIS REPORT, AND SHALL NOT HAVE AN Y LIABILITY OR RESPONSIBILITY FOR ANY STATEMENTS MADE IN THE REPORT OR FOR ANY FINANCIAL STATEMENTS, FINANCIAL PROJECTIONS OR OTHER FINAN CIAL INFORMATION CONTAINED OR ATTACHED AS AN EXHIBIT TO THE REPORT. FOR MORE INFORMATION ABOUT THE MATERIALS PROVIDED BY SUCH THIRD PARTIES, PLEASE CONTACT US AT THE ABOVE ADDRESSES OR NUMBERS.
The information and v iew s contained in this report w ere prepared by Harris Williams & Co. (“Harris Williams”). It is not a re search report, as such term is defined by applicable law and regulat ions, and is provided for informational purposes only. It is not to be construed as an o ffer to buy or sell or a solicitation of an offer to buy or sell any financial instruments or to participate in any particular trading strategy. The i nformation contained herein is believed by Harris Williams to be reliable, but Harris Williams makes no representation as to the accuracy or completeness of such information. Harris W illiams and/or its affiliates may be market makers or specialists in, act as advisers or lenders to, have positions in and e ffect transactions in securities of companies ment ioned herein and also may provide, may have provided, or may seek to provide investment banking services for those companies. In addit ion, Harris Williams and/or its affiliates or their respective officers, directors and employees may hold long or short positions in the securit ies, options thereon or other related financial products of companies discussed herein. Opinions, estimates and projec tions in this report const itute Harris Williams’ judgment and are subject to change w ithout notice. The financial instruments discussed in this re port may not be suitable for all investors, and investors must make their ow n investment decisions using their own independent advisors as they believe ne cessary and based upon their specific financial situat ions and investment objectives. Also, past performance is not necessarily indicative of future results. No part of this material may be copied or duplicated in any form or by any means, or redistributed, w ithout Harris Williams’ prior w ritten consent.
Copyr ight © 2016 Harris Williams & Co., all rights reserved.