Energy Policy Council Report - North Carolina Mineral and Land Resources/Energy...Energy Policy...
72
Energy Policy Council Report March 2016 NORTH CAROLINA DEPARTMENT OF ENVIRONMENTAL QUALITY
Transcript of Energy Policy Council Report - North Carolina Mineral and Land Resources/Energy...Energy Policy...

Energy Policy Council Report
March 2016
NORTH CAROLINA DEPARTMENT OF ENVIRONMENTAL QUALITY

About the Energy Policy Council
Governor McCrory reconstituted the Energy Policy Council in 2014 to support an all-of-the-above energy strategy that promotes clean, reliable, and affordable energy resources for North Carolina homes and businesses. The council advises the governor and General Assembly about legislation and rulemaking that protect the environment, advance domestic energy exploration, and encourage economic development. Its responsibilities include developing a comprehensive energy policy that addresses present and future needs while moving North Carolina and the country toward energy independence.
Council members have expertise in areas such as research and policy, the utility industry, environmental management, and a diversity of energy resources. The Energy Policy Council also develops contingency and emergency plans to deal with possible shortages of energy to protect public health, safety and welfare, and makes recommendations about energy efficiency and conservation. The council is an independent body staffed by the N.C. Department of Environmental Quality (DEQ).
The council’s responsibilities include:
• Developing a comprehensive state energy policy that addresses requirements in the short- (10 years), mid- (25 years), and long-term (50 years), to achieve maximum effective management and use of present and future sources of energy for the governor and General Assembly
• Conducting an ongoing assessment of the opportunities and constraints presented by various uses of all forms of energy to facilitate the expansion of domestic energy supplies and to encourage the efficient use of energy
• Reviewing and coordinating energy-related research, education and management programs that inform the public, and actively engaging in discussions with the federal government to identify opportunities to increase domestic energy supply within North Carolina and its adjacent offshore waters
• Recommending to the governor and the General Assembly needed energy legislation, rulemaking, and any necessary modifications of energy policy, plans and programs
• Recommending an energy efficiency program designed to protect the public health and safety of the people of North Carolina, and considering the conservation of energy through reducing wasteful, inefficient or uneconomical uses of energy resources
• Developing contingency and emergency plans to protect the public from possible shortages of energy, to be compiled into an emergency energy program
2

The Energy Policy Council has 13 members, with the lieutenant governor designated as the chair. In addition to Lt. Governor Dan Forest, members of the council include:
• Donald R. van der Vaart, secretary of the N.C. Department of Environmental Quality • John Skvarla, secretary of the N.C. Department of Commerce
Ten public members as follows: • John Brodman, Carteret County: Pine Knoll Shores commissioner and retired Deputy
Assistant Secretary for International Energy Policy in the U.S. Department of Energy: a person experienced in oil and gas (appointed by the governor)
• George Baldwin, Piedmont Natural Gas, Mecklenburg County: a member representing an investor-owned natural gas public utility (appointed by the Speaker of the House)
• Paolo Carollo, Executive Vice President, Beta Renewables USA, Inc., New Hanover County: an energy economist/financier (appointed by the Senate President Pro Tem)
• Walt Coleman, Associate General Counsel & Managing Attorney, Chicago Bridge and Iron, Mecklenburg County: an energy policy expert (appointed by the Senate President Pro Tem)
• Scott Tew, Executive Director, Ingersoll Rand Center for Energy Efficiency and Sustainability, Mecklenburg County: an industrial energy consumer (appointed by the Speaker of the House)
• Carl L. Wilkins, Senior Director of Distribution & Asset Operations, Principal Advisor, Quanta Technology, Wake County: a member knowledgeable in alternative and renewable sources of energy (appointed by the Governor)
• Michael T. Van Wingerden, Vice President, Metrolina Greenhouses, Mecklenburg County: a person experienced in trucking, rail or shipping (appointed the governor)
• Dr. Herb Eckerlin, Professor of Mechanical and Aerospace Engineering, N.C. State University, Wake County: a member experienced in energy research and development (appointed by the Senate President Pro Tem)
• Vernon Cox, Plant Industry Division Director, N.C. Department of Agriculture and Consumer Services, Wake County: a member experienced in environmental management (appointed by the Speaker of the House)
• Rob Caldwell, Executive Vice President, Duke Energy, Mecklenburg County: a member representing investor-owned electric utilities (appointed by the Senate President Pro Tem)
Frank Gorham, Chairman of the N.C. Coastal Resources Commission; Richard Newell of Duke University; Marshall Cohen of Babcock and Wilcox; and former secretary Sharon Decker of the N.C. Department of Commerce served as council members until their resignation or their term expired.
The Energy Policy Council has held 13 public meetings since it was established in January 2014. The minutes from these meetings are accessible at http://deq.nc.gov/about/divisions/energy-mineral-land-resources/energy-policy-council. The council has heard from numerous energy experts who helped guide the development of the strategies recommended in this report.
3

Executive SummarySince 2014, the Energy Policy Council (EPC) has studied how to most effectively meet North Carolina’s long-range energy demands, make its energy sector cleaner and more efficient, protect against cyber and other threats, and ensure that the state has reliable energy resources during emergencies. The council recommends the pursuit of all safe, clean, reliable, and affordable energy resources, along with the development and use of indigenous fuels for energy production.
The EPC recognizes that North Carolina’s achievements in improving air quality are due in large part to electric utilities moving to cleaner generation. Half of all electricity consumed in North Carolina today is generated by carbon-free, zero-emissions power generation facilities. More than 90 percent of this emissions-free electricity is generated by nuclear stations in the Carolinas. The council believes North Carolina should expand nuclear energy in its current and future energy portfolio as a source of clean and zero-emission baseload energy for future generations.
North Carolina holds great potential for the job-creating, environmentally sound development of on- and offshore oil and gas. The federal government is considering opening the Atlantic Ocean for exploration and development of oil and gas, and advances in horizontal drilling and hydraulic fracturing have created opportunities for responsible exploration of onshore oil and gas. The EPC recommends that the state support Governor McCrory’s work as chair of the Outer Continental Shelf Governors Coalition, where he advocates for the environmentally responsible exploration of offshore energy resources, along with revenue sharing that would allow states to build the necessary infrastructure and fund environmental mitigation measures. The council also recommends that the state continue to gather scientific data, hire experienced regulators, and allow for distribution of severance taxes to affected counties as the state begins to develop its onshore oil and gas resources.
North Carolina’s energy infrastructure is highly rated by industry experts due to its electric power generation facilities, energy diversity, affordability, and reliability; but like all states, it does have vulnerabilities. The council’s Emergency Energy Committee researched energy security threats such as the effects of an electromagnetic pulse (EMP) to the energy grid. The EPC recommends that the N.C. Departments of Public Safety and Environmental Quality conduct exercises and prepare a joint report to the governor and General Assembly that identifies practical strategies for improving crisis response and recovery after an EMP event, and encourages electric utilities to research and implement strategies to protect critical infrastructure. The state should also assess the ability of critical communication systems, emergency response centers, and state-owned electrical generators to function after an EMP attack and determine the appropriate actions the state should take to minimize the damaging effects.
North Carolina has made significant achievements in using energy more efficiently and ranks 21st in lowest residential and commercial energy consumption per capita. The EPC recommends building on those improvements by raising the state’s energy reduction goal from 30 percent to 40 percent through the Utility Savings Program. Reaching the 40 percent goal by 2025 could save two billion dollars in utilities costs, a portion of which should be reinvested in additional energy projects. North Carolina also ranks in the top ten in the nation in lowest transportation energy use per capita, but could become even more efficient by improving traffic flow in high-volume commuter areas through the expanded use of Smart Streets and traffic light synchronization. Additional fuel savings measures recommended by the EPC include allowing for left turns at red lights when turning from a one-way street onto another one-way street.
4

Long-Range Energy Generation Planning and RenewablesNorth Carolina is consistently recognized for its quality of life, business-friendly tax climate, and skilled workforce. With a population of nearly ten million, North Carolina is the 9th most populous state in the country and its population is expected to reach 12 million by 2030. While the state’s overall population continues to grow, its workforce demographics are also changing. North Carolina lost 360,000 manufacturing jobs from 1998 – 2013 but is rebounding with the state’s improving economy. The number of manufacturing jobs in North Carolina has grown by 4.3 percent since 2013, compared to 2.5 percent nationally. The U.S. Bureau of Labor Statistics (BLS) reports that as of October 2015, 462,000 North Carolinians are employed in the manufacturing sector, representing nearly 11 percent of the state’s non-farm workforce. The manufacturing sector is responsible for 21 percent of the state’s gross domestic product, the fourth highest percentage in the nation.
5

6
A skilled workforce, favorable business climate, and low energy costs are major considerations in siting manufacturing facilities. The Economic Development Partnership of North Carolina reports that North Carolina workers are 36% more productive than the U.S. average (Economic Development Partnership of North Carolina, 2016) and in October 2015, North Carolina was second in the nation on the Forbes list of best state for business. Improving energy costs could add to North Carolina’s competive advantage.
The U.S. Energy Information Administration’s (EIA) most recent data shows that North Carolina’s industrial electricity rate in Nov. 2015 was 5.77 cents per kWh, the 20th lowest in the nation and slightly below the average of its neighboring states. Its industrial natural gas price in Oct. 2015 was $5.62 per thousand cubic feet, the 20th highest-priced state. North Carolina gas prices have slightly exceeded the amount paid by industry in neighboring states since August 2008. However, there is some indication that the natural gas price metrics used for North Carolina are not the same as those used in Georgia, South Carolina, Tennessee and Virginia. The N.C. Utilities Commission Public Staff is working with EIA to ensure the same parameters are being compared in each state. Regardless, the remarkable decline in natural gas prices resulting from the shale gas revolution has helped industries in North Carolina improve their global competitiveness.
https://www.eia.gov/dnav/ng/ng_pri_sum_dcu_nus_m.htm
For 2013, EIA compiled the total energy cost on a price per million Btu of energy for each state. As shown in the chart below, North Carolina’s overall 2013 energy cost (shown in red) including electricity, natural gas, and transportation fuels, was 13th highest in the continental U.S., 6 – 10 percent higher than its neighboring states (shown in green), and 47 percent higher than Louisiana, the lowest cost state (shown in purple). The only continental states with higher energy costs (shown in black) were Arizona, California, Florida, Delaware and eight northeastern states. States with the most energy production (oil,
NC GA SC TN VA
Jan-
05
Apr
-06
Sep
-06
Jun-
05
Jul-0
7
Nov
-05
Feb-
06
Dec
-07
Oct
-08
May
-08
Mar
-08
Aug
-09
Jan-
10Ju
n-10
Nov
-10
Apr
-11
Sep
-11
Jul-1
2D
ec-1
2
May
-13
Oct
-13
Mar
-14
Aug
-14
Jan-
15Ju
n-15

7
Increasing Energy Price
https://www.eia.gov/state/rankings/#/series/101
http://www.eia.gov/state/seds/data.cfm?incfile=/state/seds/sep_sum/html/rank_pr.html&sid=US
gas, coal, and nuclear energy) have lower energy costs on average. However, the price benefits of new energy production may be delayed for customers who are served by utility companies that are locked in to long-term contracts. In 2013, transportation energy represented 54.4 percent of the state’s total energy expenditures followed by residential at 20.7 percent, industrial at 13.1 percent and commercial at 11.7 percent. North Carolina has the eighth highest gas tax in the nation.

8
Energy Intensive Industries
• Every steel job supports 7 additional jobs in the economy
• Investment in a rural section of the state where poverty rate was twice the state average
• Approximate annual economic impact: $1.8 Billion
• Mill represents 450+ North Carolina manufacturing jobs averaging $90,000/year
Reliable and reasonably priced energy is vital to the state’s economy and job growth. The shale gas boom is helping to revive manufacturing by lowering the cost of doing business here. Keeping energy affordable is key to North Carolina’s economic prosperity – especially in attracting and retaining energy-intensive industries such as chemicals, pulp and paper, primary metals and food.
North Carolina has taken many important steps over the last three years to improve its energy competitiveness, including:
• The Domestic Energy Jobs Act (S.L. 2013-365) and the Energy Modernization Act (S.L. 2014-4), which support the exploration and development of North Carolina’s on- and offshore energy.
• The N.C. Eastern Municipality Power Agency (NCEMPA) Asset Sale (S.L. 2015-3), which has reduced NCEMPAs debt by more than 70 percent and led to lower electric rates. Lower energy costs should improve economic development opportunities within the NCEMPA electric service territory, an area that has significantly higher unemployment rates than the state as a whole.
• Increased support for the Atlantic Coast Pipeline and other projects that connect North Carolina to the abundant sources of clean, affordable natural gas in the Marcellus and Utica shale basins

Electricity PlanningElectric utilities require adequate and diverse generating capacity in order to provide stable (baseload) and peak power reliably and economically. In North Carolina, electricity is generated from energy sources including biogas, biomass, coal, natural gas, fuel oil, sun, nuclear, and water. North Carolina houses the largest solar energy farm east of the Mississippi and will soon be home to the largest wind energy facility in the Southeast. Coal, gas, and nuclear power plants produce more than 90 percent of the electricity generated within the state.
The demand for electricity is constantly changing, following cycles throughout the day and year. Electric utilities must plan operations for their power plants and transmission grids in advance to meet demand. Supply is matched instantaneously in every area of their service territory, while maintaining a system frequency of 60 hertz, where alternating current reverses direction 60 times per second. Slight deviations in power may damage electric equipmentment and appliances. Failure to maintain a 60-hertz frequency can result in the collapse of the electric grid.
Renewable EnergyAlmost 7 percent of the electricity generated in North Carolina during 2015 came from renewable energy sources. Renewable energy generation has increased by 20 percent over the past decade. Its growth is dominated by utility-scale solar energy and is supported by the state’s Renewable Energy and Energy Efficiency Portfolio Standard (REPS) and federal, state, and local tax incentives, including the recently sunset 35 percent state renewable energy investment tax credit. (Through the tax credits, North Carolina will have committed an estimated $2 billion towards developing renewable energy projects – the vast majority of which are solar energy facilities – by the end of 2016.)1
9
of West Virginia. New pipelines will decrease supply constraints, help prevent price spikes, and provide industry with reliable access to the gas they need at reasonable prices. Areas where natural gas is produced or areas that are served by major pipelines generally pay the lowest prices.
The implementation of the Coal Ash Management Act is likely to impact energy costs in North Carolina. To what degree will depend on the final closure plans approved under that law, but estimates have varied from $2 – 10 billion dollars depending the method of closure for coal ash basins.
1 The estimated $2 billion in North Carolina renewable energy investment tax credits includes $937.8 million for 201 projects totaling 1641 MWs under the Safe Harbor Act; $536 million for projects installed from 2010 to 2013; and more than $500 million expected to be earned for projects constructed in 2014 and 2015.

10
North Carolina is a leader in solar energy, ranking fourth in the nation in the amount of solar power generated during 2015 and having the highest percentage of solar generation growth since 2014. The growth of the solar industry plays a significant role in the increasing presence of renewables in North Carolina’s all-of-the-above energy portfolio.
*Generation data for December 2015 is not yet available and is assumed to be equal to December 2014 for the above graph.

The North Carolina Sustainable Energy Association (NCSEA) reports that 1670 megawatts2 (MWs) of solar energy panels have been installed across North Carolina as of December 2015 (N.C. Sustainable Energy Association, 2016)2. Solar comprises 99 percent of the capacity of projects in the Duke Energy Carolinas/Duke Energy Progress interconnection queue and under construction.
Economic ConsiderationsThe 2015 North Carolina Clean Energy Census (2015 NCCEC) reports that the state’s solar industry includes 350 firms who employ 20 percent of North Carolina’s 26,154 clean energy sector full-time equivalent workers. The U.S. BLS reports that in May 2014 the annual mean wage of solar panel installers in North Carolina was $30,240, 30 percent less than the annual mean for all North Carolina workers. The 2015 NCCEC report “anticipates 2016 will bring a ninth consecutive year of continued growth for the clean energy industry across the state.” In 2015, the state’s clean energy sector generated almost $7 billion in annual gross revenues.
In March 2015, Dr. Ryan Yonk, Director of the Institute for Political Economy at Utah State University, presented the findings of a study of North Carolina’s REPS to the EPC. His research showed that the REPS that promotes clean energy development has resulted in 23,739 fewer jobs since 2008 in other sectors of North Carolina’s economy, and twice as much loss in statewide income than the $7 billion reportedly gained in 2015. It is important to note that neither the 2015 NCCEC nor the Utah State University REPS study examined both the benefits and the costs of the REPS.
11
Duke Energy Carolina & Duke EnergyProgress Interconnection Queue,
3rd Qtr, 2015
Number of New Solar Projects
This chart reflects sedimentation and erosion control applications processed by DEQ and does not include solar projects reviewed by any of the 53 local delegated erosion and sedimentation control programs throughout the state.
This chart includes interconnection requests received by DEC and DEP for renewable energy facilities in North Carolina and South Carolina.
2 James McLawhorn, NCUC Public Staff Electric Division Director, estimates that about 1,300 MW of solar energy facilities in North Carolina were placed in operation on or before December 31, 2015. NCUC tracks capacity based on megawatts of alternating current (AC). Solar energy is generated in direct current (DC) and must be converted to alternating current before it is placed on the electric grid. Power is lost during the conversion. It is reasonable to expect that 1300 MW-AC would be produced from 1670 MW-DC.

12
Renewable power, including solar and wind energy, electricity fueled by trash or methane derived from landfills, hog waste, poultry waste or non-animal biomass, and run of the river hydroelectric, is sold to public electric utilities at what it would cost the utility to generate the electricity – known as the avoided cost rate. Each megawatt-hour (MWh) of qualifying renewable energy3 receives three payments: energy, generation capacity, and Renewable Energy Certificates (REC)4. Renewable energy facilities with capacities of no more than 5 MW are eligible to enter into a 15-year standard power purchase agreement (PPA) with the utility. The long-term contract protects renewable energy developers from potential downward rate adjustments.
EIA’s 2014 Form 826 “Sales and Revenue” data indicates that North Carolina renewable energy developers received on average $77.47 for each MWh of energy they sold. In comparison, EIA shows the average rates charged to North Carolina investor owned utilities’ industrial customers in 2014 was $62.8 per MWh. The higher price for renewable energy appears to stem from the purchase of RECs and PPAs based on a higher cost of natural gas than was paid by utilities. The REC costs are passed on to ratepayers in the form of a renewable energy rider. For example, as of September 2015, Duke Energy Carolinas residential and industrial customers pay $6.48 and $204.72, respectively, to support renewable energy development on an annual basics. (DEC 2015) North Carolina’s REPS limits the amount of premium payments for RECs to $34 annually per residential customer and $1,000 each year per industrial user. By 2025, approximately 20 trillion watt hours of RECs will be required to comply with North Carolina’s REPS. Only California, Illinois and Minnesota have higher binding REPS requirements.
3 Section 210 of the Public Utility Regulatory Policies Act of 1978 (PURPA) requires standard contracts for qualifying facilities with no more than 100 kW capacity.
4 RECs are used to comply with the North Carolina REPs.
ECONOMIC BENEFITS2015 North Carolina Clean Energy Industry Census,
North Carolina Sustainable Energy Association
ECONOMIC COSTS Renewable Portfolio Standards: North Carolina
Institute of Political Economy, Utah State University
2015 North Carolina Clean Energy Industry Census, North Carolina Sustainable Energy Assoociation
Renewable Portfolio Standards, North CarolinaInstitute of Political Economy, Utah State Unversity

13
As more solar energy is integrated into power grid, its capacity value to the utility will decrease. Currently about 46% of solar nameplate capacity generates power to meet summer peak demand. However, at some point, a larger difference between electricity demand and electricity production from solar resources will occur later in the day. For example, should Duke Energy Carolinas reach 5,000 MW-AC of fixed mount solar energy by 2025, its critical capacity need during July will likely shift from 5 p.m. to 7 p.m., when solar power generation drops to less than 10 percent of the nameplate capacity. A recent trend in winter peaks occurring in the 7 a.m. to 8 a.m. hour could also lower solar energy’s capacity value. Utilities need dependable capacity to ensure adequate resources are available to meet peak conditions in the winter. Solar energy generation during January mornings at 7 a.m. is zero.
Source: Duke Energy

14
Reliability ConsiderationsEven on clear sunny days, the output of solar generation is not constant. It ramps up after sunrise, peaks at midday and then drops off to zero by sunset. On partially cloudy days, solar energy generation is unpredictable and on rainy days, it may be zero. North Carolina’s utility-scale solar energy facilities (shown as the larger green circles) are most often located far from load centers. As more solar (or wind) energy is integrated, adding sufficient transmission to move the electricity generated to the load centers will be critical. New transmission can also provide additional geographic diversity that can smooth out some variability. However, reliability issues may arise if these new transmission lines carry primarily solar-generated electricity.
The cost of integrating intermittent power generation resources generally increases as its generation share increases. If large amounts of solar and/or wind energy are integrated into North Carolina’s bulk power grid system, future generation planning will need to consider both capacity and system flexibility to address the increased variability and uncertainty. Flexibility can be increased by adding on-demand power generation, energy storage and load reduction. For example, Dominion Power chose to add one 457 MW fast start natural gas combustion turbine for each 1,000 MW of solar capacity in its 2015 integrated resource plan (IRP) to account for solar intermittency.Dispatchable power generation facilities, in order of most to least flexible, include (1) hydropower plants with reservoirs; (2) gas-fired power plants; (3) coal-fired power plants; and (4) nuclear power plants. The ramping rate of natural gas power plants is up to 8 percent of capacity per minute, while coal power plants typically ramp up at 1 to 3 percent per minute (International Electrictechnical Commission, 2012). It should be noted that as a fossil fuel plant is ramped down below 70 to 80 percent of its capacity, it operates less efficiently, resulting in higher emissions and fuel consumption per unit of energy generated. Maintaining the necessary spinning reserves to precisely match electricity generation with load frequently then comes at a higher cost. In addition, over time, repeated shifts in power generation shorten the life of critical components of the power plant and increase the need for maintenance due to resultant thermal and pressure stresses.
North Carolina Operating Solar PV Energy Facilities(N.C. Sustainability Energy Association, 2016)
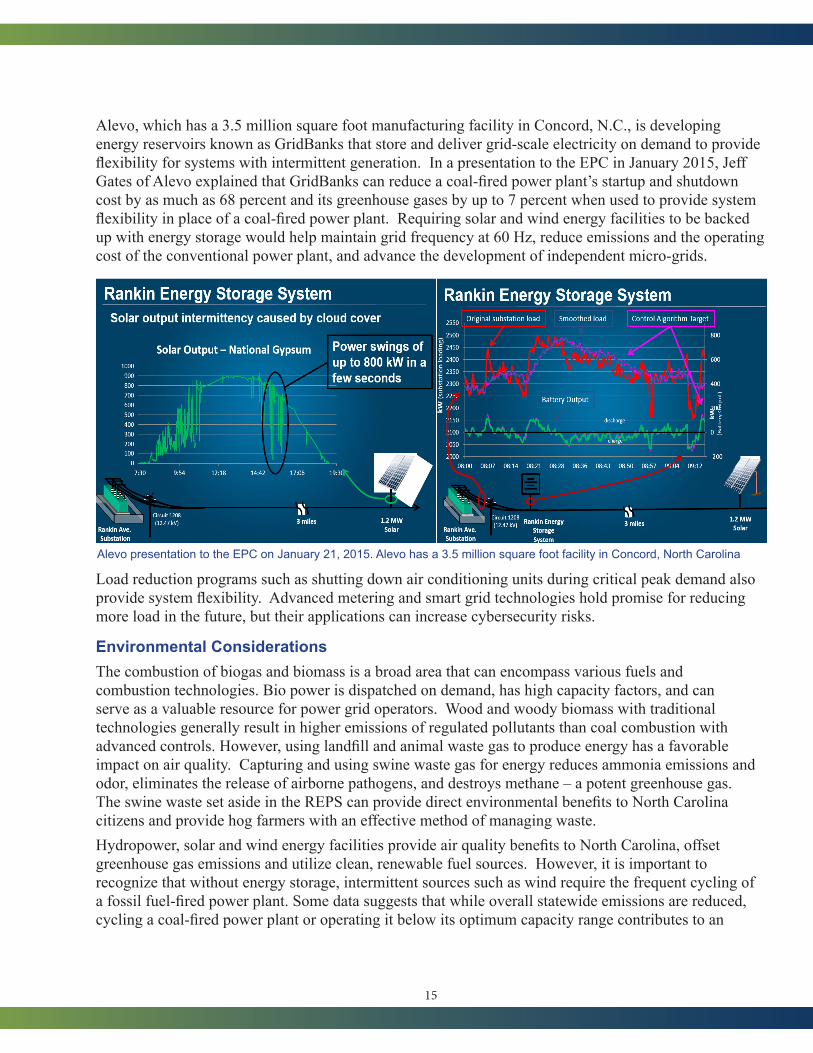
Alevo, which has a 3.5 million square foot manufacturing facility in Concord, N.C., is developing energy reservoirs known as GridBanks that store and deliver grid-scale electricity on demand to provide flexibility for systems with intermittent generation. In a presentation to the EPC in January 2015, Jeff Gates of Alevo explained that GridBanks can reduce a coal-fired power plant’s startup and shutdown cost by as much as 68 percent and its greenhouse gases by up to 7 percent when used to provide system flexibility in place of a coal-fired power plant. Requiring solar and wind energy facilities to be backed up with energy storage would help maintain grid frequency at 60 Hz, reduce emissions and the operating cost of the conventional power plant, and advance the development of independent micro-grids.
Load reduction programs such as shutting down air conditioning units during critical peak demand also provide system flexibility. Advanced metering and smart grid technologies hold promise for reducing more load in the future, but their applications can increase cybersecurity risks.
Environmental ConsiderationsThe combustion of biogas and biomass is a broad area that can encompass various fuels and combustion technologies. Bio power is dispatched on demand, has high capacity factors, and can serve as a valuable resource for power grid operators. Wood and woody biomass with traditional technologies generally result in higher emissions of regulated pollutants than coal combustion with advanced controls. However, using landfill and animal waste gas to produce energy has a favorable impact on air quality. Capturing and using swine waste gas for energy reduces ammonia emissions and odor, eliminates the release of airborne pathogens, and destroys methane – a potent greenhouse gas. The swine waste set aside in the REPS can provide direct environmental benefits to North Carolina citizens and provide hog farmers with an effective method of managing waste. Hydropower, solar and wind energy facilities provide air quality benefits to North Carolina, offset greenhouse gas emissions and utilize clean, renewable fuel sources. However, it is important to recognize that without energy storage, intermittent sources such as wind require the frequent cycling of a fossil fuel-fired power plant. Some data suggests that while overall statewide emissions are reduced, cycling a coal-fired power plant or operating it below its optimum capacity range contributes to an
15
Alevo presentation to the EPC on January 21, 2015. Alevo has a 3.5 million square foot facility in Concord, North Carolina

increase in the coal plant’s emissions on a per unit of power generated basis. The N.C. Division of Air Quality has observed the following trends in nitrogen oxide (NOx) emission rates per heat input:
As the solar industry in North Carolina has matured, the number and average size of solar facilities has increased. While the typical 5 MW utility scale solar project generally covers no more than 40 acres of land, many new solar energy projects require hundreds of acres. The land is usually leased by the property owner to the solar company. In some cases substantial clearing and grading are required, and in other cases cleared farmland is utilized. Clearing significant amounts of acreage over a short period of time can present unique challenges with respect to erosion and sedimentation control, such as alteration of drainage channels and increased runoff and erosion. When topsoil is removed, it may take many decades to restore the property to cropland.Some property owners are concerned about the effects of long-term solar leases on the condition of their land and whether they will be responsible for disposing of the equipment when the lease term ends. Because solar panels contain metals such as cadmium and lead, they could potentially be classified as hazardous waste at their end of life. The federal government requires soil management plans, decommissioning and/or restoration plans, and/or a decommissioning bond or financial assurance to ensure that federal property is returned to its original condition. The model solar ordinance developed in 2013 by The North Carolina Clean Energy Technology Center, the North Carolina Sustainable Energy Association, and various other stakeholders addresses many landowner concerns but does not appear to have been fully adopted by the majority of the counties in the state. In the coming year, the EPC plans to evaluate measures to protect the interest of the landowner and local and state governments in a way that results in minimum impact on solar energy development.
16
* Every county in North Carolina is in attainment with all federal air quality standards, including ozone
Nuclear Power Nuclear power is an essential component of North Carolina’s all–of-the-above strategy to provide homes and businesses with clean, reliable, and affordable energy and move the U.S. toward energy security. It is also the primary reason that half of the electricity consumed in North Carolina is generated by carbon-free, zero emissions power generation facilities. More than 90 percent of North Carolina’s emissions-free electricity is generated by 11 nuclear reactors in the Carolinas. Approximately two-thirds

of the nuclear power produced at three plants in North Carolina and three plants in South Carolina is allocated to residents, commercial establishments and industry in North Carolina. During the 12 month period ending on Oct. 31, 2015, North Carolina’s three plants reliably generated 32.6 percent of the electricity produced in the state and did so without emitting air pollutants or generating any greenhouse gases5.
In addition to protecting air quality, nuclear energy enhances North Carolina’s economy by increasing the state and local tax base, directly employing 2,600 highly skilled workers at plants in Brunswick, Wake, and Mecklenburg counties, indirectly supporting an equivalent number of service and supply jobs, and keeping electricity rates affordable. The Brunswick, Harris and McGuire nuclear power stations collectively generate approximately $2 billion in economic output and $200 million in direct wages each year. According to the Nuclear Energy Institute, “Analysis shows that every dollar spent by the average nuclear plant results in the creation of $1.04 in the local community, $1.18 in the state economy and $1.87 in the U.S. economy” (Nuclear Energy Institute, 2016).Another advantage of nuclear power is its extraordinary availability – nearly 100 percent – during both summer and winter peak demand periods. All nuclear refueling and routine maintenance outages are performed in the spring and the fall. During the 12 month period ending on Oct. 31, 2015, the five reactors in North Carolina operated at a very high capacity factor of 93.4 percent, meaning that on average each reactor operated 93.4 percent of the time. In contrast to electric power generating sources whose dispatch readiness is limited by the availability of the resource (i.e., whether the wind is blowing or the sun is shining), nuclear power plants are highly reliable baseload resources that decrease the need for high-capacity reserve margins. As demand for electricity grows during peak loads, less clean, less efficient and more expensive sources of power generation are dispatched. Few peaking generators have advanced pollution control devices or heat recovery systems. With dependable nuclear power, fewer of these units are operated, keeping the air cleaner and operating costs lower. Existing nuclear power plants are one of the lowest-cost producers of electricity in the U.S. In 2014, the total generating cost, including capital, fuel and operating expenses, at an average site was $36.27 per MWh. The generation cost at multi-unit sites like McGuire and Brunswick Nuclear Stations are lower, with an average of $33.76 per MWh.
17
5 The U.S. Energy Information Administration maintains records of energy generation in each state. Its most recent monthly electric report was released Dec. 24, 2015 and contains generation data through Oct 31, 31, 2015.

18
Many existing coal, natural gas, nuclear, and hydroelectric resources could produce electricity at a far lower cost for years to come than potential new generation resources. Natural gas combined cycle (NGCC) plants are the least-cost option for meeting new demand. However, with uncertainty about the future price of natural gas price, it is important to maintain a diversified portfolio. To cost-effectively manage the inherent fuel price volatility risk and growing energy demand, Duke Energy Carolinas and

19
Duke Energy Progress plan a combination of 5000 MW of NGCC and 2,300 MW of nuclear during the next 15 years. Additionally, 3,400 MW of solar energy will be added to meet the REPS mandate. Other reasons for the need for new capacity are:• Duke Energy Carolinas and Duke Energy Progress expect to retire 2,150 MW of non-nuclear
generating capacity by 2028.• Between 2030 and 2046, the operating licenses for more than 7,000 MW of nuclear power capacity
dedicated to providing electricity to North Carolina will expire. • Duke Energy plans to close the 741 MW capacity Robinson Nuclear Facility by 2030 but intends
to pursue license extensions for most of its other reactors.• The newer plants are likely candidates for license renewals but extended licenses for the Oconee
and Brunswick are more uncertain, as these facilities pre-date the Three Mile Island event and the subsequent added safety features.
• Duke Energy anticipates the demand for electricity within its North Carolina service territory to increase at an annual rate of 1.2 percent between now and 2030. That equates to a 20 percent increase in energy demand by 2030, when North Carolina’s population is expected to reach 12 million.
• Increasing amounts of solar and other summer peak-only generation resources combined with the recent winter peaks are driving a need to increase the reserve margin from 14.5 to 17 percent to ensure continuous service. For example, during the 2014 polar vortex, although Duke Energy Progress had 21 percent summer planning reserve margins, it experienced real time operating reserves of -3 percent.
Duke Energy has filed the combined Construction and Operating License (COL) application for a new 2,234 MW nuclear plant with two AP1000 reactors. In its 2015 Integrated Resource Plan, Duke Energy projected a need for these new units in 2024 and 2026. The proposed facility would be at the Lee Nuclear Plant located in Gaffney, S.C., about 50 miles southwest of Charlotte. The plant would employ 800 to 900 full time workers when operational and would require 3,500 or more workers during its peak construction period. The majority of the economic benefits would be realized by South Carolina. North Carolina ratepayers would be responsible for 68 percent of the project cost because they would receive 68 percent of the electricity once the plant begins operation.
A drawback of nuclear power is the high cost of construction. Unlike other conventional generation, nuclear plants require many costly safety features. The massive containment systems, the use of nuclear-grade materials and extensive redundancy to guarantee safe operations drive up costs. Like many large infrastructure projects, nuclear power plants are prone to schedule delays and cost overruns during construction – as is the case for the nuclear power stations under construction in Georgia and South Carolina. Delays for projects subsequent to Georgia (Vogtle) and South Carolina (V.C. Summer) should be fewer and less costly as engineering experience is gained. Delays increase the overall investment cost as interest charges are accrued. Financing is also a major impediment. Nuclear projects have financial risks and require much longer payback periods than the 5 – 7 years sought by commercial banks. Incentives for nuclear development could be used to help overcome financing obstacles and protect the ratepayer by lowering the overall project cost. Potential incentives include grants or loans,

20
tax incentives, tax equity, guarantees of debt repayment or offtake agreements (full, partial or burn-off), and ancillary benefits such as infrastructure and workforce training. If incentives encourage development within the state, they could be offset by the new tax revenues they generate.
Long-Range Energy Generation Planning and Renewables Committee Recommendations:The long-range energy generation and renewables committee is chaired by Carl Wilkins of Quanta Technology, Inc. and includes N.C. Department of Environmental Quality Secretary Donald R. van der Vaart and N.C. State University mechanical engineering professor Dr. Herb Eckerlin. It has met with solar, wind and nuclear industry representatives, Duke Energy, PJM, university professors and the Utilities Commission Public Staff to better understand which policies have led to North Carolina’s success in advancing solar energy and the policy initiatives needed to cost-effectively encourage the development of other beneficial energy resources. It finds that North Carolina should continue to promote the development of all safe, clean, reliable, secure and cost-effective sources of energy, including nuclear and renewable energy, along with indigenous oil, gas and biofuels as part of its all-of-the-above energy strategy. The committee proposed four recommendations that were approved by the full Energy Policy Council:
Nuclear Energy – approved 5/20/20151. North Carolina should recognize the importance of nuclear energy generation in its current and
future energy portfolio in providing reliable, clean and emissions-free baseload energy.a. Nuclear energy provides 32% of total electricity generated in North Carolina.b. Nuclear energy is the only reliable source of zero-emission, always-on, baseload electricity.c. Nuclear energy has proven to be very safe during its more than 50-year history in the U.S.d. Nuclear power generation has the lowest land use intensity of any power source at 2.4 km2/
TWh/yr.6
e. The U.S. Energy Information Agency estimates that new nuclear plants are among the least expensive on a levelized basis of new sources of electricity generation, projected at $96.1/MWh in 2019.7
f. Reliability distinguishes nuclear reactors from other energy resources. Nuclear plants have an overall 90% capacity factor.
g. Nuclear power plants are a significant provider of jobs and tax receipts, with a 1,000 MW facility employing 400 – 700 permanent employees with salaries 36% higher than local average, and contributing $16 million in state and local taxes.
h. New nuclear generation will maintain North and South Carolina’s economic competitiveness.i. Early action is needed to effectively plan and deploy new reactors. The two reactors at the
6 The Nature Conservancy determined solar photovoltaic power generation requires 36.9 km2/TWh/yr, wind generation 72.1 km2/TWh/yr, and biomass generation 543.4 km2/TWh/yr.
7 The levelized basis for cost calculation purposes is the “per-megawatt-hour cost (in real dollars) of building and operating a generating plant over an assumed financial life and duty cycle.” See U.S. Energy Information Administration, Levelized Cost and Levelized Avoided Cost of New Generation Resources in the Annual Energy Outlook 2014 1 (2014), at http://www.eia.gov/forecasts/aeo/pdf/0383(2014).pdf

21
Brunswick plant are at risk of closing in 2034 and 2036.
Safe, Clean, Reliable, Secure and Cost-Effective Energy – approved 7/15/20152. North Carolina should pursue all safe, clean, reliable, secure and cost-effective sources of energy,
including renewable energy, as part of its all-of-the-above energy strategy. a. Fuel diversity reduces the impacts of market fluctuations and supply restraints.b. Renewable energy sources can provide North Carolina a potential financial and supply hedge
against fuel price volatility. c. Reliable and reasonably priced energy is vital to retaining and creating jobs and growing the
economy. 3. North Carolina should promote the development and use of cost-effective, clean indigenous fuels for
energy production. a. Bio-resources are abundant in North Carolina and can be used to produce alternative clean
burning liquid and gas fuels for transportation, heating and electricity generation. However, technical and legal questions have been raised about the environmental benefit of biomass combustion. North Carolina should strive to resolve these issues so that biomass combustion is a viable option for energy production.
b. Fuel diversity hedges against future price volatility or shortages that could diminish the state’s strong economic growth.
c. Responsible exploration and development of oil and gas reserves onshore and offshore strengthens the state’s fuel availability and energy independence.
North Carolina Nuclear Energy Consortium – approved 1/27/2016 4. North Carolina should establish a Nuclear Energy Consortium and direct it to:
a. Identify workforce requirements of the nuclear industry over the next decade and work with community colleges and universities to develop educational and training programs that equip students with the knowledge and skills they need to work in the nuclear field as engineers, technicians, operators and skilled trades.
b. Pursue and encourage meaningful research and development opportunities in nuclear science and technology, particularly advanced nuclear energy.
c. Identify and support the development of education and training programs to meet the needs of North Carolina’s nuclear industry.
d. Educate the public about nuclear energy, including its environmental benefits, safety concerns and related job opportunities.
e. Encourage and facilitate the application, commercialization, and transfer of new nuclear technologies.
f. Prepare a 25-year generation plan for nuclear energy in the Carolinas that identifies the date each nuclear plant will likely retire, the plant upgrades that may be needed for it to be eligible for re-licensing, and the timeline for planning, licensing and building advance nuclear energy plants.
g. Oversee a study of the job and economic benefits and costs associated with building and operating additional nuclear reactors in North Carolina.

22
h. Identify electric utility regulations and other roadblocks that may be standing in the way of new nuclear energy development and propose regulatory changes and management strategies to minimize these obstacles.
i. Identify best practices and technology for building advanced nuclear energy in North Carolina cost-effectively, on budget, on schedule and in a manner that protects the ratepayer.
j. Develop a licensing and building plan for new advanced nuclear energy in North Carolina.k. Maintain and grow North Carolina’s position of national and international leadership in nuclear
energy. l. Foster innovative partnerships and relations among state of North Carolina, UNC system
institutions, private companies, federal laboratories, and non-profit organizations. The North Carolina Nuclear Energy Consortium shall consist of the suggested persons or their designee:1. The secretary of the N.C. Department of Environmental Quality 2. The secretary of the N.C. Department of Commerce 3. The head of the Department of Nuclear Engineering at N.C. State University 4. The Director of the Energy Production and Infrastructure Center at UNC-Charlotte5. The Executive Director of the Utilities Commission Public Staff 6. Representative of the Community College System7. Two representatives from Duke Energy 8. Two representatives from the nuclear industry 9. One representative of an electric membership corporation whose principal purpose is to furnish or
cause to be furnished bulk electric supplies at wholesale.The North Carolina Nuclear Energy Consortium shall meet at least twice each year.
Energy ExplorationNorth Carolina anticipates excellent opportunities to harness its on- and offshore oil and gas resources in the future. The demand for natural gas has increased in recent years and is expected to grow as North Carolina and the nation continue to move toward increasing amounts of renewable energy and cleaner-burning fossil fuels. In its annual energy outlook report, EIA expects that total domestic oil and gas demand will grow 8.5 percent between 2013 and 2040. Natural gas-fired power generation plays a vital role in the integration of intermittent sources such as photovoltaic solar and wind energy due to its quick start capabilities. Decreased energy costs, including the low prices North Carolinians are paying at the gas pump, are directly related to the increase in domestic energy production. Dating back to 2012, the United States is the world’s largest producer of petroleum and natural gas.
OnshoreThe U.S. Geological Survey (USGS) estimates there are 1.6 trillion cubic feet of undiscovered natural gas resources and 75 million barrels of undiscovered natural gas liquids resource in continuous accumulations within the Piedmont Province of North Carolina. Based on 2014 consumption rates, that amount would supply all of North Carolina’s natural gas needs for more than three and a half years. The N.C. Geological Survey (NCGS) has determined that technically recoverable shale gas likely exists in

23
the Deep River basin within Lee, Chatham, and Moore counties and may be present in the Dan River basin located in Stokes and Rockingham counties. As additional information is collected, it is possible that the resource estimates will increase and become more attractive to potential developers. In 2015 the NCGS conducted rock core drilling in Cumberland, Hoke, Scotland and Stokes counties to better assess North Carolina’s potential reserves. Initial analysis of the core drilling samples collected in Stokes County indicate gas-bearing shale. Additional core drilling, sampling and analysis are expected to begin in the first quarter of 2016. This will further the understanding of the Dan River basin within Rockingham County and may lead to a higher estimate of undiscovered, technically recoverably hydrocarbons.
The Sanford sub-basin and Dan River basin consist of low permeability shale rock formations containing natural gas. Advancements in horizontal drilling and hydraulic fracturing technology have allowed shale gas in similar formations to be extracted effectively. Hydraulic fracturing involves drilling a well into rock, injecting fluids under pressure to fracture the rock, and extracting the oil and gas from the fractures. Two environmental studies completed in 2015 examined some of the possible environmental effects associated with hydraulic fracturing. The U.S. Environmental Protection Agency (EPA) evaluated hydraulic fracturing and its potential impact on drinking water resources. It found no widespread, systemic impacts on drinking water in the United States resulting from hydraulic fracturing activities. These findings are available at http://www.epa.gov/hfstudy/executive-summary-hydraulic-fracturing-study-draft-assessment-2015.
The N.C. Division of Air Quality conducted a study to assess the potential air emissions impacts on ground-level ozone formation associated with potential oil and gas exploration and development activities in the Sanford sub-basin in the Deep River basin. The study showed that shale gas development activities could take place in compliance with the recently strengthened federal ozone standard set at 70 ppb. Photochemical grid modeling indicated future ambient ozone levels in all affected and surrounding counties to be 63.7 ppb or below. The study parameters and modeling results are available at http://daq.state.nc.us/news/shale.
Above: Rock cores from hydrocarbon bearing shales in Stokes County, N.C. The coring was completed on March 31, 1981.

24
Bringing shale gas exploration and production to North Carolina would create direct and indirect employment opportunities and expand local commerce and tax revenue. Local residents would benefit from the new income from surface rights, mineral lease payments and production royalties. New access to local natural gas may also lead to lower heating bills, reducing utility expenses for residents and allowing businesses to reduce their operating costs. The State of North Carolina would increase its revenue through severance taxes and the increased income tax base. The Mining and Energy Commission (MEC) was established in 2012 to write the oil and gas program rules that will govern horizontal drilling and hydraulic fracturing in North Carolina. After considering more than 217,000 verbal and written comments from approximately 35,000 individuals across the state, the MEC finalized a set of 120 rules. The new rules contain nearly 4,000 requirements to ensure that shale gas development activities take place in a safe and environmentally responsible manner. Those rules went into effect on March 17, 2015.
OffshoreIn January 2015, the Obama Administration proposed opening the Mid-Atlantic and South-Atlantic for offshore oil and gas development. The Draft Proposed Program calls for one Atlantic lease sale to takeplace during 2021 in an area beyond a 50-mile coastal buffer. At 50 miles offshore, drilling rigs and production platforms are not visible from the coastline, and many ocean use conflicts and most critical marine habitat areas are avoided. Under federal law, the proposed leasing area cannot expand during the planning process. Instead, the federal government may identify additional exclusion areas beyond the 50-mile buffer to balance other ocean uses or to protect critical habitats. It may be possible to add another lease sale in the Atlantic, which would encourage investment and provide North Carolina and energy companies with more certainty about our offshore resources.
The U.S. Department of the Interior (DOI) oversee offshore energy development and lease sales and operates on a five-year planning process. Two years prior to the next five-year program, DOI begins preparations through a five-step process. DOI is currently near the middle of the planning process for the 2017 – 2022 program and anticipates releasing its draft leasing program along with a draft environmental impact statement (DEIS) to the public in spring 2016. Following that release, the
Map of the Mid- and South-Atlantic Planning Areas. (Images courtesy of DOI)

25
department plans to hold public information meetings in Kill Devil Hills and Wilmington, N.C. DOI hopes to have a final five-year program in place prior to the end of President Obama’s second term. In preparing for lease sales, DOI reviewed decades-old seismic images and other geological and geophysical (G&G) data to approximate the amount of oil and gas resources in the Atlantic planning areas. The Mid-Atlantic area extends from Delaware to North Carolina and is estimated to contain 23.4 trillion cubic feet of undiscovered, technically recoverable natural gas and 2.42 billion barrels of undiscovered, technically recoverable oil resource. In a November 2015 presentation to the Energy Policy Council, Gary Steffens, Senior Geological Advisor with Shell Exploration & Production Co., indicated that there are likely 8 to 9 billion barrels of oil equivalent (combination of oil and gas), undiscovered, technically recoverable resources in the Mid-Atlantic and South-Atlantic from Virginia to Georgia. If each barrel of oil equivalent was dedicated to North Carolina, it would take the state 42 years at current consumption rates to deplete the reserves. Steffens expects the first production to take place sometime between 2030 and 2035, with production continuing for 20 – 40 years. The expected reserves are in deep waters beyond the continental shelf, primarily in areas outside of the 50 mile coastal buffer. Existing data suggests that there are significant oil and gas reserves in the deep waters far off North Carolina’s coast within the carbonate margin, the narrow geological play identified in darker blue on the DOI map.
When offshore North Carolina was leased in the 1980’s for energy development, the reserves were too deep to reach. Advanced drilling techniques and safety measures implemented since the BP Macondo well blowout in 2010 have made access to oil and gas in these waters more attainable, economical, and safe. Today, the industry follows rigorous standards developed by the Center for Offshore Safety and DOI’s Bureau of Safety and Environmental Enforcement (BSEE) and enforced by BSEE to help prevent another well blowout.

Marine Seismic Surveys
In the 1970’s and 80’s industry acquired 93,700 miles of seismic data and safely drilled 51 wells in the Atlantic. New seismic imaging data is now needed to provide a better understanding of the true resource potential in the Mid-Atlantic. Enhanced data processing and advanced seismic techniques enable geological companies to pinpoint the likely locations of oil and gas reserves. With this knowledge, industry can develop the Mid-Atlantic in a more economical and environmentally protective manner.
Between mid-September and mid-October 2014, the National Science Foundation (NSF) conducted a 2D seismic survey of the seabed off North Carolina using the identical survey technology that is proposed for oil and gas assessments. 880 miles of 2D seismic reflection lines were collected for research purposes. The quality of the new data is significantly improved over the legacy data. During and after the seismic survey, DEQ received no reports of marine disturbances or ocean use conflicts and has not observed any impact on marine life.
Geologists within the N.C. Department of Environmental Quality’s Energy Group have obtained several seismic images collected by the NSF. Based on information in the NSF expedition report, as well as an in-house evaluation of the seismic profiles, salt diapirs (salt domes) appear to be present within the sedimentary rock layers just beyond the continental shelf off the North Carolina coast. Salt domes are sought-after exploration targets due to the potential for prolific oil and gas production over and adjacent to them. An exploration well is needed to confirm the presence of hydrocarbons.
26

27
Map of research expedition seismic collection track lines. Note locations of inferred salt diapirs. (National Science Foundation and Geo-Prisms Cruise, 2016). Image from the 2014 National Science Foundation and Geo-Prisms Cruise Report on the “Eastern North American Margin Community Seismic Experiment” for Cruise MGL1408.
TRACKLINE A-A’
Data from DOI

28
Rock. (Institute for Geophysics, The University of Texas at Austin, 2016). Images taken from the Marine Geoscience Data System for Cruise MGL1408. Annotated seismic profile from the N.C. continental shelf (Onslow Bay area) extending in a southeasterly direction offshore. Sedimentary rock deposits seaward of the continental slope are up to 15,000 feet thick within this profile. Temperatures and pressures favorable for hydrocarbon generation are expected within some portions of the sedimentary rock. (National Science Foundation and Geo-Prisms Cruise, 2016). Image taken from the Marine Geoscience Data System for Cruise MGL1408.
Seismic exploration is conducted prior to drilling to delineate drilling targets. Seismic images are collected by sending compressed air to the ocean floor, with sensors towed behind a vessel measuring the time it takes for the sound waves to reflect off subsurface rock layers and return. Scientists analyze the data and use it to create maps of geologic structures that could contain energy resources beneath the ocean floor. In order for new seismic survey activities to take place, G&G companies must undergo the lengthy process of obtaining a permit from DOI. Before permits are issued, applications undergo a review by affected states for consistency with their coastal programs and by the U.S. National Marine Fisheries Service (NMFS) to ensure the protection of marine mammals. Federal law prohibits NMFS from authorizing an activity unless its impacts will be negligible on marine mammals and will result in no adverse effects on the recruitment or survival of marine mammal species or stocks.
TRACKLINE B-B’
Data from DOI

29
Several marine G&G companies applied for seismic permits during the summer of 2014 but no permits have been issued to date. Applications from four of those companies, including three that intend to collect 2D seismic imaging data offshore North Carolina, have been accepted for processing at NMSF and deemed consistent with the North Carolina Coastal Area Management Act. Should DOI approve a permit for a 2D or 3D marine seismic survey in the Atlantic, it will require that the highest practicable level of mitigation measures to be followed. All G&G surveyors must be trained protected species observers equipped with passive acoustic monitoring systems. Surveyors are required to adhere to sound level, time and speed restrictions; avoid exclusion zones; provide safe separation distances; and follow ramp-up, delay, power-down, and shut-down procedures when using acoustic airguns. Additionally, most of the seismic survey routes will be in federal waters 30 miles or more from the coastline where marine mammals are less prevalent. Harnessing offshore energy reserves in an environmentally safe and responsible manner will lead to greater economic prosperity for North Carolina. A study by Quest Offshore finds that by 2035, new access to offshore energy resources off North Carolina could generate more than 55,000 jobs and $3 billion in annual spending within the state. Offshore oil and gas production would expand service businesses and attract support industries with a skilled and high-wage labor workforce. However, North Carolina would need to provide infrastructure, expand public services and implement new environmental protection measures to prepare for this new opportunity. As chair of the Outer Continental Shelf Governors Coalition, Governor McCrory’s support for offshore oil and gas development is contingent upon revenue sharing between the federal government and Mid-Atlantic States, as is done for Gulf Coast states. Because coastal states inherit all of the risk associated with offshore exploration and development, revenue sharing is critical in protecting the environment and our vibrant coastal economies. With revenue sharing and environmental protections in place, offshore energy can be developed without compromising the natural beauty, economies and habitats of our coastal areas.
Schematic of offshore reflection seismic surveying. Soundwaves are generated from an air gun and wave responses are captured by hydrophones. Hydrophone data are then used to generate seismic profiles suitable for geologic interpretation. (RigZone, 2016)

30
Energy Exploration Committee RecommendationsThe Energy Exploration Committee is chaired by John Brodman, Pine Knoll Shores Commissioner and retired U.S. Assistant Deputy Secretary of Energy, and includes George Baldwin of Piedmont Natural Gas, and N.C. Department of Commerce Secretary John Skvarla. Over the past two years, the committee has focused its attention on bringing oil and gas development opportunities to North Carolina and has proposed nine recommendations approved by the EPC to develop North Carolina’s offshore and onshore energy resources in a responsible manner. The committee also suggests that N.C. General Statute 113B-30 be revised with input from coastal communities. Coastal community support of offshore energy exploration and development may depend on the type of revenue sharing program adopted by the General Assembly.
Offshore Energy – approved 11/18/20151. Support Governor McCrory’s continued work with the Outer Continental Shelf Governors Coalition
to allow the environmentally responsible exploration of offshore energy resources, including oil and gas.
2. Support Governor McCrory’s position that sharing of federal revenue from lease sales, rents, and royalties is fundamentally necessary to develop this resource responsibly.
3. Recommend that a portion of the revenue the state receives be allocated to coastal communities to use at their discretion for required infrastructure development, coastal protection, mitigation and restoration projects.
4. Recommend continued outreach to coastal communities and elected officials. 5. Recommend that the governor, the General Assembly, and the Energy Policy Council seek the
support of North Carolina’s congressional delegation in emphasizing the importance of revenue sharing to help state and local communities manage risks and cover expenses related to offshore energy development.
General Comment: NC General Statute 113B-30 should be revised with input from coastal communities.
Onshore Energy – approved 7/9/20141. The state engage the services of a consulting geologist who is highly recognized by the oil and
gas industry to help determine the best use of exploration funds and to provide an independent assessment of North Carolina reserves.
2. The state pursue a possible joint venture with private companies to maximize the amount of data collected during the assessment of North Carolina resources.
3. DEQ should hire experienced regulators to handle the complex regulatory oversight needed to protect our environment and attract the highest quality oil and gas companies.
4. A portion of the severance tax be allocated to the county in which oil and gas development occurs.

31
Energy Assurance8
According to the American Society of Civil Engineers’ (ASCE) most recent assessment of the nation’s energy infrastructure, North Carolina’s electric power generation facilities and energy diversity, affordability and reliability are exceptional, and its electric power and natural gas transmission systems are good. (ASCE, 2015) North Carolina’s strengths include the availability of power supplies from the interconnection of electric power systems across the country, highly efficient baseload power generating facilities, and the relative size of utility generating capacity compared to overall load. A vulnerability identified by ASCE is North Carolina’s reliance on the Transcontinental Gas Pipeline (Transco) and the Gulf Coast region for almost all of its natural gas supply. Three interstate pipeline projects that are currently underway are expected to help alleviate that concern.
In contrast, ASCE rated America’s energy infrastructure as a whole as less than mediocre (ASCE, 2015). According to ASCE, the nation has reached a critical point where substantial investments in new generation, transmission and distribution systems are needed to address system congestion and replace aging equipment. Parts of the electric grid date back the 1880’s and additional reliability issues are emerging due to the premature retirement of conventional baseload plants.
Natural Gas North Carolina’s demand for natural gas is rising due to increasing use for electricity generation.
The expected growth in natural gas usage by all sectors could create shortfalls if gas pipeline capacity is not increased in the near future. The pipeline network serving North Carolina can be subject to constraints during periods of extreme demand, such as the intensely cold polar vortex events. During the January 2014 polar vortex, prices at one supply point in the Southeast soared to about twenty times their normal levels. Gas transport companies are planning three interstate pipeline projects to meet the increased demand. Reliable access to natural gas is a primary consideration for many businesses, particularly industrial operations, when deciding where to locate new facilities or expand existing ones. Completion of one or more of the following projects could improve the reliability of North Carolina’s fuel delivery, minimize price volatility, attract new industries, minimize emissions, and encourage existing business to grow:
1. The Atlantic Sunrise project, proposed by Transco, could provide up to a total of 1.7 billion cubic feet of additional gas each day for several states including North Carolina and enable bi-directional gas flow on the existing Transco pipeline (Williams, 2015). The pipeline would originate in Pennsylvania. The planned year-in-service is 2017 (U.S. Energy Information Administration, 2015).
8 UNC-Charlotte’s Energy Production and Interstructure Center was a source of much of the information in this section of the report.

2. The Atlantic Coast Pipeline LLC, a joint venture by Dominion, Duke Energy, Piedmont Natural Gas, and AGL Resources, could bring 1 billion cubic feet of gas each day into eastern North Carolina from West Virginia (Dominion, 2015). The planned year-in-service is 2018 (U.S. Energy Information Administration, 2015).
3. The Mountain Valley Pipeline LLC, a joint venture of EQT Midstream Partners, NextEra US Gas Assets, WGL Midstream and Vega Midstream Partners, could provide Transco with a second northern source of natural gas. The proposed project includes transporting up to 2 billion cubic feet of gas each day from West Virginia to the Transco pipeline (Mountain Valley Pipeline, LLC, 2015). The planned year in-service is 2018 (U.S. Energy Information Administration, 2015).
The intrastate gas pipeline network is also expanding. PSNC Energy plans to complete a pipeline replacement project in Polk, Henderson and Buncombe counties in 2016 and extend its transmisson network in Franklin and Wake counties to meet rising demand (Barr, 2014). Piedmont Natural Gas is connecting the Sutton Gas Power Plant in Wilmington to the Transco pipeline and enhancing distribution pipelines in Charlotte and near Goldsboro (Piedmont Natural Gas, 2015).
Natural Gas DisruptionsUndergound gas pipelines create a reliable infrastructure that is shielded from most natural hazards. North Carolina’s natural gas transmission and distribution system experienced only eight reported disturbances and accidents in past five years (U.S. Department of Transportation, 2015). A suspected lightning strike that caused a take-off station to catch on fire was the only weather-related incident. The other disruptions were caused by human error and included three pipeline ruptures that occurred during excavation. North Carolina’s “811 Call Before You Dig” program is raising awareness of gas line locations and preventing many pipleline disruptions.
Electric PowerAs of December 2015, about 1,300 MW nameplate capacity of solar energy facilities were in operation throughout the state. By the end of 2016, the nameplate capacity of distributed generation within the state is expected to reach more than 2,800 MWs.9 A significant portion of the new growth may connect
32
9 This amount is based on applications for the Safe Harbor Renewable Energy Tax Credit that the N.C. Department of Revenue recently received. Applicants paid $1,000 per MW to apply for the tax credit extension. Most projects are required to be 80% complete by Dec. 31, 2015 and all must be connected before Jan. 1, 2017 to qualify.
ATLANTIC SUNRISE
ATLANTIC COAST
PIPELINE

to the PJM service territory. The PJM interconnection queue shows 761 MW of renewable energy projects in operation or under construction in North Carolina with a Q4 2016 or earlier completion date, including the 208 MW Iberdrola Amazon Wind Farm U.S. East in northeastern North Carolina that will bring power into Virginia and Ohio. PJM has also approved or is evaluating requests for another 1180 MW of solar energy projects and 880 MW of wind energy projects in our state (PJM, 2016). In 2014, the average hourly consumption of electricity for North Carolinans in the PJM service was 508 MWh (EIA, 2016). Because renewable energy generation is likely to exceed demand, energy exchange may be needed.
Future energy exchange between service areas could drive the need for new high-capacity transmission lines. Through the North Carolina Transmission Planning Collaborative (NCTPC), Duke Energy and transmission-dependent utilities engage in a stakeholder process to identify transmission projects that need to be built for reliability, and determine the cost of these projects. NCTPC is currently involved in a study to analyze possible inefficiencies or reliability issues resulting from energy exchanged between the southeastern regional interconnection and the PJM transmission areas, mainly from energy imported to PJM (PJM, 2014).
The integration of potential offshore wind power facilities would require additional transmission infrastructure to move electricity inland. A 2011 study conducted by NCTPC estimated that $1.3 billion of high-voltage transmission lines and upgrades would be necessary to move 3,000 MWs of offshore wind power from the North Carolina coast to a large population center.
Electrical OutagesMost power outages in North Carolina are weather-related. Winter storms, severe thunderstorms, hurricanes, tornados, and extreme temperature events caused almost 90 percent of the 74 major power disruptions North Carolina experienced between 2003 and 2015. More than half of North Carolina’s population resides in counties where power transmission lines have historically experienced the effects of a high-intensity storm. Roughly five percent of power outages appear to be caused by suspected physical or cyber attacks. Human-caused power disruptions are representative of a nationwide trend and are expected to become an increasing threat.
33

Energy SecurityEnergy security depends on stable and affordable fuel supplies with a reliable infrastructure. It is important for North Carolina to stay well-connected to the primary national suppliers and maintain the fuel transportation infrastructure. Future rail infrastructure upgrades may be necessary for the continued, cost-effective operation of coal-fired power plants in North Carolina. According to ASCE’s 2013 infrastructure report, $545 million in investment is needed over the next 25 years to maintain the state’s freight rail system. Coal is shipped from out of state and makes up almost half of the total rail freight volume in North Carolina.10 Railroads are the main transportation mode for coal, with less than one percent being delivered by truck. All coal power plants, except for Elizabethtown Power LLC, rely on rail access for their coal deliveries. Policy changes at the federal level may impact future reliance on coal as an energy resource. In 2014, 41 percent of coal produced in the United States was mined on federal land (EIA, 2015). This is likely to decrease due to the Obama administration’s decision not to issue any new leases to mine coal on federal land.Diversification of fuel resources and suppliers also helps to decrease shortages and volatility. Nuclear power and renewable energy enhance energy assurance because they rely less on external suppliers in the value chain.
Growing ThreatsThe number of cyber and physical attacks and the risk of an extended widespread blackout due to malware or an electromagnetic pulse (EMP) are escalating. Failure to secure infrastructure control systems makes them vulnerable to physical damage and could cause major disruption of services. Transmission and distribution infrastructure operators rely on a network of sensors and controllers to monitor and manage their systems. These devices are increasingly becoming connected to the internet. Remote sensors and controls allow operators to manage their infrastructure from a central location
34
NC Electric Disturbances reported to the U.S. Department of Energy, 2003 – 2015. Prepared by UNC-Charlotte. Combined level of intensity of all severe weather events in North Carolina, 2000 – 2015. Prepared by UNC-Charlotte
10 2012: Lastest available data according to Association of American Railroads

but introduce new attack points where third parties can attempt to access control of the systems. Cyberattacks may directly disrupt power plants, transmission and distribution networks, and pipeline operations.
The Electric Power Research Institute (EPRI) finds that the “evolution toward operations in an increasingly complex electromagnetic environment in which large current and voltage components, sensitive electronics, digital signals, and analog waveforms coexist and interact” makes today’s power systems more vulnerable (Electric Power Institute, 2013). As noted by 23 congressional delegates in a November 2015 letter to Texas Governor Greg Abbot, “evidence continues to accumulate that many of our adversaries envision the use of EMPs against us in any future conflict. The Government of Iran has conducted missile tests consistent with the use of an EMP and Iranian military writings explicitly discuss nuclear EMP attacks of a kind that would devastate our nation. This real threat has forced our military to relocate assets of the North American Aerospace Command (NORAD) back to an EMP-hardened facility” (2015).
A nuclear EMP is a multi-pulse consisting of three components – E1, E2, and E3. When a typical nuclear device is detonated, a small amount of its energy is released as gamma radiation. If the nuclear burst is at high altitude, that gamma radiation will interact with atoms in the upper atmosphere and the Earth’s magnetic field to create an electric field that is known as the E1 pulse. E1 pulses are very brief, lasting approximately one millionth of second, but they are capable of producing momentary high voltages in electric transmission lines within the affected area. As a result, the electric field generated by an E1 pulse would be expected to burn out small transformers, damage electronic control systems and electronics that are plugged in, and possibly disable a fraction of vehicles within its range. The size of the affected area is dependent on the altitude at which the detonation occurs, with higher altitude nuclear explosions causing more widespread effects.
E2 pulses bear a resemblance to the type of electric field created by a lightning strike. Due to this similarity, most of the current infrastructure is already capable of withstanding an E2 pulse. There is still concern that E2 pulses could cause further harm to components previously damaged by the E1 pulse, but otherwise the E2 pulse is largely irrelevant when considering current susceptibilities.
The E3 component is the third aspect of a high altitude nuclear EMP. The E3 pulse is caused by the distortion of Earth’s magnetic field around the detonation of the nuclear device. This distortion creates a long-lasting (generally several minutes) electric field that produces a less intense current surge in affected transmission lines that could damage large transformers. Unlike E1 pulses, the size and severity of the E3 pulse is dependent on the blast yield of the detonated nuclear bomb.
EMPs also occur naturally from geomagnetic disturbances (GMDs) generated from the sun’s output. An extreme GMD could damage transformers and cause voltage instability or collapse of the bulk power grid. The geological characteristics of the Piedmont and Coastal Plain provide natural resistance to GMDs and lower the state’s risk. The most recent extreme GMD storm occurred in March 1989 and led to a 12 hour blackout in Quebec, Canada. There were more than 200 power grid issues in the U.S. but they had no impact on North Carolina. However, it is expected that a 150 – 500 year GMD storm, like the massive solar storm of 1859 known as the Carrington Event, would cause major power disruptions in our state (National Aeronautics and Space Administration, 2014). Measures to safeguard the bulk power grid from nuclear EMPs also protect it against intense GMDs.
35

Emergency Energy Committee Actions and FindingsThe Emergency Energy committee is chaired by Michael Van Wingerden of Metrolina Greenhouses and includes Paolo Carollo of Beta Renewables and Walt Coleman of Chicago Bridge and Iron. Richard Newell of Duke University served on the committee prior to the expiration of his term in November 2015. Over the past two years, members have focused their attention on emergency fuel supplies, emergency energy planning, and threats to critical energy infrastructure. The committee’s actions and findings are listed below.
Natural Gas PipelinesGas pipelines can be subject to constraints and bottlenecks during periods of extreme demand, such as the January 2014 polar vortex experience when the gas supply for many industries was curtailed and prices soared to multiples of their normal levels. The committee heard presentations from Shelby Jones of the Williams Company about the Transco pipeline; Jeff Davis, Division Director for the North Carolina Public Staff on natural gas pricing; and Michael Thompson of Dominion Power about the Atlantic Coast Pipeline project. The committee concludes that direct access to the gas-producing regions of Pennsylvania and/or West Virginia is needed so that North Carolina’s electric utilities can continue to provide affordable and reliable energy in the future.
Fuel for First RespondersThe availability of fuel for first responders is essential in ensuring the state’s ability to respond effectively to a widespread power outage. N.C. Emergency Management (NCEM) estimated that the percentage of commercial fuel stations either pre-wired to accept a portable generator or with a permanent generator was 2 percent in 2012. It determined that having only 2 percent of commercial stations with fuel service would not adequately protect citizens from the risk of prolonged recovery if an event similar to Hurricane Sandy in New Jersey were to happen in North Carolina. NCEM felt that some type of state incentive or mandate may be necessary to increase fuel availability but also recognized that some larger commercial fuel stations were adding back-up power capabilities based on the lessons learned from Hurricane Sandy.
In November 2014, the Emergency Energy Committee recommended that a fuel resiliency study be performed to determine the number of commercial gas stations with back-up generators or pre-wiring for generators. With federal funding obtained through the State Energy Program, NCEM reached out to 19 percent of the 6,414 commercial fuel stations identified in the state. The study found that more than 13 percent are either pre-wired to accept a portable generator or had a permanent generator in 2015. Most major operators that were contacted had pre-wiring for generators and programs to facilitate the storage and transportation of portable generators to various pre-wired sites affected by an outage or within an imminent disaster area. The committee found fuel availability should be sufficient in most incidences and expects that over time more stations will add pre-wired generator connections without state involvement.
36

2015 NCEM Commercial Fuel Station Study
Number Percent in Study
Percent in State
Contact-
ed
1,230 100% 19.2%
Respond-
ed
954 76.7% 14.9%
Pre-wired 836 67.9% 13.0%
Perma-nent
Gener-ator
14 1.1% 0.2%
Electric OutagesThe Emergency Energy Committee has assessed the measures that are in place to prevent and respond to weather-related outages, cyberattacks, and physical or terrorist attacks on North Carolina’s energy infrastructure. Over the past two years, committee members have met with emergency energy and energy infrastructure experts and concluded that electric power providers are generally well-equipped to address “low impact/high occurrence” events such as weather and animal-related outages. Power providers have protection plans for the most likely threats to their critical infrastructure with built-in system resiliency and contingency plans for outage response and recovery. Electric utilities are less prepared for “high impact/low probability” events that could have severe, widespread effects on reliable grid operation. This includes large-scale blackouts and damage to critical energy infrastructure. Potentially catastrophic events include EMPs produced by a single nuclear explosion detonated high in the atmosphere, severe geomagnetic disturbances (GMDs), and cyberattacks.
The Federal Energy Regulatory Commission has enforceable reliability standards for the nation’s bulk power system that address GMDs and cybersecurity, but there are no standards to protect electric transmission systems from the potentially devastating effects of a nuclear EMP. An EMP attack is unlikely, but the threat and risks are growing with the development of nuclear capabilities by foreign governments and the increasing use of electronics. The Congressional EMP Commission funded a series of tests using a simulator to analyze the impact to electronic control technologies used in power generation, transmission, pipeline distribution, and manufacturing plants. The study found that every tested electronic control system failed in some manner.
The committee found that Duke Energy prudently follows best mitigation practices by protecting against the most likely threats, building in system resiliency, and having contingency plans for outage response and recovery. Duke Energy and other electricity providers are proactively addressing cyber-attacks, however, the committee finds that they are not prepared at this time to effectively defend against an EMP event. Duke Energy is engaged in research to determine practical strategies to protect its critical infrastructure from the effects of such an event.
37
Introduction Page 5 of 78 March 1, 2016
In November 2014, the Emergency Energy Committee recommended that a fuel resiliency study be
performed to determine the number of commercial gas stations with back-up generators or pre-wiring
for generators. With federal funding obtained through the State Energy Program, NCEM reached out to
19 percent of the 6,414 commercial fuel stations identified in the state. The study found that more than
13 percent are either pre-wired to accept a portable generator or had a permanent generator in 2015.
Most major operators that were contacted had pre-wiring for generators and programs to facilitate the
storage and transportation of portable generators to various pre-wired sites affected by an outage or
within an imminent disaster area. The committee found fuel availability should be sufficient in most
incidences and expects that over time more stations will add pre-wired generator connections without
state involvement.
2015 NCEM Commercial Fuel Station Study
Number Percent in Study
Percent in State
Contacted 1,230 100% 19.2%
Responded 954 76.7% 14.9%
Pre-wired 836 67.9% 13.0%
Permanent Generator
14 1.1% 0.2%
Electric Outages The Emergency Energy Committee has assessed the measures that are in place to prevent and respond
to weather-related outages, cyberattacks, and physical or terrorist attacks on North Carolina’s energy
infrastructure. Over the past two years, committee members have met with emergency energy and
energy infrastructure experts and concluded that electric power providers are generally well-equipped
to address “low impact/high occurrence” events such as weather and animal-related outages. Power
providers have protection plans for the most likely threats to their critical infrastructure with built-in
system resiliency and contingency plans for outage response and recovery. Electric utilities are less
prepared for “high impact/low probability” events that could have severe, widespread effects on
reliable grid operation. This includes large-scale blackouts and damage to critical energy infrastructure.
Potentially catastrophic events include EMPs produced by a single nuclear explosion detonated high in
the atmosphere, severe geomagnetic disturbances (GMDs), and cyberattacks.
The Federal Energy Regulatory Commission has enforceable reliability standards for the nation’s bulk
power system that address GMDs and cybersecurity, but there are no standards to protect electric
transmission systems from the potentially devastating effects of a nuclear EMP. An EMP attack is
unlikely, but the threat and risks are growing with the development of nuclear capabilities by foreign

Emergency Energy PlanningTwo North Carolina contingency and emergency plans include the appropriate measures to protect public health, safety and welfare during a potential energy shortage. The primary emergency energy plan is ESF-12 (Energy), in Annex K of the N.C. Emergency Operations Plan. The ESF-12 plan identifies the agencies, policies, operations, organization, communications and response actions for managing a disruption of energy. This has proven to be an effective tool for addressing weather-related energy outages. NCEM, along with other key players who implement the plan, is involved in emergency drills and annual tabletop discussions in preparation to readily respond to an energy emergency. The North Carolina Energy Assurance Plan is the tactical plan for energy supply disruptions. It provides strategies for emergency energy planning, identifying energy disruptions before they become large-scale events, and implementing effective responses to supply disruptions in electricity, natural gas, and petroleum. It is used in conjunction with the N.C. Emergency Operations Plan and is periodically updated by the State Energy Program.
While the current plans are effective for short-term energy supply disruptions, the committee finds that they would not adequately protect public health, safety and welfare should North Carolina experience a widespread power blackout caused by a “low probability/high risk” event such as EMPs created by an extreme solar storm or a nuclear warhead. This could cause long-term, widespread power blackouts, transportation issues, power grid disruptions, and disable communications.
NCEM Actions for EMP Readiness/Response Plan In 2015, the N.C. Department of Public Safety (DPS) initiated a study of EMPs to learn how to best respond in the event of a widespread power outage. The information gathered in that study will be used for the purpose of developing an EMP readiness and response plan. The Division of Law Enforcement and NCEM are both involved in this effort. NCEM has established an EMP Working Group (EMPWG) to address readiness, response planning, and a state-level EMP executive committee for future EMP efforts. NCEM has also formed a state-level EMP executive committee that is working with the North Carolina InfraGard EMP-Special Interest Group to develop an EMP Annex to the Emergency Operations Plan.
Emergency Energy Committee Recommendations
EMP/GMD Preparedness – approved 1/27/20161. The Department of Public Safety, in coordination with the Department of Environmental Quality’s
Energy Group, should conduct a drill exercise simulating a “high impact/low probability” event that results in electrical outages and damage to critical power transformers. The purpose of the exercise is to assess crisis response and recovery and the ability of water supply and wastewater treatment systems, natural gas pipelines, and other essential services to function during an extended power outage.
2. North Carolina should encourage electric utilities to engage in research to determine practical strat-egies to protect their critical infrastructure from the damaging effects of a nuclear electromagnetic pulse (EMP).
3. North Carolina should assess the ability of critical communication systems, emergency response cen-ters, and state-owned electrical generators to function in the unlikely event of a nuclear EMP attack. It should also determine the appropriate actions, if any, the state should take to protect and harden critical systems against an EMP event.
38

39
Energy EfficiencyThe Amercian Council for an Energy Effcient Economy (ACEEE) promotes the adoption of policies, appliance standards, and building codes that support energy efficiency (EE). In its most recent scorecard
rankings, ACEEE recognized North Carolina’s EE policies as the best among southeastern states and 24th nationally. 11 As of April 2014, 23 states had mandatory EE requirements in place and two states, including North Carolina, allowed part of their Renewable Energy and Energy Efficiency Portfolio Standard (REPS) to be met with energy efficiency. The EE portion of North Carolina’s REPS is currently limited to 1.5% of prior-year sales and will increase to 5% of prior-year sales beginning in 2021.
It is the State of North Carolina’s policy to ensure that energy conservation practices are employed in the design, construction, operation, maintenance and renovation of state-owned buildings. This includes facilities at institutions of higher learning. The state promotes investment in energy conservation through its Utility Savings Initiative (USI) program. USI is a lead-by-example initiative that saved $166 million in energy and water costs in the public sector during fiscal year 2014-15. It has achieved more than $1 billion in reduced costs and a 32% reduction in energy use intensity from a 2002-2003 baseline. When it is cost-effective, major renovation projects and new buildings are designed to use 20 – 30 percent less energy than they would have used if designed according to the 2004 efficiency standards developed by the American Society of Heating, Refrigerating, and Air-Conditioning Engineers.
States with high energy prices generally rate higher on the ACEEE scorecard. As consumers pay more for energy, EE measures are more likely to be implemented due to the potential for cost savings. To encourage conservation, many electric and gas utilities have educational programs and offer incentives for LED light bulbs, efficient appliances and other energy-saving measures. The top three ACEEE rated states (Massachusetts, California and Vermont) spent 3 – 6 percent of their 2014 statewide utility revenues on EE programs. However, as of September 2015, the average residential electric rate in Massachusetts, California and Vermont was 50 percent higher than North Carolina’s residential rate.
ACEEE reports that in 2014, 0.86 percent of North Carolina’s statewide utility revenues were spent on EE programs. This amount is 2.6 times of the average amount spent by utilities in Georgia, South Carolina, Tennessee and Virginia but slightly below the U.S. average. North Carolina residential customers within the Duke Energy Carolinas service area pay 0.3621 cents per kilowatt hour to cover the cost of residential energy efficiency and demand-side management programs.
11 2012: Lastest available data according to Association of American Railroads.

40
43
Eleven of the 13 continental states with the highest energy prices consume substantially less energy per
Gross Domestic Product (GDP) produced than the U.S. average. As of 2011, North Carolina’s energy
intensity was six thousand Btus per each dollar of GDP and 19 percent below the national average.
Based on 2013 data compiled by the U.S. Energy Information Administration (EIA), North Carolina ranks
among the top ten states in lowest transportation energy use and 21st in lowest residential and
commerical energy consumption. In 2013, North Carolinians consumed 256 million Btus of energy per
capita, which was 16.5 percent below the national average.
7.8
6.8
3.94.4
3.5
7.6
4.3
6.0
3.54.0
3.6
5.3
6.0
7.4
0.0
1.0
2.0
3.0
4.0
5.0
6.0
7.0
8.0
9.0
10.0
Thou
sand
Btu
/$G
DP
Energy Intensity in Order of Highest Energy Cost Among the Top 13 Continental U.S. States with Highest Energy Cost
(2000-2011)
All data are available at http://www.eia.gov/state/seds/seds-data-
ACEEE Scorecard Ranking
Residential Electricity Rates
Based on 2013 data compiled by the U.S. Energy Information Administration (EIA), North Carolina ranks among the top ten states in lowest transportation energy use and 21st in lowest residential and commerical energy consumption. In 2013, North Carolinians consumed 256 million Btus of energy per capita, which was 16.5 percent below the national average.
Eleven of the 13 continental states with the highest energy prices consume substantially less per Gross Domestic Product (GDP) produced than the U.S. average. As of 2011, North Carolina’s energy intensity was six thousand Btus per dollar of GDP and 19 percent below the national average.

41
North Carolina’s 2013 industrial energy use per capita was 43 percent lower than the national average and about half of what industry in South Carolina consumed per capita in 2013. Louisiana, Wyoming, Alaska, North Dakota and Texas have the highest industrial energy use per capita and rank among the top states for crude oil and natural gas production. In 2013, the average energy price for these states, excluding Alaska, was $17.93/million Btu and 23 percent below the average price North Carolinians paid at $23.36/million Btu.
Transportation EnergyCars, trucks, airplanes, and other means of travel account for roughly 30 percent of the energy consumed within the state. Approximately 375 thousand barrels of petroleum per day – primarily motor gasoline – were consumed by North Carolina’s transportation sector during 2013. That year, North Carolina motorist spent $20.3 billion on fuel, which is more than the total spent on electricity, natural gas, and other industrial energy combined. Seventy percent of that fuel cost was refined motor gasoline ($14.4 billion). In 2013, North Carolina ranked 20th in highest transportation energy prices on a million Btu basis. North Carolina’s motor gasoline tax is currently ranks 8th highest in the nation.
Until recently, the Environmental Protection Agency (EPA) required North Carolina to use a more expensive motor gasoline formulated to reduce emissions that contribute to ozone formation in several of its metropolitan counties. DEQ successfully demonstrated to EPA that the volatile components of gasoline do not contribute to significant ozone formation in North Carolina. Beginning in 2014, residents in the Triangle and Triad regions of the state were no longer required to use the more expensive fuel and began saving about 7 cents per gallon at the fuel pump during the summer ozone season. Charlotte residents will see similar savings in 2016.

The recent drop in the price of fuel at the pump frees up income that North Carolinians can spend on other goods and services. Motor gasoline has and will continue to make up the majority of North Carolina’s transportation fuel costs. There are opportunities in the transportation sector to improve efficiency and environmental performance while providing more choices for consumers without state subsidies or tax incentives. Advanced technologies enable company fleets to be powered by lower cost and cleaner-burning gas. John Jessup, Executive Director of the North Carolina Propane Gas Association (NCPGA), presented to the EPC in January 2015 on the advantages of using propane to fuel vehicles and described how running buses on propane lowers emissions, fuel costs, and maintenance. Another example is Waste Industries, which employs a fleet of residential waste-hauling trucks in North Carolina that run entirely on compressed natural gas.
(U.S. Chamber of Commerce, 2014)
Energy Efficiency Committee Recommendations:
The Energy Efficiency committee is chaired by Rob Caldwell of Duke Energy and includes Vernon Cox of the N.C. Department of Agriculture and Consumer Services and Scott Tew of Ingersoll Rand. Over the past two years, the committee has focused on reducing wasteful and inefficient uses of energy resources through state policy. It has met with experts from the private sector, state government, university system and non-profit arena to learn more about EE opportunities and strategies to encourage implementation. With guidance from the State Building Commission, the N.C. High Performance Building Work Group, the N.C. Department of Transportation, and others, the committee prepared eight policy recommendations, approved by the EPC, to advance energy efficiency in state-owned buildings and to minimize fuel consumption by motor vehicles.
State Buildings – approved 11/19/20141. Revise the state buildings energy use reduction goal from 30 percent to 40 percent by 2025, with the
potential to achieve an additional $2 billion in utility cost reductions.
In 2015, North Carolina agencies and universities achieved the 30 percent energy use reduction goal established in G.S. § 143-64.12. The proposed 40 percent energy use reduction goal from the 2002
42
(U.S. Chamber of Commerce, 2014)

43
– 2003 baseline year will enhance the state’s competitiveness for federal grant funding opportunities and encourage further energy savings.
2. Strengthen and support the state’s Utility Savings Initiative (USI) for public facilities by providing a one percent pass-through of the annual avoided utility costs being achieved by the USI program.
USI, housed within DEQ, has supported state agencies and universities in avoiding $700 million in utility expenses since a 2002 – 2003 baseline year. To assist state facilities in meeting the proposed 40 percent energy use reduction goal from the 2002 – 2003 baseline year, USI will use the one percent pass-through budget of approximately $1.14 million to support training, engineering and technical assistance, outreach and incentives for energy project investments.
3. Establish a program with state governmental units to enable utility savings to be reinvested in short duration, rapid payback energy conservation measures.
Reinvesting energy cost reductions will incentivize state agencies and universities to re-commission buildings, optimize building automation systems and upgrade equipment.
4. Pursue a system of electronic data transfer from utility providers to customer’s/owner’s data collection and analysis systems with a focus on EPA Portfolio Manager. Access to electronic utility data will help state agencies and universities better manage energy and water use and costs, and identify the best opportunities for energy savings.
5. Establish a policy that provides for initial and ongoing staff training, resources, and retention to provide the skills needed to maintain state buildings in an energy-efficient manner.
6. Commissioning of New State Buildings – approved 1/27/2016Require building commissioning in all new state buildings to ensure they are brought online in optimal performance, saving taxpayers on the long-term cost of building operations.Commissioning a new building typically adds about 0.6 percent to the total construction cost. With the energy savings (typically 13 percent according to a Lawrence Berkeley Laboratory report) the payback period is 4.8 years.
Traffic – approved 11/19/20147. Regularly synchronize traffic signals in high volume commuter corridors so as to minimize idle time
at red lights, travel time by commuters, and fuel consumption by vehicles.8. Design road systems in high-volume commuter corridors to minimize idle time at red lights, travel
time by commuters and fuel consumption by vehicles.Most delays along a street or corridor occur at signalized intersections. Intelligent transportation systems, such as synchronized traffic lights, can often improve traffic flow at a fraction of the cost of road construction, increase safety while reducing travel time delays, vehicle emissions and fuel consumption. Failing to have an effective signal systems timing program costs millions in wasted fuel, the loss of other benefits, and leads to costlier transportation projects. Non-traditional road system designs such as superstreets in high-volume corridors provide reasonable access to side streets with signal control while improving safety, relieving congestion, reducing vehicle emissions and fuel consumption.

44
Left Turn on Red onto One-way Street – approved 1/27/20169. Revise General Statute § 20-158 “Control of Vehicles at Intersections” to allow motor vehicles
facing a steady red traffic control light to turn left from a one-way street onto another one-way street, unless prohibited by an appropriate signage. To protect the safety of pedestrians and other motorist, the following conditions shall apply to the “left turn on red” provision:
a) The vehicle must come to a complete stop before turning left.
b) The vehicle shall yield the right-of-way to other traffic and pedestrians using the intersection, including pedestrians who are moving towards the intersection, who are in reasonably close proximity to the intersection, and who are preparing to cross in front of the traffic that is required to stop at the red light.
c) Failure to yield to a pedestrian under this subdivision shall be an infraction, and the court may assess a penalty of not less than one hundred dollars ($100.00).Left turns on red (LTOR) from one-way streets onto one-way streets would allow North Carolina motorists to reduce their waiting time at the intersection, save fuel and decrease air emissions. A 1970’s Federal Highway Administration commissioned study found that allowing a right turn on red (RTOR) saved between 1 and 4.6 seconds (or 9 and 30%, respectively) of drivers’ time. Similar reductions in time spent waiting for traffic signals to turn green are expected for LTORs.
The Energy Policy and Conservation Act of 1975 recognized that allowing a vehicle to turn right at a red stop light after stopping (RTOR), and to turn left from a one-way street onto a one-way street at a red light (LTOR) after stopping, is an effective energy conservation measure. The act encouraged states, the District of Columbia and Puerto Rico to revise their traffic laws as necessary to allow RTOR and LTOR after stopping when practicably consistent with safety. According to a National Highway Traffic Safety Administration (NHTSA) report, as of Jan. 1, 1994, LTOR onto one-way streets is permitted in 43 of these jurisdictions and is illegal in nine, including North Carolina.

The amount of fuel consumed during idling is shown in the following table:
Vehicle Type FuelEn-gine Size
Gross Vehicle Weight (Pounds)
Idling Fuel Use (gallons/hour)
Compact Car (Ford Focus) Gas
2 liter -
0.16 No Load; 0.29 With Load
Large Sedan (Crown Victoria) Gas
4.6 liter -
0.39 No Load; 0.59 With Load
Medium Heavy Truck Gas
5-7 liter
19,700-26,000 0.84 No Load
Delivery Truck Diesel - 19,5000.84 No Load; 1.1 With Load
Tow Truck Diesel - 26,0000.59 No Load; 1.14 With Load
Transit Bus Diesel - 30,000 0.97 No Load
Source:
Ar-
gonne
Nation-
al Lab-
orato-
A reduction in the idling of delivery trucks and transit buses could have a positive effect on air quality in Charlotte and other metropolitan areas in the state. The EPA finds hourly emissions from the idling of heavy duty diesel vehicles (years 2002 – 2030) to be about 0.3 pounds of nitrogen oxides (NOx) per hour.
Traffic SafetyThe Energy Policy Act of 1992 required a study about the impact of allowing RTOR. The NHTSA reviewed Fatal Accident Reporting System (FARS) data and data from four state crash data files (Illinois, Indiana, Maryland, and Missouri) and concluded that “The results of the data analysis from the four state crash files suggest the following: Right-Turn-On-Red (RTOR) crashes represent a very small proportion of the total number of traffic crashes in the four states (0.05 percent). RTOR injury and fatal crashes represent a fraction of 1 percent of all fatal and injury crashes (0.06 percent).”
Next StepsThe Energy Policy Council will continue to focus its attention on advancing clean and efficient energy; responsibly expanding and protecting North Carolina’s energy infrastructure; and exploring and developing the state’s oil and gas resources. Much of its work will be performed at the committee level as described below.1. The Clean Energy Efficiency committee will be chaired by Secretary Donald R. van der Vaart of the N.C. Department of Environmental Quality and will include Paolo Carollo of Beta Renewables, Dr.
45
48
encouraged states, the District of Columbia and Puerto Rico to revise their traffic laws as necessary to allow RTOR and LTOR after stopping when practicably consistent with safety. According to a National Highway Traffic Safety Administration (NHTSA) report, as of Jan. 1, 1994, LTOR onto one-way streets is permitted in 43 of these jurisdictions and is illegal in 9 (including North Carolina).
The amount of fuel consumed during idling is shown in the following table:
Vehicle Type Fuel Engine Size
Gross Vehicle Weight (Pounds)
Idling Fuel Use (gallons/hour)
Compact Car (Ford Focus) Gas 2 liter - 0.16 No Load; 0.29 With Load
Large Sedan (Crown Victoria) Gas 4.6 liter - 0.39 No Load; 0.59 With Load
Medium Heavy Truck Gas 5-7 liter 19,700-26,000 0.84 No Load
Delivery Truck Diesel - 19,500 0.84 No Load; 1.1 With Load
Tow Truck Diesel - 26,000 0.59 No Load; 1.14 With Load
Transit Bus Diesel - 30,000 0.97 No Load
Source: Argonne National Laboratory, Idling Reduction Savings Calculator, accessed Nov. 4, 2015
A reduction in the idling of delivery trucks and transit buses could have a positive effect on air quality in Charlotte and other metropolitan areas in the state. The EPA finds hourly emissions from the idling of heavy duty diesel vehicles (years 2002 – 2030) to be about 0.3 pounds of nitrogen oxides (NOx) per hour.
Traffic SafetyThe Energy Policy Act of 1992 required a study about the impact of allowing RTOR. The NHTSA reviewed Fatal Accident Reporting System (FARS) data and data from four state crash data files (Illinois, Indiana, Maryland, and Missouri) and concluded that “The results of the data analysis from the four state crash files suggest the following: Right-Turn-On-Red (RTOR) crashes represent a very small proportion of the total number of traffic crashes in the four states (0.05 percent). RTOR injury and fatal crashes represent a fraction of 1 percent of all fatal and injury crashes (0.06 percent).”
Next Steps
The Energy Policy Council will continue to focus its attention on advancing clean and efficient energy; responsibly expanding and protecting North Carolina’s energy infrastructure; and exploring and developing the state’s oil and gas resources. Much of its work will be performed at the committee level as described below.
1. The Clean Energy and Energy Efficiency committee will be chaired by Secretary Donald R. van der Vaart of the N.C. Department of Environmental Quality and will include Paolo Carollo of Beta
The amount of fuel consumed during idling is shown in the following table:
A reduction in the idling of delivery trucks and transit buses could have a positive effect on air quality in Charlotte and other metropolitan areas in the state. The EPA finds hourly emissions from the idling of heavy duty diesel vehicles (years 2002 – 2030) to be about 0.3 pounds of nitrogen oxides (NOx) per hour.
Traffic SafetyThe Energy Policy Act of 1992 required a study about the impact of allowing RTOR. The NHTSA reviewed Fatal Accident Reporting System (FARS) data and data from four state crash data files (Illinois, Indiana, Maryland, and Missouri) and concluded that “The results of the data analysis from the four state crash files suggest the following: Right-Turn-On-Red (RTOR) crashes represent a very small proportion of the total number of traffic crashes in the four states (0.05 percent). RTOR injury and fatal crashes represent a fraction of 1 percent of all fatal and injury crashes (0.06 percent).”
Next StepsThe Energy Policy Council will continue to focus its attention on advancing clean and efficient energy; responsibly expanding and protecting North Carolina’s energy infrastructure; and exploring and developing the state’s oil and gas resources. Much of its work will be performed at the committee level as described below.1. The Clean Energy Efficiency committee will be chaired by Secretary Donald R. van der Vaart of the
N.C. Department of Environmental Quality and will include Paolo Carollo of Beta Renewables, Dr. Herb Eckerlin of N.C. State University, and Walt Coleman of Chicago Bridge and Iron. Its emphasis for the near future will be:

46
Next StepsThe Energy Policy Council will continue to focus its attention on advancing clean and efficient energy; responsibly expanding and protecting North Carolina’s energy infrastructure; and exploring and developing the state’s oil and gas resources. Much of its work will be performed at the committee level as described below.1. The Clean Energy Efficiency committee will be chaired by Secretary Donald R. van der Vaart of the
N.C. Department of Environmental Quality and will include Paolo Carollo of Beta Renewables, Dr. Herb Eckerlin of N.C. State University, and Walt Coleman of Chicago Bridge and Iron. Its emphasis for the near future will be:
• Identifying the best practices, technology and incentives for building advanced nuclear energy in North Carolina cost-effectively, on budget, on schedule and in a manner which protects the ratepayer
• Increasing swine waste energy projects in eastern North Carolina• Promoting cost-effective energy efficient generation and energy efficiency measures• Ensuring proper management of utility-scale solar energy facilities at end of life• Evaluating the economic and environmental benefits and costs of pairing solar energy with
energy storage to provide baseload power generation and comparing the benefits and costs to nuclear baseload energy
2. The Energy Infrastructure and Emergency Energy committee will be chaired by Carl Wilkins of Quanta Technologies and will include Rob Caldwell of Duke Energy, Michael Van Wingerden of Metrolina Greenhouses, and Vernon Cox of the N.C. Department of Agriculture and Consumer Services. Its emphasis for the near future will be:
• Advising the N.C. Departments of Public Safety and Environmental Quality on emergency energy matters, including EMP/GMD preparedness and tabletop drill exercises
• Identifying beneficial and adverse effects to the electric power grid associated with the integration of intermittent and distributed generation resources and strategies to minimize any adverse impacts
• Advancing natural gas interstate pipeline and necessary electric transmission projects in North Carolina
3. The Energy Exploration committee will be chaired by John Brodman, former Deputy Assistant Secretary with the U.S. Department of Energy, and will include Secretary John Skvarla of the N.C. Department of Commerce, George Baldwin of Piedmont Natural Gas, and Scott Tew of Ingersoll Rand. It will continue its focus on the responsible exploration and development of North Carolina’s on- and offshore energy resources.

47
Appendix A: Current and Historical Electric Data
5
NORTH CAROLINA ELECTRICITY GENRATION CAPACITY
NC Utility Owned and Nonutility Owned Electric Power Generation CapacityNameplate MW
Year Coal NGCC NGCT Fuel Nuclear HydroPumped
StorageBiomass Solar Other Total
2007 13,068 6,616 564 4,975 1,960 84 342 0 37 27,646
2008 13,069 6,679 558 4,958 1,952 90 338 3 47 27,694
2009 12,952 6,718 560 4,958 1,952 86 338 3 50 27,617
2010 12,766 6,742 573 4,958 1,956 86 508 35 50 27,674
2011 12,251 8026 544 4,970 1,964 86 523 45 50 28,459
2012 12,105 4,075 6,011 447 4,998 1,964 86 535 115 54 30,390
2013 10,795 4,698 6,068 402 5,076 1,997 86 562 333 54 30,071
2014 10,795 4,707 6,036 402 5,076 1,997 86 563 596 54 30,312
2015 10,827 4,745 6,036 402 5,094 1,999 86 5871300
estimate54 31,130
Change
from
2007
-2,241 4,165 -162 +119 +39 +2 +245 +1,300 +17 +3,484

48

49
Residential Electricity Consumers
Red: Heating degree days
Blue: Cooling degree days(State Climate Office of North Carolina)
Heating degree days is the number of degrees that a day’s average temperature is below 65o Fahrenheit (18o Celsius), the temperaturs below which buildings needs to be heated.

50
Advanced metering information gives customers greater control over their electric usage and provides the opportunity to expand demand side management and pre-paid payment options. Customers who switch to pre-pay generally use about 10 percent less energy than they previously consumed.
2014 Net Metering ParticipationAmong Residential Customers
2014 Residential Electric Motors
(EIA, 2015)
The residential sector ac-counts for 44% of N.C.’s
electric sales. The average N.C. household used 1.1 MWh
per month of electricity and paid $126 monthly (plus taxes)
for electricity.
AMR = automatic meter readerAMI = advanced metering information
AMR = automatic meter readerAMI = advanced metering informationForm EIA-826
Commercial Electric Meters Industrial Electric Meters
(EIA, 2015)

Appendix B: Growth Forecasts
51

52
55
Service area shown in teal.
Duke Energy Progress expects energy demand to increase by 20 percent from 2015 levels by 2030, and summer peak without energy efficiency to increase by 25 percent during the same period.
SUMMER PEAK
Load Duration Curve (Duke Energy Carolinas, 2015)
Duke Energy Progress (DEP)Source: Duke Energy IRP Nov 6 2015 Presentation
• Residential: added 17,000 customers over the past year (~1.4% on 1.3mm).
• Commercial is growing faster, with a projected growth rate of 1.5%.
• Industrial sales have been flat over the last 6 years (DAK, Invista, etc).
• Wholesale: ~1/3rd of total load.
SUMMER PEAK
Load Duration Curve (Duke Energy Progress, 2015)

53
The peaks and sales in the tables and charts below are at the generator, except for the Class sales forecast, which is at meter.
Growth Rates of Retail and Wholesale Cusomers (2016-2030)
A 17% summer planning reserve margin is required to maintain the one-day-in-10 year loss of load events (LOLE) standard. Duke Energy Carolinas’ (DEC) and Duke Energy Progress’ (DEP) resource plan reflects reserve margins ranging from 17.0% to 21.9%. The projected average annual growth rates from DEC’s and DEP’s spring 2015 forecast for 2016-2030 is based upon real income growth at 2.7 percent; industrial production index at 2.1 percent; and population growth at 1.0 percent. DEC projects to add an incremental 241 MW of energy efficiency (EE) and 95 MW of DSM.
During the planning period, the company plans to meet 25% of the total obligation with EE savings, which is the maximum allowable amount under NC Gen. Stat. § 62- 133.7(b) (2) c. DEC continues to develop and offer its customers new EE programs that will deliver savings and count towards its future NC REPS requirements. The projected avoided cost rates represent the annualized avoided cost rates proposed by the Company in Docket No. E-100, Sub 140.
Load Duration Curve with Energy Efficiency Programs & Before Demand Reduction Programs

54
DUKE ENERGY CAROLINA (DEC)
Source: Duke Energy IRP Nov 6 2015 Presentation
Service area shown in green
DEC expects energy demand to increase by 20 per-cent from 2015 levels by 2030, and summer peak without EE to increase by 25 percent during the same period.
SUMMER PEAK
Load Duration Curve (Duke Energy Progress, 2015)
• Residential: added 29,000 customers over the past year (~1.4% on 1.3mm).
• Commercial is growing faster, with a projected growth rate of 1.5%.
• Industrial sales have grown 2% annually over the past 6 years.
• Wholesale: ~1/10th of total load.
SUMMER PEAK
Duke Energy Carolinas (DEC)Source: Duke Energy IRP Nov 6 2015 Presentation

55
Over the five-year period represented in the Short-Term Action Plan, DEP projects adding an incremental 115 MW of EE and 149 MW of DSM. Over the 15-year planning horizon, DEP expects to require 5,292 MW of additional generating resources in addition to the incremental renewable resources, EE, and DSM that are already in the resource plan. The growth projection rates for DEC apply to DEP.
Duke Energy Planned Generation Resources As of September 2015, DEC had 21,434 MW of installed generating capacity (summer rating), and
2015 DEP Load Forecast Growth Rates vs. 2014 Load Forecast Growth Rates (Retail and Wholesale Customers)
Duke Energy Progress North Carolina2015 IRP Update Reporrt Integrated Resource PlanSeptember 1, 2015
Load Duration Curve with Energy Efficiency Programs & Before Demand Reduction Programs

56
Duke Energy Renewable Energy GrowthSource: Duke Energy IRP Nov 6 2015 Presentation
Duke Energy Planned Generation Resources As of September 2015, DEC had 21,434 MW of installed generating capacity (summer rating), and DEP had 12,923 MW of installed generating capacity (summer rating), not including purchases and non-utility owned capacity. Their combined 15 year plan includes:

57
The solar contribution to summer peak is based on 46% of nameplate capcity

58
61
DOMINION NC POWER (DNCP)

59
62
Source: Dominion Power 2015 IRP
DNCP projects growth in electricity usage by the residential and commercial sector in its North Carolina service area during the next 5, 10 and 15 years, with 2030 power consumption 30 percent higher than 2015 levels. It expects industrial electricity use to increase slightly through 2020 and then decline by 16.7 percent from 2015 levels by 2030. The amount of renewable energy projects in PJMs interconnection queue for development in DNCP’s service area exceed its total REPs requirements for 2025.
Service area shown in white. Projected Electric Use in GWh
DNCP Total REPS Requirements
PJM presentation to the Energy Policy Council, July 2015
DNCP projects growth in electricity usage by the residential and commercial sector in its North Carolina service area during the next 5, 10 and 15 years, with 2030 power consumption 30 percent higher than 2015 levels. It expects industrial electricity use to increase slightly through 2020 and then decline by 16.7 percent from 2015 levels by 2030. The amount of renewable energy projects in PJM’s interconnection queue for development in DNCP’s service area exceed its total REPs requirements for 2025.

60
63
EIA SOUTH ATLANTIC ENERGY USE PROJECTIONS
0
0.2
0.4
0.6
0.8
1
1.2
1.4
1.6
Electricity Natural Gas Renewable Energy Propane Distillate Fuel Oil
Quad
rillio
n Bt
u's
Residiential Energy EIA Reference Case
2015 2020 2025 2030 2035 2040
0
0.2
0.4
0.6
0.8
1
1.2
1.4
Electricity Natural Gas Propane Fuel Oil Renewable Energy
Quad
rillio
n Bt
u's
Commercial EnergyEIA Reference Case
2015 2020 2025 2030 2035 2040
0
0.1
0.2
0.3
0.4
0.5
0.6
0.7
0.8
Electricity Natural Gas RenewableEnergy
Liquid Fuels Coal Biofuels
Quad
rillio
n Bt
u's
Industrial EnergyEIA Reference Case
2015 2020 2025 2030 2035 2040
EIA South Atlantic Electric Generation Projections
Residential EnergyEIA Reference Case
Commercial EnergyEIA Reference Case
Industrial EnergyEIA Reference Case

61
64
EIA SOUTH ATLANTIC ELECTRIC GENERATION PROJECTIONS
0
0.5
1
1.5
2
2.5
3
3.5
4
Steam Coal Nuclear Natural Gas Renewable Energy
Quad
rillio
n Bt
u's
EIA High Oil Cost Case
2015 2020 2025 2030 2035 2040
0
0.5
1
1.5
2
2.5
3
3.5
4
Steam Coal Nuclear Natural Gas Renewable Energy
Quad
rillio
n Bt
u's
EIA Low Oil Cost Case
2015 2020 2025 2030 2035 2040
0
0.5
1
1.5
2
2.5
3
3.5
4
Steam Coal Nuclear Natural Gas Renewable Energy
Quad
rillio
n Bt
u's
EIA Reference Case
2015 2020 2025 2030 2035 2040
EIA South Atlantic Electric Generation Projections
EIA Reference
EIA Low Oil Cost Case
EIA High Oil Cost Case

62
65
EIA SOUTH ATLANTIC TRANSPORTATION ENERGY PROJECTIONS
0
0.5
1
1.5
2
2.5
3
3.5
MotorGasoline
Fuel Oil Jet Fuel Natural Gas E85 Propane Electricity
Qua
drill
ion
Btu'
s
EIA Reference Case
2015 2020 2025 2030 2035 2040
0
0.5
1
1.5
2
2.5
3
3.5
Motor Gasoline Fuel Oil Jet Fuel Natural Gas E85 Propane Electricity
EIA High Oil Cost Case
2015 2020 2025 2030 2035 2040
0
0.5
1
1.5
2
2.5
3
3.5
4
MotorGasoline
Fuel Oil Jet Fuel Natural Gas E85 Propane Electricity
Qua
drill
ion
Btu'
s
EIA Low Oil Cost Case
2015 2020 2025 2030 2035 2040
EIA South Atlantic Electric Generation Projections
EIA Reference
EIA High Oil Cost Case
EIA Low Oil Cost Case

63
66
Appendix C: Energy Efficiency Energy Efficiency Residential Program Costs (EIA, 2015)
Utility Name Incremental
MWh Savings
Peak Savings MWh
2014 Incentive $million
2014 Total Cost $million
Average EE Program Lifetime
Years
Lifetime $/MWh Energy
Avoided
Lifetime $/MWh Peak
Avoided
DEC 263,591 338.9 $17,026 36,376 4.5
$31 $23,959
DEP 213,027 29.1 23,913 37,618 7.2 $25 $180,295
NC EMC's 25,882 2 263 1,322 8 $6 $78,485
NC Municipalities 1,766 1 203 369 10 $21 $36,900
Dominion 330 0 187 323 12 $82 --
TVA 391 0 76 123 16 $20 --
Residential Electricity Consumption 2005 2014 Change Savings
NC Population 8,685,811 9,953,687 14.60%
Approximately 3 GWh
Residential Electric Use (MWh) 54,072,734 58,649,994 8.47%
Residential MWh per Capita 6.23 5.89 -5.46%
Residential Electric Customers 3,929,358 4,303,476 9.52%
MWh Per Household 13.76 13.63 -0.96%
Commercial Energy Efficiency Programs
Utility Name Incremental
MWh Savings
Peak Savings MWh
2014 Incentive $million
2014 Total Cost
$million
Average EE
Program Lifetime
Years
Lifetime $/MWh Energy
Avoided
Lifetime $/MWh Peak
Avoided
Duke Energy Carolinas 162,895 291.5 19,894 $23,273 10 $14 $8,008
Duke Energy Progress 168,189 35.3 14,068 $18,107 6.4 $17 $80,652
NC EMC's 13,533 0 152 $170 7 $2 ---
NC Municipalities 1,266 1 521 $618 4 $122 $154,500
Dominion 978 0 190 $331 10 $34 $165,500
Carolinas & Virginia
Dominion Energy Efficiency Potential Study, Jan. 2015
-
1,000
2,000
3,000
4,000
2012 2013 2014 2015 2016 2017 2018 2019 2020 2021
Meg
awat
ts
EIA Projected NC, SC, VA Projected Energy Efficiency and Demand Response
New Conservation (Energy Efficiency) Total Controllable Demand Response
Appendix C: Energy Efficiency

64
Dominion Energy Efficiency Potential Study, Jan. 2015http://starw1.ncuc.net/NCUC/ViewFile.aspx?Id=c57d0018-935c-443b-8b77-df1cd5f515fa

65
With a 50% rebate program, the 10-year cumulative potential residential EE savings is 5%
With a 75% rebate program, the 10-year cumulative potential residential EE savings is 8%
With a 50% rebate program, the 10-year cumulative potential non-residential EE savings is 2%
With a 75% rebate program, the 10-year cumulative potential non-residential EE savings is 4%
Energy Savings Potential as a Percent of Total Sales
Ten Year Cumulative Potential - GWh

66
69
Residential Energy Use by End-Use

67
70
DNCP
Non-Residential Energy Use by End-Use

68
71
For purposes of its Demand-Side Management programs (DSM) in North Carolina, the definitions set forth in NCGS § 62‐133.8 (a) (2) and (4) for DSM and energy efficiency measures as defined below apply.
Demand-Side Management: activities, programs, or initiatives undertaken by an electric power supplier or its customers to shift the timing of electricity use from peak to nonpeak demand periods. DSM includes, but is not limited to, load management, electric system equipment and operating controls, direct load control, and interruptible load.
Energy Efficiency Measure: equipment, physical, or program change implemented after Jan. 1, 2007 that results in less energy used to perform the same function. Energy efficiency measures includes, but are not limited to, energy produced from a combined heat and power system that uses nonrenewable energy resources. It does not include DSM.
For purposes of its Demand-Side Management programs (DSM) in North Carolina, the definitions set forth in NCGS § 62-133.8 (a) (2) and (4) for DSM and energy efficiency measures as defined below apply. Demand-Side Management: activities, programs, or initiatives undertaken by an electric power supplier or its customers to shift the timing of electricity use from peak to nonpeak demand periods. DSM includes, but is not limited to, load management, electric system equipment and operating controls, direct load control, and interruptible load. Energy Efficiency Measure: equipment, physical, or program change implemented after Jan. 1, 2007 that results in less energy used to perform the same function. Energy efficiency measures includes, but are not limited to, energy produced from a combined heat and power system that uses nonrenewable energy resources. It does not include DSM.

69
Notes: (1) Programs are now closed. (2) Programs approved by the Commission on December 16, 2013. (3) Programs approved by the Commission on October 27, 2014. (4) For REPS reporting and compliance purpose, DNCP will rely upon EE savings achieved by North Carolina customers.
Savings (MWh) North Carolina Energy Efficiency Programs
Company’s North Carolina Retail Sales1
70
References
(2015, November 2). Retrieved from https://culberson.house.gov/uploadedfiles/delegation_letter_to_governor_abbott_re-garding_electric_grid.pdf
American Coalition for Clean Coal. (2012). Energy Cost Impacts on North Carolina Families. Retrieved from Amercia’s Power: http://americaspower.org/sites/default/files/NC_Energy_Cost_Analysis_2012.pdf
ASCE. (2015, November 12). 2013 Report Card for America’s Infrastructure. Retrieved from www.infrastructurereportcard.org/a/#p/energy/overview
ASCE. (2015, November 12). 2013 Report Card for North Carolina’s Infrastructure. Retrieved from 2013 Report Card for America’s Infrastructure: www.infrastructurereportcard.org/wp-content/uploads/2013/03/2013-Re-port-Card-for-North-Carolina-Infrastructure-Lo-Res.pdf
Barr, S. (2014, July 14). PSNC Energy plans pipeline extension for Franklin, Wake. Retrieved from The News & Observer: http://marcellus.com/news/id/102908/psnc-energy-plans-pipeline-extension-franklin-wake/
Carolinas, D. E. (2015, Sep 28). Base Load Power Plant Performance Report. Retrieved from NC Utilities Commission: http://starw1.ncuc.net/NCUC/ViewFile.aspx?Id=bb6639ce-c9f4-4497-a6f3-41ca23c19fa2
Coral Davenport, T. N. (2016, January 15). In Climate Move, Obama Halts New Coal Mining Leases on Public Lands. Retrieved from The New York Times: Coral Davenport, The New York Times “In Climate Move, Obama Halts New Coal Mining Leases on Public Lands” January 14, 2016, Available at http://www.nytimes.com/2016/01/15/us/politics/in-cli-mate-move-obama-to-halt-new-coal-mining-leases-on-public-lands.htm
DEC, L. (2015, July 30). Renewable Energy Portfolio Standard Rider, Electricity No. 4, North Carolina Seventh Revised Leaf No. 68. Retrieved from Duke Energy Carolinas North Carolina Electric Rates: https://www.duke-energy.com/pdfs/ncreps.pdf
Deutsche Bank Securities. (2015, Feb 27). Industry Solar F.I.T.T. for Investors. Retrieved from Deutsche Bank Markets Re-search: https://www.db.com/cr/en/docs/solar_report_full_length.pdf
Dominion. (2015, November 12). The Case for ACP. Retrieved from Dominion: https://www.dom.com/corporate/what-we-do/atlantic-coast-pipeline/the-case-for-acp
Dominion. (n.d.). The Case for ACP. (Dominion) Retrieved August 12, 2015, from https://www.dom.com/corporate/what-we-do/atlantic-coast-pipeline/the-case-for-acp
Duke Energy Carolinas. (2015, Sep 12). Docket E-100 Sub 141. Retrieved from NC Utilities Commission: http://starw1.ncuc.net/NCUC/ViewFile.aspx?Id=58852fc2-74a9-4e4b-9e8f-043fdff85b2f
Duke Energy Progress. (2015, Sep 12). Docket E-100 Sub 141. Retrieved from NC Utilities Commission: http://starw1.ncuc.net/NCUC/ViewFile.aspx?Id=aa6bf5eb-3b45-424d-ad9d-913dd5cb788c
Economic Development Partnership of North Carolina. (2016, 1 20). Thrive in North Carolina. Retrieved from Workforce in North Carolina: http://www.thrivenc.com/workforce-north-carolina
EIA. (2015, July 17). Sales of Fossil Fuels Produced from Federal and Indian Lands, FY 2003 through FY 2014. Retrieved from EIA: https://www.eia.gov/analysis/requests/federallands/EIA. (2015, Sep 8). Electric generator capacity factors vary widely across the world. Retrieved from Today in Energy: http://www.eia.gov/todayinenergy/detail.cfm?id=22832
EIA. (2015, Oct 23). Electric power sales, revenue, and energy efficiency Form EIA-861 detailed data files. Retrieved from U.S. Energy Information Administration - Electricity: http://www.eia.gov/electricity/data/eia861/
EIA. (2015, March 10). Form EIA-923. Retrieved from Energy Information Administration: http://www.eia.gov/electricity/data/eia923/
EIA. (2016, January 28). Form EIA-826 detailed data . Retrieved from Electricity: http://www.eia.gov/electricity/data/eia826/
EIA, U. (2014, May). 2013 Uranium Marketing Annual. Retrieved from U.S. Energy Information Administration: http://www.eia.gov/uranium/marketing/pdf/2013umar.pdf

71
Electric Power Institute. (2013, December 22). Electromagnetic Pulse and Intentional Electromagnetic Interference (EMI) Threats to the Power Grid: Characterization of the Threat, Available Countermeasures, and Opportunities for Technology Research. Retrieved from EPRI: http://www.epri.com/abstracts/Pages/ProductAbstract.aspx?Produc-tId=000000003002000796
Evans, S. (2015, Oct 22). Factcheck: The steel crisis and UK electricity prices. Retrieved from Carbon Brief, Clear on Climate: http://www.carbonbrief.org/factcheck-the-steel-crisis-and-uk-electricity-prices?utm_content=buffer108a2&utm_medium=social&utm_source=twitter.com&utm_campaign=buffer
Hughs, G. (2011, Aug.). The Myth of Green Jobs, GWPF Report 3. Retrieved from The Global Warming Policy Foundation: http://thegwpf.org/images/stories/gwpf-reports/hughes-green_jobs.pdf
Institute for Geophysics, The University of Texas at Austin. (2016, January 12). Seismic Project Information MGL1408. Re-trieved from Marine Geoscience Data System: http://www-udc.ig.utexas.edu/sdc/cruise.php?cruiseIn=mgl1408#s-egy_proc
International Electrictechnical Commission. (2012, October 1). Grid integration of large-capacity, Renewable Energy sources and use of large-capacity Electrical Energy Storage. Retrieved from IEC (International Electrictechnical Commission: http://www.iec.ch/whitepaper/pdf/iecWP-gridintegrationlargecapacity-LR-en.pdf
Klein, D. E. (2014, July 14). Measuring Energy Security Risk. Retrieved from U.S. Energy Information Administration: http://www.eia.gov/forecasts/documentation/workshops/pdf/2_Klein%20-%20Measuring%20Energy%20Security%20Risk%20v3%20-%2015Jul2014.pdf
Mountain Valley Pipeline. (n.d.). Overview. (Mountain Valley Pipeline Project) Retrieved August 12, 2015, from http://moun-tainvalleypipeline.info/
Mountain Valley Pipeline, LLC. (2015, November 12). Overview. Retrieved from Mountain Valley Pipeline : http://mountain-valleypipeline.info/
N.C. Sustainable Energy Association. (2016, February 2). North Carolina Installed Solar System. Retrieved from North Caroli-na Sustainaable Energy Association: http://energyncmaps.org/gis/solar/index.html
N.C. Sustainable Energy Association. (2016, February 2). North Carolina Installed Solar System. Retrieved from North Caroli-na Sustainaable Energy Association: http://energyncmaps.org/gis/solar/index.html
National Aeronautics and Space Administration . (2014, July 23). Near Miss: The Solar Superstorm of July 2012. Retrieved from NASA Science News: http://science.nasa.gov/science-news/science-at-nasa/2014/23jul_superstorm/
National Science Foundation and Geo-Prisms Cruise. (2016, January 12). Eastern North American Margin Community Seismic Experiment. Retrieved from Cruise MGL1408 ,aboard the Research Vessel Marcus G Langseth: http://www.ma-rine-geo.org/tools/search/data/field/Langseth/MGL1408/docs/MGL1408_cruise_report_v2_with_appendices.pdf
North American Electric Reliability Corporation. (2014). 2014 Long-Term Reliability Assessment. Atlanta: NERC.
North Carolina Transmission Planning Cooperative. (2015). Report on the NCTPC 2014-2024 Collaborative Transmission Plan.
Nuclear Energy Institute. (2016, January 22). Costs: Fuel, Operation, Waste Disposal & Life Cycle. Retrieved from NEI : http://www.nei.org/Knowledge-Center/Nuclear-Statistics/Costs-Fuel,-Operation,-Waste-Disposal-Life-Cycle
Piedmont Natural Gas. (2015, November 12). Pipeline Projects. Retrieved from Piedmont Natural Gas: http://www.pied-montng.com/about/pipelineprojects/main.aspx
Piedmont Natural Gas. (n.d.). Pipeline Projects. (Piedmont Natural Gas) Retrieved August 12, 2015, from http://www.pied-montng.com/about/pipelineprojects/main.aspx
PJM. (2014, June 30). PJM 2014 Regional Transmission Expansion Plan. Retrieved from http://www.pjm.com/documents/reports/rtep-documents/2014-rtep.aspx
PJM. (2015). PJM 2014 Regional Transmission Expansion Plan.
PJM. (2016, February 24). Generation Queues - Active (ISA, WMPA, etc.). Retrieved from pjm: http://www.pjm.com/plan-ning/generation-interconnection/generation-queue-active.aspx

72
Progress, D. E. (2015, Sep 29). Power Plant Performance Report. Retrieved from NC Utilities Commission: http://starw1.ncuc.net/NCUC/ViewFile.aspx?Id=6ec201cf-2b52-4de1-91ca-1c498611ad0f
RigZone. (2016, January 12). How Does Marine Seismic Work. Retrieved from http://www.rigzone.com/training/insight.asp?insight_id=303
Ro, S. (2014, Aug. 3). Something About The American Energy Boom Story Doesn’t Make Sense. (Business Insider) Retrieved Jan. 19, 2016, from http://www.businessinsider.com/energy-intensive-manufacturing-jobs-2014-8
Sarah Barr. (2014, July 14). PSNC Energy plans pipeline extension for Franklin, Wake. (The News & Observer) Retrieved Au-gust 12, 2015, from http://marcellus.com/news/id/102908/psnc-energy-plans-pipeline-extension-franklin-wake/
Scott, R. (2015, January 22). Economic Policy Institute. Retrieved from The Manufacturing Footprint and the Importance of U.S. Manufacturing Jobs: http://www.epi.org/publication/the-manufacturing-footprint-and-the-impor-tance-of-u-s-manufacturing-jobs/
State Climate Office of North Carolina. (2015). Historical Background. Retrieved from State Climate Office of North Carolina: http://climate.ncsu.edu/climate/drought/historical
Transcontinental Gas Pipe Line Company LLC. (n.d.). Atlantic Sunrise - About the project. (Williams) Retrieved August 12, 2015, from http://atlanticsunriseexpansion.com/about-the-project/overview/
U.S. Chamber of Commerce. (2014). Index of U.S. Energy Security Risk (2013 Edition). Retrieved from Institute for 21st Cen-tury Energy: http://www.energyxxi.org/energy-security-risk-index
U.S. Energy Information Administration. (2015, July 1). Natural Gas Pipeline Projects. Retrieved from https://www.google.com/url?sa=t&rct=j&q=&esrc=s&source=web&cd=1&cad=rja&uact=8&ved=0ahUKEwimyOWg-ZDLAhVDLSYKHfKC-CkcQFggiMAA&url=https%3A%2F%2Fwww.eia.gov%2
US Department of Transportation. (2015, August 3). PHMSA - Data & Statistics. (Pipelines and Hazardous Materials Safety Administration) Retrieved August 3, 2015, from http://www.phmsa.dot.gov/pipeline/library/data-stats/pipelin-emileagefacilities
US Department of Transportation. (2015, November 16). PHMSA - Data & Statistics. Retrieved from Pipelines and Hazardous Materials Safety Administration: http://www.phmsa.dot.gov/pipeline/library/data-stats/pipelinemileagefacilities
Vishal Shah, J. B.-P. (2014, Jan 8). 2014 Outlook: Let the Second Gold. Retrieved from Deutsche Bank Market Research: https://www.deutschebank.nl/nl/docs/Solar_-_2014_Outlook_Let_the_Second_Gold_Rush_Begin.pdf
Williams. (2015, November 12). About the project. Retrieved from Altantic Sunrise: http://atlanticsunriseexpansion.com/about-the-project/overview/