Energy - | Ministry of Finance · vi. Create a cutting ... energy mark rmed by the s. There a and...
14
Chapter 14 Energy Energy is the lifeline of an economy and is a vital input to sustain industrial, commercial and domestic activities. Energy disruptions and energy shortages not only result in loss of economic growth and employment but adversely affect social cohesion in the society. Energy crisis in Pakistan had been brewing since 2007 and deepened in 2012 which hugely negatively affected the economic growth and employment. Absence of effective planning, an economically and financially viable strategy and incapacitated regulator resulted in supply-demand gap. The situation has been further compounded due to high transmission and distribution losses, development of black-market for power and declining revenue collection. This led to persistent accumulation of circular debt. Consequently, the federal budget had to absorb huge quantum of subsidies to bridge the financial gaps in power sector threatening the fiscal stability on the one hand, and increasing the public debt. Nevertheless, realizing the gravity of situation and importance of energy for economic activities with particular emphasis on reviving the almost stalled industrial sector, job creation and income generation, the present government has put this issue on top of its economic reform agenda by pursuing a comprehensive plan to address these problems. In this context, government retired the circular debt (Rs 480 billion) immediately after taking oath which added 1752 MW of electricity into the system. In order to resolve the issue on permanent basis, government developed National Power Policy (2013) which was announced to provide an affordable energy in the country through efficient generation, transmission and distribution system. It is expected that the policy will set Pakistan on a trajectory of rapid economic growth and social development. More specifically, in order to reduce the cost of power generation to an affordable amount, a 84 MW New Bong Hydropower Project being the first hydro IPP in Pakistan/AJ & K has been commissioned while 10.5 MW Gas Based Davis Energen Project at Jhang started producing electricity and is contributing to FESCO's Network. Likewise 2 x 660 MW Imported Coal based Power Project at Port Qasim, Karachi has been inaugurated. In short, the government has realized the challenges faced by Pakistan energy system. Thus efforts are underway to reform existing energy system to actualize the energy sector’s aspirations. It is projected that by the end of the decade Pakistan will be transformed from an energy deficient to a regional exporter of power while the efficiency improvements in transmission and distribution will decrease the high cost of power to the end consumer which will bring prosperity and social development in the country. Box-1: Salient Features of National Power Policy 2013 The Ministry of Water and Power has developed Power Policy to support the current and future energy needs of the country and to set Pakistan on a trajectory of rapid economic growth and social development. It will also address the key challenges of the power sector in order to provide much needed relief to the citizens of Pakistan. To achieve the long-term vision of the power sector and overcome its challenges, following nine goals have been set: i. Build a power generation capacity that can meet Pakistan’s energy needs in a sustainable manner. ii. Create a culture of energy conservation and responsibility iii. Ensure the generation of inexpensive and affordable electricity for domestic, commercial, and industrial use by using indigenous resources such as coal (Thar coal) and hydel. iv. Minimize pilferage and adulteration in fuel supply v. Promote world class efficiency in power generation vi. Create a cutting edge transmission network vii. Minimize inefficiencies in the distribution system viii. Minimize financial losses across the system ix. Align the ministries involved in the energy sector and improve the governance of all related federal and provincial departments as well as regulators
-
Upload
phungthien -
Category
Documents
-
view
213 -
download
0
Transcript of Energy - | Ministry of Finance · vi. Create a cutting ... energy mark rmed by the s. There a and...

Chapter 14
Energy
Energy is the lifeline of an economy and is a vital input to sustain industrial, commercial and domestic activities. Energy disruptions and energy shortages not only result in loss of economic growth and employment but adversely affect social cohesion in the society. Energy crisis in Pakistan had been brewing since 2007 and deepened in 2012 which hugely negatively affected the economic growth and employment. Absence of effective planning, an economically and financially viable strategy and incapacitated regulator resulted in supply-demand gap. The situation has been further compounded due to high transmission and distribution losses, development of black-market for power and declining revenue collection. This led to persistent accumulation of circular debt. Consequently, the federal budget had to absorb huge quantum of subsidies to bridge the financial gaps in power sector threatening the fiscal stability on the one hand, and increasing the public debt.
Nevertheless, realizing the gravity of situation and importance of energy for economic activities with particular emphasis on reviving the almost stalled industrial sector, job creation and income generation, the present government has put this issue on top of its economic reform agenda by pursuing a comprehensive plan to address these problems. In this context, government retired the circular debt (Rs 480 billion) immediately after taking oath which
added 1752 MW of electricity into the system. In order to resolve the issue on permanent basis, government developed National Power Policy (2013) which was announced to provide an affordable energy in the country through efficient generation, transmission and distribution system. It is expected that the policy will set Pakistan on a trajectory of rapid economic growth and social development. More specifically, in order to reduce the cost of power generation to an affordable amount, a 84 MW New Bong Hydropower Project being the first hydro IPP in Pakistan/AJ & K has been commissioned while 10.5 MW Gas Based Davis Energen Project at Jhang started producing electricity and is contributing to FESCO's Network. Likewise 2 x 660 MW Imported Coal based Power Project at Port Qasim, Karachi has been inaugurated.
In short, the government has realized the challenges faced by Pakistan energy system. Thus efforts are underway to reform existing energy system to actualize the energy sector’s aspirations. It is projected that by the end of the decade Pakistan will be transformed from an energy deficient to a regional exporter of power while the efficiency improvements in transmission and distribution will decrease the high cost of power to the end consumer which will bring prosperity and social development in the country.
Box-1: Salient Features of National Power Policy 2013
The Ministry of Water and Power has developed Power Policy to support the current and future energy needs of the country and to set Pakistan on a trajectory of rapid economic growth and social development. It will also address the key challenges of the power sector in order to provide much needed relief to the citizens of Pakistan. To achieve the long-term vision of the power sector and overcome its challenges, following nine goals have been set:
i. Build a power generation capacity that can meet Pakistan’s energy needs in a sustainable manner. ii. Create a culture of energy conservation and responsibility
iii. Ensure the generation of inexpensive and affordable electricity for domestic, commercial, and industrial use by using indigenous resources such as coal (Thar coal) and hydel.
iv. Minimize pilferage and adulteration in fuel supply v. Promote world class efficiency in power generation
vi. Create a cutting edge transmission network vii. Minimize inefficiencies in the distribution system
viii. Minimize financial losses across the system ix. Align the ministries involved in the energy sector and improve the governance of all related federal and provincial
departments as well as regulators

218 P
The main tar
i. To fullyii. To diii. To div. To i
14.1 Pakist
Figure belooverall ene(Ministry oPetroleum component from policyimpacts the and laws foorganizationElectricity (NEPRA) a(OGRA).
Fig-14.1: P
The first stagovernmentcompanies primary enefrom import
The seconelectricity getc. Energyprivate comfrom publ
Pakistan Eco
rgets of this Poy eliminate loadecrease cost decrease transimprove colle
tan’s Energy
ow give us ergy sector of Water and
and Naturain the whole
y to generatienergy mark
rmed by the ns. There a
and Powand Oil and
Pakistan’s En
age is primart being primhas solid hoergy from dting these fro
nd stage isgeneration, ry in Pakistanmpanies but lic limited
onomic Surve
olicy for year ad shedding; of generation
smission losseection of bills t
y System
a visual prein Pakistan
d Power andal Resourcese system witon and distrket through rpublic secto
are two regwer Regulad Gas Regu
nergy System
ry energy sume supplier told. The govomestic resoom rest of th
s conversioefining and
n is generatemost of th
companie
ey 2013-14
2017 are:
from 12c/unies from 25 perto 95 percent.
esentation of. Public s
d the Ministrs) is the lath its intervenibution chainrules, regula
or institutionsgulators Natation Authulatory Auth
m
upplies wherto the genervernment su
ources as wehe world.
on process processing o
ed by publiche energy cos. During
it to 10c/unit; rcent to 16 per
f the ector ry of
argest ntion n. It
ations s and ional
hority hority
e the ation
upply ell as
like of oil c and omes
the
convvarioliqueusedenerpublGovsectoprivHubmajoand procyeardistrmanIn etowachanto bthe gearlythe 1994introthis Thissectoand nowpowprovinveavailackprovguarforecoorcriticom
Pressectoand (GEresoby IPow(WinGen
rcent
version procous plants efaction etcd by energyrgy system lic sector. Ho
vernment of or alone theate sector in
b Power Proor power pro
the world cess was verrs to fully ribution of naged by tweearly 90s thards market nge in the poring in moregovernment y 90s. The fiunbundling 4 and compoduced the Ppolicy was t
s policy resuor, promotioprivatization
w private sectwer productvinces have best in the eneilability of nk of technivincial govrantees to thign direct invrdination placal for th
mplicated sect
sently, the geor is done tMangla dam
ENCOs) genources. The pIPPs (Indepe
wer Plants) / nd Power
neration), H
cess, primary(heat, pow
.), oil refiney industry it
of Pakistanowever, it waPakistan to
erefore it wan. As a resuoject (HUBCoject which as well. H
ry slow andestablish inelectricity
elve Area Elehere was a s
economy wower sector oe private invintroduced n
first visible sof WAPDA
pleted in 19Power Policy to restructureulted in de-ron of IPPs, ren of selectedtor has also btion. Undebeen given coergy sector. Hnatural resoical knowlevernment the private vestment andan are reasohe provincetor.
eneration of through hydms etc. whilnerate electrprivate sectoendent PoweCPPs (CaptiGeneration)
Hub Powe
y energy is er, gas, peeries and soself. Prior tn mainly cas becominghandle and
as decided tult in 1985, aCO) was inwas unique
However, its d it took then 1997. Til
was coordectricity Boashift in glob
which led to of Pakistan. Tvestment. Folnumber of postep in this dA, the proces998. The of 1994. Th
e the entire pregulation oestructuring d corporate become a maer 18th Aonsiderable aHowever, duurces in theedge, inabilto provide sector for bd the absence
ons which ares to hand
electricity bdel sources lle generationricity throur electricity er Plants), Sive Power P, HPG (Hy
er Compan
supplied totrochemical,
ome of it isto 1985, theconsisted ofg difficult for
finance theto bring thea 1292 MW
nitiated as a in Pakistan
installatione project 12l 1994, thedinated andards (AEBs).bal thinkinga structural
The idea wasllowing this,olicies in the
direction wasss started ingovernment
he impetus ofpower sector.f the powerof WAPDAentities. Till
ajor player inAmendment,autonomy to
ue to unequale provinces,lity of the
sovereignbringing thee of nationalre becomingdle such a
by the publiclike Terbelan companiesugh thermalis generated
SPPs (Smalllants), WPGydel Power
ny Limited
o , s e f r e e
W a n n 2 e d . g l s , e s n t f . r
A l n , o l , e n e l g a
c a s l d l
G r d

(HUBCO) (KESC) wcompany. generated bElectric Poinstitution wof all geneinfluence w
In the third to energy sNational (NTDC) aninto power include LESFESCO, MHowever a transmissionpercent. Thpossible mminimum lepercent till 2
The interactservices occshould be nenergy prodgovernmentpart of the ftariff as mapay the priFrom FY03has been givwhich is mu
In 1995 themillion TOEthat time welectricity 1the energy million TOEgrowth rate
0
20
40
60
80
100
120
% Sha
re
Figu
Sou
and Karachwhile KESC
Some portby NPPs (Nuwer Companwhich manaeration comp
within the sys
stage, the geservices whiTransmissio
nd KESC. Tdistribution
SCO, QESCOMEPCO, HES
major portin and distrihe present
measures toevel and the 2017.
tion of supplcur through noted that thducts does nt heavily inffinal price byajority of coice if determ3 to FY13 a tven as subsiduch higher th
e total energEs. The main
were Oil 41.15.5 percent
supply of thEs with an ane of 4 per
1995
re 14.3: PrimaC
urce: Energy Year
hi Electric SC is verticion of eleclear Power ny (PEPCO
ages the genpanies and tem
enerated enerch are main
on DistribuThe NTDC i
companies O, PESCO, ISCO, KESCion of energibution whic
governmeno reduce ttarget is to re
liers and conenergy mar
he determinanot happen frfluence the my paying sub
onsumers wimined by fretotal amount dy to power han the cost
y supply of n sources of 6 percent, gand coal 5.8he economynnual averagrcent. There
2003
ary Energy SuCoal E
rs Book, various i
Supply Comcally integr
ectricity is Plants). Pak) is an umb
neration activthus has st
rgy is transmnly done thrution Coms further div(DISCOs) wIESCO, GEP
CO and SEPgy is lost duch is almos
nt is takingthese losseseduce these t
nsumer of enrket. Howevation of pricereely becausmarket and bbsidy on the ll not be ab
ee market foof Rs 1.7 trisector an amof Diamer B
Pakistan waf energy suppgas 36.8 per percent. In
y increased tge (1995 to 2e was not
2005
upply By sourcElectricity
issues, HDIP
mpany rated also
kistan brella vities trong
mitted ough
mpany vided which PCO, PCO. uring st 25 g all s to to 16
nergy er, it es of e the bears final
ble to orces. illion
mount Basha
Damshow
Howcausprestarifener
14.2
In 2thouprimtonn2 peproc
FiguPaki
as 28 ply at rcent, 2013 to 64 2013)
only
increchanseenwhil2013whicrelat
2233445
Rs B
illio
n
2010
Y
ceOil
m. The trend wn in Figure
wever, withdse huge sosent governmff and movinrgy supplies
2: Energy Su
2013, indigenusand tonnesmary energy nes of oil equercent of enecess.
ure14.3 showistan by sour
ease in enenge in the pn. The sharele the share 3 on accountch led the sutive cheaper
050
100150200250300350400450500
FY03
FY04
Figure 14.2
2011
Years
Gas
Source: Budget Wing
of subsidies14.2 below:
drawing theocio-economment is trying toward cespecially fo
upply
nous energy s of oil equivsupplies remuivalent (TOergy was los
ws the trendrces.
ergy supply patterns of ene of oil decof gas incret of rise in o
upplier to shir source. Ho
FY05
FY06
FY07
FY08
2: Subsidies t
2012
Energy S
g, Ministry of Finance
Energy
s given in th
e subsidy atmic cost thing to rationcheaper eneror electricity
availability valent (TOE)mained 64, 5OE) showingst during the
ds of energy
but also anergy sourccreased to 3eased to 48.2oil prices inteift toward gawever this s
FY08
FY09
FY10
FY11
to Power Sect
2013
Supply
y 219hese years is
t once mayherefore thenalizing thergy mix forgeneration.
was 65,639) while total88 thousand
g that almoste conversion
y supply of
a very cleares had been32.5 percent2 percent inernationally,as which is ashift exerted
FY12
FY 1
3
Years
tor
0
10
20
30
40
50
60
70
Million TO
E
9s
y e e r
9 l d t n
f
r n t n , a d

220 P
pressure onterms of eefficient sou
14.2.1 Oil
Overtime tsources of eis highest wrisks and beconomy. energy for increasing cThe price oincreased toan increase its price in prices domeMay 2014 fgenerating increased mproduced oproduced tprice of eleKWh. In oIPP involveThat is thecircular debmore than hoil reservesreserves wemillion barroil and 37recoverableon account crude oil reMarch FY correspondi11 percent growth of barrels in million barr
(MMCFD)
Pakistan Eco
n domestic reefficiency, ource of prima
there was energy supplywhich has exbrought negOil is mosPakistan, th
continuouslyof oil was $ o $ 110perbof almost hu1995. This
estically, escfrom Rs 9 pone unit
manifold i.en furnace oi
through diesectricity in Pother words, es a subsidy e root cause bt. Furthermhalf of the os. On June 3ere 1,102.6 rels(68 perce1.0 million
e reserves. Fuof import
emained 44.914 compare
ing period lawhile loca
12 percent July-March rels in corre
(-0.
3,400
3,500
3,600
3,700
3,800
3,900
4,000
Ju
Figure 14.
Source: Min
onomic Surve
esources of oil is still cary energy su
changing py, still relianxposed the gative repertly an imphe price of y especially i
10 per barrearrels in Maundred timealso led to a
calating to Rper liter in 1at IPP the
e., Rs.18/- pil and Rs.24sel, while tPakistan is a
every unit of Rs 9 to of the grow
more, Pakistaoriginal dom0, 2013, origmillion bar
ent) cumulatibarrel (32
urther a hugof crude oil9 million baed to 40.9 mast year posl crude extras it stood FY 14 co
sponding pe
9%) (0.4%)
ul Aug
.4: Gas Produ
nistry of Petroleu
ey 2013-14
gas, howeveconsidered aupplies.
attern in mnce on oil andcountry to m
rcussions onorted sourcwhich has
in last few yel in 1995 way 2014 shos as comparean increase i
Rs 107 per lit995. The co
ermal plant per KWh w
4/- per unit wthe average about Rs. 9/generated bRs 15 per Kwing probleman has exhau
mestic recoverginal recoverrrels with 7ive productiopercent) bal
ge amount is l. The impoarrel during million barreting a growtraction post
at 23.0 miompared to eriod last yea
(5.0%)
(-0.7%
Sep Oct
ction during J
um and Natural R
er, in as an
major d gas many n the ce of been
years. which wing ed to in oil ter in ost of
has when when
sale - per
by an KWh. m of usted rable rable
731.5 on of lance paid
ort of July-
els in th of ted a illion 20.5
ar. In
monimpobilligrow
RealhighPakiThuprovblocforeabouof tblocPunjAfteexplmomfinanrentawellbeensupphas sour
14.2
The natu2013cum(44 Wheof ntrillicubicomcurrbelo
%) (0.1%)
(
t Nov
July‐April
Resources
netary valueort of petroon in corres
wth 6.2 perce
lizing the rih use of petistan is tryis on Janu
visionally awcks to eight ign companiut 103,348 Sthe area alrecks, 21 blockjab, 8 in Kher execution loration activmentum andncial benefials. During tls have beenn made. Althply yet duesubstituted
rce of energy
2.2 Gas
original dural gas were3. 30.9 trilli
mulative prodpercent) w
en comparednatural gas oion cubic feeic feet of n
mparison of gent year and
ow:
(-0.8%)
(-4.1%
Dec Jan
s, US $ 4.3leum crude sponding perent.
isk and chaltroleum cruing to explouary 21, 2warded 50 companies iies. The totaSq. Kms whieady under ks are locatehyber Pakhtu
of agreemenvities in the d provincests in terms the current fin spudded ahough oil is to continuouoil in many
y supplies.
domestic ree 55.6 trillionion cubic feduction and was balanced with domeson June 30, et which rep
natural gas ras productiod last year i
%) (-4.2%)
Feb
2012‐13
3 billion wacompared t
riod last yea
llenges invoude, the Govore domestic2014 the
petroleum including boal area of theich is aroundexploration.
ed in Baluchunkhwa and nts for thesecountry wills will get of social w
iscal year, 73and 18 discoefficient primus rise in itsy ways bein
ecoverable n cubic feet et (56 perce24.7 trillion
e recoverablstic recovera
2012, thesepresent that reserve are
on during Julyis shown in
(-2.3%)
(0.5%
Mar April
3 2013‐14
as spent onto US $ 4.0ar posting a
olved due tovernment ofc resources.governmentexploration
oth local andese blocks isd 38 percent. Out of 50histan, 15 in
6 in Sindh.e blocks, thel pick a new
immediatewelfares and3 numbers ofoveries havemary energys prices, gasg a cheaper
reserves ofon June 30,
ent) was then cubic feetle reserves.
able reservese were 56.00.38 trilliondepleted. Ay – April forFigure 14.4
%)
4
n 0 a
o f . t n d s t 0 n . e
w e d f e y s r
f , e t . s 0 n A r 4

Energy 221
The worrisome factor is that our gas reserves are depleting and if gas consumption grows annually even at moderate rates, the present recoverable reserve will largely be exhausted by 2025. As this limit approaches the marginal cost of gas supplies will rise.
To avoid such a situation we have two choices: efficient use of gas and an increase in the gas exploration rate along with diversification of energy mix. Realizing this fact, the government is attracting foreign investment to explore new fields. Although exploring of natural gas is sub-component of mining and quarrying, yet on a positive note it should be noted that both private and public gross fixed capital formation in mining and quarrying at basic prices of 2005-06 had shown positive growth of 25 percent in FY 14 that earlier had declined to 14 percent in FY 13.
Increasing demand of natural gas with its limited supply has made room for Liquefied Petroleum Gas (LPG) which is also a primary source of energy. Currently about 1000 tons/day LPG is being produced domestically contributing less than 1 percent to the total energy supply mix. Because of its characteristics LPG is fast becoming a fuel of choice in the areas, where natural gas distribution network is not available. Pakistan Petroleum Limited (PPL) is the pioneer of the natural gas industry in the country which operates six producing fields in Sui, Kandhkot, Adhi, Mazarani, Chachar and Hala while Oil and Gas Regulatory Authority (OGRA) is empowered to regulate the LPG sector under OGRA Ordinance 2002 and LPG (Production & Distribution) Rules 2001 w.e.f 15th March, 2003. OGRA has simplified the procedure for grant of LPG license and the same is granted on fast track basis once the requirements are met / compiled. During July-Dec, 2013 two licenses for construction of LPG storage and filling plants were issued. In addition, OGRA has also issued 15 licenses for construction of LPG auto refueling station. OGRA is playing a vital role to increase private investment on midstream and downstream petroleum industry, During July- December, 2013 an investment of Rs. 0.264 billion has been made in LPG infrastructure whereas total investment in the sector till end of this fiscal year is estimated about Rs. 17.464 billion.
Natural gas and LPG are considered as cheaper than oil but both are expensive than coal and fortunately Pakistan has huge coal resources estimated to exceed 185 billion tons which generally ranks from lignite to sub-bituminous. However, less focus has been given to this cheaper primary energy supply.
14.2.3 Coal
The share of coal in energy supply is almost stagnant to 6 percent since 1995. The federal and provisional governments have started giving importance to coal exploration and development activities. The federal government has been striving hard for optimum development and utilization of indigenous coal resources and pursuing the policy of promoting coal based power generation. A summary of the efforts made in this regard is presented below:-
i. The federal government sponsored discovery and evaluation of Thar coal deposits, development of infrastructure in this coal-field and studies to determine its mine ability and for gasification incurring more than Rs 2.000 billion.
ii. Lakhra Coal Development Corporation has been set up as a joint venture of Pakistan Mineral Development Corporation, WAPDA and Government of Sindh to fulfill coal requirement of 150 MW Khanote Power Plant.
iii. The Finance Division has sponsored under PSDP a pilot project for Underground Coal Gasification at Thar Coal Block- V.
iv. Federal Government is pursuing the policy of promoting coal based power generation and conversion of oil and gas-based power plants to indigenous/imported coal that would later on, be replaced by Thar coal depending upon its availability.
Government of Sindh has leased out a coal block for an integrated mining project and power generation to increase the share of coal. The details are as under:-
a) Government of Sindh has entered into a joint venture with M/s Engro Powergen (Pvt) Limited for Coal Mining in Block-II and established a Company under Companies Act, 1984 viz. “Sindh Engro Coal Mining Company” for development of Coal Mine and installation 600-1000 MW Power Plant.
b) M/s Cougar Energy UK limited has been allocated Block-III in Thar coalfield for extraction Underground Coal Gasification and establishing 400 MW Power Plant.
c) M/s Bin Daen Group, UEA has been allocated Block-IV in Thar coalfield for developing Coal Mine and installing 1000 MW Power Plant.

222 P
d) One
CommMW Projeconnenotifichairmthe pr
e) M/s allocadevelPlant
f) M/s Expoconduintegrplant
g) GoveJ.V wallocadevelfired
It is expecfederal and
Private Pow‘One Windothe field oGovernmeninception addition of of twenty processing Gas and Hy(IPP) projec8,835 MWprojects, fifcapacity of the remainicapacity of
MW
F
Pakistan Eco
Block has mission of Pbased on Un
ect in Blockection, the ied Govermanship of Droject.
Oracle Coated Block loping Coal t of 300 MW
China Natioort Corporaucted feasibrated coal mat Sonda-Jer
ernment of with M/s Al-ated area loping Coal Power Plant
cted that wid provincial
wer and Infraow’ facilitatof power gent of Pakist
has succearound 8,65
nine (29) nineteen (1
ydel) based Icts with a cu. Out of thefteen (15) p6,948 MW ang four (4) p
f 1,887 MW
(6.0%
0
2,000
4,000
6,000
8,000
10,000
12,000
14,000
Jul
Fig‐14.5: Com
Source: Ministry
onomic Surve
been allocaPakistan fornderground Ck-V Thar cGovernmen
rning BodDr. Samar M
alfield Plc, –VI in ThMine and
W extendable u
onal Machination of bility studymining and rrick in distr
Sindh enteriAbbas Grou
in Badin Mine and
t of 300-600
ith ongoing governmen
astructure Btor to the prieneration ontan (GOP). ssfully ma7 MW throu
IPPs. PPI9) multiple Independentumulative caese nineteen
projects haviare based onprojects havconsist of tw
%) (4.0%)
Aug
mparative Data
y of Water and Po
ey 2013-14
ated to Planr Plot ProjecCoal Gasificcoalfield. In nt of Sindh dy under Mubarakman
UK has har coalfieldinstalling Pup to 1000 M
nery Import China (C
y for 400 coal-fired p
rict, Thatta.
ing into anoup Company
coalfield installing CMW.
efforts of nts, the shar
Board (PPIB)ivate investon behalf ofPPIB, since
anaged capugh establishmIB is currfuel (Oil, C
t Power Prodapacity of arn in processing a cumuln hydro, wheving a cumulwo (2) gas b
(13.0%)(12.0
Sep Oct
a of Electricity
ower
nning ct 50 ation
this has the
d for
been d for ower
MW.
and CMC)
MW ower
other with
for Coal-
both re of
coalleadelect
14.2
Elecobtacoalwas as ipercPEPhydr750 for 3.3WAKESone almoineffplanelectyear
) is a ors in f the e its acity ment ently Coal, ducer ound
s IPP lative ereas, lative based
projbase
Govgeneenergovefor reguIt iswill variowhicnextbelo
%)
(-1.0%)
Nov
y Generation
l in primary d to cheapertricity genera
2.4 Electrici
ctricity is a ained by convl, nuclear pow
decline in st declined f
cent in 201PCO system iro 6,773 MWMW. Thus
29.7 percentpercent. O
APDA and exSC, 750 by
critical issost fifty pe
fficient recovnts and inapptricity generr and last yea
ects, one (1)ed project.
vernment of eration mix rgy resourceernment is cthese projec
ularly in ordes expected th
be added ious resourcech will redut four years.ow:
(8.0%)(4.0%
Dec Jan
July‐April
2012
energy suppr energy mation will red
ity
secondary everting primwer and otheshare of elecfrom 15.5 13. The insis 22,812 MWW, thermal 1 the hydropt, thermal 6f this 11,4
x-WAPDA GPAEC, and ue is that rcent of ins
very system, propriate fueration duringar is shown in
) oil based p
f Pakistan athrough dev
es particularlommitted tocts and moner to complehat 16, 564 in the nationes by comp
uce / elimina. The detail
%)(9.0%)
(
Feb M
2‐13 201
ply will incremix which w
duce the cost
energy sourmary sources
er natural soctricity in enpercent in
stalled capaW as of June15,289 MW power capaci7.0 percent 93 MW is
GENCOs, 2,2rest by IPPelectricity gstalled capalack of wear
el mix. A cog July – Aprin Figure 14.5
project and o
aims to achvelopment ofly hydel an
o arrange timnitor their d
ete them as pMW power
nal grid systpleting the nate load shed
of the proj
(7%)
(11%)
Mar Apr
13‐14
ease and willwhen use int.
ce which islike gas, oil,urces. There
nergy supply1995to 12.9
acity in thee 2013; withand nuclear
ity accountsand nuclearowned by
216 MW bys. However,generated isacity due tor and tear of
omparison ofil for current5below:
one (1) coal
hieve powerf indigenousd coal. The
mely financesdevelopmentper schedule.r generationtem through
new projectsdding duringect is given
l n
s , e y 9 e h r s r y y , s o f f t
l
r s e s t .
n h s g n

Table 14.1: NYear
2014
2015
2016
2017
2018
Upto 2018 TSource: Paki After geneCompanies supplying ebills. So an
Another wrecommendefficient DIin order to distribution structure noincentive ainefficient Dgovernment
F
G
M
Q
H
T
P
S
Fig
S
New Projects
Guddu-NandipuGuddu-Quaid-eQuaid-eGuddu Quaid-eNeelumGolen GPatrind TerbelaCoal PlaCoal PlaThar CoCoal PlaGaddan
Total Generatstan Electric P
eration of e(DISCOS)
electricity tonother critica
worrisome ds a tariff ISCOs and preduce their losses. Hotified by thas a result tDISCOs havt. Thus ele
0%
IESCO
FESCO
GEPCO
LESCO
MEPCO
QESCO
HESCO
TESCO
PESCO
SEPCO
gure 14.6: Co
ource: National E
s Nam
1 ur Power Proj2
e-Azam Solar e-Azam Solar Steam (3) e-Azam Solar
m Jhelum HydeGol HPP
a 4th Extensionant at Sahiwalant at Jamshooal Plant ant Larkana
ni Power Park tion AdditionPower Compa
electricity, are mainly
o consumersal point afte
factor is structure wunishment tor respective
However, thhe governmethe combineve to be bornectricity gen
5%
mparison of T
Electric Power Re
e of Project
ject
Park (Phase-IPark (Phase-I
Park (Phase-Iel
n l ro
n any Ltd
the Distribuy responsibles and colle
er inefficienc
that NEwith incentiv
o inefficient transmissione unified t
ent disallowsed losses ofne by the feneration bec
10% 15
T & D losses a
egulatory Author
I) II)
III)
ution e for cting cy in
the gperfdistr
EPRA ve to
ones n and tariff s this f the deral come
overto trcost furntherminterbeinmajocircu
5% 20%
among DISCO
rity
Capacity(243 MW)(425 MW)(243 MW)(100 MW)(300 MW)(261 MW)(600 MW)(969 MW)(106 MW)(147 MW)(1410 MW(1200 MW(1320 MW(1320 MW(1320 MW(6600 MW16564 MW
generation stform well ribution (T &
r expensive oransmission
of generatnace oil submal power rvenes throu
ng necessity ority of peoular debt and
25%
s
AGGG
G
WW
W) WW) W) GW) GW) GW) PuW
tage is that tin terms
& D) losses.
one due to coand distrib
tion coupledbstantially h
generation. gh subsidiesof life will
ople. Howevd when the p
30%
2012 2
Energy
Agency GENCOs GENCOs GENCOs
PPDB PPDB
GENCOs PPDB
WAPDA WAPDA
PPDB WAPDA
PPDB GENCOs GENCOs GENCOs ublic + Pvt
the main DISof transm
ostly input anution losses
d with rise has raised t
The govers realizing thbecome una
ver, this alspresent gove
35% 40
2013 2014
y 223
Fuel Gas Oil Gas
Solar Solar Gas
Solar Hydel Hydel Hydel Hydel COAL COAL COAL COAL COAL
SCOs do notmission and
nd other dues. This highin price of
the cost ofrnment thusat the power
affordable too results in
ernment paid
0%
t d
e h f f s r o n d

224 Pakistan Economic Survey 2013-14
the unsustainable level of circular debt there was 1752 MW increase in capacity utilization.
To diversify the primary energy supply in the generation, Pakistan Atomic Energy Commission (PAEC) produce electricity through nuclear plants. By this time three nuclear power plants are operational. The first nuclear power plant i.e. Karachi Nuclear Power Plant (KANUPP) completed its 30 years design life in 2002.
14.2.5 Nuclear Energy
Pakistan Atomic Energy Commission (PAEC) is responsible for planning, construction and operation of nuclear power plants in the country. PAEC is currently operating three nuclear power plants Karachi Nuclear Power Plant (KANUPP), Chashma Nuclear Power Plant Unit-1 (C-1) and Unit-2 (C-2). The construction of two more units C-3 and C-4 of 340 MW each is in progress. The second and third nuclear power plants i.e., (C-1 and C-2) are performing very well. Performance of all three
operating nuclear power plants is given in the following Table 14.3:
Table 14.2: Electricity generation S.No Source Capacity addition
(MW) IPPS – Fuel Operated Plants 1 KAPCO 282 2 HUBCO (RFO) 363 3 HUBCO Narowal
(RFO) 204
IPPS – Gas Operated Plants 4 Liberty (Gas) 193 5 Saif Power (Gas &
HSD) 56
6 Halmore (Gas & HSD)
48
GENCOs 7 Jamshoro (RFO) 388 8 Guddu (Gas) 136 9 Muzaffargarh (RFO) 82 Total 1,752 Source: Ministry of Water and Power
Table 14.3: Performance of the Operating Nuclear Power Plants in Pakistan Plants Gross Capacity (MW) Grid Connection Data Electricity sent to Grid (million KWh)
July 1, 2014 to March 31, 2014
Lifetime upto March 31, 2014
KANUPP 100 18-Oct-71 291 13,004 C-1 325 13-Jun-00 1,840 26,781 C-2 330 14-Mar-11 1,866 6,096 Source: Pakistan Atomic Energy Commission The construction of fourth and fifth nuclear plants, Chashma Nuclear Power Plant unit 3 & 4 (C-3 and C-4) at Chashma site, is ahead of the schedule. The Domes on containment buildings of C-3 and C-4 were placed on the 6th March, 2013 and 2nd January, 2014, respectively. Status of under construction nuclear power plant is given in the following Table 14.4:
Table 14.4: Status of under construction nuclear power plant Plants Gross
Capacity (MW)
First Concrete Pour Date
Target Commercial Operation
Date C-1 340 4-Mar-11 30-Apr-16 C-2 340 18-Dec-11 31-Dec-16
Source: Pakistan Atomic Energy Commission PAEC is implementing nuclear power program 2030 set by Energy Security Plan of the Government of Pakistan. The ground breaking ceremony of Karachi Coastal Power Project (K-2 and K-3) was held on 26th November, 2013. To meet the targets, sites are being identified for more under power plants.
Technical and engineering infrastructure is in place to provide technical support to existing under construction and future nuclear power plants
One reason of energy crises is expensive input and if timely efforts are not made for cheaper energy mix, the problem can be more severe in future. The government is committed to achieve less oil dependent power generation mix through development of indigenous energy resources particularly hydel and coal. Recently, the Executive Committee of the National Economic Council (ECNEC) approved four development projects in power sector having a combined generation capacity of 3,511 MW. The approved projects include K-I and K-II Nuclear Projects situated in Karachi (Province of Sindh; generation capacity 2,200 MW), Nandipur (Province Punjab; generation capacity 425 MW; cost Rs 57,380 million) and Neelum-Jhelum hydroelectric project (AJK; generation capacity 969 MW). Government of Pakistan is committed to arrange timely finances for these projects and monitor their development regularly in order to complete them as per schedule. Also one other
Energy 225 diversification in using energy mix in the generation of electricity is by producing electricity by Co-Generation for which government is seriously thinking. Co-Generation is a high efficiency energy system that produces both electricity (and mechanical power) and valuable heat from a single fuel source. Pakistan being the fifth largest sugarcane producer in the world has the potential to generate electricity of almost 2,000 MW through Co-Generation. Bagasse (process waste of sugar industry) is a fibrous residue of cane stalk obtained after crushing. When burned in quantity, bagasse produces sufficient heat energy to supply all the needs of a typical sugar mill, with energy to spare. To this end, a secondary use of bagasse is in Co-Generation. Development of Co-Generation plants based on high pressure boilers is gaining momentum worldwide. Thus Co-Generation by sugar mills by utilizing bagasse and coal provides one of the most economically viable options for thermal power generation, earlier it remained unexploited in Pakistan.
14.3.Energy Consumption
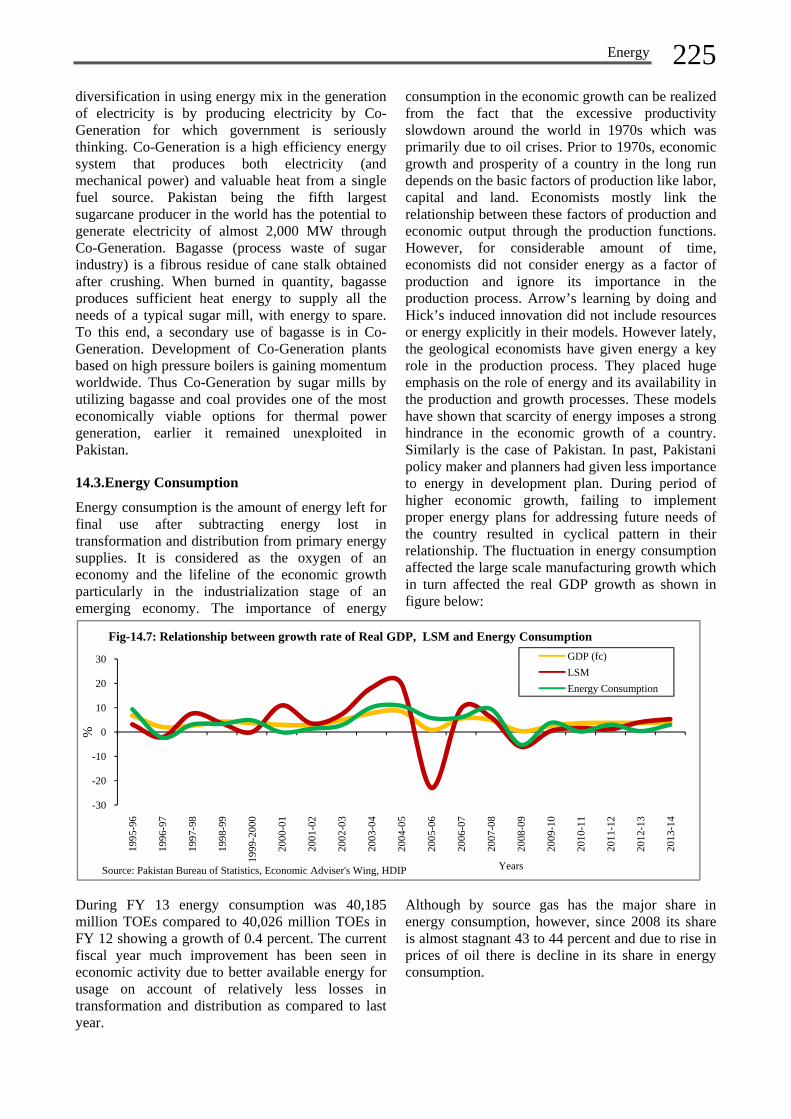
Energy consumption is the amount of energy left for final use after subtracting energy lost in transformation and distribution from primary energy supplies. It is considered as the oxygen of an economy and the lifeline of the economic growth particularly in the industrialization stage of an emerging economy. The importance of energy
consumption in the economic growth can be realized from the fact that the excessive productivity slowdown around the world in 1970s which was primarily due to oil crises. Prior to 1970s, economic growth and prosperity of a country in the long run depends on the basic factors of production like labor, capital and land. Economists mostly link the relationship between these factors of production and economic output through the production functions. However, for considerable amount of time, economists did not consider energy as a factor of production and ignore its importance in the production process. Arrow’s learning by doing and Hick’s induced innovation did not include resources or energy explicitly in their models. However lately, the geological economists have given energy a key role in the production process. They placed huge emphasis on the role of energy and its availability in the production and growth processes. These models have shown that scarcity of energy imposes a strong hindrance in the economic growth of a country. Similarly is the case of Pakistan. In past, Pakistani policy maker and planners had given less importance to energy in development plan. During period of higher economic growth, failing to implement proper energy plans for addressing future needs of the country resulted in cyclical pattern in their relationship. The fluctuation in energy consumption affected the large scale manufacturing growth which in turn affected the real GDP growth as shown in figure below:
During FY 13 energy consumption was 40,185 million TOEs compared to 40,026 million TOEs in FY 12 showing a growth of 0.4 percent. The current fiscal year much improvement has been seen in economic activity due to better available energy for usage on account of relatively less losses in transformation and distribution as compared to last year.
Although by source gas has the major share in energy consumption, however, since 2008 its share is almost stagnant 43 to 44 percent and due to rise in prices of oil there is decline in its share in energy consumption.
-30
-20
-10
0
10
20
30
1995
-96
1996
-97
1997
-98
1998
-99
1999
-200
0
2000
-01
2001
-02
2002
-03
2003
-04
2004
-05
2005
-06
2006
-07
2007
-08
2008
-09
2009
-10
2010
-11
2011
-12
2012
-13
2013
-14
%
Years
Fig-14.7: Relationship between growth rate of Real GDP, LSM and Energy Consumption GDP (fc)LSMEnergy Consumption
Source: Pakistan Bureau of Statistics, Economic Adviser's Wing, HDIP

226 P
14.3.1 Oil (
Transport asector in tHowever, dincrease in share increaof oil in treason is th
Source: Hydr
During Julyconsumptiowhile share0.8 and 0.compared th
During FY was US $ 1it was 19.million metmillion metMarch FY
Percen
tage
Share
Power41.1
Other Go1.6
Sh
Pakistan Eco
(Petroleum P
and power she usage o
during last twthe usage o
ases to 40.0 transport sechat majority
rocarbon Devel
y – March Fon is increase of transpor6 percentaghe same duri
13 the imp14.9 billion. I.2 million mtric tons of tric tons of p14, the impo
0%5%
10%15%20%25%30%35%40%45%
Percen
tage
Sha
re
Figure 14.8
Source: Hydroca
Households0.5
vt.
hare of sectorOil/Pe
July-M
onomic Surve
Product)
sectors remaf oil / petr
wo decade thof oil in powpercent in 2
ctor is almoof commercFigure 14.9:
lopment Institut
FY 14, shareed by 1.7 prt and indus
ge point, resing July – M
port bill of If to look intmetric tons petroleum p
petroleum cruort bill of pe
2008
8: Energy Cons
arbon Developmen
rs in Consumetroleum (%)
March FY 13
ey 2013-14
ained the higroleum prodhere is signifwer sector a2013 while uost stagnant,cial transport
Share of sect
te of Pakistan
e of power ipercentage ptry decreasespectively, warch FY 13.
petroleum gto quantity t
including products andude. During etroleum post
2009
sumption by S
nt Institute of Pak
Industy7.4
Agriculture0.1
T
mption of )
ghest ducts. ficant s the
usage , the t still
use whilshiftoil ideclJulypetrocorr
tors in consu
in oil points ed by when
group terms 12.3
d 6.9 July-ted a
negaof pduribillia neimpoas itcomperioquancrudmain
2010
Years
Source
kistan
ransport49.3
Powe42.8
oil and thele usage of ot toward CNin agriculturline in activy-March FY oleum prodesponding p
mption of Oi
ative growthpetroleum prng July-Maron during co
egative growtort of petrolt was US $ 4
mpared to USod last yeantities of botde (5.0 percen reason attri
2011
Oil CoalLPG
Hous0
er
Other Govt.1.6
Share of sO
J
ere is negligoil in househoNG from oil. re and indu
vity due to p14, the comp
duct is littleeriod last ye
il / Petroleum
h of 1.3 perceroducts stoorch FY 14 orrespondingth of 5.6 perleum crude i4.3 billion duS $ 4.1 billioar. There wth petroleumnt and 4.3 peibuted to the
2012
G
seholds0.4
sectors in ConOil/Petroleum
July-March FY 1
gible shift toold decline thThe declinestry could bpower shortposition of ue variant frar as shown
m
ent. The valuod at US $compared to
g period last rcent. Howevincreased byuring July-Mon during co
was positivem products an
ercent respece increase in
2013
Gas Electricity
Industy6.2
A
nsumption ofm (%)
4
oward CNGhat show the
e in usage ofbe linked totage. Duringusage of oil /rom that inbelow:
ue of import 6.6 billiono US $ 7.0year postingver, value of
y 6.2 percentMarch FY 14orrespondinge growth innd petroleumctively). Thequantity and
Agriculture0.2
Transport48.7
f
G e f o g / n
t n 0 g f t 4 g n
m e d

decrease in prices of pwas global change in which refleproduct.
14.3.2 Natu
Pakistan ishouseholds,major end uof consumpThere was fertilizer inperformancreason of abto frail funcconfronting
Source: Hydro 14.3.3 Elect
The consumand is the hprime reasoalso brougpeople. Theconomic g
Industry22.6
Transport(CNG)
8.2
Sha
value of pepetroleum pr
increase in pits consump
ect that petr
ural Gas
the larger , power, feruser of gas. Inption of gas
sharp declndustry whie of fertilizebnormal reductioning of SNg the worst
ocarbon Develo
tricity
mption of elehighest amonon is technoght significahere is cycgrowth and
Power27.5
t
are of sectors
Ju
-5
0
5
10
15
1995
-96
Gro
wth
Rat
e (%
)
Fig-14.11
Source: HD
etroleum proroducts globprice of petr
ption patternroleum crud
consumer ortilizer and n last two deamong its u
line in gas ich had neger sector. In uction in gasNGPL-basedgas crisis
Figure 1
opment Institute
ectricity has ng all sourceological advant change clical relati
electricity
s in Consump(%)
uly-March FY 13
1996
-97
1997
-98
1998
-99
1: Relationshand elect
DIP, PBS and EA
duct is declibally. Even troleum cruden had been e is an inel
of the gas. industry are
ecades the pausers is chan
consumptiogatively affeFY 13, the ms supply wasd fertilizer plwhich caus
14.10: Share o
e of Pakistan
increased rapes of energy.vancement w
in lifestyleionship betwconsumptio
Households23.2
Comm3.3
Cem0.
Fertilizer15.2
ption of Gas
1999
-00
2000
-01
2001
-02
ip between grtricty consum
A Wing
ining there e, no seen
lastic
The e the attern nged. on in ected main s due lants, ed a
sharfertiPakaAgrishorferti19 pperiocomhousprioinduoil wuse to lprescauscons
of sectors in c
pidly One
which e of ween n. It
implby hwhicthe advagrowcons
ercial3
ment.1
Industry21.7
2002
-03
2003
-04
2004
-05
Year
rowth of GDPmption
rp decline ilizer plants arab, Dawooitech, remairtages. Durinilizer industrpercent whicod last fiscal
mmitment of sehold, powerity basis. H
ustry is declinwith gas. Tiof gas (CNGload managscribed hourssed decline sumption as
consumption
lies that the higher growch is obvioustandard of
ance technowth of GDP sumption of
Power26.1
y
Transport(CNG)
7.0
Share of se20
05-0
6
2006
-07
2007
-08
2008
09
rs
P (fc)
in the ovon the SNG
od Hercules,ined the mang July-Marry in gas coch was 15 pl year. This mthe governm
er industry aHowever, thening as powell FY 13, th
G) as input ingement in gs / days for s
in the shashown below
of Gas
period of hiwth rate of us in the sensf living or ological gowill negativelectricity as
ectors in Con(%)
July-March FY
2008
-09
2009
-10
2010
-11
2011
-12
Electricity Con
GDP (fc)
Energy
erall produGPL networ, Engro's neain sufferersrch FY 14, tonsumption percent in comajor upturnment to proand fertilizere usage of ger industry cahere was incn transport, hgas sector supplying CN
are of transpw:
igher growthelectricity cse that growproduction
oods. Likewvely affect ths shown belo
H
nsumption of
Y 14
2012
-13
2013
-14
nsumption
y 227uction. Fourrk, includingw plant and of the gasthe share ofincreased to
orrespondingn was due toovide gas tor industry ongas in poweran substitute
crease in thehowever duethere were
NG that hadport in gas
h is followedconsumption
wth improvesby utilizing
wise, lowerhe growth ofow:
ouseholds23.2
Commercial3.1
Cement0.0
Fertilizer19.0
f Gas
7r g d s f o g o o n r e e e e d s
d n s g r f

228 P
The lower goccurred dugrowth in cwill lower t
Prior to unsectors exconsumptiohousehold. percent in 1industrial uof load shhome applimade the shincreased to1993. In consumptio10 percenttransformatindustrial agriculture almost 26 significant 14.3.4 Coal
Pakistan’s cbituminous.2000. Abouthe country and 56.1 pdecrease opercent, reshas been shence utilimomentumPakistan ha185 billionidentified atThe powersignificance
Pakistan Eco
growth in elue to loss of gconsumptionthe growth o
nbundling oxhibit a chon pattern,
The share o1993 to 29 punits are usinedding. Incriance due tohare of resideo 47 percentcase of ag
on decreased t in 2013, ion away and servicin real GDPpercent in change in
l
coal generall. Coal conut 39.1 perce
has been utpercent by
of 3.46 percpectively. A
switched oveization of . s huge coal rn tons; int Thar coal fr project at e due to
0
1993
1998
2003
2008
2013
Years
Fig‐14.12
Source: Hydr
onomic Surve
ectricity congrowth mom
n of electriciof GDP in ne
of WAPDAhange in
especially f industry de
percent in 20ng own captrease in usa
o technologicential electrict in 2013 frogriculture se
from 15 pethis show
from agricues sector.
P declined to1990s.Howethe consum
ly ranks fromnsumption isent of total ctilized by bri
cement faccent and in
Almost wholeer from furningenious c
resources estncluding 17fields (Sindh
Port Qasimimportance
% 1
2: Share in ele
rocarbon Develop
ey 2013-14
nsumption camentum and lity in one peext period. P
A to presenttheir electr
industry ecreased from
013 because tive unit becage of electcal improvemcity consumpom 36 perceector, electrercent in 199w the struculture secto
The share 21 percent
ever, there imption patter
m lignite to s varying scoal consumeick kilns inductories, showncrease of e cement indunace oil to coal is gai
timated to ex75 billion Province) a
m had a spof Karach
10%
ectricity consu
pment Institute of
an be ower eriod olicy
makconshighdow
t, all ricity
and m 36 large cause trical ment ption
ent in ricity 93 to ctural or to e of from is no rn of
comcomalmoyear
sub-since ed in ustry wing 1.83 ustry coal
ining
xceed tons, lone.
pecial hi in
Pakithe prodplana caGad6,6014.4
The posssustagovebeendeve(ARDev
20%
umption
f PakistanPe
rcen
tage
Sha
re (%
)
kers need psumption ofher growth i
wn the pace o
mmerce. Howmposition of
ost similar tr as shown be
istan's econoeconomic d
duction of elnts is cheaperapacity of 66dani in Baluc00 MW in the4 Alternative
Governmensible measurainable devernment in itn giving delopment of
RE) resourcesvelopment Bo
30%
Agric
Com
0%5%
10%15%20%25%30%35%40%45%50%
Household
Figure
plans to af electricity in GDP whif growth in c
wever, duringshare of ele
to that in coelow:
omy and it cdevelopment lectricity fror, ten coal-fi60 MW eachchistan, whice national gre Sources of
nt of Pakistres to ensurvelopment ts bid to divedue attentiof Alternatives in the counoard (AEDB
40%
Percentage S
cultural I
mercial H
d Commercial
Secto
e 14.13: Sharconsump
July-Ma
address the that will o
ich otherwiscoming years
g July-Marchectricity conorresponding
an play a crof Pakistan
om the coal red power ph, are beingch would ad
rid. f Energy
tan (GoP) ire energy sin the co
ersify its eneron towards e / Renewantry. Alterna
B) has been m
50%
Share (%)
ndustrial
Household
Industrial Agric
rs
re in electrictytion
arch FY 13 July-M
growth inccur due tose will slows.
h FY 14, thensumption isg period last
rucial role inn. Since thefired powerrojects, with
g initiated atdd a total of
s taking allsecurity andountry. Thergy mix, has
fast trackable Energyative Energymandated to
cultural
y
March FY 14
n o w
e s t
n e r h t f
l d e s k y y o

Energy 229 act as a central agency for development and promotion of Alternative & Renewable Energy (ARE) technologies in the country and to facilitate the private sector investment in this sector.
Steps Taken By AEDB to Attract Investment in the Sector
AEDB has undertaken a number of supportive measures in order to promote ARE technologies and to attract private sector investments, which include;
Identification of new corridors for wind and solar energy projects development. Resource assessment of these corridors is underway.
National Grid Code for wind power projects has been amended. Grid Integration Plan 2010 -2015 for wind power projects has been developed by AEDB to support NTDC.
Local manufacturing of micro wind turbine has been started. Manufacturing for large wind turbines is also being encouraged. M/s DESCON has setup a wind turbine tower manufacturing facility and has provided towers for the first wind project in Pakistan. M/s Three Gorges Corporation / CWE (China) has also established a tower manufacturing facility which will be upgraded to wind turbine assembling facility in future.
Issues related to financing of projects have been resolved and now leading financing agencies like International Finance Corporation (IFC), Asian Development Bank (ADB), Overseas Private Investment Corporation (OPIC), Economic Cooperation Organization (ECO), Trade Bank etc. are offering financing to wind power projects in Pakistan.
14.4.1 Wind
Thirty five wind power IPPs holding LOIs issued by AEDB are at various stages of project development.
Operational (Achieved Commercial Operations Date)
FFC Energy Limited: 49.5 MW wind project, Jhampir, Distt. Thatta, Sindh
Zorlu Enerji (Pvt.) Ltd. 56.4 MW wind project, Jhampir, Distt. Thatta, Sindh.
Under Construction 50 MW Three Gorges First Wind Farm
Pakistan (Pvt.) Ltd., Jhampir Sindh 50 MW Foundation Wind Power I Ltd.
Khuttikun, Gharo, Sindh 50 MW Foundation Wind Power II (Pvt.)
Ltd., Khuttikun, Gharo, Sindh
Twelve projects with a cumulative capacity of 630 MW are expected to achieve Financial Close by 2014.
NERPA announced a new upfront tariff of US cents 13.5244 per kWh on 24th April 2013 for 500 MW wind power projects. The wind power companies interested in opting Upfront Tariff will have to achieve Financial Close of their project by September 30, 2014.
14.4.2 Solar
In Solar Energy, 24 LOIs for cumulative capacity of approximately 792.99 MW On-Grid Solar PV power plants have been issued. Four (4) companies have submitted the feasibility studies of their projects and one feasibility study is approved by AEDB. Other sponsors are at the stage of preparation of feasibility studies
Solar Village Electrification Program was initiated under PM’s directive. 3000 Solar Home Systems have been installed in 49 villages of district Tharparkar, Sindh. Another 51 villages in Sindh and 300 villages in Baluchistan have been approved for electrification using solar energy and will be implemented shortly.
AEDB in light of SRO 575(1)12006 issued duty exemption certificates for a large number of solar panels / solar modules to private sector companies for installation / generation of almost 64.57MW of energy in the country. These solar panels / solar modules are deployed all over the country.
AEDB issued tax exemption certificate for import of almost 16715 units of Solar Water Heaters in the country. These heaters are deployed all over the country especially in Baluchistan, Gilgit-Baltistan, Khyber Pakhtunkhwa and Northern Punjab.
AEDB also issued tax exemption certificate for import of about 1429 units of Solar Water Pumping System in the country. These water pumping systems are installed for community drinking and agriculture purpose all over Pakistan.
14.4.3 Biomass / Waste-to-energy
Framework for power Co-Generation has been approved by ECC for bagasse/biomass based sugar industry projects. 1500-2000 MW of power is expected to be generated in next 2-3 years. LOIs has been issued to following investors / sugar mills under this framework;
M/s JDW Sugar Mills Unit-II (26 MW), Rahim Yar Khan, Punjab.

230 Pakistan Economic Survey 2013-14
M/s JDW Sugar Mills Unit-III, (26 MW),
Ghotki, Sindh. M/s Hamza Sugar Mills Ltd., (15 MW) M/s RYK Sugar Mills Ltd., (19 MW) Rahim
Yar Khan, Punjab. M/s Chiniot Power Plant, (15 MW), Chiniot,
Punjab.
14.4.4 Small / Mini / Micro Hydro
Eight hydro projects have been initiated under the Renewable Energy Development Sector Investment Program (REDSIP) with the support of Asian Development Bank (ADB). These projects are being implemented in Khyber Pakhtunkhwa and Punjab with an estimated cost of US $ 290 Million.
Another 02 small hydro power projects have been initiated under REDSIP. PC-I for these projects have been approved. Loan approval from ADB is awaited.
The Government of Punjab issued LOIs to private investors for establishment of 10 small hydro projects with a cumulative capacity of 142 MW at different location in Punjab.
AEDB is building capacities for private sector investment in Khyber Pakhtunkhwa (22 projects of cumulative 92 MW capacity through Pakhtunkhwa Hydel Development Organization (PHYDO) and Punjab (30 projects of cumulative 240 MW capacity through Energy Department / Punjab Power Development Board (PPDB).
AEDB initiated a program with the assistance of GIZ support to assist the provinces solicit private investments in small hydro sector; under this program Pre-Feasibility Studies for 25 hydro sites in AJK, Sindh, Punjab and Khyber Pakhtunkhwa with the cumulative capacity of 284.14 MW have been completed.
Public sector Hydro power projects initiated in:
Khyber Pakhtunkhwa (worth U$ 150.99 Million, of 17.0MW, 36.6MW and 2.6 MW)
Punjab (worth U$ 138.74 Million, of 5.38MW, 4.04MW, 2.82MW, 4.16MW and 7.64MW)
Gilgit-Baltistan(worth U$ 71.12 Million, of 26MW and 4MW).
14.4.5 Clean Development Mechanism (CDM)
CDM is one of the instruments that developers of the Alternative and Renewable Energy (ARE) Projects pursue and earn financial returns by getting their projects registered with CDM Executive Board and selling the accrued Certified Emission Reduction (CER) certificates in the international carbon market.
Way Forward
Realizing the criticality of energy for economic growth, it is the main focus of Pakistan Vision 2025. The vision aims at ensuring uninterrupted access to affordable and clean energy for all sections of the population and aimed at resolving structural changes within the energy sector are fundamental to future economic prospects. The main elements of this vision include: 1. Optimize energy supply mix–economic,
scalable, indigenous by 2025 2. Reduce “cost per unit” 3. Reduce supply gap by 2018 and exceed demand
gap by 2025 4. Create and encourage culture of conservation
and efficiency in the usage of energy
Nonetheless, these projects have long digestion period and would come in to system in few years. It is also highlighted that through efficient reallocation of natural gas based on economic sense is essential to get best value for money.