
ENERGY MINERALS EXPLORATION For personal use only · 2012. 10. 5. · ENERGY MINERALS EXPLORATION 4...
76
ENERGY MINERALS EXPLORATION ANNUAL REPORT 2012 For personal use only
Transcript of ENERGY MINERALS EXPLORATION For personal use only · 2012. 10. 5. · ENERGY MINERALS EXPLORATION 4...

ENERGY MINERALS EXPLORATION
ANNUAL REPORT2012
For
per
sona
l use
onl
y

ENERGY MINERALS EXPLORATION
Contents
Corporate Directory
Chairman’s Letter 1
Company Focus and Developments 2
Directors’ Report 10
Auditor’s Independence Declaration 22
Corporate Governance Statement 23
Consolidated Statement of Comprehensive Income 31
Consolidated Statement of Financial Position 32
Consolidated Statement of Changes in Equity 33
Consolidated Statement of Cash Flows 34
Notes to the Consolidated Financial Statements 35
Directors’ Declaration 67
Independent Auditor’s Report 68
Additional Securities Exchange Information 70
Principal Business Address
14 View StreetNorth Perth WA 6006Telephone: (08) 9328 8477Facsimile: (08) 9328 8733www.mecresources.com.au [email protected]
Auditor
Deloitte Touche Tohmatsu Level 14Woodside Plaza240 St Georges TerracePerth WA 6000
Share Registry
Security Transfer Registrars Pty Ltd770 Canning HighwayApplecross WA 6153
Australian Securities Exchange Listing
Australian Securities Exchange Limited(Home Exchange: Perth, Western Australia)ASX Code: MMR
Australian Business Number
44 113 900 020
Directors
H Goh Non-Executive Chairman
D L Breeze Executive Director
K O Yap Non-Executive Director
C T Lim Non-Executive Director (resigned 2 April 2012)
D Ambrosini Executive Director
Registered Office
14 View StreetNorth Perth WA 6006
For
per
sona
l use
onl
y

1MEC Resources 2012 ANNUAL REPORT
Dear Shareholder
MEC Resources’ investments have continued to show considerable promise over the past year.
Importantly, the prospectivity of PEP 11’s vast structural targets remains as strong as ever, and MEC Resources’ investee Advent Energy Ltd (Advent) now controls 85% of this extensive permit adjacent to Australia’s most populous region and industrial hub. The renewal of this key permit and further 5 year minimum work commitment term demonstrates Advent’s strong outlook for the discovery of natural gas in this project in an area which is predicted to be short of gas supplies.
In the north of Australia, Advent has 100% ownership of two permits in the proven and producing Bonaparte Basin. Advent has progressed the appraisal of the existing conventional gas discoveries of Vienta-1 and Waggon Creek-1 in EP386. These discoveries were made in 1998 and 1995 respectively. The development of the technology enabling extraction of shale gas is transforming the energy market on a global basis and our permits are highly prospective for this resource. These permits are prospective for both shale gas and conventional gas.
The completion and flow test program of Waggon Creek-1 for the conventional gas resources was prematurely concluded in November 2011 due to the early onset of the northern wet season. The well was re-completed and perforated over two intervals (384.1-390.1 m and 393.1-395.1 m) in the Milligans Formation sandstone reservoirs. Preliminary field observations showed that during the 6 hour flow, the well flowed gas at a stabilised rate of approximately 1.1 million standard cubic feet of gas per day (MMscf/d) with surface pressure which was still rising slowly at the end of the flow test. Importantly, no water was produced during this short flow test.
Production testing at Vienta-1 in EP386 was also performed in 2011. Zones tested were between 1365m-1369m and 1411m-1421m depth. Gas flowed from these zones at initial rates of approximately 2.1 MMscf/d, though reduced relatively quickly. Subsequent petrophysical review implies a relatively ‘tight’ section.
Both Waggon Creek-1 and Vienta-1 have been suspended for future potential production and/or further investigative operations in the 2012 dry season. Immediate plans are afoot to conclude the production testing at Waggon Creek-1 with the inclusion of testing of additional perforated intervals.
In addition to the on-ground exploration carried out in 2011, Advent also embarked upon evaluation of its unconventional shale gas potential in EP386 and RL1. The results of the initial study indicated significant potential upside in prospective shale gas resources for Advent with estimated unrisked OGIP for EP 386 & RL 1 in the range from 19 TCF to 141 TCF. The thickness of the prospective shale gas play varied from 300m to over 1500m. With the increasing international focus on Australia’s shale gas resources, your company is exceptionally well placed to capitalise on the growing demand for Australia’s vast unconventional resources.
Advent is in the enviable position where it holds 100% of these Bonaparte Basin permits and is working hard towards commercial development of its conventional resource assets in this rapidly expanding region.
Full of anticipation, we look forward to the exciting year ahead.
Yours faithfully
Mr Hock GohChairman
Chairman’s Letter
For
per
sona
l use
onl
y

ENERGY MINERALS EXPLORATION
2 MEC Resources 2012 ANNUAL REPORT
MEC Resources’ investment capital is targeted for new and emerging companies in which investments have the potential to yield significant returns in energy and mineral resources.
MEC seeks to minimise the high risk that is usually associated with extremely large potential rewards by seeking to hold a portfolio of exploration investments. The Company is registered by the Australian Federal Government as a Pooled Development Fund enabling most MEC shareholders to receive tax free capital gains on their shares and tax free dividends.
MEC’s current major investment is Advent Energy Ltd, an unlisted oil and gas exploration and development company with onshore and offshore exploration and near term development assets z around Australia.
MEC’s investment focus:
ADVENT ENERGYWestern Australia / Northern Territory – Onshore Bonaparte Basin
MEC Resources’ investee Advent Energy Ltd (“Advent”) holds 100% of each of EP 386 and RL 1 in the onshore Bonaparte Basin in northern Australia. The Bonaparte Basin is a hydrocarbon-bearing sedimentary basin straddling the border between the Northern Territory (NT) and Western Australia (WA). Most of the basin is located offshore, covering 250,000 square kilometres, compared to just over 20,000 square kilometres onshore. In addition to the conventional gas the Bonaparte Basin has been identified as a potential shale gas basin.
Advent holds Exploration Permit EP 386 (2,568 square kilometres in area) which is the sole petroleum permit in the Western Australian section of the onshore Bonaparte Basin. Since 1960 twelve wells have been drilled in or near EP 386 and only sixteen in the whole of the onshore basin, with an excellent technical success rate of encountering hydrocarbons.
Company Focus and Developments
Gas flaring during production testing at Advent’s Vienta-1 well in EP 386.
For
per
sona
l use
onl
y

3MEC Resources 2012 ANNUAL REPORT
Waggon Creek-1, drilled in 1995, provided strong evidence of a significant sweet gas-charged stratigraphic trap with fair to good quality sandstone reservoir within the upper Milligans Formation. Drilling of Vienta-1 in 1998 demonstrated numerous gas shows within Enga Sandstone units, with dry gas flowed to surface and visual porosity described in the cuttings. Both Waggon Creek-1 and Vienta-1 were cased and suspended for future production.
During the period, Advent commenced appraisal of the Waggon Creek-1 and Vienta-1 gas discoveries.
Vienta-1 was recompleted before commencing a short term production test. Zones tested between 1365m-1369m and 1411m-1421m depth yielded gas flows at initial rates of 2.1 million standard cubic feet of gas per day (MMscf/d) and reducing to 0.6 MMscf/d within an hour’s flow.
The shut in and extended build-up pressure monitoring returned strong pressure recovery. Subsequent data analysis and interpretation indicates the presence of mult-layer reservoirs of relatively tight permeability and extremely high skin damage. In addition, the presence of either a closed fault or pinchout edge is interpreted in close proximity to the wellbore which is consistent with the seismic data showing the possible presence of a stratigraphic pinchout play at the lower tested interval. Indications of over-pressure at this level provide for a higher upside potential that could be confirmed through additional high resolution seismic data acquisition.
The completion and flow test program of Waggon Creek-1 was suspended on Friday 4th November 2011 due to the early onset of the wet season. The well was completed with perforations over intervals 384.1-390.1 m and 393.1-395.1 m in the Milligans Formation sandstone reservoirs. Preliminary field observations showed that during the 6 hour flow through a test separator with back pressure of 50 psi, the well flowed gas at a stabilised rate of approximately 1.07 million standard cubic feet of gas per day (MMscf/d) through a 32/64” choke with Flowing Tubing Head Pressure (FTHP) of 153 psi which was still rising slowly at the end of the flow test. No water was produced during the flow test.
Bonaparte Basin - onshore and offshore Hydrocarbon Discoveries.
For
per
sona
l use
onl
y

ENERGY MINERALS EXPLORATION
4 MEC Resources 2012 ANNUAL REPORT
Gas flowing during production testing at Advent’s Waggon Creek-1 well in EP 386.
The production test at Waggon Creek-1 with downhole gauges is planned to be concluded during the 2012 dry season to obtain reservoir properties and deliverability.
In the NT, Advent holds Retention Licence RL 1 (166 square kilometres in area), which covers the Weaber Gas Field which was originally discovered in 1985. Application has been made to renew the Retention Licence for a further five year term.
Advent has advised that the 2C Contingent Resources* for the Weaber Gas Field in RL 1 are 11.5 billion cubic feet (Bcf) of natural gas following an independent audit by RISC. Significant upside 3C Contingent Resources of 45.8 Bcf have also been assessed by RISC.
The results are summarised below:
Weaber Field 1C 2C 3C Mean1
Gas Initially In Place (Bcf) 0.33 13.9 54.1 21.9
Contingent Resources (Bcf) 0.25 11.5 45.8 18.4
1 The mean is the average of the probabilistic resource distribution
* Contingent Resources, as defined under the Society of Petroleum Engineers Petroleum Resource Management
System (SPE PRMS) guidelines.
The current rapid development of the Kununurra region in northern Western Australia, including the Ord River Irrigation Area phase 2, the township of Kununurra, and numerous regional resource projects provides an exceptional opportunity for Advent to potentially develop its nearby gas resources.
Advent believes the Ord Expansion project will impact positively on EP 386. The initial phase of works is progressing north of Kununurra and adjacent to Advent’s EP 386 permit. The current Ord expansion project through Government expanditure of over $300m, has brought road infrastructure to within 15 kilometres of Advent’s Vienta-1 gas well in EP 386 and will greatly assist in the development of Advent’s onshore Bonaparte Basin gas assets. The construction of all-weather sealed roads within the Ord phase two project provides for suitable infrastructure developments to support a commercial development of the field.
Company Focus and Developments
For
per
sona
l use
onl
y

5MEC Resources 2012 ANNUAL REPORT
These important investments by the Commonwealth and WA governments provide the impetus for Advent to pursue its objective of developing its wholly owned petroleum resources within EP 386 and RL 1. Significantly, these investments will impact markedly on the energy requirements of the Kununurra region which is currently supplied by hydroelectricity from the Lake Argyle hydroelectric facility and diesel power generation.
Advent is in an exceptional position where it remains the operator and 100% owner of the only petroleum permits in the vicinity of this region.
Unconventional Resources within EP 386 and RL 1
Advent has completed an initial study of shale gas potential in EP 386 and RL 1. The results indicate significant potential upside in prospective shale gas resources for Advent with estimated unrisked OGIP for EP 386 & RL 1 in the range from 19 TCF to 141 TCF. The thickness of the prospective shale gas play varies from 300m to over 1500m.
The prospectivity of the Bonaparte Basin is evident from the known oil and gas fields in both the offshore and onshore portions of the basin. Advent’s onshore EP 386 and RL 1 contain many large structures with conventional reservoir gas discoveries.
Initial study of shale gas potential in EP 386 and RL 1
The current study analysed all wells drilled in the onshore Bonaparte Basin which has thermally mature thick source rock (>500m) with potential large unconventional resources.
The study shows considerable shale gas and tight gas potential.
The study’s key findings are:-Multiple petroleum targets are present in EP 386 & RL 1:
• Proven conventional gas charged sandstone reservoirs in nearshore marine area of the Milligans Formation;
• Unconventional gas-condensate shale play in the shallow marine areas of Lower Milligans Formation;
• Unconventional tight gas sandstone and limestone reservoirs in the Langfield, Ningbing & Cockatoo groups below the Milligans Formation;
• Lower Milligans Formation shale is prospective for shale gas play with considerably large upside potential;
• Marine shale with moderate organic richness: TOC of up to 4.3% from samples in wells within or in close proximity of EP 386. Higher TOC could be present in the north east of EP 386;
• Source rocks are mature for gas and oil generation: Ro range 0.44-2.42% & Tmax range from 430 to 480;
• Limited geochemical data indicates source rocks at depth shallower than c. 1400m are mature for gas/wet gas and oil generating windows, but over-mature and in the dry gas generating window at depth below 1400m;
• The thickness of the prospective shale gas play is varied from 300m to over 1500m. This would provide significant upside in prospective shale gas resources; and
• Unrisked OGIP for EP 386 & RL 1 could be in the range from 19 TCF to 141 TCF.
For
per
sona
l use
onl
y

ENERGY MINERALS EXPLORATION
6 MEC Resources 2012 ANNUAL REPORT
Example well composite log from Garimala-1 demonstrating elevated gas shows over a considerable shale sequence. Composite well logs from all onshore Bonaparte Basin wells demonstrate similar characteristics.
Clearly, Advent has a considerable potential hydrocarbon resource and is now working toward an appropriate program to fully identify and understand the nature of the unconventional shale gas/condensate play in its 100% owned EP 386 and RL 1 permits.
PEP 11 Oil and Gas Permit
Advent now holds 85% of Petroleum Exploration Permit PEP 11 – an exploration permit prospective for natural gas located in the Offshore Sydney Basin. This was achieved following the drilling of New Seaclem-1 that concluded in January 2011. The drilling has shown that the early Permian geological sequence is mature for liquid hydrocarbons.
PEP 11 has successfully been renewed for a further five year term that commenced on 13 August 2012. The minimum work commitments for the renewed term are:
Company Focus and Developments
Year of Term of Permit
Minimum Work Requirements
1 2000 km 2D seismic reprocessing;Geotechnical studies
2 200 km 2D seismic survey;Geotechnical studies
3 Geotechnical studies
4 Drill one (1) exploration well
5 500 km2 3D seismic survey
Elevated gas shows over 1700m in shale/siltstone section. TOC from Lab matched well with computed value from logs and maximum TOC value can be up to 5%(right column).
Garimala-1: Elevated Gas Shows over Milligans-Langfield Section
For
per
sona
l use
onl
y

7MEC Resources 2012 ANNUAL REPORT
PEP 11 is a significant offshore exploration area with large scale structuring and potentially multi-Trillion cubic feet (Tcf) gas charged Permo-Triassic reservoirs.
The prospectivity of this proven petroleum basin has been enhanced by the confirmation of the presence of apparent ongoing hydrocarbon seeps. Sub-bottom profile data, swath bathymetry, seismic and echosounder data collected by Geoscience Australia along the continental slope / permit margin has demonstrated active erosional features in conjunction with geophysical indications of gas escape.
Advent has previously interpreted significant seismically indicated gas features. Key indicators of hydrocarbon accumulation features have been interpreted following review of the 2004 seismic data, reprocessed in 2010. The seismic features include apparent Hydrocarbon Related Diagenetic Zones (HRDZ), Amplitude Versus Offset (AVO) anomalies and potential flat spots.
Mapped prospects and leads within the Offshore Sydney Basin are generally located less than 50km from Australia’s largest energy market, the Sydney-Wollongong-Newcastle greater metropolitan area. This area has a population of approximately 5,000,000 people. Traditionally, all natural gas used in New South Wales has been piped in from South Australia and the Bass Strait. However, studies by the Australian Bureau of Agricultural and Resource Economics (ABARE) and the Australian Petroleum Production and Exploration Association (APPEA) state that those sources may not be able to meet the demand for gas in the medium to longer term.
Advent has demonstrated considerable gas generation and migration in the Offshore Sydney Basin, with the previously observed mapped prospects and leads remaining highly prospective for gas.
For
per
sona
l use
onl
y

ENERGY MINERALS EXPLORATION
8 MEC Resources 2012 ANNUAL REPORT
Western Australia – Exmouth Sub-Basin (EP325)
Advent Energy Ltd has an 8.3% interest (Permit Operator: Strike Energy Ltd) in a shallow, near shore permit in the Exmouth sub-Basin region of the Carnarvon Basin, which contains the undeveloped Rivoli Gas Field. The Rivoli Gas Field contains approximately 6.8 – 18 PJ of gas. The permit also contains the Rivoli Deep prospect and other leads. The Joint Venture is now planning for 3D seismic coverage of the Rivoli Gas Field and nearby prospects and leads.
Company Focus and Developments
For
per
sona
l use
onl
y

9MEC Resources 2012 ANNUAL REPORT
BPH Energy Limited
MEC Resources holds 8.3% of BPH Energy Limited (“BPH”) through participation in placements and rights issues.
BPH is a diversified company holding investments in biotechnology and resources. BPH also holds a significant interest (27.4%) in unlisted oil and gas exploration company Advent Energy Ltd. BPH is commercialising a portfolio of Australian biomedical technologies emerging from collaborative research by leading universities, medical institutes and hospitals across Australia.
Biomedical technologies in the commercialisation stage include:
• Diagnostic Array Systems; BacTrak (a faster and more effective method for detecting infectious disease)
• Cortical Dynamics’ Brain Anaesthesia Response (BAR) Monitor; a device that measures a patient’s brain electrical activity (EEG) to indicate the response to drugs administered during surgery
• HLS5 Tumour Suppress Gene; a genetic marker for early and accurate cancer detection
• Microtubule drugs that target the tumour vasculature
Molecular Discovery Systems (MDSystems), launched in 2006 and spun off from BPH in 2009, is an investee of BPH for drug discovery and validation of biomarkers for disease, therapy and diagnostics. MDS is intended for IPO.
Cortical Dynamics has now begun its first human clinical trial using the complete BAR monitoring system within the operating room. It is expected that approximately 20 patients undergoing cardiopulmonary bypass surgery will be enrolled in the trial located at St Vincent’s Hospital, Melbourne. The study is designed to detect varying levels of anaesthetic agents in an operating room environment where the presence of multiple sources of artefacts is known to complicate the EEG assessment of anaesthetic action. The study has recruited multiple patients and it is anticipated to be completed later this year.
Cortical Dynamics also had the great honour of the BAR monitor being named a finalist for the health category of The 2011 Australian Innovation Challenge, a national innovation competition hosted by the Australian Government.
During the period, independent researchers in China found that reduced HLS5 levels were shown to correlate with worse tumour grade, increased tumour size and elevated serum AFP levels, a marker of liver cancer. This new study greatly supports the research by MDSystems and WAIMR on this tumour suppressor gene.
NOTE: In accordance with ASX listing requirements, the geological information supplied in this report has been based on information provided by geologists who have had in excess of five years experience in their field of activity.
Asset Energy Pty Ltd is a wholly owned subsidiary of Advent Energy Ltd and is the Operator for PEP 11 under the joint operating agreement with Bounty Oil and Gas NL.
MEC is an exploration investment company and relies on the resource and ore reserve statements compiled by the companies in which it invests. All Resource and Reserve Statements have been previously published by the companies concerned. Summary data has been used. Unless otherwise stated all resource and reserve reporting complies with the relevant standards. Resources quoted in this report equal 100% of the resource and do not represent MEC’s investees’ equity share unless stated.
For
per
sona
l use
onl
y

ENERGY MINERALS EXPLORATION
10 MEC Resources 2012 ANNUAL REPORT
Directors’ Report
The directors of MEC Resources Ltd (“MEC” or the “Company”) present their report on the company for the financial year ended 30 June 2012.
DirectorsThe names of directors in office at any time during or since the end of the year are:
H Goh
D L Breeze
K O Yap
C T Lim (resigned 2 April 2012)
D Ambrosini
Company SecretaryMs Deborah Ambrosini continues in her role of Company Secretary. She also holds the position of Financial Controller of the Company and has over 11 years experience in Corporate accounting roles.
Principal Activities MEC is registered as a Pooled Development Fund under the Pooled Development Fund Act (1992). It has been formed to invest into exploration companies that are targeting potentially large energy and mineral resources.
MEC will provide carefully selected companies in the energy and mineral exploration sectors with development and exploration funding. MEC intends to identify investment opportunities with a number of specific characteristics including: large targets; a stage of development that permits a strategic investor or IPO within several years; strong and experienced management team and a definitive competitive advantage.
MEC’s current major investment lies in unlisted Australian oil and gas exploration company, Advent Energy Ltd.
Advent Energy Ltd -Oil and Gas
MEC has a controlling interest in the unlisted energy explorer Advent Energy Ltd (“Advent”) of 44.89%.
Advent has assembled a range of hydrocarbon permits which contain near term production opportunities with pre-existing infrastructure and exploration upside.
Advent’s assets include EP 386 and RL 1 (100%) in the onshore Bonaparte Basin in the north of Western Australia and Northern Territory, PEP 11 (85%) in the offshore Sydney Basin and EP325 (8.3%) in the Exmouth Sub-basin of the Carnarvon Basin near Exmouth in WA. Advent’s portfolio of assets has an estimated AUD $156m invested historically on exploration.
Advent is investigating a considerable potential shale gas resource within EP 386 and RL 1. Studies indicate significant potential upside in prospective shale gas resources with estimated unrisked OGIP in the range from 19 Tcf to 141 Tcf.
A mean contingent Resource of 18.4 Bcf for the Weaber Gas Field (RL 1) has recently been assessed by an independent third party as a component of Advent’s drive to commercialise its 100% owned onshore Bonaparte Basin assets. The current rapid development of the Kununurra region in northern Western Australia, including the Ord Irrigation Expansion Project and numerous resource projects, provides an exceptional opportunity for Advent to potentially develop its nearby gas resources for the benefit of the region along with Advent and its shareholders.
For
per
sona
l use
onl
y
11MEC Resources 2012 ANNUAL REPORT
The Sydney Basin is a proven petroleum basin with excellent potential for the discovery of gas and oil. The demonstration of an active hydrocarbon system with seeps reported in the offshore area and sampling indicated the presence of thermogenic hydrocarbon gas is considered to occur in basins actively generating hydrocarbons and /or that contain excellent migration pathways. Drilling during 2010 shown that the early Permian geological sequence is mature for hydrocarbons.
Undiscovered prospective recoverable gas resources for structural targets within the PEP 11 offshore permit have been estimated at 6 trillion cubic feet (at the P50 level) or up to 23.5 Tcf on a probabilistic mean calculation. PEP 11 lies adjacent to the most populous region of Australia and the major industrial hub of Newcastle where LNG production facilities are being developed (independently of Advent).
Advent is considering a future listing on a securities exchange.
Operating ResultsOperating loss for the consolidated entity after tax for the year was $9,178,725 (2011: Loss $4,055,799).
DividendsThe Directors recommend that no dividend be paid in respect of the current period and no dividends have been paid or declared since the commencement of the period.
Financial PositionThe net assets of the consolidated entity have decreased by $9,410,076 to $36,723,543 at 30 June 2012. The decrease can be attributed to the loss incurred in the sale of shares held in BPH Energy Limited (“BPH”) during the period, from the selective buy back conducted by BPH.
Significant Changes In State Of Affairs• During the period MEC entered into a selective buyback agreement with BPH. BPH agreed to buy
back up to $1.35 million of MEC’s shareholding in the Company. The number of buy-back Shares was determined by dividing the total Consideration by the 5-day volume weighted average closing price of Shares prior to the date of the buy-back.
• MEC’s investee Advent achieved an independently assessed (RISC) mean Contingent Resource for the Weaber Gas Field (RL 1) of 18.4 Bcf following reprocessing of seismic data and review of all available well data from Weaber. The field has been assessed as comprising a 3C upside potential Contingent Resource of 45.8 Bcf.
• MEC’s investee Advent re-entered Vienta-1 located within EP 386 for the purpose of recompletion and production testing. Production testing on the lower zone of Vienta-1 was performed and the well observed strong pressure recovery. Preliminary interpretations are that this well was heavily damaged during the drilling of the well, and that the geological formation from which gas is flowing is relatively ‘tight’ (low inherent permeability).
• MEC’s investee Advent re-entered Waggon Creek-1 located within EP 386, and 10km from Vienta-1, for the purpose of recompletion and production testing. The well was flowed for 6 hours before operations were suspended for the northern wet season. Stable flow rates in excess of 1MMscf/d were achieved through a ½ inch choke.
• MEC’s investee Advent is investigating a considerable potential shale gas resource within EP 386 and RL 1. Studies indicate significant potential upside in prospective shale gas resources with estimated unrisked OGIP in the range from 19 Tcf to 141 Tcf.
For
per
sona
l use
onl
y

ENERGY MINERALS EXPLORATION
12 MEC Resources 2012 ANNUAL REPORT
Directors’ Report
After Balance Date Events On 13 August 2012 Asset Energy Pty Ltd (“Asset”), a 100% owned subsidiary of Advent, received notification from the National Offshore Petroleum Titles Authority that the PEP 11 permit had been renewed for a further 5 year period.
Future DevelopmentsThe entity will continue to develop its investee portfolio projects including PEP 11 and EP 386 and will evaluate and invest in a range of resource projects.
Information on Directors
H Goh Non-Executive Chairman – Age 57
Shares held in MEC – 5,085,598Shares held in Advent – 3,000,000Listed Options held – 4,725,144Unlisted Options held MEC – nil
Mr Hock Goh was formerly President of Network and Infrastructure Solutions, a division of Schlumberger Limited, based in London with revenue in excess of US$1.5 billion. He had global responsibility of Schlumberger’s outsourcing services, security, business continuity and networked related business units.
Prior to that, Hock was President of Schlumberger Asia based in Beijing, China where he managed their Asian operations consisting of a broad range of services including oil field services, outsourcing, financial software and smartcards. Hock was responsible for US$800 million in revenue and more than 2,000 employees spread across 17 countries.
In his 25 year career with Schlumberger, Hock held several other field and management responsibilities in the oil and gas industry spanning more than ten countries in Asia, the Middle East and Europe. Hock started as an oil field service engineer in Indonesia in 1980 before moving to Australia where he worked on the rigs in Roma, Queensland, Bass Strait in Victoria and the Northwest Shelf, offshore Western Australia.
Hock is also an operating partner with Baird Capital Partners, the U.S. based buyout fund of Baird Private Equity, providing change-of-control and growth capital to middle-market companies. Baird Private Equity has raised and managed $1.7 billion in capital.
Hock is the Chairman of Netgain Systems, a network monitoring software provider. He also serves on the Board of Xaloy Holdings, a US based steel components manufacturer for the plastic industry, as well as an independent director of THISS Technologies Pte Ltd, a Singapore based satellite communication provider. He received his B Eng (Hons) in Mechanical Engineering from Monash University, Australia. He also completed an Advanced Management Program at INSEAD/ France in 2004.
Hock is a Non Executive director of ASX listed company BPH Energy Limited. For
per
sona
l use
onl
y

13MEC Resources 2012 ANNUAL REPORT
D L Breeze
Executive Director and Managing Director – Age 58
Shares held MEC – 13,183,654Listed Options – 7,608,228Unlisted Options held in MEC – nilUnlisted Options held in Advent – 4,000,000
David has extensive experience in transaction structuring, corporate advisory and funding for listed and unlisted companies and has held executive, consulting and/or board positions across a range of stockbroking companies in Australia including Daiwa Securities, Eyres Reed McIntosh and BNZ North’s.
David has provided capital raising, valuation and corporate advisory services for a wide ranging group of resources companies including Independent Experts reports for asset valuation under the provisions of the Australian Securities Exchange Rules and Corporations Law. The advisory function included advice on corporate structure, ASX listing rules and the structuring and running of IPO’s. He has also published in the Australian Securities Industry Journal on resource valuation.
David is Chairman of Grandbridge Limited, a publicly listed investment and advisory company and BPH Energy Limited an ASX listed alternative investment business.
He holds a Bachelor of Economics and a Masters of Business Administration (MBA) and is a Fellow of the Securities Institute of Australia and a Fellow of the Institute of Company Directors of Australia.
K O YapNon-Executive Director – Age 50
Shares held MEC – 4,039,350Listed options – 3,000,000Unlisted Options held in MEC – nil
K.O Yap has over 16 years experience in investment banking. Prior to establishing Eton Advisory Services Ltd, K.O was Head of Corporate Finance at Daiwa Securities (H.K.) Ltd. and Executive Director at Alta Financial Group. His career took him from general audit, computer audit and corporate advisory with Ernst & Young in London to investment banking with Barclays de Zoete Wedd Asia Ltd. and then Daiwa Securities (H.K.) Ltd.
His extensive experience covers all aspects of corporate finance, advisory, M&A and capital raisings throughout Asia. These include privatisation, listing and public offerings from the PRC (Northeast Electric, H-Share), Malaysia (Petronas Gas), Thailand (PTTEP); equity-linked issues from HK (Emperor International) and Thailand (Bangkok Land) and debt issues including a samurai bond for Wharf (H.K.).
K.O also has extensive experience in mergers and acquisitions (and related restructurings) with transactional experience in Thailand, Indonesia, Malaysia, Hong Kong and China.
K.O a graduate from the London School of Economics, in 1984, is also a fellow of the Institute of Chartered Accountants in England and Wales.F
or p
erso
nal u
se o
nly

ENERGY MINERALS EXPLORATION
14 MEC Resources 2012 ANNUAL REPORT
Directors’ Report
Information on Directors (continued)
C T LimNon-executive Director – Age 57
Shares held – 3,434,350Listed options – 2,062,500Unlisted Options held in MEC – nil
Mr Lim is a founder and director of Encus International Pte Ltd, a contract design and manufacturing company. Mr Lim was also the Chief Executive of Xpress Holdings Ltd during the period from 2001 to August 2005 and its Group Managing Director in 2000. He is currently an Executive Director of Manufacturing Integration Technology Ltd.
For 20 years Mr Lim was with the Singapore Economic Development Board and held various positions with responsibilities for promoting and developing venture capital, mergers and acquisitions, engineering industries, local enterprises, skills training, automation and overseas investments.
Mr Lim is also involved with several listed and private companies in Singapore.
He is an Independent and Non-Executive Director on the boards of Metal Component Engineering Ltd, Valuetronics Holdings Ltd, Fastube Ltd and FibreChem Technologies Ltd, all of which are listed on the Singapore Exchange.
In the academic area, Mr Lim is a member of the Board of Governors of Nanyang Polytechnic in Singapore.
Mr Lim holds a Bachelor of Science (Honours) Degree in Mechanical Engineering from the University of Leeds and a Diploma in Business Administration from the National University of Singapore. In addition, Mr Lim attended the Program for Management Development at Harvard Business School.
Mr Lim is a Non Executive director of ASX listed company Grandbridge Limited.
D AmbrosiniExecutive Director and Company Secretary – Age 38
Shares held – nilListed options – nilUnlisted Options held in MEC – 800,000Unlisted Options held in Advent – 500,000
Deborah is a chartered accountant with over 11 years’ experience in accounting and business development spanning the biotechnology, mining, IT communications and financial services sectors. She has extensive experience both nationally and internationally in financial and business planning, compliance and taxation.
Deborah is a member of the Institute of Chartered Accountants in Australia and was a state finalist in the 2009 Telstra Business Woman Awards. Deborah was also a recipient of the highly regarded 40 under 40 award held by the WA Business News.
Deborah is also a Director of ASX listed BPH Energy Limited and Grandbridge Limited.
For
per
sona
l use
onl
y

15MEC Resources 2012 ANNUAL REPORT
Remuneration Report (Audited)This report details the nature and amount of remuneration for each key management personnel of MEC Resources Ltd.
H Goh – Non-Executive Chairman
D L Breeze – Executive Director
K O Yap – Non-Executive Director
C T Lim – Non-Executive Director ( resigned 2 April 2012)
D Ambrosini – Executive Director and Company Secretary
E H Tan – Non Executive Director of Advent
Remuneration PolicyThe remuneration policy of MEC Resources Ltd has been designed to align director and executive objectives with shareholder and business objectives by providing a fixed remuneration component and offering specific long-term incentives as determined by the board and/or shareholders. The remuneration report as contained in the 2011 financial accounts was adopted at the Company’s 2011 annual general meeting. Although a total of 34% of valid proxy votes were against the adoption of this report the board believes the remuneration policy to be appropriate and effective in its ability to attract and retain the best executives and directors to run and manage the economic entity, as well as create goal congruence between directors, executives and shareholders. Remuneration for both Executive and Non-Executive directors has not increased since company inception. Although remuneration is reviewed annually against local market levels the Board believes this course of action to be appropriate.
The board’s policy for determining the nature and amount of remuneration for board members and senior executives of the economic entity is as follows:
The remuneration policy, setting the terms and conditions for the executive directors and other senior executives, was approved by the board.
• All executives receive a base salary (which is based on factors such as length of service and experience), superannuation, fringe benefits and options.
• The Board reviews executive packages annually by reference to the economic entity’s performance, executive performance and comparable information from industry sectors and other listed companies in similar industries.
The performance of executives is measured against criteria agreed biannually with each executive and is based predominantly on the forecast growth of the economic entity’s profits and shareholders’ value. The board may, however, exercise its discretion in relation to approving incentives, bonuses and options. Any changes must be justified by reference to measurable performance criteria. The policy is designed to attract the highest calibre of executives and reward them for performance that results in long-term growth in shareholder wealth.
Executives are also entitled to participate in the employee share and option arrangements.
The executive directors and executives receive a superannuation guarantee contribution required by the government, which is currently 9%, and do not receive any other retirement benefits. Some individuals, however, have chosen to sacrifice part of their salary to increase payments towards superannuation.
For
per
sona
l use
onl
y

ENERGY MINERALS EXPLORATION
16 MEC Resources 2012 ANNUAL REPORT
Directors’ Report
Remuneration Policy (continued)Shares given to directors and executives are valued as the difference between the market price of those shares and the amount paid by the director or executive. Options are valued using the Black-Scholes methodology.
The board policy is to remunerate non-executive directors at market rates for comparable companies for time, commitment and responsibilities. The remuneration committee determines payments to the non-executive directors and reviews their remuneration annually, based on market practice, duties and accountability. Independent external advice is sought when required. The maximum aggregate amount of fees that can be paid to non-executive directors is subject to approval by shareholders at the Annual General Meeting. Fees for non-executive directors are not linked to the performance of the economic entity. However, to align directors’ interests with shareholder interests, the directors are encouraged to hold shares in the company and are able to participate in the employee option plan.
Compensation PracticesThe board’s policy for determining the nature and amount of compensation of key management for the group is as follows:
The compensation structure for key management personnel is based on a number of factors, including length of service, particular experience of the individual concerned, and overall performance of the company. The contracts for service between the company and key management personnel are on a continuing basis, the terms of which are not expected to change in the immediate future. Upon retirement key management personnel are paid employee benefit entitlements accrued to date of retirement. Key management personnel are paid six months of salary in the event of redundancy and options not exercised before or on the date of termination do not lapse.
The Board determines the proportion of fixed and variable compensation for each key management personnel.
Employment contracts of directors The employment conditions of the managing director are formalised in a contract of employment. The employment contract stipulates a six month resignation period. The company may terminate an employment contract without cause by providing six months written notice or making payment in lieu of notice, based on the individual’s annual salary component together with a redundancy payment of six months of the individual’s fixed salary component. Termination payments are generally not payable on resignation or dismissal for serious misconduct. In the instance of serious misconduct the company can terminate employment at any time. Any options not exercised before or on the date of termination will lapse.
The remaining directors are consultants to MEC Resources Ltd and each party can terminate their services by written notice.
Details of Remuneration for the year ended 30 June 2012
The remuneration for each director of the consolidated entity receiving the highest remuneration during the year was as follows:
For
per
sona
l use
onl
y

17MEC Resources 2012 ANNUAL REPORT
Details of Remuneration for the year ended 30 June 2012The remuneration for each director of the consolidated entity receiving the highest remuneration during the year was as follows:
2012
Key Management
PersonShort-term
Benefits
Post-employment
Benefits
Cash, Salary and Fees Bonus
Non-cash benefit Other
Super-annuation
H Goh 100,000 - - - -
D L Breeze 115,000 - - - -
K O Yap 25,000 - - - -
C T Lim 18,750 - - - -
D Ambrosini 50,000 - - - -
E H Tan 25,000 - - - -
2012 (continued)
Key Management
Person
Long-term
BenefitsShare-based
payment TotalPerformance
Related
Compensation relating to
options
Other Shares Options $ % %
H Goh - - - 100,000 - -
D L Breeze - - - 115,000 - -
K O Yap - - - 25,000 - -
C T Lim - - - 18,750 - -
D Ambrosini - - 37,167 87,167 - 43%
E H Tan - - - 25,000 - -
2011
Key Management
PersonShort-term
Benefits
Post-employment
Benefits
Cash, Salary and Fees Bonus
Non-cash benefit Other
Super-annuation
H Goh 100,000 - - - -
D L Breeze 115,000 - - - -
K O Yap 25,000 - - - -
C T Lim 25,000 - - - -
D Ambrosini 50,000 - - - -
E H Tan 25,000 - - - -
For
per
sona
l use
onl
y

ENERGY MINERALS EXPLORATION
18 MEC Resources 2012 ANNUAL REPORT
Directors’ Report
Details of Remuneration for the year ended 30 June 2012 (continued)2011 (continued)
Key Management
Person
Long-term
Benefits
Share-based payment
Total Performance Related
Compensation relating to
options
Other Shares Options $ % %
H Goh - - - 100,000 - -
D L Breeze - - 356,800 471,800 - 76%
K O Yap - - - 25,000 - -
C T Lim - - - 25,000 - -
D Ambrosini - - 32,884 82,884 - 40%
E H Tan - - - 25,000 - -
The company has an agreement with Trandcorp Pty Ltd on normal commercial terms procuring the services of David Breeze. The agreement is at the rate of $65,000 per annum, commencing from the time of receiving listing approval. Board payments may be made up to a level of $250,000 per annum. Payments are to be made up to $25,000 per annum per director and $50,000 per annum for the Chairman.The following share-based payment arrangements were in existence relating to directors remuneration.
The following share-based payment arrangements were in existence relating to directors remuneration.
Option Series
Company Grant date
Expiry date
Grant date fair value
Vesting date No. of Options
14/05/2008 Advent Energy 14/05/2008 28/12/2012 0.0319 28/12/2009 2,000,000
01/06/2008 MEC Resources 01/06/2008 30/06/2013 0.0304 01/06/2011 800,000
05/08/2010 Advent Energy 05/08/2010 05/08/2015 0.1784 05/08/2010 2,000,000
05/08/2010 Advent Energy 05/08/2010 05/08/2015 0.1784 05/08/2013 250,000
05/08/2010 Advent Energy 05/08/2010 05/08/2015 0.1784 05/08/2014 250,000
There are no further service or performance criteria that need to be met in relation to options granted.
There were no grants of share based payment compensation to directors and senior management during the year.
Company performance, shareholder wealth, and director and executive remunerationThe following table shows the gross revenue and the operating result for the last 5 years for the listed entity, as well as the share price at the end of the respective financial years. Analysis of the actual figures shows an increase in the operating loss in the current year. The Board is of the opinion that the increased loss is in line with expectations after the significant losses incurred on MEC’s investments during the year as a result of the decline in market conditions.
2008 2009 2010 2011 2012
Revenue 1,067,694 108,306 309,685 670,522 376,380
Net Profit/Loss (433,939) (3,357,021) (2,905,010) (8,005,537) (9,645,887)
Share price at Year end $0.115 $0.105 $0.385 $0.11 $0.085
Earnings per share ($0.668) ($3.27) ($2.53) ($2.79) ($5.89)
End of remuneration report.
For
per
sona
l use
onl
y

19MEC Resources 2012 ANNUAL REPORT
Meetings of Directors During the financial year, two meetings of directors (including committees of directors) were held. Attendances by each director during the year were:
Directors’ Meetings
Number eligible to attend Number attended
H Goh 2 2
D L Breeze 2 2
K O Yap 2 2
C T Lim 2 2
D Ambrosini 2 2
Indemnifying Officers or AuditorsDuring or since the end of the financial year the company has given an indemnity or entered an agreement to indemnify, or paid or agreed to pay insurance premiums as follows:
The company has paid premiums to insure each of the following directors against liabilities for costs and expenses incurred by them in defending any legal proceedings arising out of their conduct while acting in the capacity of director of the company, other than conduct involving a wilful breach of duty in relation to the company. The amount of the premium was $26,513.
• D Breeze
• D Ambrosini
• H Goh
• K O Yap
The company has not indemnified the current or former auditor of the Company.
Options At the date of this report, the unissued ordinary shares of MEC Resources Ltd under unlisted options are as follows:
MEC Resources
Grant Date Date of Expiry Exercise Price Number Under Option
01/06/2008 01/06/2013 $0.15 1,336,667
06/08/2008 06/08/2013 $0.15 833,333
05/08/2010 05/08/2015 $1.25 150,000
06/10/2010 06/10/2015 $1.25 250,000
06/10/2010 06/10/2015 $1.50 250,000
04/11/2010 04/11/2015 $1.25 100,000
21/01/2011 21/01/2016 $0.80 575,000
14/07/2011 14/07/2015 $0.35 1,000,000
For
per
sona
l use
onl
y

ENERGY MINERALS EXPLORATION
20 MEC Resources 2012 ANNUAL REPORT
Advent Energy
Grant Date Date of Expiry Exercise Price Number Under Option
14/05/2008 28/12/2012 $0.06 2,000,000
01/06/2008 30/06/2013 $0.06 2,000,000
05/08/2010 05/08/2015 $2.00 3,500,000
Listed Options
MEC Resources Ltd
Grant Date Date of Expiry Exercise Price Number Under Option
07/08/2008 04/07/2013 $0.20 48,954,570
During the year ended 30 June 2012, 10,000 ordinary shares of MEC Resources Ltd were issued on the exercise of options granted under the MEC Resources Ltd Incentive Option Scheme (2011: 8,786,666). No amounts are unpaid on any of the shares.
No person entitled to exercise the option had or has any right by virtue of the option to participate in any share issue of any other body corporate.
Proceedings on Behalf of CompanyNo person has applied for leave of Court to bring proceedings on behalf of the company or intervene in any proceedings to which the company is a party for the purpose of taking responsibility on behalf of the company for all or any part of those proceedings. The company was not a party to any such proceedings during the year.
Environmental IssuesThe consolidated group’s operations are subject to significant environmental regulation under Commonwealth and State laws. Details of the consolidated group’s performance in relation to environmental regulation follow.
During the year Advent applied for and was granted the approval to re-enter Vienta-1 and Waggon Creek-1 within EP 386 during the 2011 dry season for the purposes of performing production testing on these gas discovery wells. Vienta-1 was drilled in 1998 and Waggon Creek-1 was drilled in 1995 by previous operators. Advent opted to access these sites using existing access roads, tracks and previously cleared seismic lines to ensure that any impact on the environment through its re-entry activities was as low as reasonably practical. The early onset of the wet season prevented Advent from concluding its production testing operations during 2011. These are intended to be concluded during the 2012 dry season under the existing approved Environmental Management Plan.
Directors’ Report
For
per
sona
l use
onl
y

21MEC Resources 2012 ANNUAL REPORT
Non-audit ServicesThe board of directors is satisfied that the provision of non-audit services during the year is compatible with the general standard of independence for auditors imposed by the Corporations Act 2001. The directors are satisfied that the services disclosed below did not compromise the external auditor’s independence for the following reasons:
• all non-audit services are reviewed and approved by the board prior to commencement to ensure they do not adversely affect the integrity and objectivity of the auditor; and
• the nature of the services provided do not compromise the general principles relating to auditor independence in accordance with APES 110: Code of Ethics for Professional Accountants set by the Accounting Professional and Ethical Standards Board.
No fees for non-audit services were paid/payable to the external auditors during the year ended 30 June 2012 (2011: Nil).
Auditor’s Independence DeclarationThe lead auditor’s independence declaration for the year ended 30 June 2012 has been received and can be found on page 22.
The directors’ report is signed in accordance with a resolution of directors made pursuant to S298(2) of the Corporations Act 2001.
David Breeze Director
Dated this 30th Day of August 2012
MEC Resources Limited
For
per
sona
l use
onl
y

ENERGY MINERALS EXPLORATION
22 MEC Resources 2012 ANNUAL REPORT
Auditor’s Independence Declaration
MEC Resources Ltd14 View StreetNORTH PERTH WA 6006
30 August 2012
Dear Board Members
MEC Resources Ltd
In accordance with section 307C of the Corporations Act 2001, I am pleased to provide the following declaration of independence to the directors of MEC Resources Ltd.
As lead audit partner for the audit of the financial statements of MEC Resources Ltd for the financial year ended 30 June 2012, I declare that to the best of my knowledge and belief, there have been no contraventions of:
(i) the auditor independence requirements of the Corporations Act 2001 in relation to the audit; and
(ii) any applicable code of professional conduct in relation to the audit.
Yours sincerely
DELOITTE TOUCHE TOHMATSU
Chris NicoloffPartner
Chartered Accountants
Deloitte Touche TohmatsuABN 74 490 121 060
Woodside PlazaLevel 14240 St Georges TerracePerth WA 6000GPO Box A46Perth WA 6837 Australia
DX: 206Tel: +61 (0) 8 9365 7000Fax: +61 (8) 9365 7001www.deloitte.com.au
Liability limited by a scheme approved under Professional Standards Legislation.
Member of Deloitte Touche Tohmatsu
For
per
sona
l use
onl
y

23MEC Resources 2012 ANNUAL REPORT
To ensure that the Board is well equipped to discharge its responsibilities, it has established guidelines and accountability as the basis for the administration of corporate governance.
Corporate Governance DisclosuresMEC and the board are committed to achieving and demonstrating the highest standards of corporate governance. The board continues to review the framework and practices to ensure they meet the interests of shareholders. The company and its controlled entities together are referred to as the Group in this statement.
Composition Of The BoardThe composition of the Board is determined in accordance with the following principles and guidelines:
• the Board should comprise a majority or at least 50% of the Board will be independent non-executive directors;
• the Board should comprise of at least one director with an appropriate range of qualifications and expertise; and
• the Board shall meet at regular intervals and follow meeting guidelines set down to ensure all directors are made aware of, and have available all necessary information, to participate in an informed discussion of all agenda items.
When a vacancy exists, through whatever cause, or where it is considered that the Board would benefit from the service of a new director with particular skills, the Board selects a candidate or panel of candidates with the appropriate expertise.
The Board then appoints the most suitable candidate, who must stand for election at the next general meeting of shareholders. The Company does not have a formal Nomination Committee.
Remuneration and Nomination CommitteesThe Company does not have a formal Remuneration or Nomination Committees. The full Board attends to the matters normally attended to by a Remuneration Committee and a Nomination committee. Remuneration levels are set by the Company in accordance with industry standards to attract suitable qualified and experienced Directors and senior executives.
Corporate Governance Statement
The Board of Directors of MEC Resources Limited (“MEC or “the Company”) is responsible for the corporate governance of the economic entity. The Board guides and monitors the business and affairs of the Company on behalf of the shareholders by whom they are elected and to whom they are accountable.
For
per
sona
l use
onl
y

ENERGY MINERALS EXPLORATION
24 MEC Resources 2012 ANNUAL REPORT
Corporate Governance Statement
Audit CommitteeThe Company does not have a formal Audit Committee. The full Board carries out the functions of an Audit Committee. Due to the status of the Company and the relatively straight forward accounts of the Company, the Directors believe that at the moment there would be no additional benefits obtained by establishing such a committee. The Board follows the Audit Committee Charter, a copy of which is available on request.
Board ResponsibilitiesAs the Board acts on behalf of and is accountable to the shareholders, it seeks to identify the expectations of the shareholders, as well as other regulatory and ethical expectations and obligations. In addition, the Board is responsible for identifying areas of significant business risk and ensuring arrangements are in place to adequately manage those risks. The Board seeks to discharge these responsibilities in a number of ways.
The responsibility for the operation and administration of the economic entity is delegated by the Board to the Managing Director. The Board ensures that the Managing Director is appropriately qualified and experienced to discharge his responsibilities, and has in place procedures to assess the performance for the Company’s officers, employees, contractors and consultants.
The Board is responsible for ensuring that management’s objectives and activities are aligned with the expectations and risks identified by the Board. It has a number of mechanisms in place to ensure this is achieved, including the following:
• Board approval of a strategic plan, designed to meet shareholder needs and manage business risk;
• Implementation of operating plans and budgets by management and Board monitoring progress against budget;
• Procedures to allow directors, in the furtherance of their duties, to seek independent professional advice at the Company’s expense.
Monitoring Of The Board’s Performance In order to ensure that the Board continues to discharge its responsibilities in an appropriate manner, the performance of all directors is to be reviewed annually by the chairperson. Directors whose performance is unsatisfactory are asked to retire.
For
per
sona
l use
onl
y

25MEC Resources 2012 ANNUAL REPORT
Best Practice Recommendation Outlined below are the 8 Essential Corporate Governance Principles as outlined by the ASX and the Corporate Governance Council. The Company has complied with the Corporate Governance Best Practice Recommendations except as identified below.
Principle 1: Lay solid foundations for management and oversight
The relationship between the board and senior management is critical to the Group’s long-term success. The directors are responsible to the shareholders for the performance of the Group in both the short and the longer term and seek to balance sometimes competing objectives in the best interests of the Group as a whole. Their focus is to enhance the interests of shareholders and other key stakeholders and to ensure the Group is properly managed.
The responsibilities of the board include:
• providing strategic guidance to the Group including contributing to the development of and approving the corporate strategy;
• reviewing and approving business plans, and financial plans including major capital expenditure initiatives;
• overseeing and monitoring:
• organisational performance and the achievement of the Group’s strategic goals and objectives and
• progress of major capital expenditures and other significant corporate projects including any acquisitions or divestments
• monitoring financial performance including approval of the annual and half-year financial reports;
• appointment, performance assessment and, if necessary, removal of the Managing Director;
• ratifying the appointment and/or removal and contributing to the performance assessment for the members of the senior management team including the CFO (Deborah Ambrosini) and the Company Secretary;
• ensuring there are effective management processes in place and approving major corporate initiatives;
• enhancing and protecting the reputation of the organization;
• overseeing the operation of the Group’s system for compliance and risk management reporting to shareholders;
Day to day management of the Group’s affairs and the implementation of the corporate strategy and policy initiatives are formally delegated by the board to the Managing Director and senior executives.
Action taken and reasons if not adopted
For
per
sona
l use
onl
y

ENERGY MINERALS EXPLORATION
26 MEC Resources 2012 ANNUAL REPORT
Corporate Governance Statement
Principle 2: Structure the board to add value
The board operates in accordance with the broad principles set out in its charter. The charter details the board’s composition and responsibilities.
The board seeks to ensure that :
• at any point in time, its membership represents an appropriate balance between directors with experience and knowledge of the Group and directors with an external or fresh perspective; and
• the size of the board is conducive to effective discussion and efficient decision-making.
Directors’ independence
The board has adopted specific principles in relation to directors’ independence. These state that when determining independence, a director must be a non-executive and the board should consider whether the director:
• is a substantial shareholder of the company or an officer of, or otherwise associated directly with, a substantial shareholder of the company;
• is or has been employed in an executive capacity by the company or any other Group member within three years before commencing to serve on the board;
• within the last three years has been a principal of a material professional adviser or a material consultant to the company or any other Group member, or an employee materially associated with the service provided;
• has a material contractual relationship with the company or a controlled entity other than as a director of the Group;
• is free from any business or other relationship which could, or could reasonably be perceived to, materially interfere with the director’s independent exercise of their judgement.
Materiality for these purposes is determined on both quantitative and qualitative bases. A transaction of any amount or a relationship is deemed material if knowledge of it may impact the shareholders’ understanding of the director’s performance.
The board assesses independence each year. To enable this process, the directors must provide all information that may be relevant to the assessment.
Board members
Details of the members of the board, their experience, expertise, qualifications, term of office,
relationships affecting their independence and their independent status are set out in the directors’ report under the heading ‘’Information on directors’’. At the date of signing the directors’ report, there are three non-executive directors and two executive directors, four of whom have no relationships adversely affecting independence and so are deemed independent under the principles set out above.
• Mr Breeze has business dealings with the Group as disclosed in note 23 to the financial report.
Action taken and reasons if not adopted
For
per
sona
l use
onl
y

27MEC Resources 2012 ANNUAL REPORT
Action taken and reasons if not adopted
Principle 2: Structure the board to add value (continued)
Term of office
The company’s Constitution specifies that all non-executive directors must retire from office no later than the third annual general meeting (AGM) following their last election. Where eligible, a director may stand for re-election, subject to the following limitations:
• on attaining the age of 72 years a director will retire, by agreement, at the next AGM and will not seek re-election.
Chair and Managing Director
The Chair is responsible for leading the board, ensuring directors are properly briefed in all matters relevant to their role and responsibilities, facilitating board discussions and managing the board’s
relationship with the company’s senior executives. In accepting the position, the Chair has acknowledged that it will require a significant time commitment and has confirmed that other positions will not hinder his effective performance in the role of Chair.
The Managing Director is responsible for implementing Group strategies and policies.
Committees
The number of meetings of the company’s board of directors and of each board committee held during the year ended 30 June 2012, and the number of meetings attended by each director is disclosed on page 19.
It is the company’s practice to allow its executive directors to accept appointments outside the company. No appointments of this nature were accepted during the year ended 30 June 2012.
The Company is not of a size at the moment that justifies having a separate Nomination Committee. However, matters typically dealt with by such a committee are dealt with by the Board.
Notices of meetings for the election of directors comply with the ASX Corporate Governance Council’s best practice recommendations.
Principle 3: Promote ethical and responsible decision making
The company has developed a statement of values which has been fully endorsed by the board and applies to all directors and employees. The Statement is regularly reviewed and updated as necessary to ensure it reflects the highest standards of behaviour and professionalism and the practices necessary to maintain confidence in the Group’s integrity and to take into account legal obligations and reasonable expectations of the company’s stakeholders.
The Statement requires that at all times all company personnel act with the utmost integrity, objectivity and in compliance with the letter and the spirit of the law and company policies.
The purchase and sale of company securities by directors and employees is monitored by the Board.
The company is committed to Diversity and Equal Opportunity within its workforce placing particular focus on the level of gender diversity at senior levels of the organisation. The company ensure this is achieved by :
• ensuring recruitment and selection practices enable the availability of a diverse candidate pool for appointments at senior levels; and
• ensuring remuneration practices are free from gender bias.
At conclusion of the reporting year one of MEC’s 4 directors is female.
For
per
sona
l use
onl
y

ENERGY MINERALS EXPLORATION
28 MEC Resources 2012 ANNUAL REPORT
Corporate Governance Statement
Principle 4: Safeguard integrity in financial reporting
Adopted except as follows:-
The Company does not have a separate Audit Committee. The full Board carries out the functions of an Audit Committee. The Board has the authority, within the scope of its responsibilities, to seek any information it requires from any employee or external party.
Due to the status of the Company and the relatively straight forward accounts of the Company, the Directors at the moment can see no additional benefits to be obtained by establishing such a committee.
The Board follows the Audit Committee Charter, a copy of which is available on request.
The Company is not of a size at the moment that justifies having a internal audit division.
External auditors
The Board’s policy is to appoint external auditors who clearly demonstrate quality and independence. The performance of the external auditor is reviewed annually and applications for tender of external audit services are requested as deemed appropriate, taking into consideration assessment of performance, existing value and tender costs. Deloitte was appointed as the external auditor in 2010. It is the Corporation Act’s policy to rotate audit engagement partners on listed companies at least every five years. A partner should not be re-assigned to a listed entity audit engagement if this equates to the partner serving in this role for more than 5 out of 7 successive years.
An analysis of fees paid to the external auditors, including a break-down of fees for non-audit services, is provided in the directors’ report and in note 4 to the financial statements. The external auditors provide an annual declaration of their independence to the Board.
The external auditor will attend the annual general meeting and be available to answer shareholder questions about the conduct of the audit and the preparation and content of the audit report.
Principle 5&6: Make timely and balanced disclosures and respect the rights of shareholders
Continuous disclosure and shareholder communication
The company has policies and procedures on information disclosure that focus on continuous disclosure of any information concerning the Group that a reasonable person would expect to have a material effect on the price of the company’s securities. These policies and procedures also include the arrangements the company has in place to promote communication with shareholders and encourage effective participation at general meetings.
The Company Secretary has been nominated as the person responsible for communications with the ASX. This role includes responsibility for ensuring compliance with the continuous disclosure requirements in the ASX Listing Rules and overseeing and co-ordinating information disclosure to the ASX, analysts, brokers, shareholders, the media and the public.
All information disclosed to the ASX is posted on the company’s website as soon as it is disclosed to the ASX. When analysts are briefed on aspects of the Group’s operations, the material used in the presentation is released to the ASX and posted on the company’s web site. Procedures have also been established for reviewing whether any price sensitive information has been inadvertently disclosed and, if so, this information is also immediately released to the market.
Action taken and reasons if not adopted
For
per
sona
l use
onl
y

29MEC Resources 2012 ANNUAL REPORT
Principle 5&6: Make timely and balanced disclosures and respect the rights of shareholders (continued)
All shareholders receive a copy of the company’s annual (full or concise) and half-yearly reports. In addition, the company seeks to provide opportunities for shareholders to participate through electronic means. Recent initiatives to facilitate this include making all company announcements, media briefings, details of company meetings, and financial reports available on the company’s website.
All shareholders receive a copy of the company’s annual (full or concise) and half-yearly reports. In addition, the company seeks to provide opportunities for shareholders to participate through electronic means. Recent initiatives to facilitate this include making all company announcements, media briefings, details of company meetings, and financial reports available on the company’s website.
Principle 7: Recognise and manage risk
The board and senior executives are responsible for ensuring there are adequate policies in relation to risk management, compliance and internal control systems. In summary, the company policies are designed to ensure strategic, operational, legal, reputational and financial risks are identified, assessed, effectively and efficiently managed and monitored to enable achievement of the Group’s business objectives.
Considerable importance is placed on maintaining a strong control environment. There is an organisation structure with clearly drawn lines of accountability and delegation of authority. The board actively promotes a culture of quality and integrity.
The responsibility for the operation and administration of the economic entity is delegated by the Board to the Managing Director. The Board ensures that the Managing Director is appropriately qualified and experienced to discharge his responsibilities, and has in place procedures to assess the performance for the Company’s officers, employees, contractors and consultants. The board receives monthly updates as to the effectiveness of the company’s management of material risks that may impede meeting business objectives.
The Board is responsible for ensuring that management’s objectives and activities are aligned with the expectations and risks identified by the Board. It has a number of mechanisms in place to ensure this is achieved, including the following:
• Board approval of a strategic plan, designed to meet shareholder needs and manage business risk;
• Implementation of operating plans and budgets by management and Board monitoring progress against budget;
• Procedures to allow directors, in the furtherance of their duties, to seek independent professional advice at the Company’s expense.
Control procedures cover management accounting, financial reporting, project appraisal, IT security, compliance and other risk management issues. The Managing Director is required to ensure that appropriate controls are in place to effectively manage the identified risks. This is monitored by the board on a monthly basis.
Action taken and reasons if not adopted
For
per
sona
l use
onl
y

ENERGY MINERALS EXPLORATION
30 MEC Resources 2012 ANNUAL REPORT
Corporate Governance Statement
Principle 7: Recognise and manage risk (continued)
The environment
Information on compliance with significant environmental regulations is set out in the directors’ report.
Corporate reporting
The Managing Director and CFO have made the following certifications to the board:
• that the company’s financial reports are complete and present a true and fair view, in all material respects, of the financial condition and operational results of the company and Group and are in accordance with relevant accounting standards;
• that the above statement is founded on a sound system of risk management and internal compliance and control which implements the policies adopted by the board and that the company’s risk management and internal compliance and control is operating efficiently and effectively in all material respects in relation to financial reporting risks.
Principle 8: Remunerate fairly and responsibly
The Company is not of a size at the moment that justifies having a separate Remuneration Committee. However, matters typically dealt with by such a committee are dealt with by the board.
The board makes specific recommendations on remuneration packages and other terms of employment for executive directors, other senior executives and non-executive directors.
Each member of the senior executive team signs a formal employment contract at the time of their appointment covering a range of matters including their duties, rights, responsibilities and any entitlements on termination. The standard contract refers to a specific formal job description.
Further information on directors’ and executives’ remuneration, including principles used to determine remuneration, is set out in the directors’ report under the heading ‘’Remuneration report’’. In accordance with Group policy, participants in equity-based remuneration plans are not permitted to enter into any transactions that would limit the economic risk of options or other unvested entitlements.
The board with the Managing Director also assumes responsibility for overseeing management succession planning, including the implementation of appropriate executive development programmes and ensuring adequate arrangements are in place, so that appropriate candidates are recruited for later promotion to senior positions.
Action taken and reasons if not adopted
For
per
sona
l use
onl
y

31MEC Resources 2012 ANNUAL REPORT
Statement of Comprehensive Income for the year ended 30 June 2012
Consolidated
Note2012
$2011
$
Revenue 2 376,380 670,522
Other gains and losses 2 (7,766,232) (3,175,465)
Other Income 2 5,837 13,073
Administration expenses (240,785) (396,740)
Consulting and Legal expenses (145,008) (2,400,263)
Depreciation and amortisation expense (3,755) (2,625)
Share of gains and losses in associate (33,989) (43,535)
Employee expenses 3 (791,650) (1,121,173)
Insurance expenses (48,909) (49,883)
Interest expenses (23,817) (178,801)
Data Centre administration (26,360) (21,065)
Service Fees (347,040) (347,040)
Travelling expenses (205,739) (343,297)
Other expenses (394,820) (609,245)
Operating Loss Before Income Tax (9,645,887) (8,005,537)
Income tax expense 8 - -
Operating Loss for the year (9,645,887) (8,005,537)
Other Comprehensive Income - -
Total Comprehensive income for the period (9,645,887) (8,005,537)
Loss attributable to non-controlling interest (467,162) (3,949,738)
Loss attributable to owners of the company (9,178,725) (4,055,799)
Total Comprehensive income attributable to non-controlling interest (467,162) (3,949,738)
Total Comprehensive Income attributable to the owners of the Company (9,178,725) (4,055,799)
Earnings Per Share – Basic and diluted earnings per share (cents per share) 6 (5.89) (2.79)
The accompanying notes form part of these financial statements.
For
per
sona
l use
onl
y

ENERGY MINERALS EXPLORATION
32 MEC Resources 2012 ANNUAL REPORT
Consolidated
Note2012
$2011
$
Current Assets
Cash and cash equivalents 7 7,033,662 12,415,165
Trade and other receivables 9 126,116 277,971
Financial assets 12 44,867 40,698
Other current assets 10 29,529 18,435
Total Current Assets 7,234,174 12,752,269
Non-Current Assets
Other non-current assets 10 22,673 22,673
Evaluation and exploration expenditure 11 31,694,213 29,505,867
Financial assets 12 1,000,552 477,542
Investments in associates 28 - 9,673,230
Property, plant & equipment 13 12,436 4,165
Total Non-Current Assets 32,729,874 39,683,477
Total Assets 39,964,048 52,435,746
Current Liabilities
Trade and other payables 14 2,701,145 3,972,732
Provisions 15 117,241 106,103
Financial liabilities 16 416,889 2,219,050
Total Current Liabilities 3,235,275 6,297,885
Non-Current Liabilities
Provisions 15 5,230 4,242
Total Non-Current Liabilities 5,230 4,242
Total Liabilities 3,240,505 6,302,127
Net Assets 36,723,543 46,133,619
Equity
Issued capital 17 24,922,466 24,920,661
Option Reserve 18 385,196 262,690
Accumulated losses (19,655,540) (10,476,815)
Total Equity Attributable to Owners 5,652,122 14,706,536
Non-controlling Interest 31,071,421 31,427,083
Total Equity 36,723,543 46,133,619
The accompanying notes form part of these financial statements.
Statement of Financial Position as at 30 June 2012
For
per
sona
l use
onl
y

33MEC Resources 2012 ANNUAL REPORT
Ordinary Share
Capital $
Accumu-lated losses
$
Option Reserve
$
Total attributable to owners
$
Non-controlling
Interest $
Total
$
Balance at 1 July 2010 11,808,203 (7,582,991) 293,107 4,518,319 19,393,360 23,911,679
Loss attributable to members of the consolidated entity - (4,055,799) - (4,055,799) (3,949,738) (8,005,537)
Other comprehensive income - - - - - -
Total comprehensive income - (4,055,799) - (4,055,799) (3,949,738) (8,005,537)
Transactions with owners in their capacity as owners
Shares issued during the financial year 10,984,714 - - 10,984,714 - 10,984,714
Issue of shares by subsidiary - 1,161,975 (148,123) 1,013,852 15,519,481 16,533,333
Options exercised during the financial period 2,434,744 - - 2,434,744 - 2,434,744
Options issued during the financial period - - 117,706 117,706 463,980 581,686
Capital raising costs (307,000) - - (307,000) - (307,000)
Balance at 30 June 2011 24,920,661 (10,476,815) 262,690 14,706,536 31,427,083 46,133,619
Balance at 1 July 2011 24,920,661 (10,476,815) 262,690 14,706,536 31,427,083 46,133,619
Loss attributable to members of the consolidated entity - (9,178,725) - (9,178,725) (467,162) (9,645,887)
Other comprehensive income - - - - - -
Total comprehensive income - (9,178,725) - (9,178,725) (467,162) (9,645,887)
Transactions with owners in their capacity as owners
Options exercised during the financial period 1,805 - - 1,805 - 1,805
Options issued during the financial period - - 122,506 122,506 111,500 234,006
Balance at 30 June 2012 24,922,466 (19,655,540) 385,196 5,652,122 31,071,421 36,723,543
The accompanying notes form part of these financial statements.
Statement of Changes in Equity for the year ended 30 June 2012
For
per
sona
l use
onl
y

ENERGY MINERALS EXPLORATION
34 MEC Resources 2012 ANNUAL REPORT
Cash Flow Statement for the year ended 30 June 2012
Consolidated
Note2012
$2011
$
Cash Flows From Operating Activities
Receipts from customers - 140,053
Payments to suppliers and employees (2,968,234) (5,281,619)
Interest received 382,216 672,191
Net cash used in operating activities 19 (2,586,018) (4,469,375)
Cash Flows From Investing Activities
Amounts repaid by/ (loaned to) other entities (1,946,613) 3,995,279
Receipt/(Payment) for investments 1,350,000 (6,632,135)
Payment for property, plant and equipment (12,026) (1,627)
Payment for deferred expenditure – (net of reimbursements) (2,188,346) (23,443,251)
Net cash used in investing activities (2,796,985) (26,081,734)
Cash Flows From Financing Activities
Proceeds from capital raising – (net of share issue costs) - 25,605,426
Proceeds from/(repayment of) borrowings 1,500 -
Net cash provided by financing activities 1,500 25,605,426
Net increase (decrease) in Cash Held (5,381,503) (4,945,683)
Cash At the Beginning Of The Financial Year 12,415,165 17,360,848
Cash At The End Of The Financial Year 7 7,033,662 12,415,165
The accompanying notes form part of these financial statements.
For
per
sona
l use
onl
y

35MEC Resources 2012 ANNUAL REPORT
1. Statement of Significant Accounting Policies
Corporate Information
The financial report includes the consolidated financial statements and the notes of MEC Resources Ltd and its controlled entities (‘Consolidated Group’ or ‘Group’).
MEC Resources Ltd is a public listed company on the ASX, which is incorporated and domiciled in Australia.
The financial report was authorised for issue on 30th August 2012 by the board of directors.
Basis of Preparation
The financial report is a general purpose financial report that has been prepared in accordance with Australian Accounting Standards, Australian Accounting Interpretations, other authoritative pronouncements of the Australian Accounting Standards Board (“AASB”) and the Corporations Act 2001.
Australian Accounting Standards set out accounting policies that the AASB has concluded would result in a financial report containing relevant and reliable information about transactions, events and conditions to which they apply. Compliance with Australian Accounting Standards ensures that the financial statements and notes also comply with International Financial Reporting Standards. Material accounting policies adopted in the preparation of this financial report are presented below. They have been consistently applied unless otherwise stated.
The financial report has been prepared on an accruals basis and is based on historical costs, modified, where stated below.
Compliance with IFRS
The consolidated financial statements of the MEC Resources Ltd comply with International Financial Reporting Standards (IFRS) as issued by the International Accounting Standards Board (IASB).
Accounting Policies
(a) Principles of Consolidation
A controlled entity is any entity MEC Resources Limited has the power to control the financial and operating policies of so as to obtain benefits from its activities.
A list of controlled entities is contained in Note 24 to the financial statements. All controlled entities have a June financial year-end.
As at reporting date, the assets and liabilities of all controlled entities have been incorporated into the consolidated financial statements as well as their results for the year then ended.
The results of subsidiaries acquired or disposed of during the year are included in the consolidated statement of comprehensive income from the effective date of acquisition and up to the effective date of disposal, as appropriate.
All inter-company balances and transactions between entities in the economic entity, including any unrealised profits or losses, have been eliminated on consolidation. Accounting policies of subsidiaries have been changed where necessary to ensure consistencies with those policies applied by the parent entity.
Where controlled entities have entered or left the economic entity during the year, their operating results have been included/excluded from the date control was obtained or until the date control ceased.
Notes to the Financial Statementsfor the year ended 30 June 2012
For
per
sona
l use
onl
y

ENERGY MINERALS EXPLORATION
36 MEC Resources 2012 ANNUAL REPORT
Notes to the Financial Statementsfor the year ended 30 June 2012
1. Statement of Significant Accounting Policies (continued)(a) Principles of Consolidation (continued)
Non-controlling interests in the results and equity of subsidiaries are shown separately in the statement of comprehensive income, statement of changes in equity and statement of financial position respectively.
Changes in the Group’s interests in subsidiaries that do not result in a loss of control are accounted for as equity transactions. The carrying amounts of the Group’s interests and the non-controlling interests are adjusted to reflect the changes in their relative interests in the subsidiaries. Any difference between the amount by which the non-controlling interests are adjusted and the fair value of the consideration paid or received is recognised directly in equity and attributed to owners of the Company.
When the Group loses control of a subsidiary, the profit or loss on disposal is calculated as the difference between (i) the aggregate of the fair value of the consideration received and the fair value of any retained interest and (ii) the previous carrying amount of the assets (including goodwill), and liabilities of the subsidiary and any non-controlling interests. Amounts previously recognised in other comprehensive income in relation to the subsidiary are accounted for (i.e. reclassified to profit or loss or transferred directly to retained earnings) in the same manner as would be required if the relevant assets or liabilities were disposed of. The fair value of any investment retained in the former subsidiary at the date when control is lost is regarded as the fair value on initial recognition for subsequent accounting under AASB 139 Financial Instruments: Recognition and Measurement or, when applicable, the cost on initial recognition of an investment in an associate or jointly controlled entity.
(b) Business Combinations
Business combinations occur where control over another business is obtained and results in the consolidation of its assets and liabilities. All business combinations, including those involving entities under common control, are accounted for by applying the purchase method.
The purchase method requires an acquirer of the business to be identified and for the cost of the acquisition and fair values of identifiable assets, liabilities and contingent liabilities to be determined as at acquisition date, being the date that control is obtained. Cost is determined as the aggregate of fair values of assets given, equity issued and liabilities assumed in exchange for. Any deferred consideration payable is discounted to present value using the entity’s incremental borrowing rate. Acquisition-related costs are recognised in profit or loss as incurred.
Goodwill is recognised initially at the excess of cost over the acquirer’s interest in the net fair value of the identifiable assets, liabilities and contingent liabilities recognised. If the fair value of the acquirer’s interest is greater than cost, the surplus is immediately recognised in profit or loss.
(c) Income Tax
The charge for current income tax expense is based on the profit for the year adjusted for any non-assessable or disallowed items. It is calculated using the tax rates that have been enacted or are substantially enacted by the balance sheet date. Deferred tax is accounted for using the balance sheet liability method in respect of temporary differences arising between the tax bases of assets and liabilities and their carrying amounts in the financial statements. No deferred income tax will be recognised from the initial recognition of an asset or liability, excluding a business combination, where there is no effect on accounting or taxable profit or loss.
For
per
sona
l use
onl
y

37MEC Resources 2012 ANNUAL REPORT
(c) Income Tax (continued)
Deferred tax is calculated at the tax rates that are expected to apply to the period when the asset is realised or liability is settled. Deferred tax is recognised in the statement of comprehensive income except where it relates to items that may be recognised directly to equity, in which case the deferred tax is adjusted directly against equity.
Deferred income tax assets are recognised to the extent that it is probable that future tax profits will be available against which deductible temporary differences or unused tax losses and tax credits can be utilised.
The amount of benefits brought to account or which may be realised in the future is based on the assumption that no adverse change will occur in income taxation legislation and the anticipation that the economic entity will derive sufficient future assessable income to enable the benefit to be realised and comply with the conditions of deductibility imposed by the law.
(d) Property, plant and equipment
Each class of property, plant and equipment is carried at cost or fair value less, where applicable, any accumulated depreciation and impairment losses.
Plant and equipment
Plant and equipment are measured on the cost basis.
The carrying amount of plant and equipment is reviewed annually by directors to ensure it is not in excess of the recoverable amount from these assets. The recoverable amount is assessed on the basis of the expected net cash flows that will be received from the asset’s employment and subsequent disposal. The expected net cash flows have been discounted to their present values in determining recoverable amounts.
Subsequent costs are included in the asset’s carrying amount or recognised as a separate asset, as appropriate, only when it is probable that future economic benefits associated with the item will flow to the group and the cost of the item can be measured reliably. All other repairs and maintenance are charged to the statement of comprehensive income during the financial period in which they are incurred.
Depreciation
The depreciable amount of all fixed assets including building and capitalised lease assets, but excluding freehold land, is depreciated on a straight-line basis over their useful lives to the consolidated group commencing from the time the asset is held ready for use. Leasehold improvements are depreciated over the shorter of either the unexpired period of the lease or the estimated useful lives of the improvements.
Class of Fixed Asset Depreciation RatePlant and equipment 33.33%
The assets’ residual values and useful lives are reviewed, and adjusted if appropriate, at each statement of financial position date.
An asset’s carrying amount is written down immediately to its recoverable amount if the asset’s carrying amount is greater than its estimated recoverable amount.
Gains and losses on disposals are determined by comparing proceeds with the carrying amount. These gains and losses are included in the income statement. When revalued assets are sold, amounts included in the revaluation reserve relating to that asset are transferred to retained earnings.
For
per
sona
l use
onl
y

ENERGY MINERALS EXPLORATION
38 MEC Resources 2012 ANNUAL REPORT
Notes to the Financial Statementsfor the year ended 30 June 2012
1. Statement of Significant Accounting Policies (continued)(e) Exploration and Development Expenditure
Exploration, evaluation and development expenditure incurred is accumulated in respect of each identifiable area of interest. These costs are only carried forward to the extent that they are expected to be recouped through the successful development of the area or where activities in the area have not yet reached a stage that permits reasonable assessment of the existence of economically recoverable reserves.
Accumulated costs in relation to an abandoned area are written off in full against profit in the year in which the decision to abandon the area is made.
When production commences, the accumulated costs for the relevant area of interest are amortised over the life of the area according to the rate of depletion of the economically recoverable reserves.
A regular review is undertaken of each area of interest to determine the appropriateness of continuing to carry forward costs in relation to that area of interest.
Costs of site restoration are provided over the life of the facility from when exploration commences and are included in the costs of that stage. Site restoration costs include the dismantling and removal of mining plant, equipment and building structures, waste removal, and rehabilitation of the site in accordance with clauses of the mining permits. Such costs have been determined using estimates of future costs, current legal requirements and technology.
Any changes in the estimates for the costs are accounted on a prospective basis. In determining the costs of site restoration, there is uncertainty regarding the nature and extent of the restoration due to community expectations and future legislation. Accordingly the costs have been determined on the basis that the restoration will be completed within one year of abandoning the site.
(f) Financial Instruments
Recognition and Initial Measurement
Financial instruments, incorporating financial assets and financial liabilities, are recognised when the entity becomes a party to the contractual provisions of the instrument. Trade date accounting is adopted for financial assets that are delivered within timeframes established by marketplace convention.
Financial instruments are initially measured at fair value plus transactions costs where the instrument is not classified as at fair value through profit or loss. Transaction costs related to instruments classified as at fair value through profit or loss are expensed to profit and loss immediately. Financial instruments are classified and measured as set out below.
Derecognition
Financial assets are derecognised where the contractual rights to receipt of cash flows expires or the asset is transferred to another party whereby the entity is no longer has any significant continuing involvement in the risks and benefits associated with the asset. Financial liabilities are derecognised where the related obligations are either discharged, cancelled or expire. The difference between the carrying value of the financial liability extinguished or transferred to another party and the fair value of consideration paid, including the transfer of non-cash assets or liabilities assumed, is recognised in profit and loss.
For
per
sona
l use
onl
y

39MEC Resources 2012 ANNUAL REPORT
(f) Financial Instruments (continued)
Classification and Subsequent Measurement
(i) Financial assets at fair value through profit or loss
Financial assets are classified at fair value through profit and loss when they are held for trading for the purpose of short term profit taking, where they are derivatives not held for hedging purposes, or designated as such to avoid an accounting mismatch or to enable performance evaluation where a group of financial assets is managed by key management personnel on a fair value basis in accordance with a documented risk management or investment strategy. Realised and unrealised gains and losses arising from changes in fair value are included in the profit and loss in the period in which they arise.
(ii) Loans and receivables
Loans and receivables are non-derivative financial assets with fixed or determinable payments that are not quoted in an active market and are subsequently measured at amortised cost using the effective interest rate method.
(iii) Held-to-maturity investments
Held-to-maturity investments are non-derivative financial assets that have fixed maturities and fixed or determinable payments, and it is the group’s intention to hold these investments to maturity. They are subsequently measured at amortised cost using the effective interest rate method.
(iv) Available-for-sale financial assets
Available-for-sale financial assets are non-derivative financial assets that are either designated as such or that are not classified in any of the other categories.
The Group also has investments in unlisted shares that are not traded in an active market but that are also classified as AFS financial assets and stated at fair value (because the directors consider that fair value can be reliably measured). Gains and losses arising from changes in fair value are recognised in other comprehensive income and accumulated in the investments revaluation reserve, with the exception of impairment losses, interest calculated using the effective interest method, and foreign exchange gains and losses on monetary assets, which are recognised in profit or loss.
(v) Financial Liabilities
Non-derivative financial liabilities (excluding financial guarantees) are subsequently measured at amortised cost using the effective interest rate method.
Fair value
Fair value is determined based on current bid prices for all quoted investments. Valuation techniques are applied to determine the fair value for all unlisted securities, including recent arm’s length transactions, reference to similar instruments and option pricing models.
Impairment
At each reporting date, the group assesses whether there is objective evidence that a financial instrument has been impaired. In the case of available-for-sale financial instruments, a significant or prolonged decline in the value of the instrument is considered to determine whether an impairment has arisen. Impairment losses are recognised in the statement of comprehensive income .
For
per
sona
l use
onl
y

ENERGY MINERALS EXPLORATION
40 MEC Resources 2012 ANNUAL REPORT
1. Statement of Significant Accounting Policies (continued)(g) Derivatives
Derivatives are initially recognised at fair value at the date the derivative contract is entered into and are subsequently remeasured to their fair value at the end of each reporting period. The resulting gain or loss is recognised in the statement of comprehensive income immediately unless the derivative is designated and effective as a hedging instrument, in which event the timing of the recognition in the statement of comprehensive income depends on the nature of the hedge relationship.
A derivative with a positive fair value is recognised as a financial asset; a derivative with a negative fair value is recognised as a financial liability. A derivative is presented as a non-current asset or a non-current liability if the remaining maturity of the instrument is more than 12 months and it is not expected to be realised or settled within 12 months. Other derivatives are presented as current assets or current liabilities
(h) Impairment of Assets
At each reporting date, the group reviews the carrying values of its tangible and intangible assets to determine whether there is any indication that those assets have been impaired. If such an indication exists, the recoverable amount of the asset, being the higher of the asset’s fair value less costs to sell and value in use, is compared to the asset’s carrying value. Any excess of the asset’s carrying value over its recoverable amount is expensed to the statement of comprehensive income.
Impairment testing is performed annually for goodwill and intangible assets with indefinite lives.
Where it is not possible to estimate the recoverable amount of an individual asset, the group estimates the recoverable amount of the cash-generating unit to which the asset belongs.
(i) Cash and Cash Equivalents
Cash and cash equivalents include cash on hand, deposits held at call with banks, other short-term highly liquid investments, and bank overdrafts. Bank overdrafts are shown within short-term borrowings in current liabilities on the statement of financial position.
(j) Revenue
Revenue from the sale of goods is recognised upon the delivery of goods to customers.
Interest revenue is recognised when it is probable that the economic benefits will flow to the Group and the amount of revenue can be measured reliably. Interest revenue is accrued on a time basis, by reference to the principal outstanding and at the effective interest rate applicable.
Dividend revenue is recognised when the right to receive a dividend has been established. Dividends received from associates and joint venture entities are accounted for in accordance with the equity method of accounting.
Revenue from the rendering of a service is recognised by reference to the stage of completion of the contract.
All revenue is stated net of the amount of goods and services tax (GST).
Notes to the Financial Statementsfor the year ended 30 June 2012
For
per
sona
l use
onl
y

41MEC Resources 2012 ANNUAL REPORT
(k) Goods and Services Tax (GST)
Revenues, expenses and assets are recognised net of the amount of GST, except where the amount of GST incurred is not recoverable from the Australian Tax Office. In these circumstances the GST is recognised as part of the cost of acquisition of the asset or as part of an item of the expense.
Receivables and payables in the statement of financial position are shown inclusive of GST.
Cash flows are presented in the cash flow statement on a gross basis, except for the GST component of investing and financing activities, which are disclosed as operating cash flows.
(l) Trade and other payables
Liabilities are recognized for amounts to be paid in the future for goods or services received, whether or not billed to the consolidated entity. The amounts are unsecured and are usually paid within 30 days.
(m) Share based payments
Share based compensation benefits are provided to employees via the Company’s Employee Option plan.
The fair value of options granted under the Company’s Employee Option Plan is recognized as an employee benefit expense with a corresponding increase in equity. The fair value is measured at grant date and recognized over the period during which the employees become unconditionally entitled to the options.
The fair value at grant date is independently determined using a Black and Scholes option pricing model that takes into account the exercise price, the term of the option, the vesting and performance criteria, the impact of dilution, the non-tradeable nature of the option, the share price at grant date and expected volatility of the underlying share, the expected dividend yield and risk free interest rate for the term of the option.
The fair value of the options granted excludes the impact of any non-market vesting conditions (for example, profitability and sales growth targets). Non-market vesting conditions are included in assumptions about the number of options that are expected to vest. At each balance sheet date, the entity revises its estimate of the number of options that are expected to vest. The employee benefit expense recognised each period takes into account the most recent estimate. Upon the exercise of options, the balance of the share-based payments reserve relating to those options is transferred to share capital.
(n) Earnings per share
Basic earnings per share (EPS) is calculated as net profit/loss attributable to members, adjusted to exclude costs of servicing equity (other than dividends) and preference share dividends, divided by the weighted average number of ordinary shares, adjusted for any bonus element.
Diluted earnings per share adjusts the figures used in the determination of basic earnings per share to take into account the after income tax effect of interest and other financing costs associated with dilutive potential ordinary shares, and the weighted average number of additional ordinary shares that would have been outstanding assuming the conversion of all dilutive potential ordinary shares.
For
per
sona
l use
onl
y

ENERGY MINERALS EXPLORATION
42 MEC Resources 2012 ANNUAL REPORT
1. Statement of Significant Accounting Policies (continued)(o) Foreign Currency
The individual financial statements of each group entity are presented in the currency of the primary economic environment in which the entity operates (its functional currency). For the purpose of the consolidated financial statements, the results and financial position of each group entity are expressed in Australian dollars (‘$’), which is the functional currency of the Company and the presentation currency for the consolidated financial statements.
In preparing the financial statements of the individual entities, transactions in currencies other than the entity’s functional currency (foreign currencies) are recognised at the rates of exchange prevailing at the dates of the transactions. At the end of each reporting period, monetary items denominated in foreign currencies are retranslated at the rates prevailing at that date. Non-monetary items carried at fair value that are denominated in foreign currencies are retranslated at the rates prevailing at the date when the fair value was determined. Non-monetary items that are measured in terms of historical cost in a foreign currency are not retranslated.
Exchange differences are recognised in profit or loss in the period in which they arise.
(p) Comparative Figures
When required by Accounting Standards, comparative figures have been adjusted to conform to changes in presentation for the current financial year.
Critical Accounting Estimates and Judgements
The directors evaluate estimates and judgments incorporated into the financial report based on historical knowledge and best available current information. Estimates assume a reasonable expectation of future events and are based on current trends and economic data, obtained both externally and within the group.
(q) Employee Benefits
Provision is made for the company’s liability for employee benefits arising from services rendered by employees to statement of financial position. Employee benefits that are expected to be settled within one year have been measured at the amounts expected to be paid when the liability is settled, plus related on-costs. Employee benefits payable later than one year have been measured at the present value of the estimated future cash outflows to be made for those benefits.
Critical Accounting Estimates and Judgements
Key Judgments —Impairment of capitalised and carried forward exploration expenditure
Exploration and evaluation costs are carried forward where right of tenure of the area of interest is current. These costs are carried forward in respect of an area that has not at statement of financial position date reached a stage that permits reasonable assessment of the existence of economically recoverable reserves, refer to the accounting policy stated in note 1(e).
Key Judgments —Impairment of financial assets
No impairment has been recognised in respect of the Company’s carrying value of its investments in its subsidiaries Advent Energy Ltd and Asset Energy Pty Ltd. After a review of the carrying values, the directors believe that the full amount of these investments is recoverable through the projected activities of each entity and no provision for impairment has been made as at 30 June 2012.
Notes to the Financial Statementsfor the year ended 30 June 2012
For
per
sona
l use
onl
y

43MEC Resources 2012 ANNUAL REPORT
Consolidated
2012 $
2011 $
2. Revenue
Revenue
Interest revenue: other entities 376,380 540,522
Consulting income - 130,000
Total revenue 376,380 670,522
Other Income and gains and losses
Net gain/loss on financial assets designated as fair value through profit and loss 63,293 (96,303)
Losses on disposal of associate (7,829,525) -
Net Fair Value losses on Foreign currency derivative - (1,299,363)
Net foreign exchange gains/losses - (1,779,799)
(7,766,232) (3,175,465)
Other income 5,837 13,073
(7,760,395) 3,162,392
3. Loss For The Year
Expenses
Employee Expenses
Salary 522,386 507,698
Superannuation expense 22,828 20,954
Share-based payments 234,310 588,716
Other payroll expenses 12,126 3,805
791,650 1,121,173
4. Auditors’ Remuneration
Remuneration of the auditor of the parent entity for:
Deloitte Touche Tohmatsu 50,619 37,368
Remuneration of other auditors of subsidiaries for:
- auditing or reviewing the financial report of subsidiaries
Deloitte Touche Tohmatsu 7,700 7,500
58,319 44,868
For
per
sona
l use
onl
y
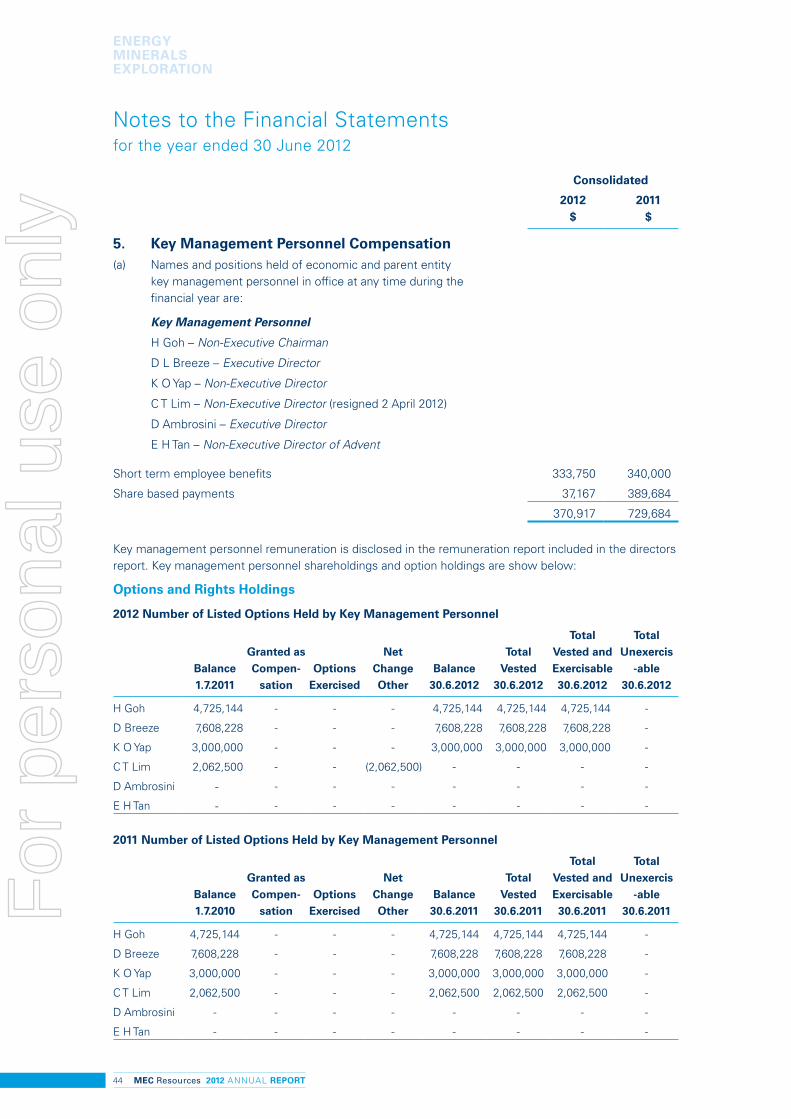
ENERGY MINERALS EXPLORATION
44 MEC Resources 2012 ANNUAL REPORT
Consolidated
2012 $
2011 $
5. Key Management Personnel Compensation (a) Names and positions held of economic and parent entity
key management personnel in office at any time during the financial year are:
Key Management Personnel
H Goh – Non-Executive Chairman
D L Breeze – Executive Director
K O Yap – Non-Executive Director
C T Lim – Non-Executive Director (resigned 2 April 2012)
D Ambrosini – Executive Director
E H Tan – Non-Executive Director of Advent
Short term employee benefits 333,750 340,000
Share based payments 37,167 389,684
370,917 729,684
Key management personnel remuneration is disclosed in the remuneration report included in the directors report. Key management personnel shareholdings and option holdings are show below:
Options and Rights Holdings
2012 Number of Listed Options Held by Key Management Personnel
Balance 1.7.2011
Granted as Compen-
sationOptions
Exercised
Net Change Other
Balance 30.6.2012
Total Vested
30.6.2012
Total Vested and Exercisable 30.6.2012
Total Unexercis
-able 30.6.2012
H Goh 4,725,144 - - - 4,725,144 4,725,144 4,725,144 -
D Breeze 7,608,228 - - - 7,608,228 7,608,228 7,608,228 -
K O Yap 3,000,000 - - - 3,000,000 3,000,000 3,000,000 -
C T Lim 2,062,500 - - (2,062,500) - - - -
D Ambrosini - - - - - - - -
E H Tan - - - - - - - -
2011 Number of Listed Options Held by Key Management Personnel
Balance 1.7.2010
Granted as Compen-
sationOptions
Exercised
Net Change Other
Balance 30.6.2011
Total Vested
30.6.2011
Total Vested and Exercisable 30.6.2011
Total Unexercis
-able 30.6.2011
H Goh 4,725,144 - - - 4,725,144 4,725,144 4,725,144 -
D Breeze 7,608,228 - - - 7,608,228 7,608,228 7,608,228 -
K O Yap 3,000,000 - - - 3,000,000 3,000,000 3,000,000 -
C T Lim 2,062,500 - - - 2,062,500 2,062,500 2,062,500 -
D Ambrosini - - - - - - - -
E H Tan - - - - - - - -
Notes to the Financial Statementsfor the year ended 30 June 2012
For
per
sona
l use
onl
y

45MEC Resources 2012 ANNUAL REPORT
2012 Number of Unlisted Options Held by Key Management Personnel
MEC Resources Ltd
Balance 1.7.2011
Granted as
Compen-sation
Options Exercised
Net Change Other
Balance 30.6.2012
Total Vested
30.6.2012
Total Vested and Exercisable 30.6.2012
Total Unexercis-
able 30.6.2012
H Goh - - - - - - - -
D Breeze - - - - - - - -
K O Yap - - - - - - - -
C T Lim - - - - - - - -
D Ambrosini 800,000 - - - 800,000 800,000 800,000 -
E H Tan - - - - - - - -
2011 Number of Unlisted Options Held by Key Management Personnel
MEC Resources Ltd
Balance 1.7.2010
Granted as
Compen-sation
Options Exercised
Net Change Other
Balance 30.6.2011
Total Vested
30.6.2011
Total Vested and Exercisable 30.6.2011
Total Unexercis-
able 30.6.2011
H Goh - - - - - - - -
D Breeze 3,000,000 - (3,000,000) - - - - -
K O Yap - - - - - - - -
C T Lim - - - - - - - -
D Ambrosini 800,000 - - - 800,000 800,000 800,000 -
E H Tan - - - - - - - -
2012 Number of Unlisted Options Held by Key Management Personnel
Advent Energy Ltd
Balance 1.7.2011
Granted as Compen-
sationOptions
Exercised
Net Change Other
Balance 30.6.2012
Total Vested
30.6.2012
Total Vested and Exercisable 30.6.2012
Total Unexercis-
able 30.6.2012
H Goh - - - - - - - -
S K Yap - - - - - - - -
D Breeze 4,000,000 - - - 4,000,000 4,000,000 4,000,000 -
K O Yap - - - - - - - -
C T Lim - - - - - - - -
D Ambrosini 500,000 - - - 500,000 - - 500,000
E H Tan - - - - - - - -For
per
sona
l use
onl
y

ENERGY MINERALS EXPLORATION
46 MEC Resources 2012 ANNUAL REPORT
Notes to the Financial Statementsfor the year ended 30 June 2012
5. Key Management Personnel Compensation (continued)
2011 Number of Unlisted Options Held by Key Management Personnel
Advent Energy Ltd
Balance 1.7.2010
Granted as Compen-
sationOptions
Exercised
Net Change Other
Balance 30.6.2011
Total Vested
30.6.2011
Total Vested and Exercisable 30.6.2011
Total Unexercis-
able 30.6.2011
H Goh - - - - - - - -
S K Yap - - - - - - - -
D Breeze 2,000,000 2,000,000 - - 4,000,000 4,000,000 4,000,000 -
K O Yap - - - - - - - -
C T Lim - - - - - - - -
D Ambrosini - 500,000 - - 500,000 - - 500,000
E H Tan - - - - - - - -
Shareholdings - MEC Resources
Number of Shares Held by Key Management Personnel
2012
Balance 1.7.2011
Received as Compensation
Options Exercised
Net Change Other
Balance 30.6.2012
H Goh 5,085,498 - - - 5,085,498
D L Breeze 13,183,654 - - - 13,183,654
K O Yap 4,039,350 - - - 4,039,350
C T Lim 3,434,350 - - (3,434,350) -
D Ambrosini - - - - -
E H Tan - - - - -
2011
Balance 1.7.2010
Received as Compensation
Options Exercised
Net Change Other
Balance 30.6.2011
H Goh 5,135,498 - - (50,000) 5,085,498
D L Breeze 10,183,654 - 3,000,000 - 13,183,654
K O Yap 4,039,350 - - - 4,039,350
C T Lim 3,434,350 - - - 3,434,350
D Ambrosini - - - - -
E H Tan - - - - -
For
per
sona
l use
onl
y

47MEC Resources 2012 ANNUAL REPORT
Shareholdings - Advent Energy
Number of Shares Held by Key Management Personnel
2012
Balance 1.7.2011
Received as Compensation
Options Exercised
Net Change Other
Balance 30.6.2012
H Goh 3,000,000 - - - 3,000,000
D L Breeze - - - - -
K O Yap - - - - -
C T Lim - - - - -
D Ambrosini - - - - -
E H Tan 2,000,000 - - - 2,000,000
2011
Balance 1.7.2010
Received as Compensation
Options Exercised
Net Change Other
Balance 30.6.2011
H Goh 3,000,000 - - - 3,000,000
D L Breeze - - - - -
K O Yap - - - - -
C T Lim - - - - -
D Ambrosini - - - - -
E H Tan 2,000,000 - - - 2,000,000
6. Earnings per share Consolidated
2012 $
2011 $
(a) Reconciliation of Earnings to Profit or Loss
Net loss attributable to members of the parent (9,178,725) (4,055,799)
Earnings used to calculate basic and diluted EPS (9,178,725) (4,055,799)
(b) Weighted average number of ordinary shares outstanding during the year used in calculating basic and diluted EPS 155,812,574 145,417,709
The Company’s potential ordinary shares, being its options granted, are not considered dilutive as the conversion of these options will result in a decreased net loss per share.
7. Cash and cash equivalents
Cash at bank and in hand 7,033,662 12,415,165
Reconciliation of cash
Cash at the end of the financial year as shown in the statement of cash flows is reconciled to items in the statement of financial position as follows:
Cash and cash equivalents 7,033,662 12,415,165
For
per
sona
l use
onl
y

ENERGY MINERALS EXPLORATION
48 MEC Resources 2012 ANNUAL REPORT
Notes to the Financial Statementsfor the year ended 30 June 2012
Consolidated
2012 $
2011 $
8. Income Tax Expense(a) The components of tax expense comprise:
Current tax - -
Deferred tax - -
The expense for the year can be reconciled to accounting loss as follows:
Loss from continuing operations (9,645,887) (8,005,537)
Prima facie tax payable on profit from ordinary activities before income tax at 30% (2011: 30%) (2,893,766) (2,401,661)
Non deductible expenses 2,369,010 59,153
Difference in tax rates of parent which is taxed at 25% (due to pooled development fund status) 37,672 40,789
Unused tax losses not recognised as deferred tax assets 487,084 2,301,719
- -
Weighted average rate of tax -% -%
(b) The following deferred tax balances at 30% (2011: 30%) have not been recognised
Deferred Tax Assets:
Temporary differences 125,475 313,944
Carry forward revenue losses 13,760,781 12,811,569
The tax benefits of the above Deferred Tax Assets will only be obtained if:
(i) company derives future assessable income in a nature and of an amount sufficient to enable the benefits to be utilised;
(ii) the company continues to comply with the conditions for deductibility imposed by law; and
(iii) no changes in income tax legislation adversely affect the company in utilising the benefits.
(c) Unrecognised deferred liabilities
Fair value movement in investments 131,981 123,586
Exploration Expenditure 9,812,251 8,858,474
The above Deferred Tax Liabilities have not been recognised as they have given rise to the carry forward revenue losses for which the Deferred Tax Asset has not been recognised.
For
per
sona
l use
onl
y

49MEC Resources 2012 ANNUAL REPORT
Consolidated
2012 $
2011 $
9. Trade and other receivables
Current
Trade receivables 105,007 105,007
Net GST receivables 21,109 172,964
126,116 277,971
Ageing of past due but not impaired
60-90 days - -
90-120 days - -
120 days and over 105,007 105,007
Total 105,007 105,007
10. Other Assets
Current
Prepaid expenses 29,529 18,435
29,529 18,435
Non Current
Other Assets 22,673 22,673
Total Other Assets 22,673 22,673
11. Capitalised Exploration Costs
Exploration expenditure capitalised
Exploration and evaluation phases 31,694,213 29,505,867
31,694,213 29,505,867
Reconciliation of movement during the year
Opening balance at 1 July 29,505,867 5,209,226
Capitalised expenditure – EP325 4,980 4,564
Capitalised expenditure – PEP 11 920 26,320,220
Capitalised expenditure – EP 386 2,182,446 131,857
Less reimbursements – PEP 11 - (2,160,000)
Balance at 30 June 31,694,213 29,505,867
Recoverability of the carrying amount of exploration assets is dependent on the successful exploration and sale of natural gas.
Capitalised costs amounting to $2,188,346 (2011:$23,443,251) have been included in cash flows from investing activities in the statement of cashflows.
For
per
sona
l use
onl
y

ENERGY MINERALS EXPLORATION
50 MEC Resources 2012 ANNUAL REPORT
Notes to the Financial Statementsfor the year ended 30 June 2012
Consolidated
2012 $
2011 $
12. Financial Assets
Current
Loan receivable 44,867 40,698
Total 44,867 40,698
Loans receivable
Loan to Grandbridge Limited (a) 44,867 40,698
Non current
Fair Value through Profit and Loss Financial Assets
Investment in Central Petroleum Ltd 686,418 407,631
Investment in BPH Energy Limited (b) 244,223 -
Available for sale financial assets
Investment in Molecular Discovery Systems Ltd 69,911 69,911
1,000,552 477,542
(a) The loan to Grandbridge Limited is unsecured non-interest bearing and repayable on demand.
(b) During the period MEC participated in a selective share buyback with BPH Energy Limited (“BPH”). BPH agreed to buy back up to $1.35 million of the Company’s shareholding in BPH. The number of buy-back Shares was determined by dividing the total Consideration by the 5-day volume weighted average closing price of Shares prior to the date of the buy-back. A total of 48,548,387 shares was sold back to BPH on the 16 September 2011 after BPH shareholder approval was attained. As a result of this transaction BPH is no longer considered an associate of MEC and MEC now holds 8.33% of BPH. Refer to note 28 for details of the transaction.
13. Property, Plant and Equipment
Plant and Equipment:
At cost 27,907 15,882
Accumulated depreciation (15,471) (11,717)
Total Property, Plant and Equipment 12,436 4,165
Movements in the carrying amounts for each class of property, plant and equipment between the beginning and the end of the current financial year.
For
per
sona
l use
onl
y

51MEC Resources 2012 ANNUAL REPORT
Consolidated
2012 $
2011 $
Consolidated Entity:
Balance at the beginning of the year 4,165 5,163
Additions 12,026 1,627
Disposals - -
Depreciation expense (3,755) (2,625)
Carrying amount at the end of the year 12,436 4,165
14. Trade and other payables
Trade payables 2,354,764 2,998,630
Sundry payables and accrued expenses 346,381 974,102
2,701,145 3,972,232
15. Provisions
Current
Employee entitlements:
Opening balance at 1 July 24,260 20,454
Increase/Decrease in provision 11,138 3,806
Balance at 30 June 35,398 24,260
Share sale agreement
Opening balance at 1 July 81,843 81,843
Increase in provision - -
Balance at 30 June 81,843 81,843
Total Provisions 117,241 106,103
Provision for Employee Entitlements
A provision has been recognised for employee entitlements relating to annual leave and long service leave. The measurement and recognition criteria relating to employee benefits has been included in Note 1 to this report.
Provision for Share Sale Agreement
A provision has been recognised for the payment of fees to relevant parties upon the successful listing of Advent Energy Ltd.
Non Current
Employee entitlements:
Opening balance at 1 July 4,242 -
Increase/Decrease in provision 988 4,242
Balance at 30 June 5,230 4,242
For
per
sona
l use
onl
y

ENERGY MINERALS EXPLORATION
52 MEC Resources 2012 ANNUAL REPORT
Consolidated
2012 $
2011 $
16. Financial Liabilities
Loans payable
Loan from BPH Energy Limited (ii) - 1,778,801
Loan from BPH Energy Limited (i) 41,935 44,115
Loan from Grandbridge Limited (i) 373,596 394,776
Loans from other entities (i) 1,358 1,358
416,889 2,219,050
(i) Loans payable are unsecured, non-interest bearing and repayable on demand.
(ii) During the period Advent Energy repaid an amount of $1.8M in full and final settlement of its obligations under the secured loan agreement entered into with BPH on 15 June 2010.
17. Issued Capital
155,813,150 (2011: 155,803,150) fully paid ordinary shares 25,952,615 25,950,810
Less: Capital raising costs (1,030,149) (1,030,149)
Issued Capital 24,922,466 24,920,661
The Company does not have an authorized capital and issued shares have no par value. 2012 2011 2012 2011
Ordinary Shares $ $ No No
At the beginning of reporting period 24,920,661 11,808,203 155,803,150 118,149,377
Issued 14 October 2010 as part of MEC Resources entitlement issue
- 6,017,881 - 12,035,762
Placement to sophisticated investor on 8 October 2010
- 275,000 - 500,000
Payment for consultancy services - 191,833 - 488,491
Placement to sophisticated investor on 15 September 2010
- 4,500,000 - 12,857,143
Shares issued during the year on conversion of options
1,805 2,434,744 10,000 11,772,377
Capital raising costs incurred - (307,000) - -
At reporting date 24,922,466 24,920,661 155,813,150 155,803,150
Fully Paid Ordinary Share Capital
Fully paid ordinary shares carry one vote per share and carry the right to dividends.
Notes to the Financial Statementsfor the year ended 30 June 2012
For
per
sona
l use
onl
y

53MEC Resources 2012 ANNUAL REPORT
(a) Options
There were 11,995,000 unlisted employee options on issue at the end of the year: Advent Energy
Total number Exercise price Expiry date
2,000,000 $0.06 28 December 2012
2,000,000 $0.06 30 June 2013
3,500,000 $2.00 05 August 2015
7,500,000
MEC Resources
1,336,667 $0.15 01 June 2013
833,333 $0.15 06 August 2013
150,000 $1.25 05 August 2015
250,000 $1.25 06 October 2015
250,000 $1.50 06 October 2015
100,000 $1.25 04 November 2015
575,000 $0.80 21 January 2016
1,000,000 $0.35 14 July 2015
4,495,000
There were 48,954,570 listed options on issue at the end of the year: MEC Resources
Total number Exercise price Expiry date
48,954,570 $0.20 04 July 2013
48,954,570
The market price of the company’s ordinary shares at 30 June 2012 was 8.5 cents.
The holders of options do not have the right, by virtue of the option, to participate in any share issue or interest issue of any other body corporate or registered scheme.
(b) Capital risk management
The Group’s and the parent entity’s objectives when managing capital are to safeguard their ability to continue as a going concern, so that they may continue to provide returns for shareholders and benefits for other stakeholders.
The focus of the Group’s capital risk management is the current working capital position against the requirements of the Group to meet corporate overheads. The Group’s strategy is to ensure appropriate liquidity is maintained to meet anticipated operating requirements, with a view to initiating appropriate capital raisings as required. The working capital position of the Group and the parent entity at 30 June 2012 and 30 June 2011 are as follows:
Consolidated
2012 $
2011 $
Cash and cash equivalents 7,033,662 12,415,165
Trade and other receivables 126,116 277,971
Trade and other payables (2,701,145) (3,972,732)
Working capital position 4,458,633 8,720,404
For
per
sona
l use
onl
y

ENERGY MINERALS EXPLORATION
54 MEC Resources 2012 ANNUAL REPORT
Consolidated
2012 $
2011 $
18. Reserves
Options Reserve 496,696 262,690
(a) Option Reserve
The option reserve records items recognised as expenses in respect of the granting of Director and Employee share options.
Reconciliation of movement
Opening balance 262,690 293,107
Options charged during the year 234,006 117,706
Transfer to non-controlling interest (a) (111,500) (148,123)
Closing balance 385,196 262,690
(a) This relates to options issued by Advent Energy in its own right, as such transferred share based payment expense to the non-controlling interest.
19. Cash Flow Information(a) Reconciliation of Cash Flow from
Operations with Profit after income tax
Operating loss after income tax (9,645,887) (8,005,537)
Non-cash flows in profit:
Depreciation 3,755 2,625
Revaluation on investments 7,766,232 96,303
Share based payments 234,310 588,716
Net gain on FV of forward contract - 1,309,416
Share of associated loss 33,989 43,535
Interest expense - 178,801
Administration recharges 140,272 133,630
Changes in net assets and liabilities, net of effects of purchase and disposal of subsidiaries
(Increase)/decrease in trade and term receivables 151,855 128,648
(Increase)/decrease in other assets (11,094) 31,280
Increase/(decrease) in trade payables and accruals (1,271,576) 1,015,160
Increase/(decrease) in provisions 12,126 8,048
(2,586,018) (4,469,375)
Notes to the Financial Statementsfor the year ended 30 June 2012
For
per
sona
l use
onl
y

55MEC Resources 2012 ANNUAL REPORT
20. Financial Risk Management
(a) Financial Risk Management
The group’s financial instruments consist mainly of deposits with banks, short-term investments, accounts receivable and payable, and loans to and from related parties. The main purpose of non-derivative financial instruments is to raise finance for group operations policies.
i. Financial Risk Exposures and Management
The main risks the group is exposed to through its financial instruments are interest rate risk, liquidity risk, credit risk and equity price risk.
Interest rate risk
Interest rate risk is managed with a mixture of fixed and floating rate debt.
Liquidity risk
The group manages liquidity risk by monitoring forecast cash flows.
Credit risk
The maximum exposure to credit risk, excluding the value of any collateral or other security, at balance date to recognised financial assets, is the carrying amount, net of any provisions for impairment of those assets, as disclosed in the statement of financial position and notes to the financial statements.
Credit risk for derivative financial instruments arises from the potential failure by counter-parties to the contract to meet their obligations.
The economic entity does not have any material credit risk exposure to any single receivable or group of receivables under financial instruments entered into by the economic entity.
Equity Price Risk
The Group is exposed to equity price risks arising from equity investments. Equity investments are held for strategic rather than trading purposes. The Group does not actively trade these investments
Equity Price Sensitivity Analysis
The sensitivity analyses below has been determined based on the exposure to equity price risks at the end of the reporting period.
If equity prices had been 5% higher/lower:
Net loss for the year ended 30 June 2012 would decrease/increase $46,532 (2011:increase/decrease by $20,382) as a result of the changes in fair value of financial assets through the profit and loss; and
The Group’s sensitivity to equity prices has not changed significantly from the prior year.
All listed investment are to be accounted at fair value through the profit and loss in accordance with the current Risk Management Policy.
For
per
sona
l use
onl
y

ENERGY MINERALS EXPLORATION
56 MEC Resources 2012 ANNUAL REPORT
20. Financial Risk Management (continued)(b) Financial Instruments
i. Interest rate risk
The economic entity’s exposure to interest rate risk, which is the risk that a financial instrument’s value will fluctuate as a result of changes in market interest rates and the effective weighted average interest rates on classes of financial assets and financial liabilities, is as follows:
2012
Effective Average Interest Rate Payable
%
Floating Interest Rate
$
Non- Interest Bearing
$
Total $
Financial Assets
Cash and cash equivalents 3.83% 7,033,662 - 7,033,662
Trade and other receivables - - 126,116 126,116
Financial Assets -current - - 44,867 44,867
Financial Assets- non current - - 1,000,552 1,000,552
7,033,662 1,171,535 8,205,197
Financial Liabilities
Trade and sundry Payables - - 2,701,145 2,701,145
Financial liabilities - - 416,889 416,889
- 3,118,034 3,118,034
2011
Effective Average Interest Rate Payable
%
Floating Interest Rate
$
Non- Interest Bearing
$
Total $
Financial Assets
Cash and cash equivalents 4.50% 12,415,165 - 12,415,165
Trade and other receivables - - 277,971 277,971
Financial Assets -current - - 40,698 40,698
Financial Assets- non current - - 477,542 477,542
12,415,165 796,211 13,211,376
Financial Liabilities
Trade and sundry Payables - - 3,972,732 3,972,732
Financial liabilities 9.25% 1,778,801 440,249 2,219,050
1,778,801 4,412,981 6,191,782
ii. Fair Values
The fair values of:
• Term receivables are determined by discounting the cash flows, at the market interest rates of similar securities, to their present value.
• Listed investments have been valued at the quoted market bid price at balance date. For unlisted investments where there is no organised financial market, the net fair value has been based on a reasonable estimation of the underlying net assets or discounted cash flows of the investment.
• Other loans and amounts due are determined by discounting the cash flows, at market interest rates of similar borrowings to their present value.
• Other assets and liabilities approximate their carrying value.
Notes to the Financial Statementsfor the year ended 30 June 2012
For
per
sona
l use
onl
y

57MEC Resources 2012 ANNUAL REPORT
(b) Financial Instruments (continued)
No financial assets and financial liabilities are readily traded on organised markets in standardised form other than listed investments.
Aggregate fair values and carrying amounts of financial assets and financial liabilities at balance date:
2012 2011
Carrying Amount
Fair Value Carrying Amount
Fair Value
Financial Assets
Financial assets at fair value through profit or loss 930,641 930,641 407,631 407,631
Available for sale financial assets 69,911 69,911 69,911 69,911
Derivative financial assets - - - -
Loans and receivables 170,983 170,983 318,669 318,669
1,171,535 1,171,535 796,211 796,211
Financial Liabilities
Other loans and amounts due 416,889 416,889 2,219,050 2,219,050
Other liabilities 2,701,145 2,701,145 3,972,732 3,972,732
3,118,034 3,118,034 6,191,782 6,191,782
iii. Sensitivity Analysis
Interest Rate Risk
The group has performed sensitivity analysis relating to its exposure to interest rate risk at balance date. This sensitivity analysis demonstrates the effect on the current year results and equity which could result from a change in these risks
Interest Rate Sensitivity Analysis
The effect on profit and equity as a result of changes in the interest rate, with all other variables remaining constant would be as follows:
Consolidated Group
2012 2011
Change in profit
– Increase in interest rate by 1% 111,520 120,116
– Decrease in interest rate by 0.5% (55,760) (60,058)
For
per
sona
l use
onl
y
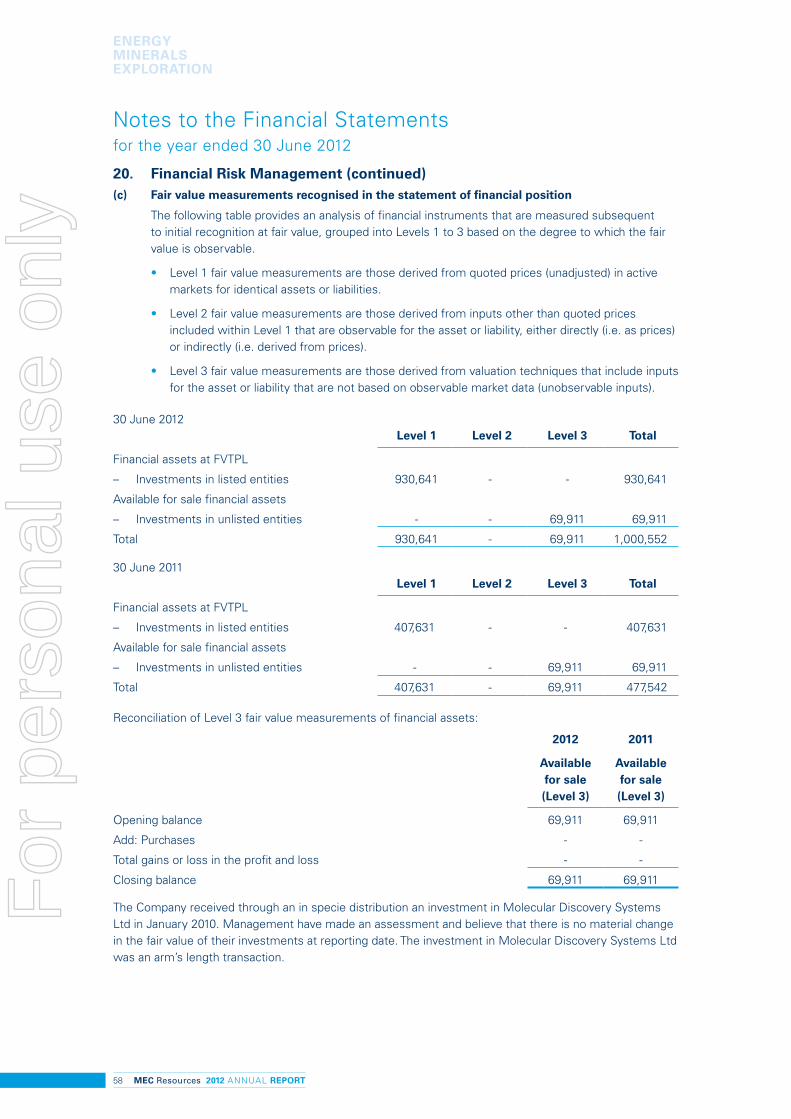
ENERGY MINERALS EXPLORATION
58 MEC Resources 2012 ANNUAL REPORT
Notes to the Financial Statementsfor the year ended 30 June 2012
20. Financial Risk Management (continued)(c) Fair value measurements recognised in the statement of financial position
The following table provides an analysis of financial instruments that are measured subsequent to initial recognition at fair value, grouped into Levels 1 to 3 based on the degree to which the fair value is observable.
• Level 1 fair value measurements are those derived from quoted prices (unadjusted) in active markets for identical assets or liabilities.
• Level 2 fair value measurements are those derived from inputs other than quoted prices included within Level 1 that are observable for the asset or liability, either directly (i.e. as prices) or indirectly (i.e. derived from prices).
• Level 3 fair value measurements are those derived from valuation techniques that include inputs for the asset or liability that are not based on observable market data (unobservable inputs).
30 June 2012Level 1 Level 2 Level 3 Total
Financial assets at FVTPL
– Investments in listed entities 930,641 - - 930,641
Available for sale financial assets
– Investments in unlisted entities - - 69,911 69,911
Total 930,641 - 69,911 1,000,552
30 June 2011Level 1 Level 2 Level 3 Total
Financial assets at FVTPL
– Investments in listed entities 407,631 - - 407,631
Available for sale financial assets
– Investments in unlisted entities - - 69,911 69,911
Total 407,631 - 69,911 477,542
Reconciliation of Level 3 fair value measurements of financial assets:
2012 2011
Available for sale (Level 3)
Available for sale (Level 3)
Opening balance 69,911 69,911
Add: Purchases - -
Total gains or loss in the profit and loss - -
Closing balance 69,911 69,911
The Company received through an in specie distribution an investment in Molecular Discovery Systems Ltd in January 2010. Management have made an assessment and believe that there is no material change in the fair value of their investments at reporting date. The investment in Molecular Discovery Systems Ltd was an arm’s length transaction.
For
per
sona
l use
onl
y

59MEC Resources 2012 ANNUAL REPORT
21. Operating Segment
Identification of reportable segments
The group has identified its operating segments based on the internal reports that are reviewed and used by the Managing Director and his management team (the chief operating decision makers) in assessing performance and in determining the allocation of resources.
The operating segments are identified by management based on their investment in exploration companies. Financial information of these investments is reported to the managing director and his management team on at least a monthly basis. Currently, management’s focus is on the exploration program of Advent Energy project’s PEP 11, EP 325 and EP 386, which is disclosed in Note 11.
The Group operates predominantly in one industry, namely investments in the mining and resources. These activities are predominantly in Australia.
Accounting policies and inter-segment transactions
The accounting policies used by the Group in reporting segments are the same as those contained in note one to the accounts and in the prior period.
22. Events after the Balance Sheet Date On 13 August 2012 Asset Energy Pty Ltd (“Asset”), a 100% owned subsidiary of Advent received notification from the National Offshore Petroleum Titles Authority that the PEP 11 permit had been renewed for a further 5 year period.
For
per
sona
l use
onl
y

ENERGY MINERALS EXPLORATION
60 MEC Resources 2012 ANNUAL REPORT
Notes to the Financial Statementsfor the year ended 30 June 2012
23. Related Party Transactions
(a) Directors’ Remuneration
Details of directors’ remuneration and retirement benefits are disclosed in the remuneration report in the Directors report and note 5.
Parent
2012 2011
$ $
(b) Directors’ Equity Holdings
Ordinary Shares
Held as at the date of this report by directors and their director-related entities in:
MEC Resources Ltd 22,308,502 25,742,852
Advent Energy Ltd 5,000,000 5,000,000
Other Equity Instruments
Listed Options
Held as at the date of this report by directors and their director-related entities in:
MEC Resources Ltd 15,333,372 17,395,872
Unlisted Options
Held as at the date of this report by key management personnel and their key management personnel-related entities in:
MEC Resources Ltd 800,000 800,000
Advent Energy Ltd 4,500,000 4,500,000
(c) Related entities
A loan facility exists between Advent and its parent entity MEC, $3,600,000 (2011: $3,600,000). The loan is secured by a second charge over all of the assets and rights of Advent Energy including but not limited to, all real and personal property, choses in action, goodwill and called but unpaid nominal and premium capital. The loan is due and payable on the earlier of a successful capital raising or the date that MEC issues a notice for repayment.
(d) Directors
The Company has an agreement with Trandcorp Pty Limited on normal commercial terms procuring the services of David Breeze to provide product development services. $65,000 (2011: $65,000) was paid during the year.
For
per
sona
l use
onl
y

61MEC Resources 2012 ANNUAL REPORT
24. Controlled Entities
Name of Entity Principal ActivityCountry of
IncorporationOwnership Interest
%
Parent Entity
MEC Resources Limited
Subsidiaries of MEC Resources Ltd
Advent Energy Limited
Asset Energy Pty Ltd
Onshore Energy Pty Ltd
Investment
Oil and Gas exploration and development
Oil and Gas exploration and development
Oil and Gas exploration and development
Australia
Australia
Australia
Australia
2012 2011
44.89 44.89
44.89 44.89
44.89 44.89
MEC owns 44.89% equity interest in Advent Energy and its subsidiaries and consequentially does not control more than half of the voting power of those shares. However, the majority of the board of MEC is on the board of Advent Energy and therefore have the ability to add and remove directors of Advent Energy and hence has control over the financial and operating policies of Advent Energy. Therefore Advent Energy is controlled by the Group and is consolidated in these financial statements.
25. Share-Based Payments The following share-based payment arrangements existed at 30 June 2012:
There were 11,995,000 unlisted employee options on issue at the end of the year:
Advent EnergyTotal number Exercise price Expiry date Grant Date
Fair Value at grant date
2,000,000 $0.06 28 December 2012 14 May 2008 $0.0319
2,000,000 $0.06 30 June 2013 01 June 2008 $0.0302
3,500,000 $2.00 05 August 2015 05 August 2010 $0.1784
7,500,000
MEC Resources
1,336,667 $0.15 01 June 2013 01 June 2008 $0.0304
833,333 $0.15 06 August 2013 06 August 2008 $0.0463
150,000 $1.25 05 August 2015 05 August 2010 $0.3032
250,000 $1.25 06 October 2015 06 October 2010 $0.3011
250,000 $1.50 06 October 2015 06 October 2010 $0.2780
100,000 $1.25 04 November 2015 04 November 2010 $0.3255
575,000 $0.80 21 January 2016 21 January 2011 $0.1000
1,000,000 $0.35 14 July 2015 14 July 2011 $0.0498
4,495,000
At balance date, 10,000 MEC share options have been exercised (2011: 8,786,668).
For
per
sona
l use
onl
y

ENERGY MINERALS EXPLORATION
62 MEC Resources 2012 ANNUAL REPORT
Notes to the Financial Statementsfor the year ended 30 June 2012
25. Share-Based Payments (continued)All options granted to key management personnel are ordinary shares in MEC Resources Ltd or its subsidiary Advent Energy Ltd, which confer a right of one ordinary share for every option held.
MEC Resources Ltd
2012 2011
Number of Options
Weighted Average Exercise
Price $
Number of Options
Weighted Average Exercise
Price $
Outstanding at the beginning of the year 3,505,000 $0.15 11,966,666 $0.15
Granted 1,000,000 $0.35 500,000 $1.25
Granted - - 250,000 $1.50
Granted - - 575,000 $0.80
Exercised (10,000) $0.15 (786,666) $0.15
Exercised - - (8,000,000) $0.21
Expired - - (1,000,000) $0.20
Outstanding at year-end 4,495,000 $0.48 3,505,000 $0.51
Exercisable at year-end 3,111,667 $0.45 2,929,999 $0.45
Advent Energy Limited
2012 2011
Number of Options
Weighted Average Exercise
Price $
Number of Options
Weighted Average Exercise
Price $
Outstanding at the beginning of the year 7,500,000 0.97 5,500,000 0.06
Granted - - 3,500,000 2.00
Exercised - - - -
Expired - - (1,500,000) 0.06
Outstanding at year-end 7,500,000 0.97 7,500,000 0.97
Exercisable at year-end 6,000,000 0.71 6,000,000 0.71
The weighted average fair value of the options granted during the year was $49,800.
This price was calculated by using a Black-Scholes option pricing model applying the following inputs:
Exercise price $0.35
Life of the option 4 years
Underlying share price $0.19
Expected share price volatility 50%
Dividends 0%
Risk free interest rate 5.00%
The life of the options is based on the historical exercise patterns, which may not eventuate in the future.Included under employee benefits expense in the statement of comprehensive income is $234,310 (2011: $588,716), and relates, in full, to equity.
For
per
sona
l use
onl
y

63MEC Resources 2012 ANNUAL REPORT
26. Contingent Liabilities A claim for outstanding consulting fees has been brought against Asset Energy Pty Ltd by Fugro Survey Pty Ltd (“Fugro”) in relation to the site works conducted on PEP 11. The case is currently in pre trial stages. Following a recent allegation by Fugro that RPS Energy Pty Ltd (“RPS”)authorised amendments to the contract for the site survey works, Asset has joined RPS as a third party to the proceedings. It is anticipated that the claim will be heard before the Western Australian courts early 2013.
The claim is being vigorously defended by Asset and a counterclaim for the cost of drilling the New Seaclem -1 well has been lodged.
27. Commitments
Capital Commitments
In order to maintain an interest in the exploration tenements in which the Company is involved, the Company is committed to meet the conditions under which the tenements were granted.
Capital expenditure forecasted for at the reporting date but not recognised as liabilities as follows:
Consolidated
2012 $
2011 $
Work Program Commitments – Exploration permits
Payable:
Within one year 418,979 1,000,000
Greater than one year less than five years 20,522,500 2,800,000
Total 20,941,479 3,800,000
28. Investments accounted for using the equity method
30 June 2012
$
30 June 2011
$
Shares in Associates - 9,673,230
(a) Shares in associates
Investments in associates are accounted for in the consolidated financial statements using the equity method of accounting.
Name of Entity Nature of OperationsCountry of
IncorporationOwnership Interest
%
30 June 2012
30 June 2011
BPH Energy Ltd Alternative Investment Company Australia 8.33 26.85For
per
sona
l use
onl
y

ENERGY MINERALS EXPLORATION
64 MEC Resources 2012 ANNUAL REPORT
28. Investments accounted for using the equity method (continued)During the period MEC Resources participated in a selective share buyback with BPH. BPH agreed to buy back up to $1.35 million of the Company’s shareholding in BPH. The number of buy-back shares was determined by dividing the total Consideration by the 5-day volume weighted average closing price of shares prior to the date of the buy-back. A total of 48,548,387 shares was sold back to BPH on the 16 September 2011 after BPH shareholder approval was attained. As a result of this transaction BPH is no longer considered an associate of MEC and MEC now holds 8.33% of BPH. The investment is now held as a financial asset accounted for as fair value through the profit and loss.
Reconciliation of Movement
$
Proceeds from disposal 1,350,000
Plus: fair value of investment retained 459,715
Less: Carrying amount of investment at date of disposal (9,639,240)
Loss recognised on disposal (7,829,525)
29. Parent Entity Disclosures
2012 $
2011 $
Financial Position
Assets
Current assets 7,203,869 6,453,213
Non-current assets 3,679,230 13,104,630
Total asset 10,883,099 19,557,843
Liabilities
Current liabilities 178,926 179,937
Non-current liabilities - -
Total liabilities 178,926 179,937
Equity
Issued Capital 24,922,466 24,920,661
Retained earnings (14,603,485) (5,805,445)
Reserves
Option Reserve 385,192 262,690
Total equity 10,704,173 19,377,906
Financial Performance
Profit/Loss for the year (8,798,040) (837,229)
Other comprehensive income - -
Total comprehensive income (8,798,040) (837,229)
30. Adoption of New and Revised Accounting Standards
Notes to the Financial Statementsfor the year ended 30 June 2012
For
per
sona
l use
onl
y

65MEC Resources 2012 ANNUAL REPORT
Standard / Interpretation Effective for annual reporting periods beginning on or after
Expected to be initially applied in the financial year ending
AASB 9 ‘Financial Instruments’ (December 2009), AASB 2009- 11 ‘Amendments to Australian Accounting Standards arising from AASB 9’ AASB 9 ‘Financial Instruments’ (December 2010) and AASB 2010-7 ‘Amendments to Australian Accounting Standards arising from AASB 9 (December 2010)’
1 January 2013 30 June 2014
AASB 10 ‘Consolidated Financial Statements’ 1 January 2013 30 June 2014
AASB 11 ‘Joint Arrangements’ 1 January 2013 30 June 2014
AASB 12 ‘Disclosure of Interests in Other Entities’ 1 January 2013 30 June 2014
AASB 127 ‘Separate Financial Statements’ (2011) 1 January 2013 30 June 2014
AASB 128 ‘Investments in Associates and Joint Ventures’ (2011)
1 January 2013 30 June 2014
AASB 13 ‘Fair Value Measurement’ and AASB 2011-8 ‘Amendments to Australian Accounting Standards arising from AASB 13’
1 January 2013 30 June 2014
AASB 119 ‘Employee Benefits’ (2011) and AASB 2011-10 ‘Amendments to Australian Accounting Standards arising from AASB 119 (2011)’
1 January 2013 30 June 2014
(a) Standards and Interpretations adopted in the current year
The Company has adopted all of the new and revised Standards and Interpretations issued by the Australian Accounting Standards Board that are relevant to their operations and are effective for the current financial reporting period beginning 1 July 2011.
The following new and revised Standards and Interpretations have been adopted in the current period:
• AASB 124 ‘Related Party Disclosures’ (revised December 2009) and AASB 2009-12 ‘Amendments to Australian Accounting Standards’
• AASB 2010-4 ‘Further Amendments to Australian Accounting Standards arising from the Annual Improvements Project’
• AASB 2010-5 ‘Amendments to Australian Accounting Standards’
• AASB 2010-6 ‘Amendments to Australian Accounting Standards – Disclosures on Transfers of Financial Assets’
The impact of the adoption of these Standards and Interpretation did not have a material impact on the Company.
(b) Standards and Interpretations in issue not yet adopted
At the date of authorisation of the financial statements, following Australian Accounting Standards and Interpretations have recently been issued or amended but are not yet effective and have not been adopted by the Company for the year ended 30 June 2012:
For
per
sona
l use
onl
y

ENERGY MINERALS EXPLORATION
66 MEC Resources 2012 ANNUAL REPORT
Notes to the Financial Statementsfor the year ended 30 June 2012
AASB 2010-8 ‘Amendments to Australian Accounting Standards – Deferred Tax: Recovery of Underlying Assets’
1 January 2012 30 June 2013
AASB 2011-4 ‘Amendments to Australian Accounting Standards to Remove Individual Key Management Personnel Disclosure Requirements’
1 July 2013 30 June 2014
AASB 2011-7 ‘Amendments to Australian Accounting Standards arising from the Consolidation and Joint Arrangements Standards’
1 January 2013 30 June 2014
AASB 2011-9 ‘Amendments to Australian Accounting Standards – Presentation of Items of Other Comprehensive Income’
1 July 2012 30 June 2013
AASB 2012-2 ‘Amendments to Australian Accounting Standards – Disclosures – Offsetting Financial Assets and Financial Liabilities (Amendments to AASB 7)’
1 January 2013 30 June 2014
AASB 2012-3 ‘Amendments to Australian Accounting Standards – Offsetting Financial Assets and Financial Liabilities (Amendments to AASB 132)’
1 January 2014 30 June 2015
AASB 2012-5 Amendments to Australian Accounting Standards arising from Annual Improvements 2009–2011 Cycle
1 January 2013 30 June 2014
At the date of authorisation of the financial statements the following IASB Standards and IFRIC Interpretations were also in issue but not yet effective, although Australian equivalent Standards and interpretations have not yet been issued and have not been adopted by the Company for the year ended 30 June 2012.
Standard / Interpretation Effective for annual reporting periods beginning on or after
Expected to be initially applied in the financial year ending
Mandatory Effective Date of IFRS 9 and Transition Disclosures (Amendments to IFRS 9 and IFRS 7)
1 January 2015 30 June 2016
Consolidated Financial Statements, Joint Arrangements and Disclosure of Interests in Other Entities: Transition Guidance (Amendments to IFRS 10, IFRS 11 and IFRS 12)
1 January 2013 30 June 2014
The impact of these recently issued or amended standards and interpretations have not been determined as yet by the Company.
Standard / Interpretation Effective for annual reporting periods beginning on or after
Expected to be initially applied in the financial year ending
For
per
sona
l use
onl
y

67MEC Resources 2012 ANNUAL REPORT
Directors Declaration
The directors of the company declare that:
1. the financial statements and notes, as set out on pages 31 to 66, are in accordance with the Corporations Act 2001 and:
(a) comply with Accounting Standards and the Corporations Regulations 2001; and
(b) give a true and fair view of the financial position as at 30 June 2012 and of the performance for the year ended on that date of the consolidated entity;
2. the Financial Statements and Notes comply with International Accounting Standards as disclosed in Note 1;
3. the directors have been given the declarations required by S295A of the Corporations Act 2001.
4. in the directors’ opinion there are reasonable grounds to believe that the company will be able to pay its debts as and when they become due and payable.
Signed in accordance with a resolution of the directors made pursuant to S295(5) of the Corporations Act 2001.
Director
David Breeze Executive Director
Dated this 30th Day of August 2012
For
per
sona
l use
onl
y

ENERGY MINERALS EXPLORATION
68 MEC Resources 2012 ANNUAL REPORT
Independent Auditor’s Report
Independent Auditor’s Report to the members of MEC Resources Limited
Report on the Financial Report
We have audited the accompanying financial report of MEC Resources Ltd, which comprises the statement of financial position as at 30 June 2012, the statement of comprehensive income, the statement of cash flows and the statement of changes in equity for the year ended on that date, notes comprising a summary of significant accounting policies and other explanatory information, and the directors’ declaration of the consolidated entity, comprising the company and the entities it controlled at the year’s end or from time to time during the financial year as set out on pages 31 to 67.
Directors’ Responsibility for the Financial Report
The directors of the company are responsible for the preparation of the financial report that gives a true and fair view in accordance with Australian Accounting Standards and the Corporations Act 2001 and for such internal control as the directors determine is necessary to enable the preparation of the financial report that gives a true and fair view and is free from material misstatement, whether due to fraud or error. In Note 1, the directors also state, in accordance with Accounting Standard AASB 101 Presentation of Financial Statements, that the consolidated financial statements comply with International Financial Reporting Standards.
Auditor’s Responsibility
Our responsibility is to express an opinion on the financial report based on our audit. We conducted our audit in accordance with Australian Auditing Standards. Those standards require that we comply with relevant ethical requirements relating to audit engagements and plan and perform the audit to obtain reasonable assurance whether the financial report is free from material misstatement.
An audit involves performing procedures to obtain audit evidence about the amounts and disclosures in the financial report. The procedures selected depend on the auditor’s judgement, including the assessment of the risks of material misstatement of the financial report, whether due to fraud or error. In making those risk assessments, the auditor considers internal control, relevant to the company’s preparation of the financial report that gives a true and fair view, in order to design audit procedures that are appropriate in the circumstances, but not for the purpose of expressing an opinion on the effectiveness of the company’s internal control. An audit also includes evaluating the appropriateness of accounting policies used and the reasonableness of accounting estimates made by the directors, as well as evaluating the overall presentation of the financial report.
We believe that the audit evidence we have obtained is sufficient and appropriate to provide a basis for our audit opinion.
Deloitte Touche TohmatsuABN 74 490 121 060
Woodside PlazaLevel 14240 St Georges TerracePerth WA 6000GPO Box A46Perth WA 6837 Australia
DX: 206Tel: +61 (8) 9365 7000Fax: +61 (8) 9365 7001www.deloitte.com.au
Liability limited by a scheme approved under Professional Standards Legislation.
Member of Deloitte Touche Tohmatsu
For
per
sona
l use
onl
y

69MEC Resources 2012 ANNUAL REPORT
Auditor’s Independence Declaration
In conducting our audit, we have complied with the independence requirements of the Corporations Act 2001. We confirm that the independence declaration required by the Corporations Act 2001, which has been given to the directors of MEC Resources Ltd, would be in the same terms if given to the directors as at the time of this auditor’s report.
Opinion
In our opinion:
(a) the financial report of MEC Resources Ltd is in accordance with the Corporations Act 2001, including:
(i) giving a true and fair view of the consolidated entity’s financial position as at 30 June 2012 and of its performance for the year ended on that date; and
(ii) complying with Australian Accounting Standards and the Corporations Regulations 2001; and
(b) the consolidated financial statements also comply with International Financial Reporting Standards as disclosed in Note 1.
Report on the Remuneration Report
We have audited the Remuneration Report included in pages 15 to 18 of the directors’ report for the year ended 30 June 2012. The directors of the company are responsible for the preparation and presentation of the Remuneration Report in accordance with section 300A of the Corporations Act 2001. Our responsibility is to express an opinion on the Remuneration Report, based on our audit conducted in accordance with Australian Auditing Standards.
Opinion
In our opinion the Remuneration Report of MEC Resources Ltd for the year ended 30 June 2012, complies with section 300A of the Corporations Act 2001.
DELOITTE TOUCHE TOHMATSU
Chris NicoloffPartner
Chartered AccountantsPerth, 30 August 201F
or p
erso
nal u
se o
nly

ENERGY MINERALS EXPLORATION
70 MEC Resources 2012 ANNUAL REPORT
Additional Securities Exchange Information
Additional information required by Australian Securities Exchange Limited and not shown elsewhere in this report as follows. The information is made up to 14th August 2012.
1. Substantial ShareholderThe name of the substantial shareholder listed in the company’s register is:
Shareholder Shares %
David Breeze 13,183,654 8.46
2. Distribution of Shareholders
Range of Holding Shareholders Number Ordinary Shares
%
1 – 1,000 498 224,062 0.14
1,001 – 5,000 566 1,718,662 1.10
5,001 – 10,000 590 5,173,508 3.32
10,001 – 100,000 1362 47,029,571 30.18
100,001 and over 228 101,667,347 65.26
3244 155,813,150 100.00
3. (a) Distribution of Listed Optionholders
Range of Holding Optionholders Number Ordinary Shares
%
1 – 1,000 23 11,520 0.02
1,001 – 5,000 39 100,880 0.21
5,001 – 10,000 34 258,846 0.53
10,001 – 100,000 303 11,323,358 23.13
100,001 and over 64 37,259,966 76.11
463 48,954,570 100.00
3. (b) Distribution of Unlisted Optionholders
Range of Holding Optionholders Number of Options
%
MEC Resources
10,001 to 100,000 5 445,000 0.1
100,001 and over 7 4,050,000 99.9
12 4,495,000 100.00
Range of Holding Optionholders Number of Options
%
Advent Energy
100,001 and over 4 7,500,000 100.00
4 7,500,000 100.00
For
per
sona
l use
onl
y

71MEC Resources 2012 ANNUAL REPORT
4. Voting Rights - SharesAll ordinary shares issued by MEC Resources Ltd carry one vote per share without restriction.
5. Voting Rights - OptionsThe holders of employee options do not have the right to vote.
6. Restricted SecuritiesShares - Number of Shares free of escrow 155,813,150
Total Shares 155,813,150
OptionsNumber of Employee options not subject to 48,954,570Escrow (Listed)
Number of Employee options not subject to 3,111,667 Escrow (Not Listed)
Total Options 52,066,237
7. Tenements and Interests Held
Permit Details Interest Held Entity
Petroleum Exploration Permit 386 100% Advent Energy
Petroleum Exploration Permit 11 85% Advent Energy
Petroleum Exploration Permit 325 8.3% Advent Energy
Retention Lease 1 100% Advent Energy
For
per
sona
l use
onl
y

ENERGY MINERALS EXPLORATION
72 MEC Resources 2012 ANNUAL REPORT
Additional Securities Exchange Information
8. Twenty Largest Shareholders (as at 14 August 2012)The names of the twenty largest shareholders of the ordinary shares of the company are:
Name Number of ordinary fully paid shares
% held of issued ordinary capital
Grandbridge Ltd
Healy Robert Anthony
Breeze David
Citicorp Nom PL
Merrill Lynch Aust Nom PL
Trandcorp PL
Trandcorp PL
Lim Chin Tong
Pado John Thomas
Ming Ding Gui
HSBC Custody NOM Aust Ltd
Protax Nom PL
Birch Lawrence M and JF
Websdale Antony Brian
Avco PL
Edward YI Financial Services
Ware Colin Victor
Avatar Energy PL
Moore Rhonda Kate
Mathieson Catherine Anne
9,747,362
9,229,608
6,234,438
5,949,540
5,527,519
3,849,216
3,100,000
3,005,162
2,485,569
2,000,000
1,864,375
1,000,000
892,373
850,000
812,375
694,000
690,000
687,500
666,667
600,000
6.26
5.92
4.00
3.82
3.55
2.47
1.99
1.93
1.60
1.28
1.20
0.64
0.57
0.55
0.52
0.45
0.44
0.44
0.43
0.39
59,885,704 38.45
For
per
sona
l use
onl
y

9. Twenty Largest Listed Option Holders (as at 14 August 2012)The names of the twenty largest listed Option Holders of the company are:
Name Number of listed options
% held of issued ordinary capital
Grandbridge Ltd
Trandcorp PL
Merrill Lynch Aust Nom PL
Healy Robert Anthony
Citicorp Nom PL
Lim Chin Tong
Breeze David
Jacobs Corp PL
Sykes Frederick and J
David E Perks and Assoc PL
Basser Braham M and MD
Sargent Ian
Lee Patricia
Scanlon Damian
Chin Peter K and A C M
Guiterrez Joe
Coyler Simon James
O’Gorman Richard
Borthwick Bruce and SP
Fixed Interest Data PL LE
7,310,522
5,773,824
4,725,144
3,545,000
3,000,000
1,892,903
1,759,404
800,000
500,000
500,000
350,000
287,436
273,375
242,250
225,000
208,483
200,500
192,380
180,000
176,250
14.93
11.79
9.65
7.24
6.13
3.87
3.59
1.63
1.02
1.02
0.71
0.59
0.56
0.49
0.46
0.43
0.41
0.39
0.37
0.36
32,142,471 65.64
For
per
sona
l use
onl
y

14 View Street
North Perth WA 6006
Telephone: (08) 9328 8477
Facsimile: (08) 9328 8733
www.mecresources.com.au
ACN 113 900 020
desi
gned
and
pro
duce
d by
cre
8tif.
com
ENERGY MINERALS EXPLORATION
For
per
sona
l use
onl
y


