ENERGY METABOLISM. Energy Maintenance Production: growth and development Milk synthesis ...
93
ENERGY METABOLISM
-
Upload
maximillian-carroll -
Category
Documents
-
view
225 -
download
6
Transcript of ENERGY METABOLISM. Energy Maintenance Production: growth and development Milk synthesis ...
ENERGY METABOLISM

Energy Maintenance Production:
growth and developmentMilk synthesisPregnancy muscular contractions

Energy
Total Digestible Nutrient (TDN) Non-fiber carbohydrates (NFC) Non-structural carbohydrates (NSC) Digestible Energy (DE) Metabolizable Energy (ME) Net Energy (NE)

Energy Partitioning

Introduction
The capacity of a system to do workBio-energetic: transfer of energy through a
biological systemForms:KineticPotentialLight, heat, ionizing radiation, sound

Bio-energetics
Energy expenditure/timeExample: Mcal/day, Kj/day
Joule (J) kg m2/s2
mass distance timeCalorie heat produced by combustion

Bio-energetics
The heat required to increase the temperature of 1 gram H2O by 1 degree centigrade (14.5 to 15.5) when the specific heat of H2O is 4.184 J/gAccounting of enthalpies of the reactions from
changes in the bodyBased on the first law of thermodynamics ∆E = q – w where ∆E is the change in
internal energy of the system, q is amount of heat absorbed by the system, w is work done by the system
Bio-energetics
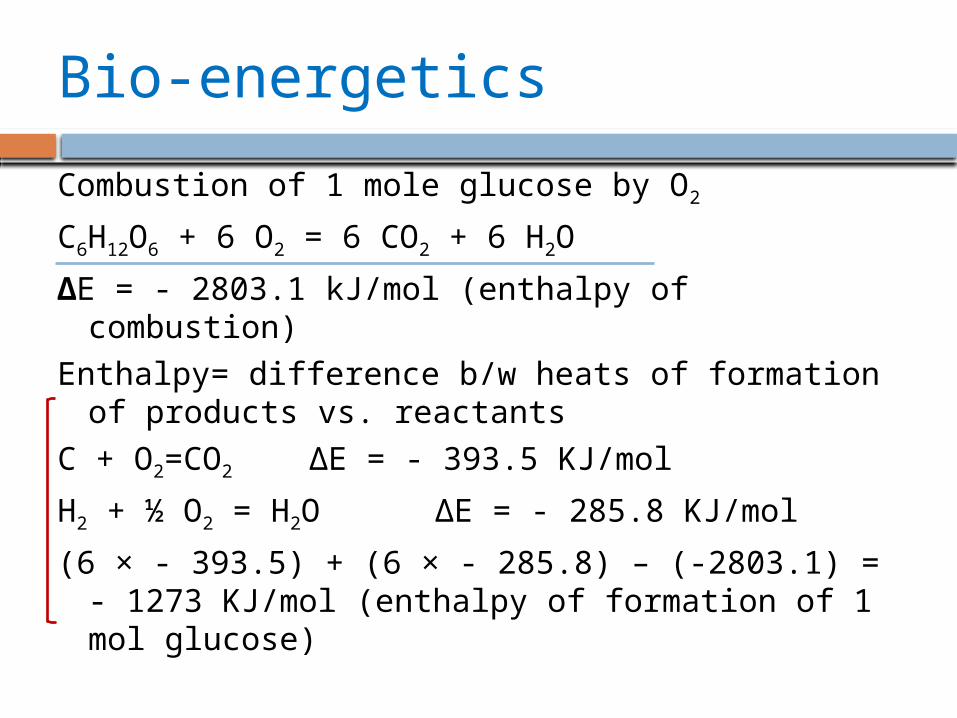
Combustion of 1 mole glucose by O2
C6H12O6 + 6 O2 = 6 CO2 + 6 H2O
∆E = - 2803.1 kJ/mol (enthalpy of combustion)
Enthalpy= difference b/w heats of formation of products vs. reactants
C + O2=CO2 ∆E = - 393.5 KJ/mol
H2 + ½ O2 = H2O ∆E = - 285.8 KJ/mol
(6 × - 393.5) + (6 × - 285.8) – (-2803.1) = - 1273 KJ/mol (enthalpy of formation of 1 mol glucose)

Conservation of mass in an experiment with a calf confined in a respiration chamber for 4 days (Blaxter, 1989)
Input Wt. (g) Output Wt. (g)
BWT 36,450 BWT 35,846
Food 12,040 Feces 272
Water 1,600 urine 10,164
Oxygen 2,480 H2O evaporate
d
3,596
CO2 2,640
CH4 14
Hair/skin 28
Total 52,570 total 52,560

Examples of Gross energy values (MJ/kg DM)

Example:Item Lactating
cowPig;
growing Percentages cow vs. pig
GE 93 Mcal/d 8,600 Kcal/d
-
Fecal energy
29 344
Urinary energy
5 160 5.4% vs. 1.86%
CH4 energy 2.8 320
Heat energy
31 3900
Milk energy 21 -

Measures
Total digestible nutrients (TDN)= digestible [CP + NFE + CF + (2.25 ×
EE)] +) ease of measurement/calculation -) underestimates high fiber feedstuffs can’t take into account all losses ~ 1 kg TDN = 4.4 Mcal DE
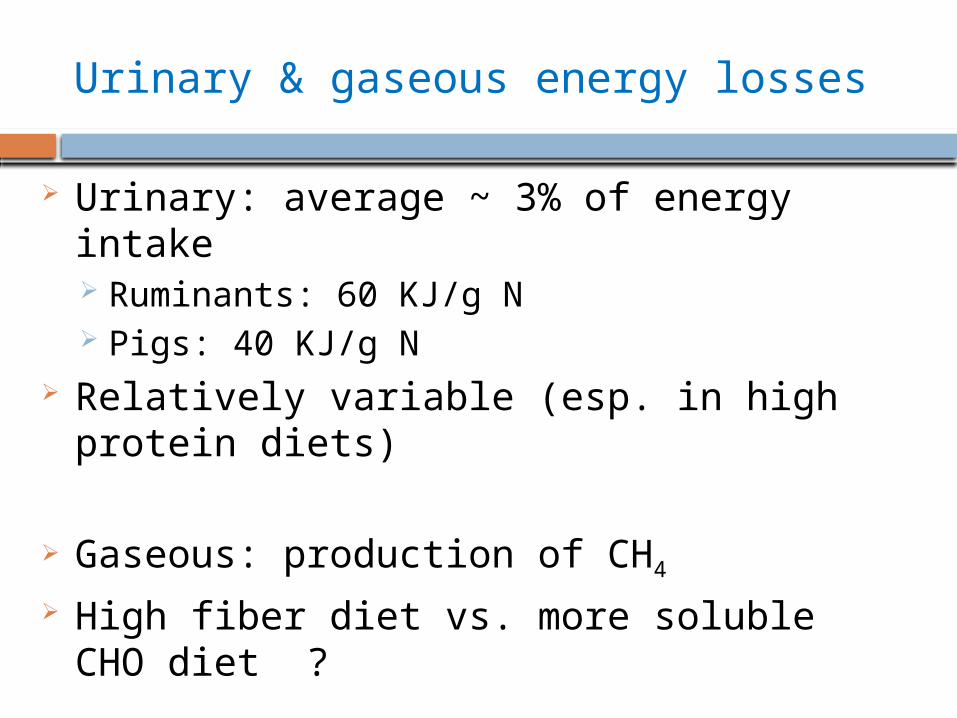
Urinary & gaseous energy losses
Urinary: average ~ 3% of energy intake Ruminants: 60 KJ/g N Pigs: 40 KJ/g N
Relatively variable (esp. in high protein diets)
Gaseous: production of CH4
High fiber diet vs. more soluble CHO diet ?

Net (retained) energy
ME minus heat production Heat of nutrient metabolism (basal metabolism) Heat of activity Heat of thermal regulation Heat increment in a thermo-neutral environment, HI
is:- heat of digestion & absorption
- heat of fermentation- heat of products formation- heat of waste formation

Basal (minimal) metabolism
Strict Definition: heat production under the following
conditions: Complete muscular repose Post-absorptive Thermo-neutral environment No stress
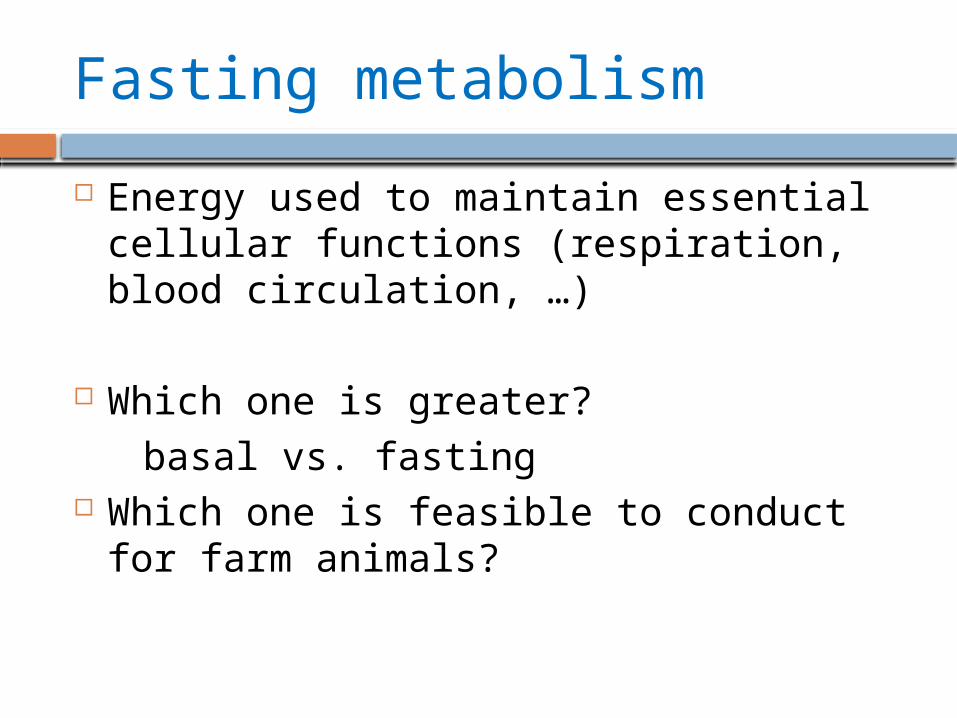
Fasting metabolism
Energy used to maintain essential cellular functions (respiration, blood circulation, …)
Which one is greater? basal vs. fasting Which one is feasible to conduct for farm
animals?

How to attain a post-absorptive state?
Species Time (hr)
Human 46
Canine 23
Pig 43
Cat 60
Mean retention time of food in gastro-intestinal tract
Measures: CO2 produced; O2consumed CO2/O2=RQ

Some historical events
Lavoisier: larger animals produced more heat than small animals
smaller animals produced more heat/unit BWT
Rubner, 1883: fasting metabolism of dogs w/ diff. sizes close to constant when expressed per unit of body surface (m2)

Some historical events
Viot, 1901:
Species
BWT, kg Kcal/m2 24hr
Horse 441 948
Pig 128 1078
Man 65 1042
Chicken
2 943
mouse 0.018 1188

Metabolic body weight
BWT 0.75
Not useful with newborn
Brody & KleiberLog equation; efficiency of food


Heat production
Calorimetry - Direct: measure of heat loss by 1)
sensible heat (radiation, conviction, conduction) and 2) evaporation heat (skin, lung)
Direct Calorimetry: heat sink calorimeter Gradient layer calorimeter

Indirect Calorimetry
Gaseous exchange O2 in CO2 out
1- whole animal-long term-respiration chamber
2- lung gaseous exchange-short term Uses mask, hood, or tracheal
cannula
Problem with mask ?

Heat of Combustion Values of the Protein and Fat in the Body and Wool of Sheep
Paladines et al., 1964a

Indirect Calorimetry
Net O2 consumption, CO2 production and heat similar over all reactions
Heat production (HP) relates to feeds or body tissues
Respiratory Quotients: CO2/O2
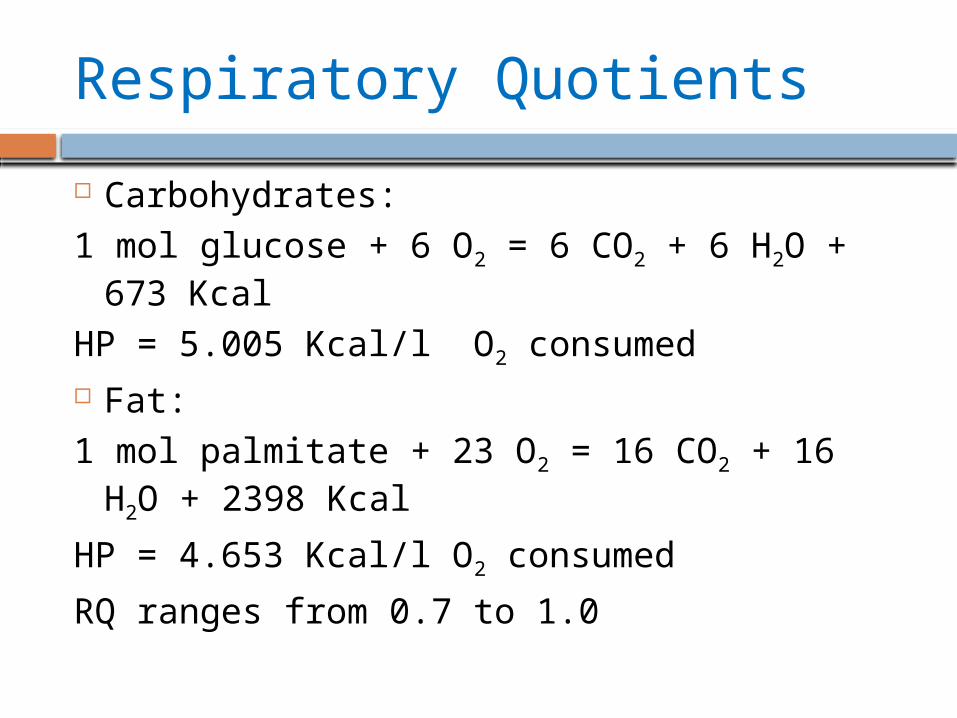
Respiratory Quotients
Carbohydrates:1 mol glucose + 6 O2 = 6 CO2 + 6 H2O + 673
KcalHP = 5.005 Kcal/l O2 consumed Fat:1 mol palmitate + 23 O2 = 16 CO2 + 16 H2O
+ 2398 KcalHP = 4.653 Kcal/l O2 consumed
RQ ranges from 0.7 to 1.0

Respiratory Quotients
Non-protein RQ RQ adjusted for the amount of protein
oxidized to urea Measure urinary N excreted: for each 1 g
of N excreted 5.9 L O2 consumed & 4.76 L CO2 + 26.51 Kcal HP
calculate proportion of fat & carbohydrate oxidized in feeds

Brouwer equation
HP = 3.866 O2 + 1.2 CO2 – 0.518 CH4 – 1.43 N (from Urinary N)
O2, CO2, CH4 in liter
Generalized equationSome ignore O2 or CH4 ?

Closed Circuit Calorimetry
Regnault-Reiset system:Same air re-circulate through the system short term Must be air-tight; maintain constant
volume Must have absorbent (for CO2) Very accurate Not practical for farm animals

Calorimetry; closed circuit

Open Circuit Calorimetry
Pettenkofer system:- constant composition of air: 20.9% O2;
0.03% CO2
- Measures Vol. of air passing through + O2, CO2, CH4 in expired air
- Fecal & urinary energy; urinary N; air flow; hair/skin (adult growth) losses
Provides an estimate of HP Can be used for energy balance studies

Calorimetry; open circuit
Cont.
What’s the main reason to measure HP?
EB = IE – (FE + UE + Gas E + HP)
Retained energy (energy balance)

Carbon-Nitrogen balance studies
In conjunction w/ respiratory exchange studies
Can be used to 1) estimate HP2) body retention of fat &
protein
Body gain of C & N = C & N intake – C & N output

Carbon-Nitrogen balance studies Assumption:Body protein contains 52.5% C & 16.7% NBody fat contains 76.5% CGlycogen is ignoredFat has 9.4 Kcal/g energyProtein has 5.7 Kcal/g energy

Calculating N balance
NB = N Intake – (FN + UN)N (g) × 6.25 = protein accretion(g)
protein accretion(g) × 0.525 = C in protein accreted
C Intake - C in protein accreted = C in fat accretedC in fat accreted / 0.765 = fat accretion (g)
Limitations1- difficult to measure all C & N losses2- generally overestimates energy accretion Accuracy: measure enthalpies of combustion of energy
of animal before/after treatments

Other methods
Comparative slaughter studiesTotal body energy of a group (similar animals)
at time 1Total body energy of a similar group at time 2Difference (T2 –T1) = ∆ energy because of
treatments Limitations: expensive, one-time point (not
over time)

How is it done?
Measure total body energy minus GI tract Grind, mix, take sub-sample Determine energy by bomb calorimeterPotential problems: animal variation sampling/representation water evaporation

Indirect methods to measure body composition
Density fat has lower density vs. water, bone or
protein
decreasing density increasing fat stored
Water density = 1.00

Density values of different tissues
Tissue /species density
Fat/ cattle 0.891- 0.912
Fat/ guinea pig 0.912
Fat/ human 0.918
Fat/ pig 0.914
Protein/ lean beef 1.312
Fat-free body/ human 1.100
How is it done?
Submerge the animal Measure displacement in water Measure weight in water
“ a body immersed in fluid is buoyed up with a force equal to the fluid displaced”

Dilution methods
If fat or non-fat portions of the body is known the enthalpy of combustion of the body can be estimated
Need to know the fat-free body composition

Composition of the fat-free body
Species BWT, kg Water, %
Protein, %
Ash, %
rat 0.35 73.7 22.1 4.2
Cat 4.0 74.4 21.0 4.6
Man 65 72.8 19.4 7.8
Pig 125 75.6 19.6 4.7
ox 500 71.4 22.1 6.0

Age affects body composition (example: pigs; Spray & Widdowson, 1950)
percentwater
protein
Age

Deuterium oxide dilution method
Can be applied to other methods using dyes
Must be able to cross all cell membranesreach equilibrium with body waterneed accurate measurementslowly metabolized & excreted
Water contents of body & feed??
Body Condition Score (BCS)
BCS: non-invasive, qualitative ranging from 1 to 5 (no reserve to
extremely fat) Optimum BCS at calving is ~ 3.5 Cows with BCS > 3.8 show increased
risk for ketosis & mastitis

Body condition score change
2.75
3
3.25
3.5
3.75
4
-4 -3 -2 -1 0 1 2 3 4 5 6 7 8
BCS
Week Relative to Parturition
Primiparous cows
Multiparous Cows

Relationship of retained energy (RE) to food (energy) intake

The efficiency of utilization of energy
0
0
Ret
enti
on
(M
J)
Energy Intake (MJ)
curvilineargreater decline above zero retention

Cont.
Why declining? Change in Metabolizability of the
rations? More pronounced (greater decline) for
ruminants vs. mono-gastric animalsIs efficiency of utilization (k) different for
maintenance vs. growth/lactation ?

Efficiency of ME utilization for maintenance (Km)
Km = average slope measured within bounds of zero food intake and a food intake that supports/maintains a zero-energy balance

Efficiency of ME utilization for maintenance (Km)
Ret
enti
on
(M
J)
0
0 Energy Intake (MJ)
For Km
Efficiency of ME utilization for deposition of fat and protein (K f &p)
K f & p is the average slope measured with the lower bound at maintenance and the upper bound at some greater level

Efficiency of ME utilization for deposition of fat and protein (K f &
p)
For ruminants, measured at 2X maintenance
Ret
enti
on
(M
J)
0
Energy Intake (MJ)
for K f & p
0

The efficiency of utilization of energyR
ete
nti
on
(M
J)/
MB
W
0
0 Energy Intake (MJ)/MBW
Adjust for differences in surface area
ME requirement for maintenance (MJ)
MBW=BW 0.75

Factors affecting efficiency of utilization of energy
Gender Nutrients absorbed (VFAs vs. glucose) Physiological state Ration characteristics Environmental conditions Type of the GI tract (ruminants vs. mono-
gastrics) Physical activity (grazing vs. confined)
Conditions that increase maintenance requirements
Ambient temperature Increased activity Increased dietary protein Decreased metabolizability of ration
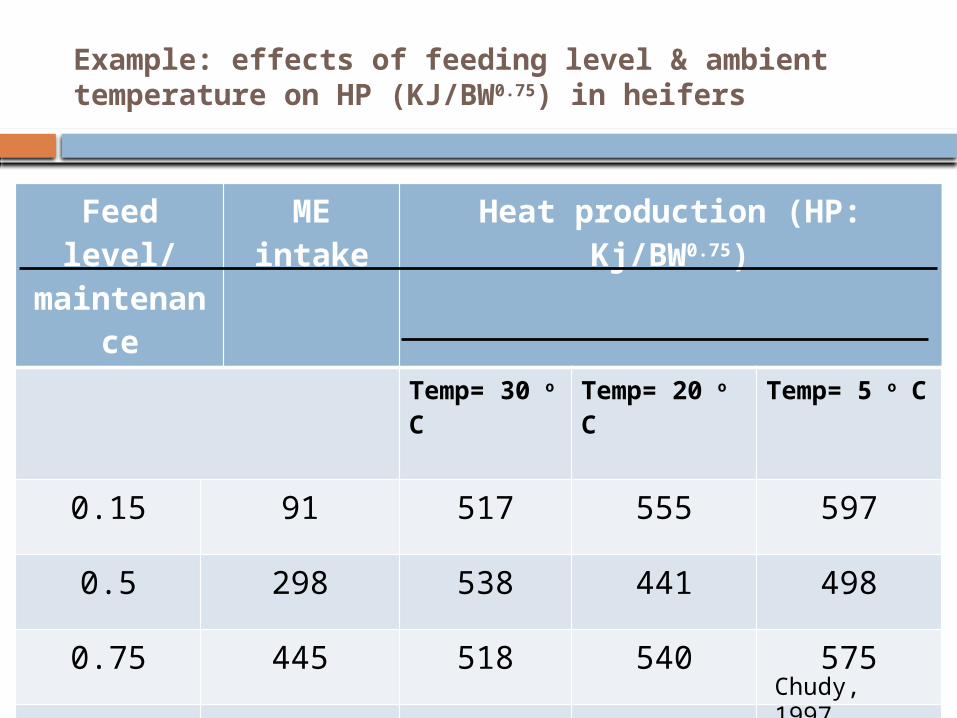
Example: effects of feeding level & ambient temperature on HP (KJ/BW0.75) in heifers
Feed level/
maintenance
ME intake
Heat production (HP: Kj/BW0.75)
Temp= 30 o C
Temp= 20 o C
Temp= 5 o C
0.15 91 517 555 597
0.5 298 538 441 498
0.75 445 518 540 575
0.9 535 603 543 577Chudy, 1997

What type of relationship?
565 at 5 degree 515 at 20 degree 525 at 30 degree No relationship until ME intake
approaches maintenance What would have been the efficiency at
5 degree?


Utilization of end-products of digestion
Do ruminants have a greater or lower efficiency of use of ME compared with non-ruminants?
Why?

Utilization of ME of starch for body gain by different species
Species Efficiency, %
Rat 75.5 ± 1.2
Pig 75.5 ± 1.6
Horse/rabbit 67.5 ± 1.2
Sheep 64.1 ± 1.6
cattle 64.1 ± 1.7
Nehring et al., 1961Jentsch, 1967

Why different?
Heat increment Different amount of heat from food
ingestion Specific dynamic effect:Increase in HP associated with the
combustion of a meal
Heat Increment1) Eating, 2) gut activities, 3) absorption, 4)
cellular activities

Heat associated with eating
HI is increased when eating; by ~ 50% in O2
Similar trends in other species Also in sham-fed animals Average of HI lost ~ 3% of ME Sheep while eating ~ 40kj/kg BWDoes rumination have an effect? ~ 0.3% of ME (or 10% of that of eating
process)

Heat associated with gut activities
HI lost associated w/ enzymatic activities 0.1 to 2.0% of the energy of substrate
ingested (carbohydrate, protein, fat) Ruminants vs. non-ruminants ? Overall effect ?

Heat associated with fermentation Fick principle:Total HP by GI tissues = rate of blood flow, A-V
difference in blood temperature & its specific heat
The A-V difference in O2 consumption × blood flow & the specific heat of O2 aerobic metabolism
The difference b/w the two anaerobic fermentation
Comes down to just ~ 6%is something missing ?

Heat associated with fermentation
HI with feed intake after 2-d starving
~ 6% of DE
Ruminants vs. non-ruminants ? Very significant

Heat associated with absorption of nutrients
Amount of feed intake & nutrient composition
Carbohydrates- glucose
Lipids
FA < 14C
Protein
AbsorptionActive & diffusionNa- ion pumps
passive
Na- ion pumps
Active- AA specific careerNa- ion pumps
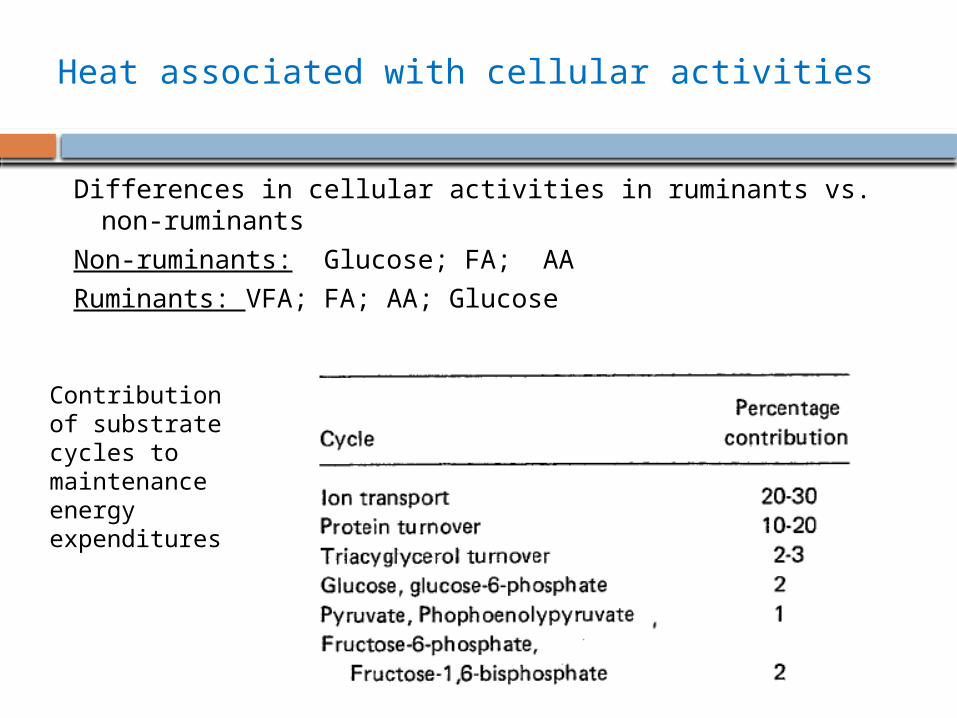
Heat associated with cellular activities
Differences in cellular activities in ruminants vs. non-ruminants
Non-ruminants: Glucose; FA; AA
Ruminants: VFA; FA; AA; Glucose
Contribution of substrate cycles to maintenance energy expenditures

Estimated mass, blood flow and energy expenditures of tissues and organ systems of ruminants 24-h post-feeding

Example: Armstrong & Blaxter, 1961
Infusion of glucose into rumen, abomasum, and jugular vein:
Efficiency of utilization of ME (as %)Rumen: 54.5%Abomasum: 71.5%Jugular vein: 72.8%

Example: Armstrong, 1958
Does the proportion of VFA affect the efficiency with which ME is utilized?
Acetate: propionate net efficiency (%)
75% acetate 3125% acetate 58
Better efficiency greater [propionate]Is it true with all studies?

Does feed processing have an effect?
In some studies….More processed forage: net utilization of ME
maintenance requirement propionate
Is it true with all studies?

Does feed processing have an effect?
Paladines et al., 1964b

Does feed processing have an effect?
Paladines et al., 1964b
Overall
Eating, digestion, fermentation average ~ 25-30% of HI
Forage processing? Tissue absorption?

Partition of fat and protein deposition
During rapid gain, highest efficiency is w/ depositing fat
Why? Breed effect? Gender effect?
High energetic efficiency high fat and low protein depositing ?
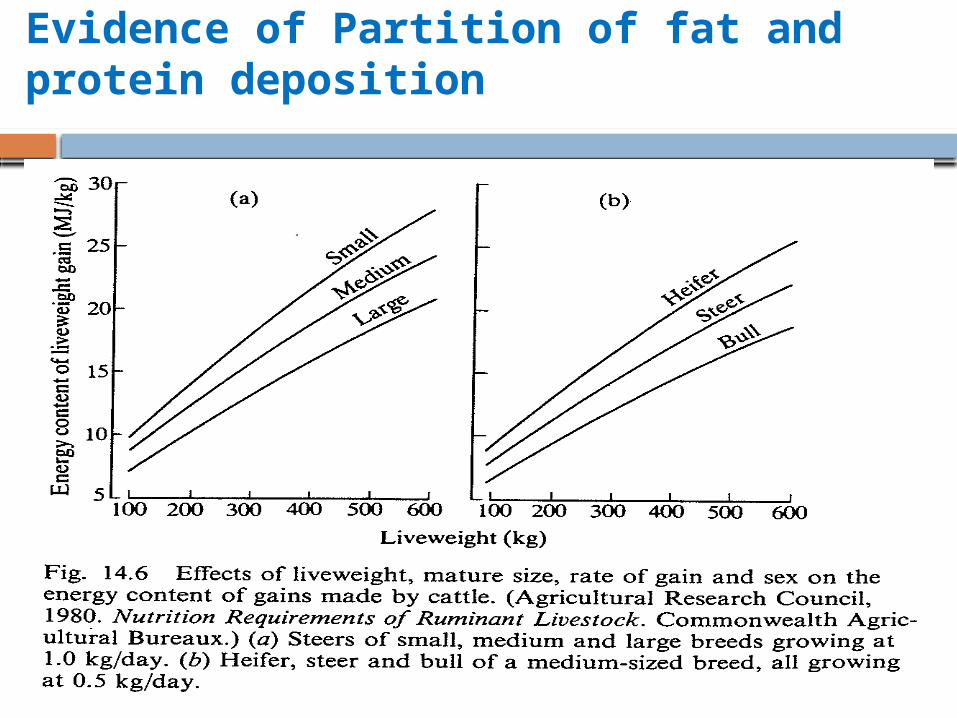
Evidence of Partition of fat and protein deposition

Evidence of Partition of fat and protein deposition
A study demonstrated when fed ad lib or 65%:
Efficiency of gain at the same BW:Heifers > steer > bull
Protein deposition: Heifers < steer < bull Feed intake affected body composition
greater intake more fat deposition

Evidence of Partition of fat and protein deposition
Other studies do NOT support thisExample: Cattle fed ad lib gained more fat & less
muscle vs. feed-restricted cattle
Slaughter studies; 1200 sheep in + EBBody composition BW
intake or age

Growth co-efficiencies for bone, muscle, and fat (pigs)
Tulloh, 1964

Effect of feeding frequency on body composition & gross efficiency in rats
Intake BW Fat Protein
Energy % gross efficie
ncy
Ad lib 85.6 13.8 19.0 237 16.6
2X/d 83.5 30.5 12.8 359 25.9

Growth co-efficiencies for water, protein, fat & energy in sheep (Reid et al., 1968)

Partition of efficiency
ME intake = H0 + Rp/Kp + Rf/Kf
Where H0 is maintenance energy
Rp is retained protein
Rf is retained fat
Kp & Kf are efficiencies of utilization of ME for protein and fat deposition, respectively

Energy requirements
In addition to maintenance requirements:
Lactation Reproduction/pregnancy Growth Work

Cont. Maintenance
NutrientEfficiency of
utilization of ME for maintenance
Glucose 0.94
Starch 0.80
Casein 0.70
Acetate 0.59
Propionate 0.86
Butyrate 0.76

Cont. Growth
NutrientEfficiency of
utilization of ME for growth
Glucose 0.54
Starch 0.64
Casein 0.50
Acetate 0.30-0.66
Propionate 0.52
Butyrate 0.62

Cont. Milk production
Relatively tight range: 0.56 (poor diet) to 0.66 (best quality)
Energy tissue utilization: ~ 0.84Efficiency: milk > meat
Quick removal of the productHigh producer > low producer
genetic selection for greater milk yield

Predicted energy flow in a mature cow (650 kg) as feed intake & milk yield increase
item Intake; × maintenance
1 2 3 4 6 8
3.5% FCM, kg/d 0 13.3 26 37.9 59.9 79.5
GE intake, Mcal/d
29.2 51.4 74.1 96.9 142.5 188.2
FE, Mcal/d 9.3 14.2 20.3 27.5 44.4 64.5
DE, % 68.2 72.4 72.6 71.6 68.8 65.7
Milk energy, Mcal/d
0 9.2 17.9 26.1 41.3 54.8
Milk/fecal energy
0 0.65 0.88 0.95 0.93 0.85

Other energy systems
Thaer (1809): hay unit Henneberg & Stohmann (1864):
proximate analysis Molgaard (1929): Scandinavian “fodder
unit” Morrison (1936): TDN Kellner (1912): Net energy (expressed in
“starch unit”) Armsby (1917): Net energy
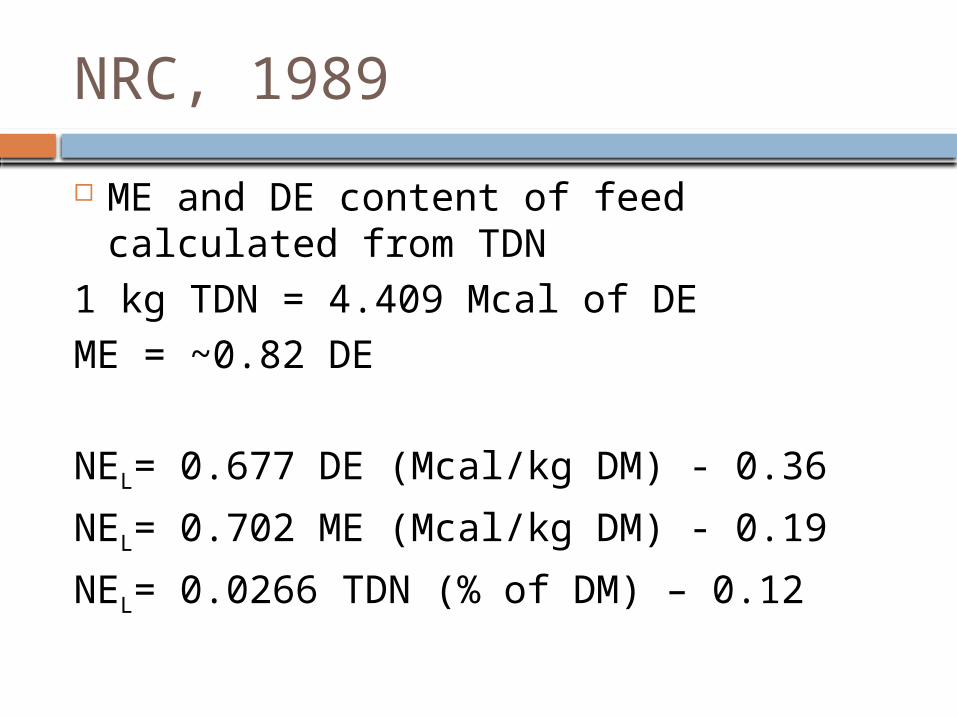
NRC, 1989
ME and DE content of feed calculated from TDN
1 kg TDN = 4.409 Mcal of DEME = ~0.82 DE
NEL= 0.677 DE (Mcal/kg DM) - 0.36
NEL= 0.702 ME (Mcal/kg DM) - 0.19
NEL= 0.0266 TDN (% of DM) – 0.12

NRC, 2001
Net energy system Experimental results: respiration
Calorimetry Energy utilization for maintenance = milk
yield NEL
TDN m = truly digestible [NFC+CP+(EE x 2.25)] - 7
Milk energy output Mcal/kg milk=0.3512+[0.0962 x (milk fat %)]

Cont.
NEm = 0.08 Mcal/kg BW0.75
NEL (Mcal/kg milk)= [(0.0929 x fat%) + (0.0547 x milk protein %) + 0.0395 x milk lactose %)]