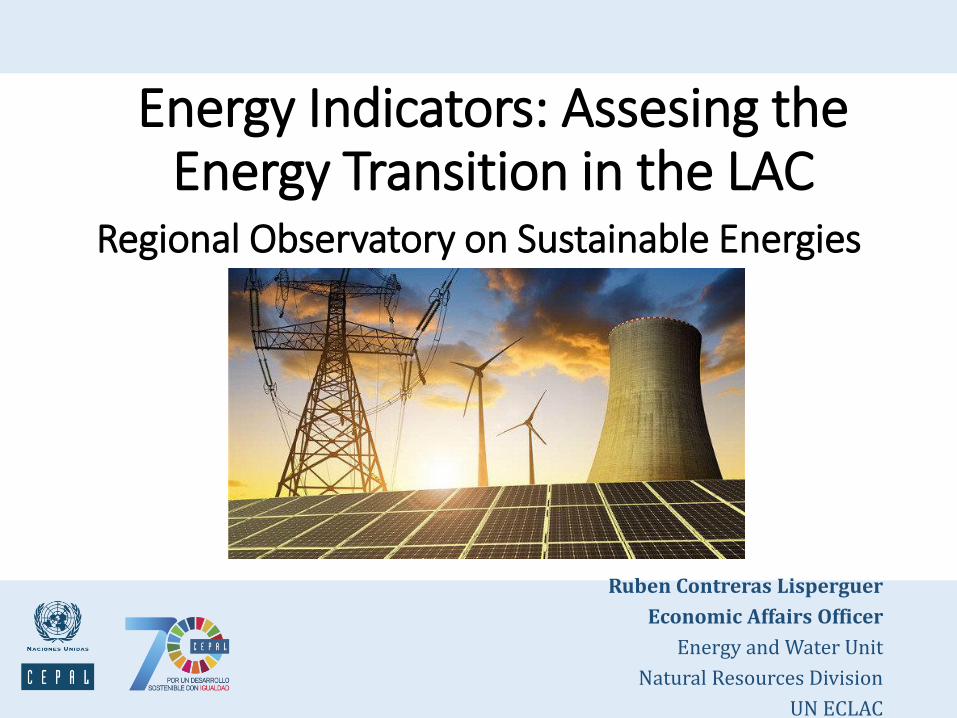
Energy Indicators: Assesing the Energy Transition in the LAC
35
Energy Indicators: Assesing the Energy Transition in the LAC Ruben Contreras Lisperguer Economic Affairs Officer Energy and Water Unit Natural Resources Division UN ECLAC Regional Observatory on Sustainable Energies
Transcript of Energy Indicators: Assesing the Energy Transition in the LAC
Energy Indicators: Assesing the Energy Transition in the LAC
Ruben Contreras Lisperguer
Economic Affairs Officer
Energy and Water Unit
Natural Resources Division
UN ECLAC
Regional Observatory on Sustainable Energies

Has there been an energy transition in the Latin American
region?

¿How does ECLAC define Energy Transition in Latin America and the Caribbean??
Energy transition will be understood as the process of change in policies,institutions, regulations and investments that promote the generation and moresustainable uses of energy aiming at the decarbonization of the economy,prioritizing:
• More generation of electricity from renewable sources, with an emphasis onvariable renewables.
• More energy efficiency of energy systems, including transport.• More sustainable management of fossil fuels and biofuels• More energy complementarity leading to less regional energy vulnerability
Objective: Decarbonization
Strategy: Energy Transition
Instrument: Environmental Big Push
• Are the existing indicators comprehensive, robust and comparable?
• How the existing indicators can be improved?
• Role of regional cooperation and knowledge sharing

Devil is in Detail: Need for Disaggregation
• Energy access: share of population with access
➔ Improvement: Access Quality?, Impact on poorest sector?, Share of rural and urban population
• Renewable energy share in final energy
➔ Improvement: RE in heat, electricity, mobility, End-of-Life
• Energy intensity: primary energy per GDP
➔Improvement: Sectoral tracking (households, industry, transport)
➔Challenge: Considering the heterogeneity between countries (climate, economic structure, etc.)

Energy Matrix

LAC vs the World - Total Primary Energy Supply 2000 - 2017 (Percentages)
50.5
36.543.1
32.0
4.6
23.15.5 26.9
19.4
20.6
25.2
22.0
1.1
0.5
0.8
0.614.8
10.217.4
9.8
0.0 0.0 0.0 0.00.0 0.1 0.2 1.28.5
2.3
7.52.5
1.06.7
0.35.0
0%
10%
20%
30%
40%
50%
60%
70%
80%
90%
100%
ALC Mundo ALC Mundo
2000 2017Petróleo Carbón Gas Natural Geotermia Bioenergía Calor Solar y Eólico Hidroenergía Nuclear

39%
33%
17%
5%5% 1%
Consumo energía final regional - 2017
TRANSPORTE INDUSTRIAL RESIDENCIAL COMERCIAL, SERVICIOS, PÚBLICO AGRO, PESCA Y MINERÍA CONSTRUCCIÓN Y OTROS
Energy Consumption by Sector 2017. The transport sector is one of the largest consumer of energy resources, with 99% coming from fossil fuels.
50
7009
6
15
328
0%
10%
20%
30%
40%
50%
60%
70%
80%
90%
100%
1
Consumo energía final del sector INDUSTRY por fuentes al 2017
ELECTRICIDAD GAS LICUADO GASOLINA/ALCOHOL
KEROSENE/JET FUEL DIÉSEL OIL FUEL OIL
COQUE CARBÓN VEGETAL GASES
OTRAS SECUNDARIAS
Fuente: CEPAL elaborado sobre la base de SieLAC-OLADE.
01
52
41
60000
0%
10%
20%
30%
40%
50%
60%
70%
80%
90%
100%
Consumo energía final del sector TRANSPORT por fuentes al 2017
OTRAS SECUNDARIASGASESCARBÓN VEGETALCOQUE
KEROSENE/COMBUSTIBLE JETDIÉSELGASOLINA/ALCOHOL
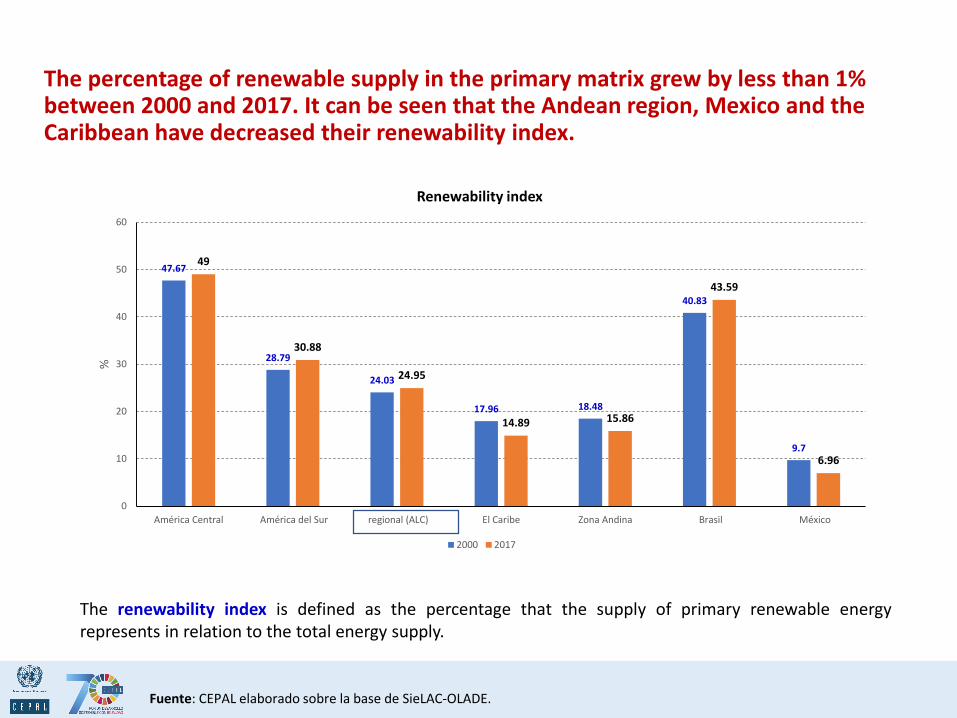
The percentage of renewable supply in the primary matrix grew by less than 1% between 2000 and 2017. It can be seen that the Andean region, Mexico and the Caribbean have decreased their renewability index.
Fuente: CEPAL elaborado sobre la base de SieLAC-OLADE.
The renewability index is defined as the percentage that the supply of primary renewable energyrepresents in relation to the total energy supply.
47.67
28.79
24.03
17.96 18.48
40.83
9.7
49
30.88
24.95
14.89 15.86
43.59
6.96
0
10
20
30
40
50
60
América Central América del Sur regional (ALC) El Caribe Zona Andina Brasil México
%
Renewability index
2000 2017

Hidro16%
Térmica66%
Nuclear11%
Geotermia2%
Eólica4%
Solar1%
Mundo
Electricity generation matrix: in Latin America and the Caribbean, 53% is renewable, of which 83% is hydroenergy.
Matriz de generación eléctrica en
América Latina y el Caribe y el Mundo
2017
(En porcentaje respecto al total)
Hidroenergía44%
Gas natural27%
Petróleo y derivados
11%
Carbón mineral y
coque7%
Biomasa5%
Geotermia1%
Eólica3%
Solar0%
Nuclear2%
ALC
Fuente: Organización Latinoamericana de Energía (OLADE)
23% renovable
Térmica en ALC es deun 45%: Incluye GasNatural (27%) +Petróleo y Derivados(11%) y CarbónMineral (7%)
Fuente: CEPAL elaborado sobre la base de SieLAC-OLADE y base de datos de la IEA.
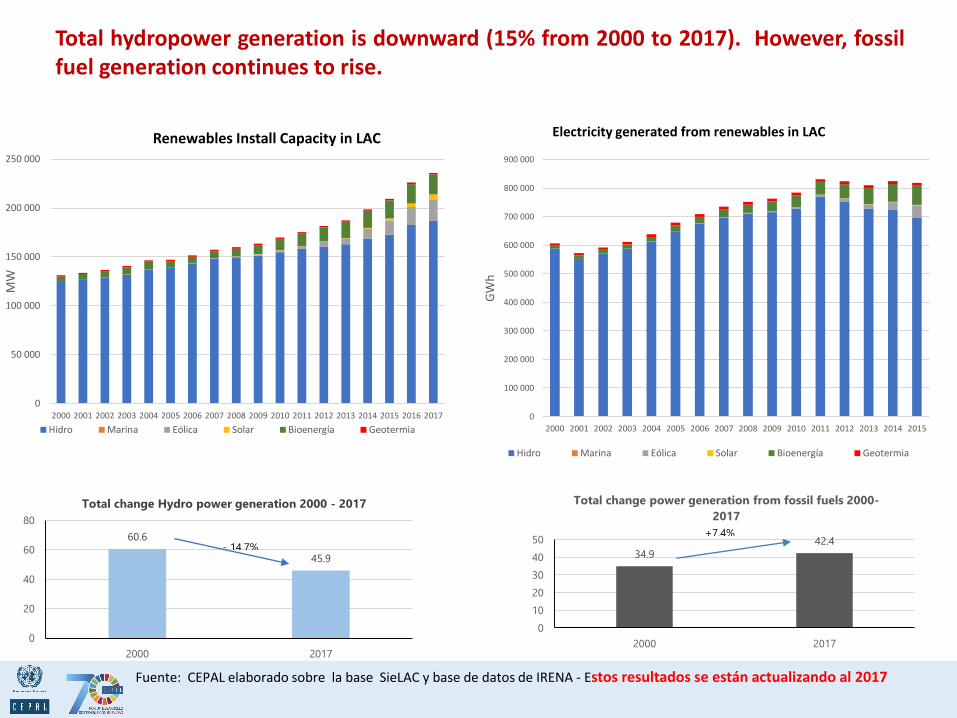
60.6
45.9
0
20
40
60
80
2000 2017
Total change Hydro power generation 2000 - 2017
- 14.7%34.9
42.4
0
10
20
30
40
50
2000 2017
Total change power generation from fossil fuels 2000-
2017
+7.4%
Total hydropower generation is downward (15% from 2000 to 2017). However, fossilfuel generation continues to rise.
Fuente: CEPAL elaborado sobre la base SieLAC y base de datos de IRENA - Estos resultados se están actualizando al 2017
0
50 000
100 000
150 000
200 000
250 000
2000 2001 2002 2003 2004 2005 2006 2007 2008 2009 2010 2011 2012 2013 2014 2015 2016 2017
MW
Renewables Install Capacity in LAC
Hidro Marina Eólica Solar Bioenergía Geotermia
0
100 000
200 000
300 000
400 000
500 000
600 000
700 000
800 000
900 000
2000 2001 2002 2003 2004 2005 2006 2007 2008 2009 2010 2011 2012 2013 2014 2015
GW
h
Electricity generated from renewables in LAC
Hidro Marina Eólica Solar Bioenergía Geotermia
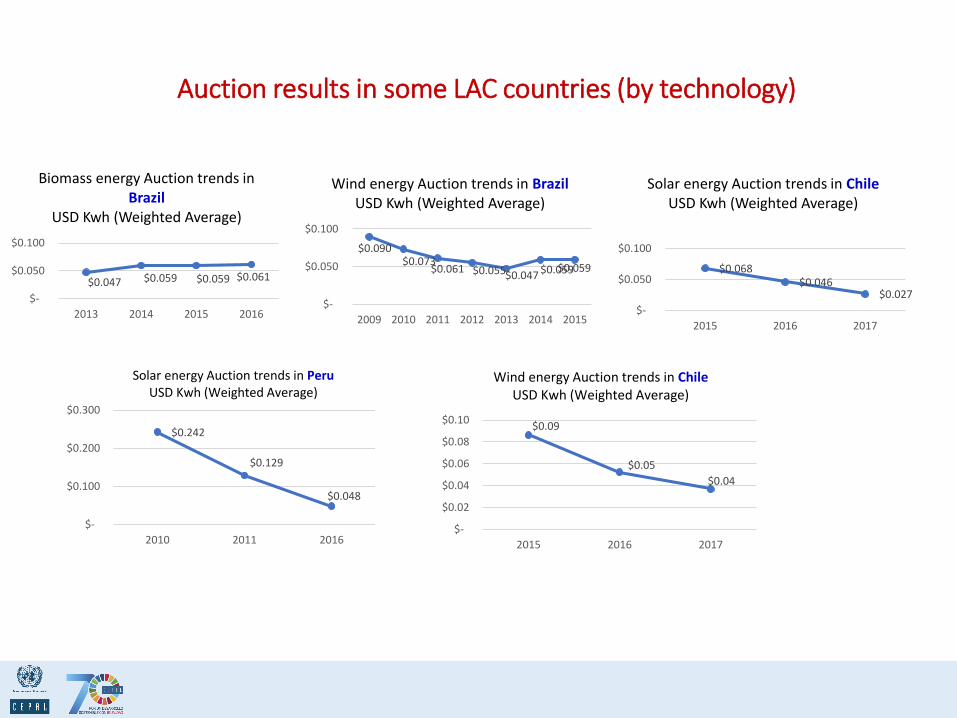
Auction results in some LAC countries (by technology)
$0.047 $0.059 $0.059 $0.061
$-
$0.050
$0.100
2013 2014 2015 2016
Biomass energy Auction trends in Brazil
USD Kwh (Weighted Average)
$0.090 $0.073
$0.061 $0.055 $0.047 $0.059 $0.059
$-
$0.050
$0.100
2009 2010 2011 2012 2013 2014 2015
Wind energy Auction trends in BrazilUSD Kwh (Weighted Average)
$0.068 $0.046
$0.027
$-
$0.050
$0.100
2015 2016 2017
Solar energy Auction trends in ChileUSD Kwh (Weighted Average)
$0.242
$0.129
$0.048
$-
$0.100
$0.200
$0.300
2010 2011 2016
Solar energy Auction trends in PeruUSD Kwh (Weighted Average)
$0.09
$0.05
$0.04
$-
$0.02
$0.04
$0.06
$0.08
$0.10
2015 2016 2017
Wind energy Auction trends in ChileUSD Kwh (Weighted Average)

Installed renewable energy capacity in the electricity sector has advanced significantly
0
20000
40000
60000
80000
100000
120000
140000
160000
180000
Bioenergía Geotermia Hidroeléctricas Solar Eólica
3,664.6360.8
115,694.2
5.1 90.5
19,480.3
665.0
175,395.2
5,251.6
17,440.2
2000 2017

Fuente: Elaboración CEPAL sobre base de datos de Financial Times fDi Markets.
Announcement of Foreign Direct Investment in the energy sector: shows an increase
in non-hydro renewables, confirming the beginning of a transition.
$144,379 $113,413
$-
$50,000
$100,000
$150,000
$200,000
Accumulated investment 2005 and 2018 (MUSD)
Fosil Renovable
$99,628
$13,786
$0
$20,000
$40,000
$60,000
$80,000
$100,000
$120,000
Renovable No-Hidro Renovable Hidro
Accumulated investment for non-hydro renewables and hydro 2005 and 2018 (MUSD)
$16,385.02
$4,536.93 $3,783.10
$6,554.71 $7,548.69
$- $-
$5,000
$10,000
$15,000
$20,000
Fosil Renovable no hidro Hidro
Comparison of Investment between 2005 and 2018 (MUSD) by technology
2005 2018
The foreign direct investment announced in the energy sector represents in renewables an annual investment of approximately 0.16% of the region's GDP (from 2005 to 2018) considering the annual regional GDP at constant dollar prices, while fossil fuels represent 0.21%.

Flexibility, Rotating mass to support system stability: Attention should be paid to the issue of margin reserve and ancillary/secondary services - storage will be key in the near future
65.0%
66.0%
67.0%
68.0%
69.0%
70.0%
71.0%
72.0%
73.0%
74.0%
-
50,000
100,000
150,000
200,000
250,000
300,000
350,000
400,000
20
18
20
19
20
20
20
21
20
22
20
23
20
24
20
25
20
26
20
27
20
28
20
29
20
30
20
31
20
32
REs Penetration vs Reserve Margin
Hydro Solar Wind Biomass Reserve [%]
[MW]
0.0%
10.0%
20.0%
30.0%
40.0%
50.0%
60.0%
70.0%
80.0%
-
50,000
100,000
150,000
200,000
250,000
300,000
350,000
20
18
20
19
20
20
20
21
20
22
20
23
20
24
20
25
20
26
20
27
20
28
20
29
20
30
20
31
20
32
REs Penetration vs Reserve Margin
Hydro Solar Wind Biomass Reserve [%]
[MW]
Escenario base ECOSUD - Sudamérica Escenario Renovables + Integración ECOSUD - Sudamérica
El escenario ER+INT (~800 mil millones US$) representa a la región una inversión anual aproximada del 1% del PIB de la región (del año 2019 al 2032) considerando el PIB total anual a precios en dólares constantes.

Una transición energética sostenible conlleva requisitos para nuevos patrones de uso de minerales
18,000 87,000
509,000
1,005,004
105,000
127,000
163,000
189,180
0
200,000
400,000
600,000
800,000
1,000,000
1,200,000
2010 2017 2025 2030
Baterias Otros usos
Notas: Las baterías incluye para vehículos (híbridos, híbridos enchufables y eléctricos con batería), camiones y autobuses (livianos, medianos y pesados), vehículos
de dos y tres ruedas, redes de almacenamiento y productos electrónicos de consumo. Los valores en % refieren a la tasa crecimiento anual promedio para esos años
15
85
41
5976
24
84
16
Demanda mundial de litio
En
mil
es d
e to
nel
adas
eq
uiv
alen
tes
de
carb
on
ato
de
liti
o
Porcentaje (%)
+8.2%
+15.4%
+12.2%
Fuente: Comisión Económica para América Latina y el Caribe (CEPAL), sobre la base estadística de McKinsey & Company (2018),
“Energy Technology Perspectives 2015: Mobilising Innovation to Accelerate Climate”. Metals and mining, McKinsey & Company.

Beyond Access

The number of people without access to electricity services fell from 43.6 million in 2000 to 14 million in 2016.
Acceso a los servicios eléctricos en América Latina y el Caribe
(En cientos de millones de personas)
Fuente: Comisión Económica para América Latina y el Caribe (CEPAL), en base a los datos del Global Tracking Framework Initiative
446454
462471
479487
495503
511518
526533
540547
555562
569576
583590
598605
612619
626632
639
382394
402413
424432
444453
463473
482491
500509
517526
536545
556564
573582
591600
607615
625
350
400
450
500
550
600
650
Población total Población con acceso
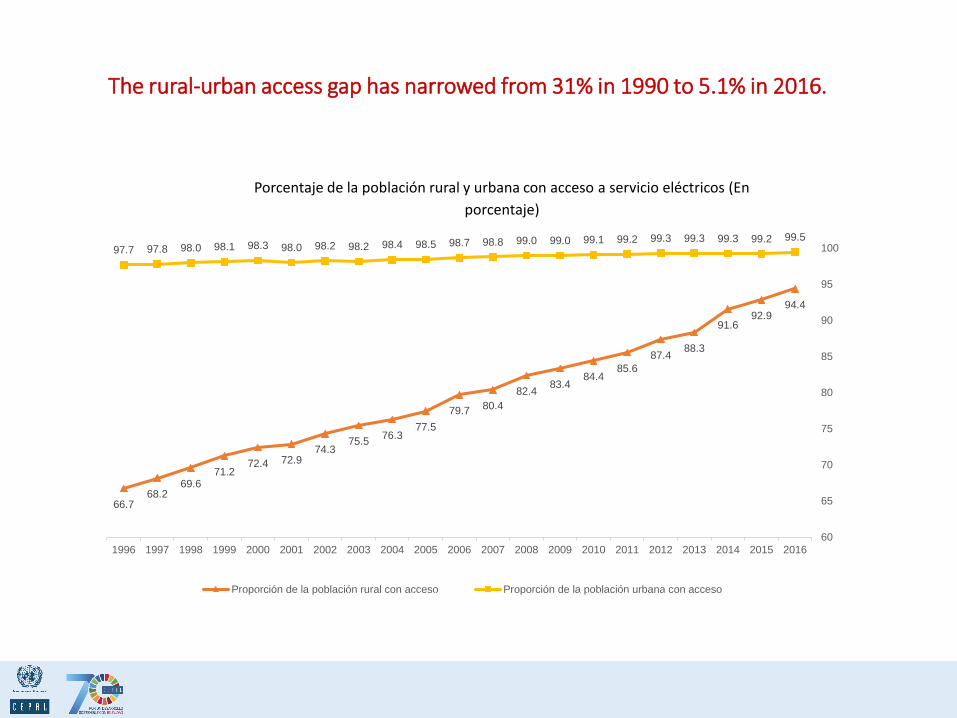
The rural-urban access gap has narrowed from 31% in 1990 to 5.1% in 2016.
Porcentaje de la población rural y urbana con acceso a servicio eléctricos (En
porcentaje)
66.768.2
69.671.2
72.4 72.974.3
75.576.3
77.5
79.7 80.4
82.483.4
84.485.6
87.488.3
91.692.9
94.4
97.7 97.8 98.0 98.1 98.3 98.0 98.2 98.2 98.4 98.5 98.7 98.8 99.0 99.0 99.1 99.2 99.3 99.3 99.3 99.2 99.5
1996 1997 1998 1999 2000 2001 2002 2003 2004 2005 2006 2007 2008 2009 2010 2011 2012 2013 2014 2015 2016
60
65
70
75
80
85
90
95
100
Proporción de la población rural con acceso Proporción de la población urbana con accesoFuente: Comisión Económica para América Latina y el Caribe (CEPAL), en base a los datos del Global Tracking Framework Initiative

Actualizado a octubre de 2019
ECLAC Household Survey Data Bank processing
Some Electricity indicators
ROSE
Fuente: CEPAL, Banco de Datos de Encuestas de Hogares (BADEOHG). Se incluyeron 16 países.ECLAC Household Survey Data Bank
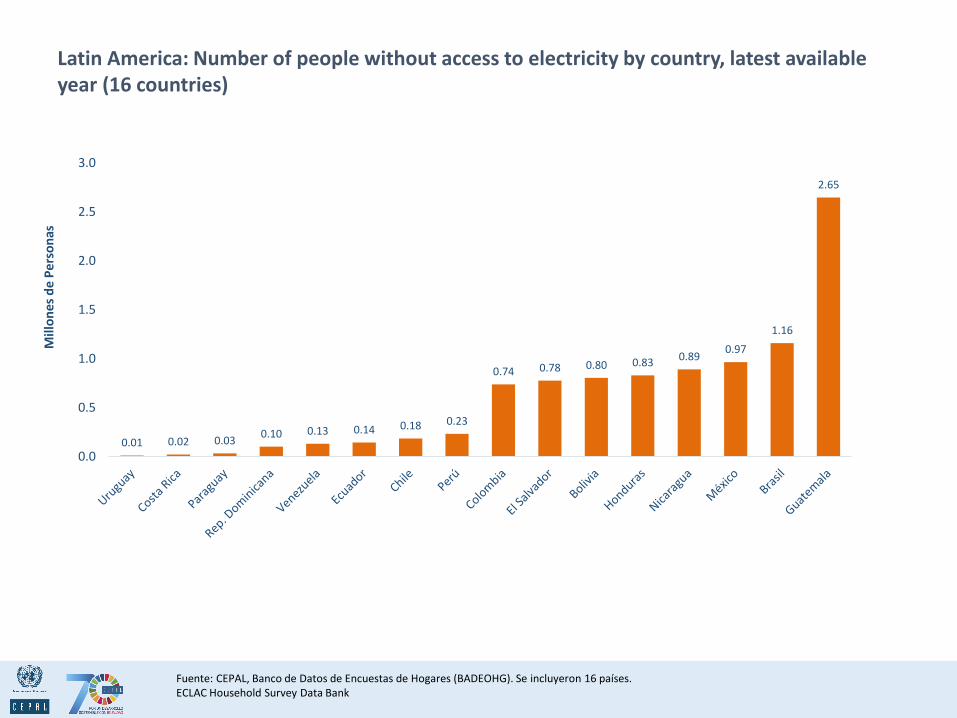
Latin America: Number of people without access to electricity by country, latest available year (16 countries)
0.01 0.02 0.030.10 0.13 0.14 0.18 0.23
0.74 0.78 0.80 0.830.89
0.97
1.16
2.65
0.0
0.5
1.0
1.5
2.0
2.5
3.0
Mill
on
esd
e P
ers
on
as
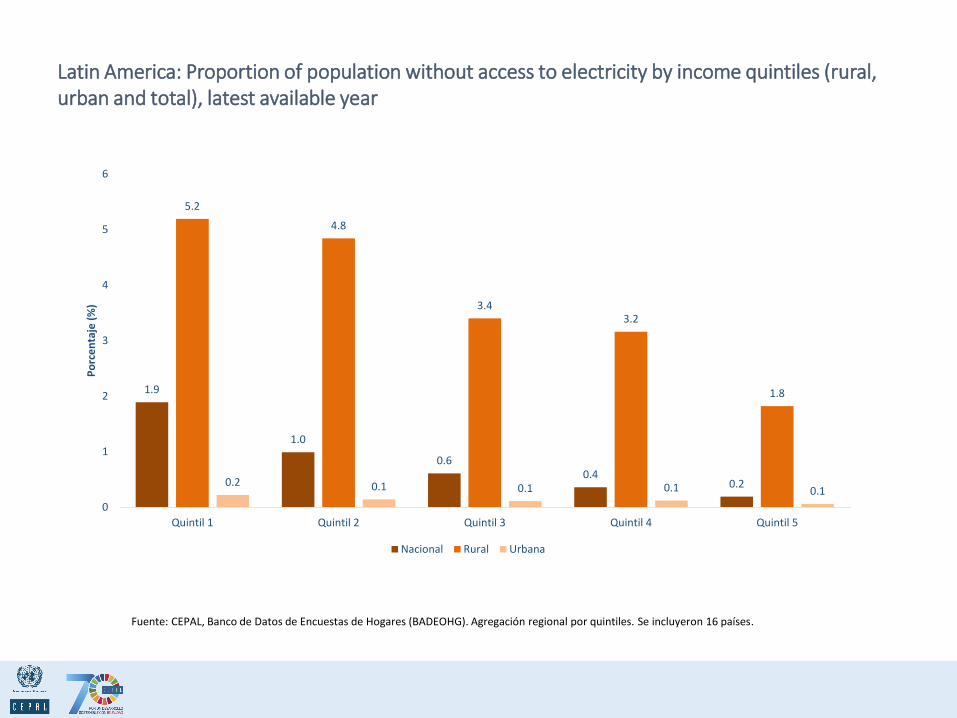
Latin America: Proportion of population without access to electricity by income quintiles (rural, urban and total), latest available year
Fuente: CEPAL, Banco de Datos de Encuestas de Hogares (BADEOHG). Agregación regional por quintiles. Se incluyeron 16 países.
1.9
1.0
0.60.4
0.2
5.2
4.8
3.43.2
1.8
0.2 0.1 0.1 0.1 0.1
0
1
2
3
4
5
6
Quintil 1 Quintil 2 Quintil 3 Quintil 4 Quintil 5
Po
rce
nta
je (
%)
Nacional Rural Urbana

Fuente: CEPAL, Banco de Datos de Encuestas de Hogares (BADEOHG).Promedio regional ponderado por población. Se incluyeron 9 países.ECLAC Household Survey Data Bank
Latin America: Proportion of indigenous and Afro-descendant population and rest of population without access to electricity, latest available year
0.6 0.9 1.1 1.2 1.6 2.23.6
12.6
22.0
26.7
0.3 0.2 0.3 0.6 1.0 1.30.4
4.6
13.8
10.1
0
5
10
15
20
25
30
Uruguay Brasil Perú México Chile AL Ecuador Bolivia Nicaragua Guatemala
Po
rce
nta
je(%
)
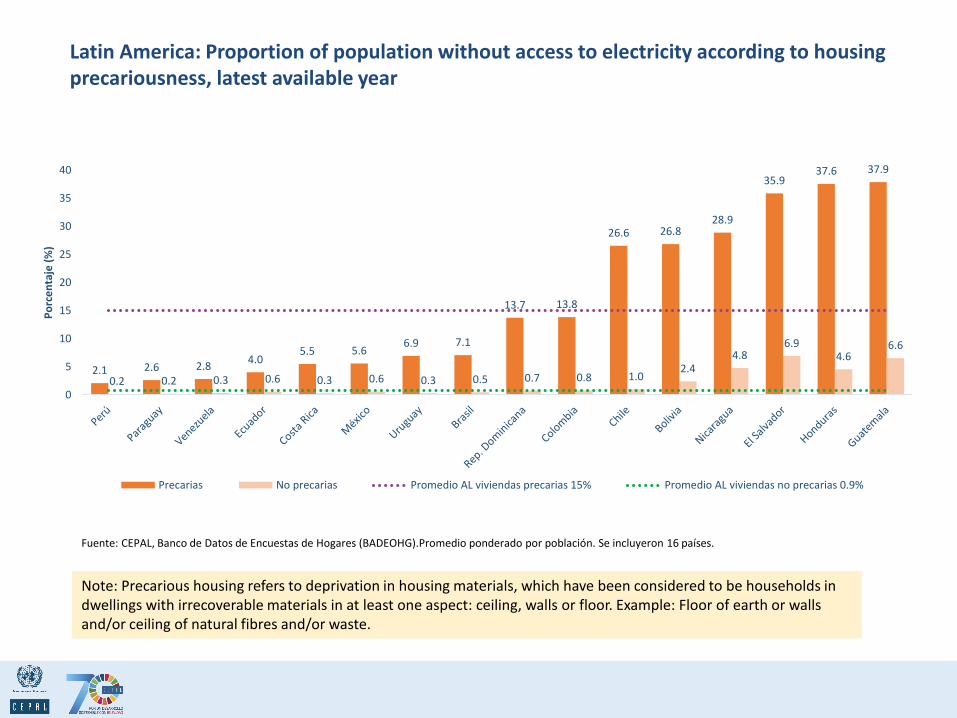
Latin America: Proportion of population without access to electricity according to housing precariousness, latest available year
Note: Precarious housing refers to deprivation in housing materials, which have been considered to be households in dwellings with irrecoverable materials in at least one aspect: ceiling, walls or floor. Example: Floor of earth or walls and/or ceiling of natural fibres and/or waste.
Fuente: CEPAL, Banco de Datos de Encuestas de Hogares (BADEOHG).Promedio ponderado por población. Se incluyeron 16 países.
2.1 2.6 2.84.0
5.5 5.66.9 7.1
13.7 13.8
26.6 26.828.9
35.937.6 37.9
0.2 0.2 0.3 0.6 0.3 0.6 0.3 0.5 0.7 0.8 1.02.4
4.86.9
4.66.6
0
5
10
15
20
25
30
35
40
Po
rce
nta
je (
%)
Precarias No precarias Promedio AL viviendas precarias 15% Promedio AL viviendas no precarias 0.9%
Energy Efficiency
Intensidad energética en base a la energía primaria en América Latina y el Caribe versusotras regiones (En MegaJoule/PIB)
Históricamente, la región ha tenido la menor intensidad energéticaa nivel mundial, pero también ha sido la que menos ha mejorado.
4.4 4.3 4.3 4.2 4.2 4.2 4.2 4.2 4.2 4.3 4.2 4.2 4.3 4.3 4.2 4.2 4.2 4.0 4.0 4.0 4.0 3.9 4.0 3.9 3.93.8
0
1
2
3
4
5
6
7
8
9
10
1990 1992 1994 1996 1998 2000 2002 2004 2006 2008 2010 2012 2014
Asia oriental y el Pacífico Europa y Asia central América Latina y el Caribe
América del Norte Miembros OCDE
Fuente: Comisión Económica para América Latina y el Caribe (CEPAL), en base a los datos del Global Tracking Framework Initiative

0%
20%
40%
60%
80%
100%
2006 2009 2012
Increasing number of countries with quantitative targets
Targets are expressed in different ways and relate to different part of the consumption: on total (primary )consumption (around 20%) , on final energy consumption (around 20%) , or end-use sectors (case of 60% of countries)
0%
20%
40%
60%
80%
100%
Primary Final consumptionEnd-use sectors Energy Suppliers
• Countries with quantitative targets
Source WEC surveys ( 85 countries, of which 10 in Latin America)

Primary and final intensity trends: case of Brazil
Source BIEE/EPE
Different trends as to the variation of primary and final intensity in Brazil depending on energy transformations and mainly the power sectorSince 1998, and especially since 2005, energy transformations contribute to increase the primary intensity due to the development of thermal power generation and biofuels production
-2%-2%-1%-1%0%1%1%2%2%3%3%
1990-1993 1993-1998 1998-2005 2005-2010
%/a
ño
Intensidad primária Intensidad final Transformación

El ROSE utilizará el conocimiento y la metodología empleada en el desarrollo del programa BIEE
Data-Mapper: sitio Web de la Base de datos para elaboración de Indicadores en EE
Sitio Web: https://www.cepal.org/es/proyectos/programa-biee-
base-de-indicadores-de-eficiencia-energetica
Base de datos ‘Data-Mapper’: http://www.biee-cepal.enerdata.eu/

ECLAC Project: The Regional Observatory on Sustainable Energies (ROSE)
BIEEEnergy
Efficiency
ECOSUDComplementarity
and Energy integration
Regional Technical Forum of
Energy Planners
Regional Political Dialogue on EE
Regional Observatory on Sustainable Energies (ROSE)
Energy Data in the form of Energy Indicators

General objective: To strengthen the national capacities of all Member States in Latin America and the Caribbean to design, implement and monitor sustainable energy strategies, plans and policies based on objective evidence.
Specific objectives:1 Strengthen the technical capacities of beneficiary countries to producerelevant and consistent data (e.g. social changes in access) to develop energy indicators.
2 Improve the capacity of beneficiary countries to design and implement evidence-based policies and action plans on sustainable energy.
One of ROSE's actions is to create spaces for political-technical dialogue in the region topromote efforts to achieve Agenda 2030 and SDG7.
3.6 Objectives of the "Regional Observatory on Sustainable Energy".

Reunión preparatoria del Foro - Río de Janeiro, EPE – marzo 6, 2018
REGIONAL TECHNICAL FORUM OF ENERGY PLANNERS
1er Foro Técnico de Planificadores Energéticos – Bogotá, Ministerio de Energía y Minas de Colombia, 5-junio-2018
2do Foro Técnico de Planificadores Energéticos – Santiago en CEPAL, 30
octubre 2018

ENERGY PRODUCTION - GENERATION [GWh]
BASE
RE
RE + INT
0
500,000
1,000,000
1,500,000
2,000,000
2,500,000
2018
2019
2020
2021
2022
2023
2024
2025
2026
2027
2028
2029
2030
2031
2032
Biomass
Wind
Solar
Ocean
Nuclear
Mini-Hydro
Hydro
Geothermal
Gas
FuelOil
Diesel
Coal
0
500,000
1,000,000
1,500,000
2,000,000
2,500,000
20
18
20
19
20
20
20
21
20
22
20
23
20
24
20
25
20
26
20
27
20
28
20
29
20
30
20
31
20
32
Biomass
Wind
Solar
Ocean
Nuclear
Mini-Hydro
Hydro
Geothermal
Gas
FuelOil
Diesel
Coal
CONTINENTAL LATIN AMERICA
Renewable Energy Share in % All Hydro (<30% included)
Description:
Horizon:Units:Scenarios:
Notes:
Latin America Electricity Production Mix Forecast15 years [2018-2032]Annual GWh (lossless)-BASE-RE: Renewable Energy -RE+INT: Interconnected and RE ECOSUD update. Central America + Mexico from GoF
2018
2032
74%
0
500,000
1,000,000
1,500,000
2,000,000
2,500,000
2018
2019
2020
2021
2022
2023
2024
2025
2026
2027
2028
2029
2030
2031
2032
Biomass
Wind
Solar
Ocean
Nuclear
Mini-Hydro
Hydro
Geothermal
Gas
FuelOil
Diesel
Coal
0
500,000
1,000,000
1,500,000
2,000,000
2,500,000
2018
2019
2020
2021
2022
2023
2024
2025
2026
2027
2028
2029
2030
2031
2032
Biomass
Wind
Solar
Ocean
Nuclear
Mini-Hydro
Hydro
Geothermal
Gas
FuelOil
Diesel
Coal

TOTAL COSTS: Production + Investment
CONTINENTAL LATIN AMERICA
Description:
Horizon:Units:
Notes:
LATIN AMERICA production and investment costs15 years [2018-2032]Annualized Capital and Operational Costs in Million USDReal annualized costs. Regional discount rate of 8% used for NPV calculations. WACC, economic life project specific. 2016 USD used for all input costs projections
0
10,000
20,000
30,000
40,000
50,000
60,000
70,000
80,000
90,000
20
18
20
19
20
20
20
21
20
22
20
23
20
24
20
25
20
26
20
27
20
28
20
29
20
30
20
31
20
32
MX
CA
BR
SA
SA represents South America
excluding Brazil
BASE
Total Costs
B$852
Generation Costs
FO&M CostTransmission
Build Cost
Annualized total costs in MUSD [M$]
Annualized
Build Cost
BASE
RE-optimistic
Generation Costs
FO&M CostTransmission
Build Cost
Annualized
Build Cost
Generation Costs
FO&M CostTransmission
Build Cost
Annualized
Build Cost
B$466.1 B$203.4
B$0.91B$181.6
0
100,000
200,000
300,000
400,000
500,000
600,000
700,000
800,000
2018
20
19
20
20
20
21
2022
2023
2024
2025
2026
20
27
20
28
20
29
2030
2031
2032
MX
CA
BR
SA0
10,000
20,000
30,000
40,000
50,000
60,000
70,000
80,000
20
18
20
19
20
20
20
21
20
22
20
23
20
24
20
25
20
26
20
27
20
28
20
29
20
30
20
31
20
32
MX
CA
BR
SA
RE
Total Costs
B$817
B$316.7 B$303.4
B$ 2.3B$194.6
RE
B$310.7 B$301.5
B$195.4 B$4.61
Re + INT
Total Costs
B$812
0
10,000
20,000
30,000
40,000
50,000
60,000
70,000
80,000
20
18
20
19
20
20
20
21
20
22
20
23
20
24
20
25
20
26
20
27
20
28
20
29
20
30
20
31
20
32
MX
CA
BR
SA
RE + INT

ECLAC Partners for Sustainable Energy
THANKS