
Energy generation and consumption in Ghana -...
13
Energy generation and consumption in Ghana Conference or Workshop Item Published Version Conference Paper Essah, E. A. (2011) Energy generation and consumption in Ghana. In: West Africa Built Environment Research (WABER) Conference, 19-21 July 2011, Accra, Ghana, pp. 391-401. Available at http://centaur.reading.ac.uk/20973/ It is advisable to refer to the publisher’s version if you intend to cite from the work. Publisher: West Africa Built Environment Research (WABER) Conference Publisher statement: Proceedings of the West Africa Built Environment Research (WABER) Conference 2011 Accra, Ghana, 19-21 July 2011 Editors Dr Samuel Laryea, University of Reading, UK Dr Roine Leiringer, Chalmers University of Technology, Sweden Professor Will Hughes, University of Reading, UK First published 2011 ISBN 978-0-9566060-1-3 Published by West Africa Built Environment Research (WABER) Conference C/o Dr Samuel Laryea School of Construction Management and Engineering University of Reading PO Box 219, Reading, UK RG6 6AW Email: [email protected] © The copyright for papers in this publication belongs to the authors of the papers. Correspondence All correspondence relating to the WABER Conference should be addressed to: Dr Sena Agyepong Central University Accra, Ghana Email: [email protected] Please visit www.waberconference.com for more information Declaration All papers in this publication have been through a review process involving initial screening of abstracts, review by at least two referees,
Transcript of Energy generation and consumption in Ghana -...

Energy generation and consumption in Ghana Conference or Workshop Item
Published Version
Conference Paper
Essah, E. A. (2011) Energy generation and consumption in Ghana. In: West Africa Built Environment Research (WABER) Conference, 1921 July 2011, Accra, Ghana, pp. 391401. Available at http://centaur.reading.ac.uk/20973/
It is advisable to refer to the publisher’s version if you intend to cite from the work.
Publisher: West Africa Built Environment Research (WABER) Conference
Publisher statement: Proceedings of the West Africa Built Environment Research (WABER) Conference 2011 Accra, Ghana, 1921 July 2011 Editors Dr Samuel Laryea, University of Reading, UK Dr Roine Leiringer, Chalmers University of Technology, Sweden Professor Will Hughes, University of Reading, UK First published 2011 ISBN 9780956606013 Published by West Africa Built Environment Research (WABER) Conference C/o Dr Samuel Laryea School of Construction Management and Engineering University of Reading PO Box 219, Reading, UK RG6 6AW Email: [email protected] © The copyright for papers in this publication belongs to the authors of the papers. Correspondence All correspondence relating to the WABER Conference should be addressed to: Dr Sena Agyepong Central University Accra, Ghana Email: [email protected] Please visit www.waberconference.com for more information Declaration All papers in this publication have been through a review process involving initial screening of abstracts, review by at least two referees,

reporting of comments to authors, modifications of papers by authors and reevaluation of resubmitted papers to ensure quality of content.
All outputs in CentAUR are protected by Intellectual Property Rights law, including copyright law. Copyright and IPR is retained by the creators or other copyright holders. Terms and conditions for use of this material are defined in the End User Agreement .
www.reading.ac.uk/centaur
CentAUR
Central Archive at the University of Reading
Reading’s research outputs online
Essah, E.A. (2011) Energy generation and consumption in Ghana In: Laryea, S., Leiringer, R. and
Hughes, W. (Eds) Procs West Africa Built Environment Research (WABER) Conference, 19-21 July
2011, Accra, Ghana, 1-7.
ENERGY GENERATION AND CONSUMPTION IN
GHANA
Emmanuel A. Essah1
School of Construction Management and Engineering, University of Reading, Reading, RG6 6AW, UK
Electricity consumption in Ghana is estimated to be increasing by 10% per annum due
to the demand from the growing population. However, current sources of production
(hydro and thermal facilities) generate only 66% of the current demand. Considering
current trends, it is difficult to substantiate these basic facts, because of the lack of
information. As a result, research into the existing sources of generating electricity,
electricity consumption and prospective projects has been performed. This was
achieved using three key techniques; review of literature, empirical studies and
modelling. The results presented suggest that, current annual installed capacity of
energy generation (i.e. 1960 MW) must be increased to 9,405.59 MW, assuming 85%
plant availability. This is then capable to coop with the growing demand and it would
give access to the entire population as well as support commercial and industrial
activities for the growth of the economy. The prospect of performing this research is
with the expectation to present an academic research agenda for further exploration
into the subject area, without which the growth of the country would be stagnant.
Keywords: energy, electricity generation, electricity consumption, Ghana.
INTRODUCTION
In today’s world, the role of energy generation and consumption cannot be over
emphasised. Energy consumption enhances productivity, economical growth, global
networking as well as its adverse effects on climatic; climatic change. The need for
additional installed capacity of energy source to meet the potential of a country has
continued to be at the forefront of growing economies of many countries. However,
these concepts and principles are yet to be fully harnessed in Ghana.
Electricity consumption in Ghana is estimated to be increasing by 10% per annum due
to the demand from the growing population. However, current baseline production
sources generate only 66% of the current demand. From this, an estimated 65% is
used in the industrial and service sectors while the residential sector accounts for
about 47% of total electricity consumed in the country. Though this does not add up
(certainly there must be justified reason), this is what has been presented in the Energy
Sector Strategy and Development Plan, 2010 (www.ghanaoilwatch.org). This lack of
parity prompts research to enable the validation of available data.
Current data draws on the fact that electricity generation is primarily obtained from
hydropower sources at Akosombo and Kpong Dam located in the Eastern Region of
Ghana and another two thermal power plants using light crude oil at Aboadze near
Second-Takoradi in the Western Region of Ghana (Gand, 2009). Additional
infrastructure has been constructed to boost the capacity, bringing Ghana’s installed 1 [email protected]

Essah
capacity to 1960MW (i.e. 2009 figures) (www.ghanaoilwatch.org). Ghana’s energy
strategy and development plan by 2015 (www.ghanaoilwatch.org) predicts baseline
production to rise to 80%, however it is not clear what percentage of the nation would
have access to electricity. To achieve this increase, the sector raises the following
challenges for additional energy generation sources:
Developing infrastructure for the production and supply of adequate energy
services to meet national requirements and for export.
Developing the requisite infrastructure to ensure universal access as well as the
efficient and reliable supply of energy services.
Ensuring that energy is produced and supplied in a form that has no adverse
health, safety and environmental impact.
These are interesting projections but current trends and statistics indicates that this
may be farfetched within the 2015 targets set by the nation. This paper reviews
existing data and develops detailed analysis that challenges for potential infrastructure
development to meet growing energy demands. It also draws on the expectation to
present an academic research agenda that is yet to be critically explored.
PROJECT RATIONALE
There is enormous potential for Ghana to address the “pressures” of its energy
demand by investigating ways in which similar or other technologies could be viably
adopted to supplement and provide energy to meet the needs of the growing
population. However, without detailed research and commitment to implement its
findings, this potential would not be realised The fact that there are variations in data
regarding the current percentage of the population that has access to electricity raises
concerns and debate regarding the authenticity of data available to the public. Depending on the source from which information is obtained, values of those who
have access are quoted between 50-70% (www.ghanaoilwatch.org;
http://www.modernghana.com). From this, it is estimated that the access to electricity
in the urban areas is 70 % and that to rural areas is approximately 30%
(http://www.modernghana.com). These figures are yet to be substantiated with facts
backed by research.
Undoubtedly, it is clear from the constant “blackouts” that the current national grid
lacks security because of the unpredictable variation in energy sources
(www.ghanaoilwatch.org) or insufficient wholesale electricity supply (excluding
indirect cost) eventually costing the nation between $320 million and $924 million
annually or 2 - 6% of Gross Domestic Product (GDP) (www.adomonline.com). As a
result, the current energy strategy policy of the country (2010) identifies the need for
research to develop additional strategies to improve and modernise transmission and,
distribution infrastructure. This is aimed at developing a non-congested transmission
system by 2015 (www.ghanaoilwatch.org).
STUDY APPROACH
To understand the lapses in data presented and the challenges that face the Energy
Sector, this paper present research that was performed using three effective stages:
Stage 1: Understanding the potential of the current grid infrastructure and its
capability to meet the growing demands: a literature survey.

Energy generation and consumption
41
90
106
159
7062
40
65
0
20
40
60
80
100
120
140
160
180
Per
cen
tag
e (%
)
Accra Tema Kumasi Non-Urban, Non-
Industrial
Peak Demand Energy Consumption
Stage 2: Empirical studies to investigate the countries energy requirements, installed
capacity and energy consumption.
Stage 3: Modelling a photovoltaic system with grid integration as a possible source
of energy generation.
Based on these stages, several recommendations are made with a view to initiate a
rigorous research engagement into the subject area by leading researchers and
academic institutions in Ghana.
IMPACT OF GROWTH: URBAN AND RURAL
Ghana’s 2010 census reported a population of 24.3 million people out of which an
estimated 29% of the population are identified to live in rural areas
(http://unstats.un.org; Yanga and Di Sirio, 2011). Even though rural electrification has
grown substantially (GRIDCo, 2010a), it goes without saying that the urban
population consumes the most. Over the last decade, Ghana experienced annual
growth in peak electricity demand of about 1.4%, from a baseline of 1,258 MW in
2000 to 1,960 MW in 2009, with a corresponding cumulative growth in energy
demand of 3.3% annually from 7,539 GWh in 2000 to 10,116 GWh in 2010
(projected) (GRIDCo, 2010a).The growth rates have been driven largely by three
trends (GRIDCo, 2010a):
Economic growth: Ghana’s GDP grew at an average of 5.5% per annum between
2000 and 2009.
Rapid urbanization: Ghana’s urban population share increased from 44% to 52%
between 2000 and 2010.
VALCO’s demand curtailment: VALCO’s operations have been interrupted
several times over the last 10 years due to the unpredictable nature of the grid
distribution.
Figure 1. Peak Demand and Energy Consumption for key Urban areas; 2000-2009
(Source:GRIDCo,2010a)
Essah
Significantly, Ghana’s three largest cities; Accra, Tema, and Kumasi, have been the
key drivers in increased urban electricity usage, because of the impact of urbanisation.
The total peak electricity demand for these cities rose from 48% in 2000 to 52% in
2009 with a corresponding steady growth of electricity consumption at just over 50%.
The most significant growth was in Tema, where peak demand grew more than 106%
over the 10 year period and energy consumption grew more than 159% (see Figure 1)
(GRIDCo, 2010a; GRIDCo, 2010b).
To sustain this growth, significant development of additional infrastructure is
required. Unless this is developed, the existing infrastructure would not be able to
sustain and/or coop with the prospective demand, as a result the need for research and
investment in this area.
EXISTING INFRASTRUCTURE
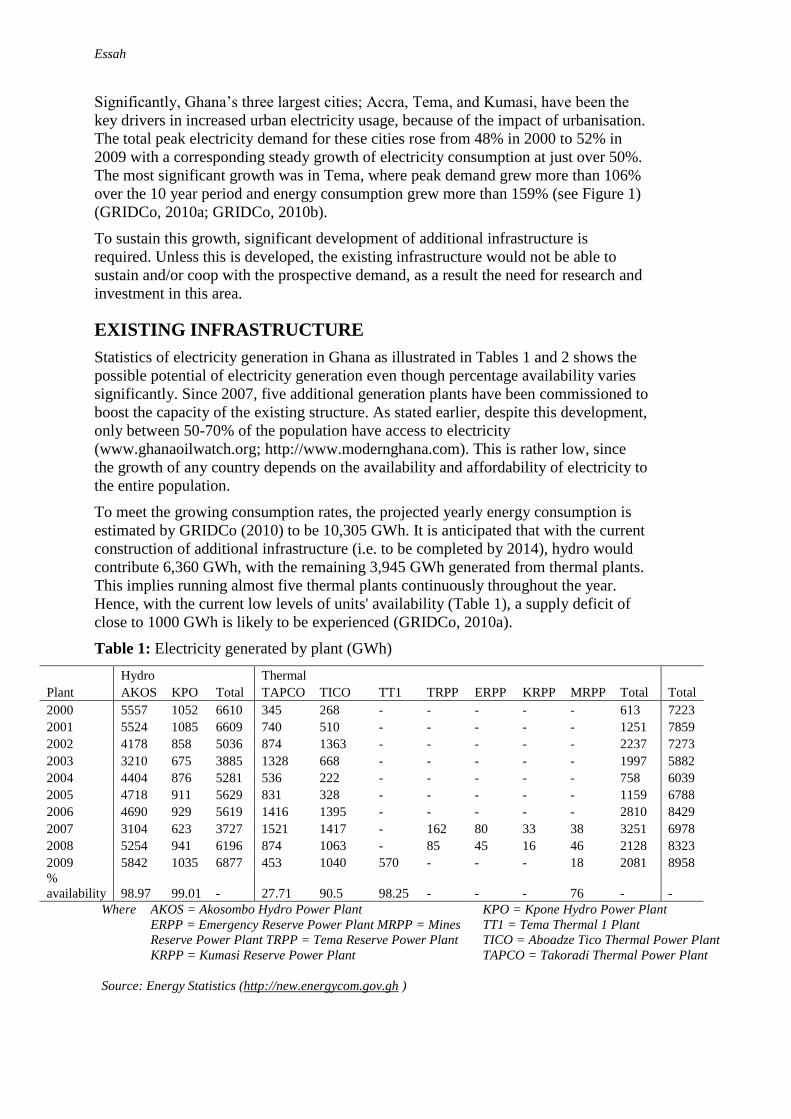
Statistics of electricity generation in Ghana as illustrated in Tables 1 and 2 shows the
possible potential of electricity generation even though percentage availability varies
significantly. Since 2007, five additional generation plants have been commissioned to
boost the capacity of the existing structure. As stated earlier, despite this development,
only between 50-70% of the population have access to electricity
(www.ghanaoilwatch.org; http://www.modernghana.com). This is rather low, since
the growth of any country depends on the availability and affordability of electricity to
the entire population.
To meet the growing consumption rates, the projected yearly energy consumption is
estimated by GRIDCo (2010) to be 10,305 GWh. It is anticipated that with the current
construction of additional infrastructure (i.e. to be completed by 2014), hydro would
contribute 6,360 GWh, with the remaining 3,945 GWh generated from thermal plants.
This implies running almost five thermal plants continuously throughout the year.
Hence, with the current low levels of units' availability (Table 1), a supply deficit of
close to 1000 GWh is likely to be experienced (GRIDCo, 2010a).
Table 1: Electricity generated by plant (GWh)
Plant
Hydro Thermal
Total AKOS KPO Total TAPCO TICO TT1 TRPP ERPP KRPP MRPP Total
2000 5557 1052 6610 345 268 - - - - - 613 7223
2001 5524 1085 6609 740 510 - - - - - 1251 7859
2002 4178 858 5036 874 1363 - - - - - 2237 7273
2003 3210 675 3885 1328 668 - - - - - 1997 5882
2004 4404 876 5281 536 222 - - - - - 758 6039
2005 4718 911 5629 831 328 - - - - - 1159 6788
2006 4690 929 5619 1416 1395 - - - - - 2810 8429
2007 3104 623 3727 1521 1417 - 162 80 33 38 3251 6978
2008 5254 941 6196 874 1063 - 85 45 16 46 2128 8323
2009 5842 1035 6877 453 1040 570 - - - 18 2081 8958
%
availability 98.97 99.01 - 27.71 90.5 98.25 - - - 76 - -
Where AKOS = Akosombo Hydro Power Plant
ERPP = Emergency Reserve Power Plant MRPP = Mines
Reserve Power Plant TRPP = Tema Reserve Power Plant
KRPP = Kumasi Reserve Power Plant
KPO = Kpone Hydro Power Plant
TT1 = Tema Thermal 1 Plant
TICO = Aboadze Tico Thermal Power Plant
TAPCO = Takoradi Thermal Power Plant
Source: Energy Statistics (http://new.energycom.gov.gh )
Energy generation and consumption
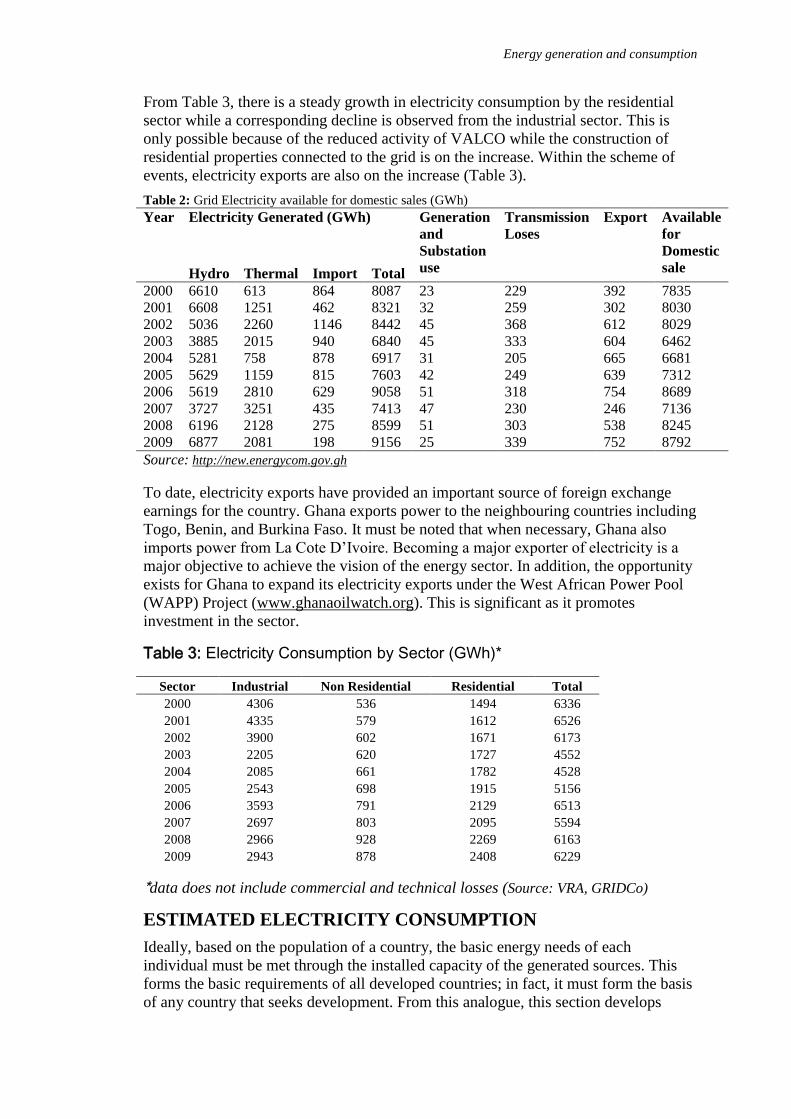
From Table 3, there is a steady growth in electricity consumption by the residential
sector while a corresponding decline is observed from the industrial sector. This is
only possible because of the reduced activity of VALCO while the construction of
residential properties connected to the grid is on the increase. Within the scheme of
events, electricity exports are also on the increase (Table 3).
Table 2: Grid Electricity available for domestic sales (GWh)
Year Electricity Generated (GWh) Generation
and
Substation
use
Transmission
Loses
Export Available
for
Domestic
sale
Hydro Thermal Import Total
2000 6610 613 864 8087 23 229 392 7835
2001 6608 1251 462 8321 32 259 302 8030
2002 5036 2260 1146 8442 45 368 612 8029
2003 3885 2015 940 6840 45 333 604 6462
2004 5281 758 878 6917 31 205 665 6681
2005 5629 1159 815 7603 42 249 639 7312
2006 5619 2810 629 9058 51 318 754 8689
2007 3727 3251 435 7413 47 230 246 7136
2008 6196 2128 275 8599 51 303 538 8245
2009 6877 2081 198 9156 25 339 752 8792
Source: http://new.energycom.gov.gh
To date, electricity exports have provided an important source of foreign exchange
earnings for the country. Ghana exports power to the neighbouring countries including
Togo, Benin, and Burkina Faso. It must be noted that when necessary, Ghana also
imports power from La Cote D’Ivoire. Becoming a major exporter of electricity is a
major objective to achieve the vision of the energy sector. In addition, the opportunity
exists for Ghana to expand its electricity exports under the West African Power Pool
(WAPP) Project (www.ghanaoilwatch.org). This is significant as it promotes
investment in the sector.
Table 3: Electricity Consumption by Sector (GWh)*
*data does not include commercial and technical losses (Source: VRA, GRIDCo)
ESTIMATED ELECTRICITY CONSUMPTION
Ideally, based on the population of a country, the basic energy needs of each
individual must be met through the installed capacity of the generated sources. This
forms the basic requirements of all developed countries; in fact, it must form the basis
of any country that seeks development. From this analogue, this section develops
Sector Industrial Non Residential Residential Total
2000 4306 536 1494 6336
2001 4335 579 1612 6526
2002 3900 602 1671 6173
2003 2205 620 1727 4552
2004 2085 661 1782 4528
2005 2543 698 1915 5156
2006 3593 791 2129 6513
2007 2697 803 2095 5594
2008 2966 928 2269 6163
2009 2943 878 2408 6229

Essah
simple equations to analyse the actual demand and deficit of electricity supply
required to meet the needs of the current population of Ghana. Assuming all the
electricity consumption requirements of Ghana are met,
Basic Equations
These equations are developed to assess the consumption of household appliances,
assuming every individual has access to a range of basic appliances as would be in
any home.
dayhoursquantityWARdayWhCPD onsWa /)()/( (1)
1000)/(
yeartheofDaysCPDyearkWhCPA onswa
onswnn
(2)
Where DaPwCons = Power Consumption/day; Wh/day
AnnPwCons = Annual Power Consumption; kWh/year
AR = Appliance Ratings; W
Note:
These equations do not take into account losses due to inefficient appliances and or
transmission losses.
From the carbon independent review of UK, annual average electricity consumption is
4,800 kWh per 4 person household. A smaller than average household (2 person
household) is taken arbitrarily to be 3,000 kWh, and a larger than average household
(5+ person household) accounts for about 7,000 kWh (www.carbonindependent.org).
Since similar statistics is not available through the statistics division of Ghana, a
simple empirical study was carried out to estimate average energy consumption of a
household (4 persons).
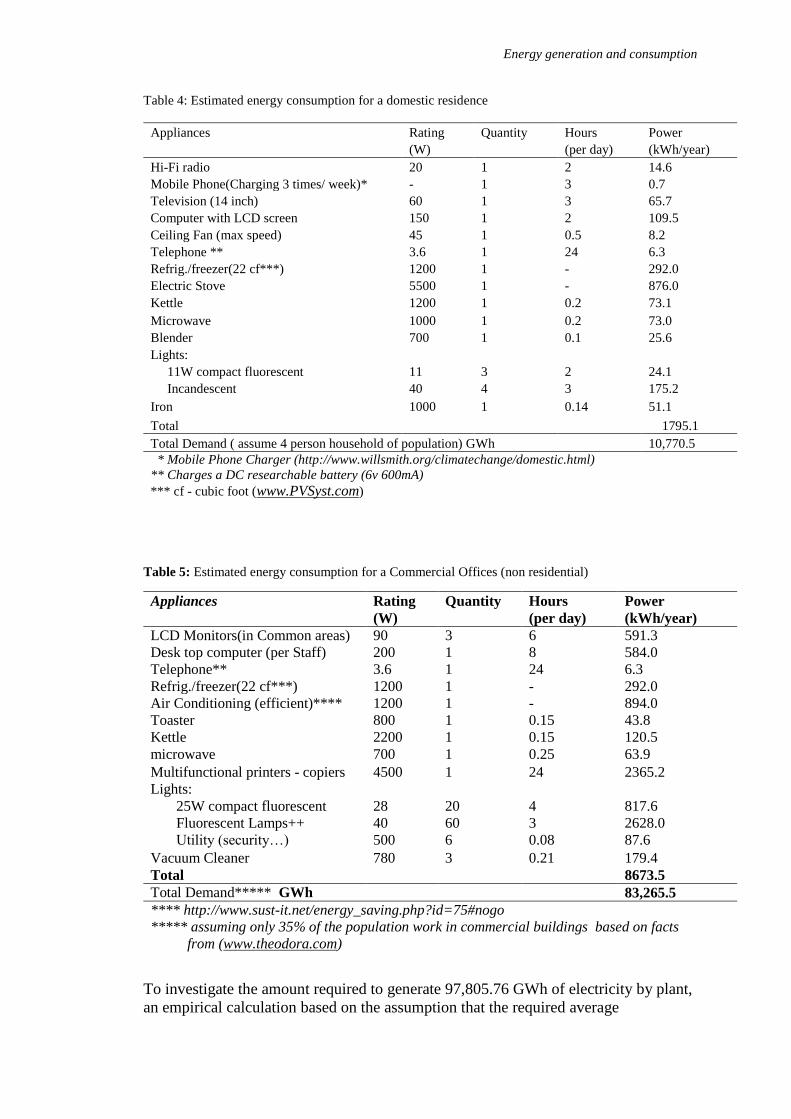
The study collates data within a domestic (residential) sector (Table 4) and non
residential sector (using a virtual commercial office) as a case study (Table 5). Tables
4 and 5 were developed using Equations 1 and 2. From the study (Table 4) it was
estimated that an average household of 4 persons consumes at least 1795.1 kWh/year
of electricity. This is approximately 1/4th
the limits consumed in UK. It must be noted
that most of the data used to generate the results in Table 4 were based on updates
from general review appliances reported by Energy Foundation, Ghana (www.
ghanaef.org) in comparison with the researcher’s current domestic appliances and
other relevant sites. Generally, comparing the yearly household (residential) values of
2408 GWh in 2009 (Table 3) the country requires additional electricity generation
plants that would contribute to ~ 4.5 times more than the current annual average; 2408
GWh. This would then agree with the estimated residential electricity consumption of
10,771 GWh (Table 4).
The total energy required (estimated in Table 4 and 5) for the domestic and
commercial sector is 94,036.1 GWh. From Table 3, the industrial sector requires an
additional 35% (on average) of the residential sector. This implies that to address the
electricity consumption required by the population and for economic growth, the
annual total energy required is 97,805.76 GWh. This is ~ 11 times more than the
current available electricity for domestic sale (Table 2) and ~ 9.5 times more than the
projected electricity consumption estimated at 10,305 GWh.
Energy generation and consumption
Table 4: Estimated energy consumption for a domestic residence
Appliances Rating Quantity Hours Power
(W) (per day) (kWh/year)
Hi-Fi radio 20 1 2 14.6
Mobile Phone(Charging 3 times/ week)* - 1 3 0.7
Television (14 inch) 60 1 3 65.7
Computer with LCD screen 150 1 2 109.5
Ceiling Fan (max speed) 45 1 0.5 8.2
Telephone ** 3.6 1 24 6.3
Refrig./freezer(22 cf***) 1200 1 - 292.0
Electric Stove 5500 1 - 876.0
Kettle 1200 1 0.2 73.1
Microwave 1000 1 0.2 73.0
Blender 700 1 0.1 25.6
Lights:
11W compact fluorescent 11 3 2 24.1
Incandescent 40 4 3 175.2
Iron 1000 1 0.14 51.1
Total 1795.1
Total Demand ( assume 4 person household of population) GWh 10,770.5
* Mobile Phone Charger (http://www.willsmith.org/climatechange/domestic.html)
** Charges a DC researchable battery (6v 600mA)
*** cf - cubic foot (www.PVSyst.com)
Table 5: Estimated energy consumption for a Commercial Offices (non residential)
Appliances Rating Quantity Hours Power
(W) (per day) (kWh/year)
LCD Monitors(in Common areas) 90 3 6 591.3
Desk top computer (per Staff) 200 1 8 584.0
Telephone** 3.6 1 24 6.3
Refrig./freezer(22 cf***) 1200 1 - 292.0
Air Conditioning (efficient)**** 1200 1 - 894.0
Toaster 800 1 0.15 43.8
Kettle 2200 1 0.15 120.5
microwave 700 1 0.25 63.9
Multifunctional printers - copiers 4500 1 24 2365.2
Lights:
25W compact fluorescent 28 20 4 817.6
Fluorescent Lamps++ 40 60 3 2628.0
Utility (security…) 500 6 0.08 87.6
Vacuum Cleaner 780 3 0.21 179.4
Total 8673.5
Total Demand***** GWh 83,265.5
**** http://www.sust-it.net/energy_saving.php?id=75#nogo
***** assuming only 35% of the population work in commercial buildings based on facts
from (www.theodora.com)
To investigate the amount required to generate 97,805.76 GWh of electricity by plant,
an empirical calculation based on the assumption that the required average
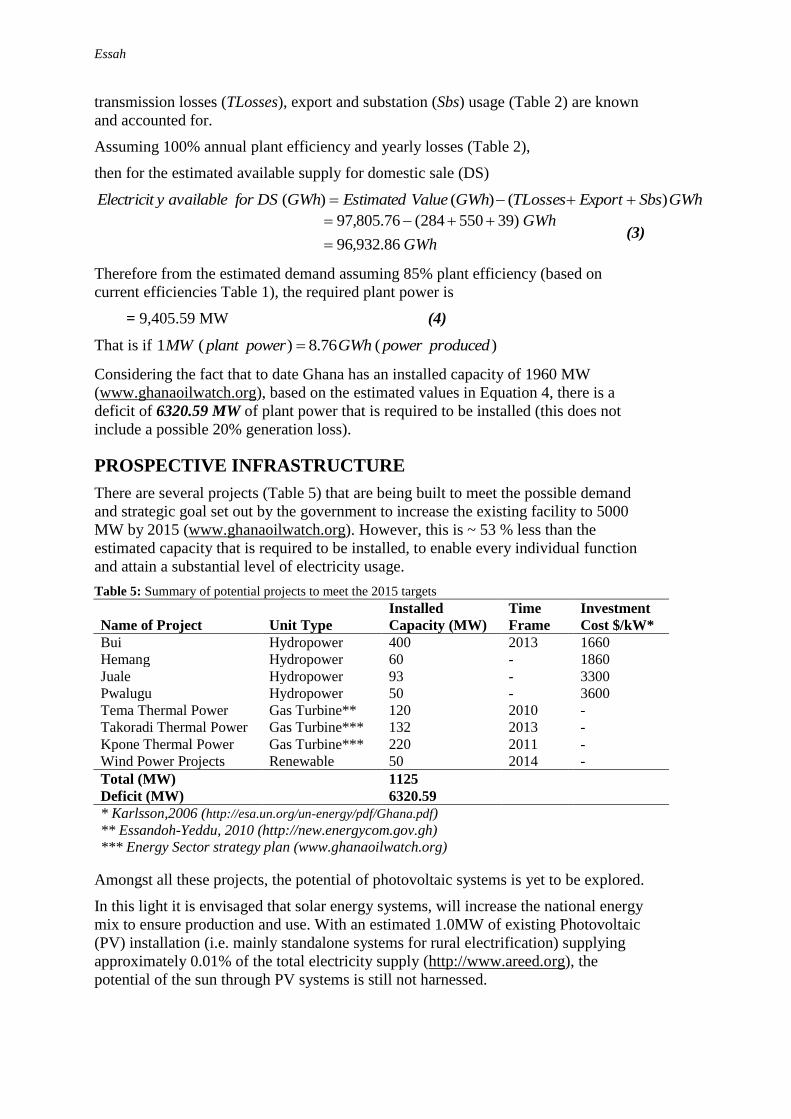
Essah
transmission losses (TLosses), export and substation (Sbs) usage (Table 2) are known
and accounted for.
Assuming 100% annual plant efficiency and yearly losses (Table 2),
then for the estimated available supply for domestic sale (DS)
GWhSbsExportTLossesGWhValueEstimatedGWhDSforavailableyElectricit )()()(
GWh
GWh
86.932,96
)39550284(76.805,97
(3)
Therefore from the estimated demand assuming 85% plant efficiency (based on
current efficiencies Table 1), the required plant power is
= 9,405.59 MW (4)
That is if )(76.8)(1 producedpowerGWhpowerplantMW
Considering the fact that to date Ghana has an installed capacity of 1960 MW
(www.ghanaoilwatch.org), based on the estimated values in Equation 4, there is a
deficit of 6320.59 MW of plant power that is required to be installed (this does not
include a possible 20% generation loss).
PROSPECTIVE INFRASTRUCTURE
There are several projects (Table 5) that are being built to meet the possible demand
and strategic goal set out by the government to increase the existing facility to 5000
MW by 2015 (www.ghanaoilwatch.org). However, this is ~ 53 % less than the
estimated capacity that is required to be installed, to enable every individual function
and attain a substantial level of electricity usage.
Table 5: Summary of potential projects to meet the 2015 targets
Name of Project Unit Type
Installed
Capacity (MW)
Time
Frame
Investment
Cost $/kW*
Bui Hydropower 400 2013 1660
Hemang Hydropower 60 - 1860
Juale Hydropower 93 - 3300
Pwalugu Hydropower 50 - 3600
Tema Thermal Power Gas Turbine** 120 2010 -
Takoradi Thermal Power Gas Turbine*** 132 2013 -
Kpone Thermal Power Gas Turbine*** 220 2011 -
Wind Power Projects Renewable 50 2014 -
Total (MW) 1125
Deficit (MW) 6320.59
* Karlsson,2006 (http://esa.un.org/un-energy/pdf/Ghana.pdf)
** Essandoh-Yeddu, 2010 (http://new.energycom.gov.gh)
*** Energy Sector strategy plan (www.ghanaoilwatch.org)
Amongst all these projects, the potential of photovoltaic systems is yet to be explored.
In this light it is envisaged that solar energy systems, will increase the national energy
mix to ensure production and use. With an estimated 1.0MW of existing Photovoltaic
(PV) installation (i.e. mainly standalone systems for rural electrification) supplying
approximately 0.01% of the total electricity supply (http://www.areed.org), the
potential of the sun through PV systems is still not harnessed.
Energy generation and consumption
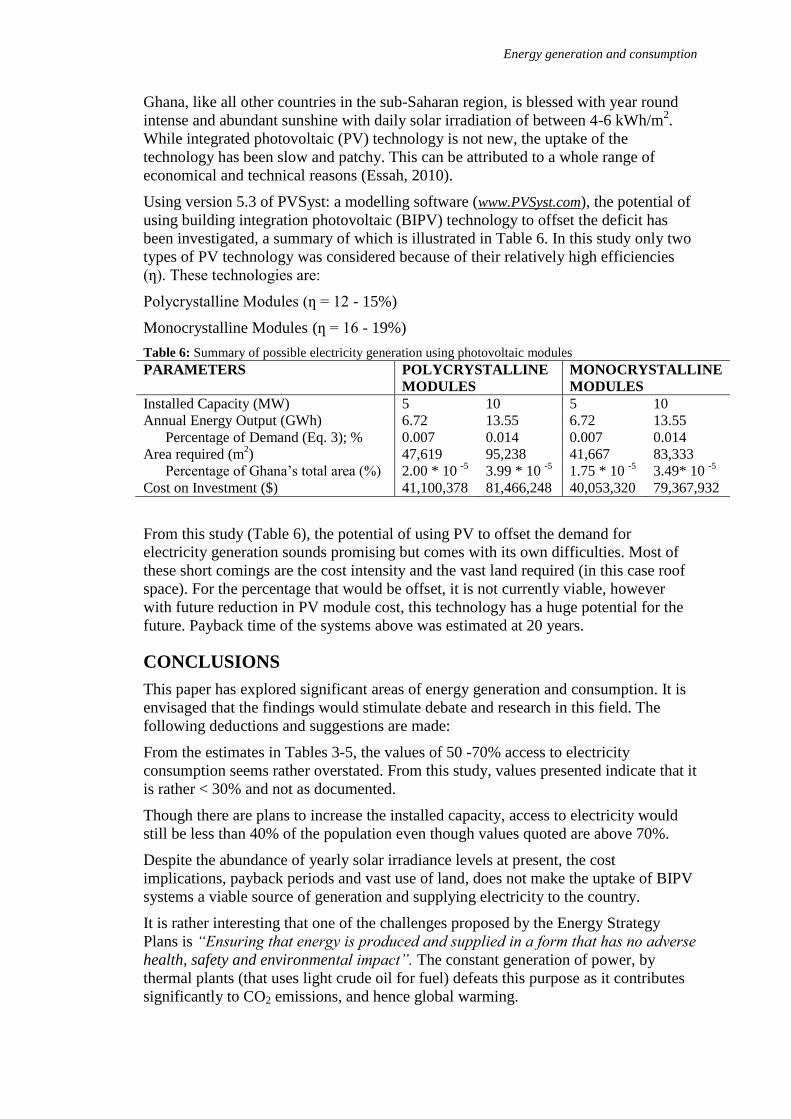
Ghana, like all other countries in the sub-Saharan region, is blessed with year round
intense and abundant sunshine with daily solar irradiation of between 4-6 kWh/m2.
While integrated photovoltaic (PV) technology is not new, the uptake of the
technology has been slow and patchy. This can be attributed to a whole range of
economical and technical reasons (Essah, 2010).
Using version 5.3 of PVSyst: a modelling software (www.PVSyst.com), the potential of
using building integration photovoltaic (BIPV) technology to offset the deficit has
been investigated, a summary of which is illustrated in Table 6. In this study only two
types of PV technology was considered because of their relatively high efficiencies
(ƞ). These technologies are:
Polycrystalline Modules (ƞ = 12 - 15%)
Monocrystalline Modules (ƞ = 16 - 19%)
Table 6: Summary of possible electricity generation using photovoltaic modules
PARAMETERS POLYCRYSTALLINE
MODULES
MONOCRYSTALLINE
MODULES
Installed Capacity (MW) 5 10 5 10
Annual Energy Output (GWh) 6.72 13.55 6.72 13.55
Percentage of Demand (Eq. 3); % 0.007 0.014 0.007 0.014
Area required (m2) 47,619 95,238 41,667 83,333
Percentage of Ghana’s total area (%) 2.00 * 10 -5
3.99 * 10 -5
1.75 * 10 -5
3.49* 10 -5
Cost on Investment ($) 41,100,378 81,466,248 40,053,320 79,367,932
From this study (Table 6), the potential of using PV to offset the demand for
electricity generation sounds promising but comes with its own difficulties. Most of
these short comings are the cost intensity and the vast land required (in this case roof
space). For the percentage that would be offset, it is not currently viable, however
with future reduction in PV module cost, this technology has a huge potential for the
future. Payback time of the systems above was estimated at 20 years.
CONCLUSIONS
This paper has explored significant areas of energy generation and consumption. It is
envisaged that the findings would stimulate debate and research in this field. The
following deductions and suggestions are made:
From the estimates in Tables 3-5, the values of 50 -70% access to electricity
consumption seems rather overstated. From this study, values presented indicate that it
is rather < 30% and not as documented.
Though there are plans to increase the installed capacity, access to electricity would
still be less than 40% of the population even though values quoted are above 70%.
Despite the abundance of yearly solar irradiance levels at present, the cost
implications, payback periods and vast use of land, does not make the uptake of BIPV
systems a viable source of generation and supplying electricity to the country.
It is rather interesting that one of the challenges proposed by the Energy Strategy
Plans is “Ensuring that energy is produced and supplied in a form that has no adverse
health, safety and environmental impact”. The constant generation of power, by
thermal plants (that uses light crude oil for fuel) defeats this purpose as it contributes
significantly to CO2 emissions, and hence global warming.

Essah
It is evident that there is very little or no research, in this area hence the variation in
information that has been made available through the net amongst others.
Suggestions
It would be beneficial if such statistics are made available to the public to ensure
wider knowledge of the field.
Ideally data for domestic homes across the country must be made available. Possible
investigation into the energy consumption of typical houses with 2, 4, 6 person
household, throughout all regions.
Similar research and data collection for commercial buildings, educational
establishments must also be considered.
Possible development of a carbon footprint for the country can be investigated.
The results presented in this research paper enhance the understanding of varying
parameters associated with energy generation and consumption in Ghana. This study is
designed to develop an essence of recognising the lack of information in this field to the
general public and the need to research and invest in the subject area.
REFERENCES
Electrical Power in Ghana - Overview
Available at: http://www.mbendi.com/indy/powr/af/gh/p0005.htm
[Cited: May 2011]
Energy Foundation: Cost of Using Appliances
Available at: http://www.ghanaef.org/energyinghana/costofusingappliances.htm
[Cited: May 2011]
Energy Statistics (2000 – 2009)
Available at: http://new.energycom.gov.gh/downloads/statistics2000-2009.pdf
[Cited: May 2011]
Erratic electricity costs Ghana 924 million dollars (source Daily Graphic)
Available at:
http://adomonline.com/index.php?option=com_content&view=article&id=530:erratic
-electricity-costs-ghana-924-million-dollars
[Cited: May 2011]
Essah, E.A. (2010) Building integration photovoltaic module with reference to Ghana: using
triple junction amorphous silicon. Proceedings of the West Africa Built Environment
Research (WABER) Conference, 27-28 July 2010, Accra, Ghana, 203-214.
Essandoh-Yeddu, J.K., (2010). Energy Commission, Ghana. 2010 Energy (Supply And
Demand) Outlook for Ghana
Available at: http://new.energycom.gov.gh/downloads/2010Energy_Outlook.pdf
[Cited: January 2011]
Gand, E.K. (2009), Country profile for Ghana
Available at: http://www.setatwork.eu/downloads/SETatWork_Ghana_Profile_0910.pdf
[Cited: May 2011]
Ghana Overview
Available at: http://www.areed.org/country/ghana/ghana.pdf)
[Cited: November 2010]
Ghana People 2011
Source: 2011 CIA World Factbook and Other Sources
Available at: http://www.theodora.com/wfbcurrent/ghana/ghana_people.html
[Cited: November 2010]
Ghana wholesale power reliability assessment 2010 (GRIDCo), Final Report, March 2010b

Energy generation and consumption
Available at:
http://www.gridcogh.com/site/downloads/27a623e256c7d94a7dce43d5ef82d3e3Grid
CoReportFinal.pdf
[Cited: May 2011]
Home energy source
Available at: http://www.carbonindependent.org/sources_home_energy.htm
[Cited: May 2011]
Karlsson.M., (2006). Assessing Policy Options For Increasing the Use Of Renewable Energy
for Sustainable Development: Modelling Energy Scenarios for Ghana (A UN-Energy
Demonstration Study)
Available at: http://esa.un.org/un-energy/pdf/Ghana.pdf
[Cited: January 2011]
Ministry of Energy, National Energy Policy (2010), Republic of Ghana
Available at:
http://www.ghanaoilwatch.org/images/laws/national_energy_policy.pdf
[Cited: January 2011]
Ministry of Energy. Energy Sector Strategy and Development Plan, Republic Of
Ghana
Available at: http://www.ghanaoilwatch.org/images/laws/energy_strategy.pdf
[Cited: January 2011]
PVsyst: Software for Photovoltaic Systems
Available at: www.PVsyst.com
[Cited: January 2011]
2010 Electricity Supply Plan, Ghana Grid Company Limited (GRIDCo), 2010a
Available at:
http://www.gridcogh.com/site/downloads/a22932efb1446463338be7d7f793dc6d2010
-Electricity-Supply-Plan.pdf
[Cited: May 2011]
2010 Population and Housing Census. Provisional Results Ghana Statistical Service
(February, 2011)
Available at:
http://unstats.un.org/unsd/demographic/sources/census/2010_PHC/Ghana/Provisional
_results.pdf
[Cited: January 2011]
VRA to increase electricity supply
Available at: http://www.modernghana.com/news/326464/1/vra-to-increase-electricity-
supply.html
[Cited: May 2011]
Yanga.T and Di Sirio. P.(2011). Draft Country Programme Ghana 200247 (2012–2016
Available at: http://one.wfp.org/eb/docs/2011/wfp234689~1.pdf
[Cited: May 2011]