Energy Forecasting of Bangladesh in Gas Sector Using LEAP...
7
© 2011 Shahidul I. Khan, Asif Islam, Alimul Haque Khan.This is a research/review paper, distributed under the terms of the Creative Commons Attribution-Noncommercial 3.0 Unported License http://creativecommons.org/licenses/by-nc/3.0/), permitting all non-commercial use, distribution, and reproduction inany medium, provided the original work is properly cited. Global Journal of Researches in Engineering Volume 11 Issue 1 Type: Double Blind Peer Reviewed International Research Journal Publisher: Global Journals Inc. (USA) Energy Forecasting of Bangladesh in Gas Sector Using LEAP Software By Shahidul I. Khan, Asif Islam, Alimul Haque Khan Bangladesh University of Engineering & Technology, Energypac Engineering Ltd., International Islamic University of Chittagong Abstract- This paper represents the first application of Long-Range Energy Alternative Planning (LEAP) software in energy forecasting of gas sector in Bangladesh. LEAP is used to take government decisions in many developed countries. In this work, at first the data on amount of gas consumption in different sectors of Bangladesh have been collected from year 1993 up-to year 2007. Then using ‘Linear’ and ‘Exponential’ time series wizard, gas consumption of these sectors has been forecasted up-to year 2020. Comparison between the results of forecasted data using aforementioned two time-series wizards have been discussed. The most acceptable forecasting model and why it wasn’t used in this work have also been discussed thoroughly. Keywords: Energy Forecast, Exponential Forecast, Linear Forecast, Logistic Forecast, Long Range Energy Alternative Planning (LEAP) Classification: GJRE-J FOR Classification: 850103 EnergyForecastingofBangladeshinGasSectorUsingLEAPSoftware Strictly as per the compliance and regulations of: Version 1.0 February 2011 ISSN: 0975-5861
Transcript of Energy Forecasting of Bangladesh in Gas Sector Using LEAP...
© 2011 Shahidul I. Khan, Asif Islam, Alimul Haque Khan.This is a research/review paper, distributed under the terms of the Creative Commons Attribution-Noncommercial 3.0 Unported License http://creativecommons.org/licenses/by-nc/3.0/), permitting all non-commercial use, distribution, and reproduction inany medium, provided the original work is properly cited.
Global Journal of Researches in Engineering Volume 11 Issue 1 Type: Double Blind Peer Reviewed International Research Journal Publisher: Global Journals Inc. (USA)
Energy Forecasting of Bangladesh in Gas Sector Using LEAP Software
By Shahidul I. Khan, Asif Islam, Alimul Haque Khan Bangladesh University of Engineering & Technology, Energypac Engineering Ltd., International Islamic
University of Chittagong Abstract- This paper represents the first application of Long-Range Energy Alternative Planning (LEAP) software in energy forecasting of gas sector in Bangladesh. LEAP is used to take government decisions in many developed countries. In this work, at first the data on amount of gas consumption in different sectors of Bangladesh have been collected from year 1993 up-to year 2007. Then using ‘Linear’ and ‘Exponential’ time series wizard, gas consumption of these sectors has been forecasted up-to year 2020. Comparison between the results of forecasted data using aforementioned two time-series wizards have been discussed. The most acceptable forecasting model and why it wasn’t used in this work have also been discussed thoroughly.
Keywords: Energy Forecast, Exponential Forecast, Linear Forecast, Logistic Forecast, Long Range Energy Alternative Planning (LEAP)
Classification: GJRE-J FOR Classification: 850103
Energy Forecasting of Bangladesh in Gas Sector Using LEAP Software
Strictly as per the compliance and regulations of:
Version 1.0 February 2011
ISSN: 0975-5861

©2011 Global Journals Inc. (US)
Globa
l Jo
urna
l of R
esea
rche
s in E
nginee
ring
Volum
e XI Issu
e I Version
I
15
Energy Forecasting of Bangladesh in Gas Sector Using LEAP Software
Shahidul I. Khan1, Asif Islam2, Alimul Haque Khan3
Abstract -
This paper represents the first application of Long-Range Energy Alternative Planning (LEAP) software in energy forecasting of gas sector in Bangladesh. LEAP is used to take government decisions in many developed
countries. In this work, at first the data on amount of gas consumption in different sectors of Bangladesh have been collected from year 1993 up-to year 2007. Then using ‘Linear’ and ‘Exponential’ time series wizard, gas consumption of these sectors has been forecasted up-to year 2020. Comparison between the results of forecasted data using aforementioned two time-series wizards have been discussed. The most acceptable forecasting model and why it wasn’t used in this work have also been discussed thoroughly.
Keyword: Energy Forecast, Exponential Forecast, Linear
Forecast, Logistic Forecast, Long Range Energy Alternative Planning (LEAP)
I.
INTRODUCTION EAP –
Long-range Energy Alternative Planning is a
widely-used software tool for energy policy analysis and climate change mitigation assessment
developed at the Stockholm Environment Institute (SEI). LEAP has been adopted by hundreds of organizations in more than 150 countries worldwide. Its users include government agencies, academics, non-governmental organizations, consulting companies and energy utilities. It has been used at many different scales ranging from cities and states to national, regional and global applications.
The United Nations recently
announced that more than 85 countries have chosen to use
LEAP as part of their commitment to report to the
U.N. Framework Convention on Climate Change (UNFCCC) [1].
II.
GAS SECTOR OF BANGLADESH Energy consumption in Bangladesh constitutes
only 0.1 per cent of total world energy consumption. Consumption of commercial energy makes up about half of total energy consumption, somewhat less than other South Asian countries, but its absolute level is very
About1-
Bangladesh University of Engineering & Technology (BUET)
About2-
Energypac Engineering Ltd.
E-Mail- [email protected]
About3-
International Islamic University of Chittagong (IIUC)
E-Mail- [email protected]
Figure 1: Gas Consumption in Bangladesh in 1998[2]
low even in comparison with the low South Asian standard. The two most important energy intensive sectors are transport and industry, accounting for around 50% and 43% of total commercial energy use in the country.
Before the discovery of significant quantities of natural gas, energy supply depended on limited domestic hydroelectricity and coal or fuel-driven power generation based on imports. Gas is currently the only indigenous non-renewable energy resource in the country that is produced and consumed in significant quantities [3]. Gas production is concentrated in the hands of four suppliers: two of them are international oil companies and two are national companies. The International Oil Companies (IOC) produce a quarter of total production – Shell produces 16% of the total while Unocal accounts for the remaining 9%. The rest is produced by two Petrobangla firms. Total production has on average increased by 7.1% per year during the last decade and daily production is 900 million cubic feet. Arrangements with international oil companies are regulated through production sharing agreements. The IOCs cover all the costs of exploration and production.
L
Febr
uary
2011
FFF

©2011 Global Journals Inc. (US)
Globa
l Jo
urna
l of R
esea
rche
s in E
nginee
ring
V
olum
e XI Issu
e I Version
I
2
Figure 2: Yearly Gas Production in Bangladesh [2]
III. ENERGY FORECASTING A state energy forecast is a measurement and
estimate of historic, current and projected patterns of energy supply and demand within a state. The baseline or Business As Usual (BAU) forecast illustrates what state energy use will look like in the absence of additional policies beyond what is already planned.
There are six steps involved in creating a baseline forecast:
1. Define objectives and constraints of the forecast.
2. Compile historical energy consumption and generation data into a baseline profile.
3. Choose method to forecast the energy baseline. 4. Develop or review assumptions. 5. Apply the method. 6. Evaluate forecast output
Figure 3: Flowchart Showing Steps to Forecast Energy [4]
1991 1992 1993 1994 1995 1996 1997 1998 1999 2000
Febr
uary
2011
FFF
Energy Forecasting of Bangladesh in Gas Sector Using LEAP Software
©2011 Global Journals Inc. (US)
IV.
BACKGROUND OF LEAP
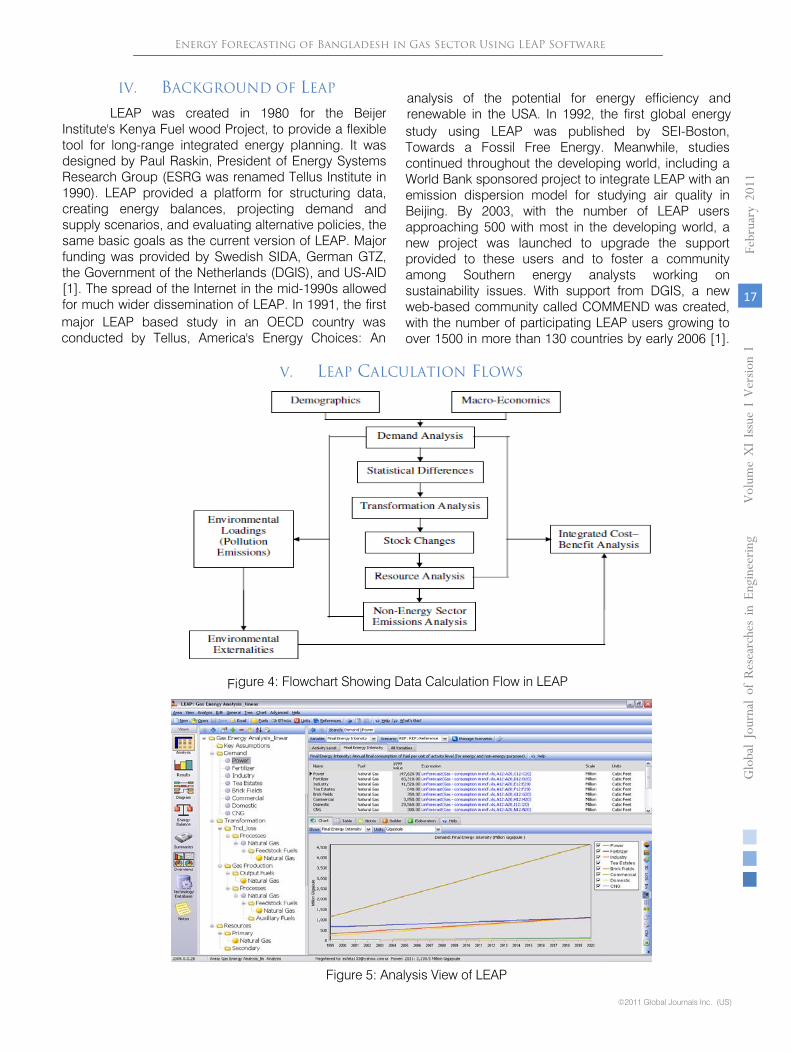
LEAP was created in 1980 for the Beijer Institute's Kenya Fuel wood Project, to provide a flexible tool for long-range integrated energy planning. It was designed by Paul Raskin, President of Energy Systems Research Group (ESRG was renamed Tellus Institute in 1990). LEAP provided a platform for structuring data, creating energy balances, projecting demand and supply scenarios, and evaluating alternative policies, the same basic goals as the current version of LEAP. Major funding was provided by Swedish SIDA, German GTZ, the Government of the Netherlands (DGIS), and US-AID [1]. The spread of the Internet in the mid-1990s allowed for much wider dissemination of LEAP. In 1991, the first major LEAP based study in an OECD country was conducted by Tellus, America's Energy Choices: An
analysis of the potential for energy efficiency and renewable in the USA. In 1992, the first global energy study using LEAP was published by SEI-Boston, Towards a Fossil Free Energy. Meanwhile, studies continued throughout the developing world, including a World Bank sponsored project to integrate LEAP with an emission dispersion model for studying air quality in Beijing. By 2003, with the number of LEAP users approaching 500 with most in the developing world, a new project was launched to upgrade the support provided to these users and to foster a community among Southern energy analysts working on sustainability issues. With support from DGIS, a new web-based community called COMMEND was created, with the number of participating LEAP users growing to over 1500 in more than 130 countries by early 2006 [1].
V.
LEAP CALCULATION FLOWS
Figure 4: Flowchart Showing Data Calculation Flow in LEAP
Gl oba
l Jo
urna
l of R
esea
rche
s in E
nginee
ring
Volum
e XI Issu
e I Version
I
17
Figure 5: Analysis View of LEAP
Energy Forecasting of Bangladesh in Gas Sector Using LEAP Software
Febr
uary
2011
FFF

©2011 Global Journals Inc. (US)
Gl oba
l Jo
urna
l of R
esea
rche
s in E
nginee
ring
Volum
e XI Issu
e I Version
I
18
VI.
DATA REQUIREMENT
For Energy Planning &
Mitigation Assessment, six types of data are required [11] as input to LEAP. These are:
1)
Demographic Data
2)
Economic Data
3)
General Energy Data
4)
Demand Data
5)
Transformation Data
6)
Fuels Data
VII.
TIME-SERIES WIZARD
There are six types of Time-Series [11] Wizard available for energy forecasting in LEAP. These are:
1)
Interpolation
2)
Step-Function
3)
Linear Forecasting
4)
Exponential Forecasting
5)
Logistic Forecasting
6)
Smooth-Curve
Figure 6: General Accounting Framework of LEAP
VIII.
ACCUMULATED DATA
Sector-wise consumption of natural gas [5]-[10], [12]-[15] in BCF (Billion Cubic Feet)
Year
Power
Fertilizer
Industry Tea Estates
Brick Fields
Commercial
Domestic
CNG
1993
97.3
74.5
20.26
0.70
0 2.87
15.4
0 1994
102.4
80.5
24.24
0.60
0 2.88
18.86
0 1995
110.9
90.98
27.31
0.72
0.99
3.00
20.71
0 1996
110.82
77.83
28.62
0.71
0.48
4.49
22.84
0 1997
123.55
80.07
32.32
0.74
0.39
4.61
24.89
0 1998
140.82
82.71
35.79
0.71
0.35
4.71
27.02
0 1999
147.62
83.31
41.52
0.64
0.35
3.85
29.56
0 2000
175.27
88.43
47.99
0.65
0.44
4.06
31.85
0 2001
190.03
78.78
53.56
0.72
0.53
4.25
36.74
0 2002
190.54
95.89
63.76
0.74
0.52
4.56
44.8
0.23
2003
199.4
92.8
46.59
0.82
0.12
4.83
49.22
1.94
2004
210.67
94.14
51.63
0.84
0
5.1
52.37
3.55
2005
233.6
98.91
68.98
0.8
0.1
5.5
59.45
4.5
2006
247.8
98.91
79.99
0.1
0.1
5.8
65.41
5.2
2007
268.3
107.3
86
4.5
0.1
6.3
72
5.6
Energy Forecasting of Bangladesh in Gas Sector Using LEAP SoftwareFe
brua
ry20
11FFF
©2011 Global Journals Inc. (US)
IX.
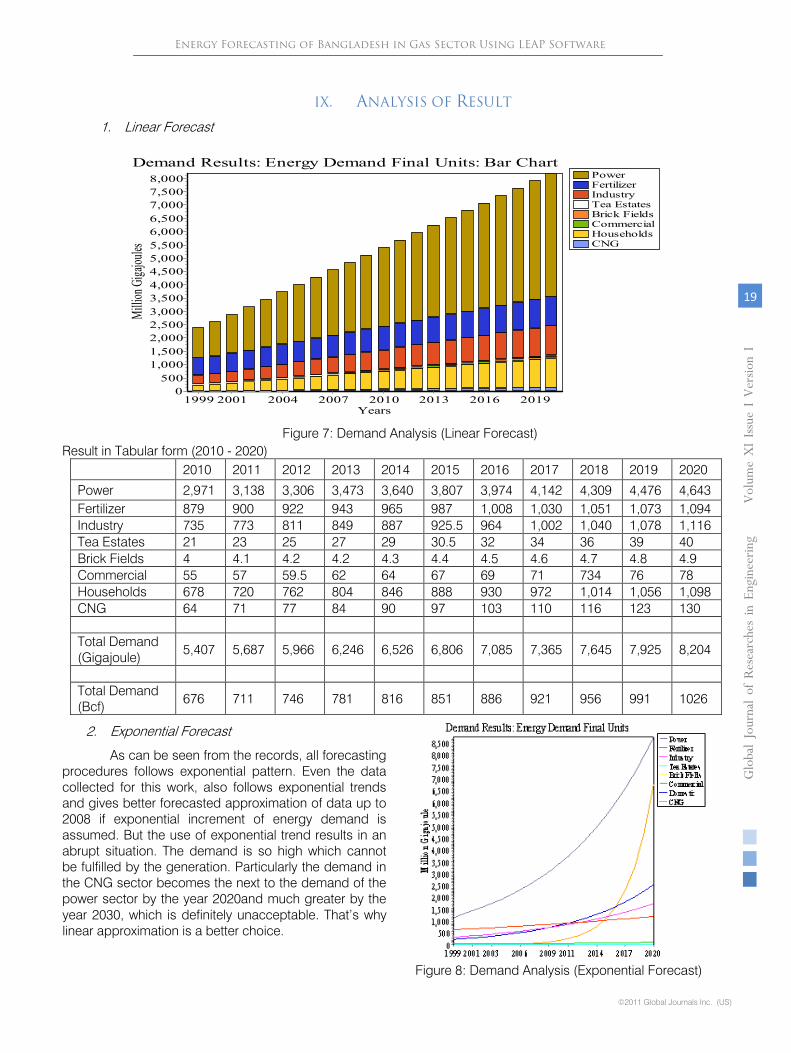
ANALYSIS OF RESULT
1.
Linear Forecast
Figure 7: Demand Analysis (Linear Forecast)
Result in Tabular form (2010 - 2020)
2010
2011
2012
2013
2014
2015
2016
2017
2018
2019
2020
Power
2,971
3,138
3,306
3,473
3,640
3,807
3,974
4,142
4,309
4,476
4,643
Fertilizer
879
900
922
943
965
987
1,008
1,030
1,051
1,073
1,094
Industry 735
773
811
849
887
925.5
964
1,002
1,040
1,078
1,116
Tea Estates
21
23
25
27
29
30.5
32
34
36
39
40
Brick Fields
4 4.1
4.2
4.2
4.3
4.4
4.5
4.6
4.7
4.8
4.9
Commercial
55
57
59.5
62
64
67
69
71
734
76
78
Households
678
720
762
804
846
888
930
972
1,014
1,056
1,098
CNG
64
71
77
84
90
97
103
110
116
123
130
Total Demand (Gigajoule)
5,407
5,687
5,966
6,246
6,526
6,806
7,085
7,365
7,645
7,925
8,204
Total Demand (Bcf)
676
711
746
781
816
851
886
921
956
991
1026
2.
Exponential Forecast
As can be seen from the records, all forecasting procedures follows exponential pattern. Even the data collected for this work, also follows exponential trends and gives better forecasted approximation of data up to 2008 if exponential increment of energy demand is assumed. But the use of exponential trend results in an abrupt situation. The demand is so high which cannot be fulfilled by the generation. Particularly the demand in the CNG sector becomes the next to the demand of the power sector by the year 2020and much greater by the year 2030, which is definitely unacceptable. That’s why linear approximation is a better choice.
PowerFertilizerIndustryTea EstatesBrick FieldsCommercialHouseholdsCNG
Demand Results: Energy Demand Final Units: Bar Chart
Years1999 2001 2004 2007 2010 2013 2016 2019
Millio
n Giga
joules
8,0007,5007,0006,5006,0005,5005,0004,5004,0003,5003,0002,5002,0001,5001,000
5000
Figure 8: Demand Analysis (Exponential Forecast)
Globa
l Jo
urna
l of R
esea
rche
s in E
nginee
ring
Volum
e XI Issu
e I Version
I
19
Energy Forecasting of Bangladesh in Gas Sector Using LEAP Software

©2011 Global Journals Inc. (US)
Gl oba
l Jo
urna
l of R
esea
rche
s in E
nginee
ring
Volum
e XI Issu
e I Version
I
20
X.
CONCLUSION
Among the six patterns in time-series wizard – Interpolation, Step Function, Smooth Curve, Linear Forecast, Exponential Forecast and Logistic Forecast; Logistic Forecast is the best way to achieve more accurate energy forecasting. But in case of the energy forecasting in a third world country like Bangladesh, the demand function of different economic parameters, which is the key factor of logistic forecasting, is unavailable. Rather the economic situation leaps and bounds due to unstable political scenario. That’s why linear forecasting has been used in energy modeling of Bangladesh. But in stable political situation with demand functions into account, precise approximation can be made following the aforementioned guidelines.
XI.
ACKNOWLEDGEMENT
The authors would like to acknowledge Charlie Heaps (LEAP Developer and COMMEND Manager) for the software support. They are also grateful to Dr. Nurul Islam (Professor, Institute of Appropriate Technology, BUET), Dr. Jubair Bin Alam (Professor, Department of Civil Engineering, BUET), Masum Al Beruni (Chairman, WAPDA) & Dr. Ijaz Hossain (Professor, Head of Department of Chemical Engineering, BUET) for their consistent data and information source.
References Références Referencias
1. http://www.energycommunity.orgAnnual report of Petrobangla
2. 2007K.A.S. Murshid and Arne Wiig, “A Review of Development Trends in the Energy Sector of Bangladesh” Chr. Michelson Institute-Development Studies and Human Rights, Report R 2001:3
3. Denise Mulholland, “State Energy Forecasting - An Overview of Methods” USEPA, June19, 2008
4. Bangladesh Economic Review, 2007 5. Annual Report of Bangladesh Power
Development Board (BPDB), 2007 6. www.reportlinker.com/d011002798/Tea-sector-
in-Bangladesh.html?v=4
Sectors
Linear Approximation (Giga joules)
Exponential approximation (Giga joules)
Power
4643.2
8755.8
Fertilizer
1094.5
1201.6
Industry 1115.9
1743.6
Tea Estates
39.6
11.6
Brick Fields
4.9
4.8
Commercial
78.3
107.2
Households
1098.5
2547.5
CNG
129.6
21140.2
Total
8204.5
35512.3
7. Report on Census of Manufacturing Industries (CMI)
8. Monthly Report of Rupantarita Prakritik Gas Company Ltd. (RPGCL), Number-34, March,2009
9. Statistical Yearbook of Bangladesh, 200710. LEAP Training Exercises – Stockholm
Environment Institute, January 200811. Annual Report of Bangladesh Bureau of
Statistics, 200712. Statistical Pocketbook of Bangladesh13. Agricultural Yearbook, 200714. http://energy.ihs.com/News/published-
articles/articles/bangladesh-natural-gas-perspective.htm
Energy Forecasting of Bangladesh in Gas Sector Using LEAP Software
Linear vs. Exponential forecast (Year 2010)
Febr
uary
2011
FFF