Energy Flowchart Scenarios of Future U.S. Energy Use ... · PDF fileEnergy Use Incorporating...
25
Approved for public release; further dissemination unlimited UCRL-TR-204891 Energy Flowchart Scenarios of Future U.S. Energy Use Incorporating Hydrogen Fueled Vehicles G. Berry, W. Daily III June 14, 2004
Transcript of Energy Flowchart Scenarios of Future U.S. Energy Use ... · PDF fileEnergy Use Incorporating...

Approved for public release; further dissemination unlimited
UCRL-TR-204891
Energy FlowchartScenarios of Future U.S.Energy Use IncorporatingHydrogen Fueled Vehicles
G. Berry, W. Daily III
June 14, 2004

DISCLAIMER This document was prepared as an account of work sponsored by an agency of the United StatesGovernment. Neither the United States Government nor the University of California nor any of theiremployees, makes any warranty, express or implied, or assumes any legal liability or responsibility forthe accuracy, completeness, or usefulness of any information, apparatus, product, or process disclosed, orrepresents that its use would not infringe privately owned rights. Reference herein to any specificcommercial product, process, or service by trade name, trademark, manufacturer, or otherwise, does notnecessarily constitute or imply its endorsement, recommendation, or favoring by the United StatesGovernment or the University of California. The views and opinions of authors expressed herein do notnecessarily state or reflect those of the United States Government or the University of California, andshall not be used for advertising or product endorsement purposes. This work was performed under the auspices of the U. S. Department of Energy by the University ofCalifornia, Lawrence Livermore National Laboratory under Contract No. W-7405-Eng-48.
This report has been reproduced directly from the best available copy.
Available electronically at http://www.doc.gov/bridge
Available for a processing fee to U.S. Department of Energy And its contractors in paper from
U.S. Department of Energy Office of Scientific and Technical Information
P.O. Box 62 Oak Ridge, TN 37831-0062 Telephone: (865) 576-8401 Facsimile: (865) 576-5728
E-mail: [email protected]
Available for the sale to the public from U.S. Department of Commerce
National Technical Information Service 5285 Port Royal Road Springfield, VA 22161
Telephone: (800) 553-6847 Facsimile: (703) 605-6900
E-mail: [email protected] Online ordering: http://www.ntis.gov/ordering.htm
OR
Lawrence Livermore National Laboratory Technical Information Department’s Digital Library
http://www.llnl.gov/tid/Library.html

Energy Flowchart Scenariosof
Future U.S. Energy UseIncorporating
Hydrogen Fueled Vehicles
Gene Berry, William Daily III
Lawrence Livermore National Laboratory

Executive Summary
This project has adapted LLNL energy flowcharts of historical U.S. energy use drawnfrom the DOE Energy Information Administration (EIA) data to include scenariosinvolving hydrogen use. A flexible automated process for preparing and drawing theseflowcharts has also been developed. These charts show the flows of energy betweenprimary sectors of the economy so that a user can quickly understand the majorimplications of a proposed scenario. The software can rapidly generate a spectrum ofU.S. energy use scenarios in the 2005-2050 timeframe, both with and without a transitionto hydrogen-fueled transportation. These scenarios indicate that fueling 100% of the lightduty fleet in 2050 (318 million 80 mpg-equivalent compressed hydrogen fuel cellvehicles) will require approximately 100 million tonnes (10.7 quads) of H2/year, reducingpetroleum use by at least 7.3 million barrels of oil/day (15.5 quads/yr).
Linear extrapolation of EIA’s 2025 reference projection to 2050 indicates approximateU.S. primary energy use of 180 quads/yr (in 2050) relative to current use of 97 quads/yr(comprising 39 quads/yr of petroleum). Full deployment of 50% efficient electricitygeneration technologies for coal and nuclear power and improvements in gasoline light-duty vehicle fleet fuel economy to 50 mpg would reduce projected U.S. primary energyconsumption to 143 quads/yr in 2050, comprising 58 quads/yr (27 million bbl/day) ofpetroleum. Full deployment of H2 automobiles by 2050 could further reduce U.S.petroleum dependence to 43 quads/yr. These projections indicate that substantial stepsbeyond a transition to H2 light-duty vehicles will be necessary to reduce future U.S.petroleum dependence (and related greenhouse gases) below present levels.
A flowchart projecting future U.S. energy flows depicting a complete transition by 2050to compressed hydrogen light-duty vehicles is attached on the following page(corresponding to scenario 7 in the Appendix). It indicates that producing 100 billionkilograms of hydrogen fuel annually (10.7 quads/yr) from a balanced blend of primaryenergy sources will likely require 16.2 quads of primary energy input, with an additional0.96 Quads of electricity for hydrogen storage. These energy flows are comparable to orsmaller than projected growth in individual primary energy sources over the 2005-2050timeframe except perhaps the case of windpower.

U.S. Energy flow scenario for the year 2050, based on linear extrapolation of EIA 2025 reference projectionmodified to include a) 50% efficient electricity generation, and b) 318 million “80 mpg” H2 fuel cell vehicles

LLNL Energy Flowchart Methodology
Since the mid-1970’s Lawrence Livermore National Laboratory (LLNL) has publishedenergy flowcharts or “spaghetti” diagrams for comprehensive visualization of annual U.S.energy use patterns. The flowcharts are based on historical data published by the EnergyInformation Administration (EIA) in its Annual Energy Review. The most recentflowchart showing United States energy flows for 2001 is shown in figure 1.
The flowchart can be read left to right beginning with boxes representing primary energyresources (coal, oil, gas, nuclear, hydropower, and other renewables) on the left. Linesflow from these resources to boxes on the right representing electricity generation or end-uses (residential/commercial, industrial, non-fuel, and transportation). The line widthscorrespond quantitatively to the amount of energy delivered to each use from eachsource. Electricity generation and end-uses are less than 100% efficient. The amount(s) ofuseful energy (work) and rejected energy (heat) from each process and end-use are alsoestimated quantitatively with additional lines aggregated both graphically andnumerically on the right to give the overall amounts of useful and rejected energyconsumed each year in the United States.
Figure 1 permits several important overall observations about current U.S. energy use.First, the majority of primary energy (~70%) is consumed in 2 processes: electricitygeneration and transportation. Second, these sectors account for an even larger fraction(~85%) of the rejected energy throughout the United States. Third, these sectors arevertically integrated. Coal is essentially used only in electric generation (which itdominates), and petroleum is used essentially for transportation (for which it suppliesmore than 95% of the primary energy).
Adaptation of Energy Flowcharts to Scenarios of Hydrogen Fuel Use
Hydrogen fuel has the potential to dramatically change this picture over the next 50years. Like electricity, hydrogen is an energy carrier that can be made from any energysource. Unlike electricity, hydrogen can be universal, serving all transportation modes.And unlike other fuels, hydrogen use evolves no tail-pipe air pollution or carbon dioxide(CO2) emissions at the point of use. With the advent of the Freedom Car and FreedomFuel initiatives, an unprecedented level of effort is now aimed at the development ofhydrogen fuel for automobiles, stationary energy storage, and distributed electricitygeneration.
This project has expanded the LLNL energy flowcharts to include Energy InformationAdministration (EIA) projections to 2025 and extrapolations to the timeframe (2050)likely necessary to complete a transition to hydrogen transportation. These projectionsfocus principally on hydrogen production from a variety of sources for use in fuel-cellautomobiles. We have also computerized and automated the flowchart generation process
to allow very rapid, yet flexible, creation of flowcharts representing a broader spectrumof energy use futures, technology developments, and deployment scenarios.
An Energy Flowchart Adapted for Hydrogen and Transportation
This adaptation process has led to a flowchart substantially richer and somewhat morecomplex (Figure 2.) than the manually constructed original (Figure 1). Renewable energyresources have been disaggregated to individually show potentially large and intermittentelectric generation technologies such as solar, wind, and hydroelectric, while dispachablerenewables (biomass, geothermal, etc.) are combined. Electricity generation anddistribution have been combined for simplicity, and hydrogen production has beenrepresented explicitly as a central box. End-use energy sectors were reorganized tohighlight high value, retail end-uses (transportation, commercial, residential) withindustrial and non-fuel uses combined. Special attention is given to transportation, whichis “broken down” into three sectors driven by distinctly different market realities:automotive (light-duty vehicles), commercial aircraft, and commercial freight (which forsimplicity also includes rail, marine, public transit, and military energy use). Thesesectors correspond roughly to the categorization(s) used in the Annual Energy Outlook(AEO), produced by EIA using the national energy modeling system (NEMS).
Future Projections and Extrapolation of Energy Demand and Supply
Previous LLNL energy flowcharts relied strictly on historical data and categorizationsproduced by EIA. The forward looking perspective of this project required projection ofmany factors influencing the amounts, distribution, and efficiency of energy consumptionin the United States over approximately the next 50 years, sufficient to allow a fulltransition to hydrogen transportation. Rather than attempt projecting the full range offactors 50 years in the future, we have chosen to use simple, transparent, and flexibleassumptions that can be modified by the user.
For purposes of this project, we have adopted EIA’s future projections to 2025 as “futurehistorical data” while allowing further linear extrapolation using some or all of historicaland projected energy demands from EIA for each end-use sector (residential,commercial, aircraft, etc.). EIA’s projections (or extrapolations from them) of each end-use demand can be individually overridden by the user. In addition, the share of eachprimary energy source reaching both intermediate (i.e. electricity or hydrogen generation)and end-use energy demands can be user specified or defaulted to EIA projections for2000-2025. The net effect is that a scenario requiring hundreds of individual assumptionscan be implemented with as few as ten mouse-clicks. Scenarios (such as scenarios 7-12shown later in this report) can be concisely summarized and thought of as “Linearextrapolations of EIA projected 2020-2025 end-use demand(s) to 2050, modified byreplacing 50 mpg gasoline hybrid vehicles with 80 mpg equivalent fuel cell compressedhydrogen vehicles”.
Automotive Sector Assumptions
The automotive sector is the primary focus of current hydrogen development efforts, andconsequently the most richly defined and represented in the LLNL Energy Flow Model.The light-duty vehicle sector allows user inputs of U.S driving age population, annualvehicle miles traveled, and fleet average gasoline vehicle fuel economy. The modelindicates reference values for these variables consistent with EIA energy use projectionsout to 2025. For years beyond 2025, the U.S. driving age population is calculated fromU.S. Census Bureau population growth projections (reaching 318 million people ofdriving age in 2050). EIA projects vehicle miles traveled (VMT) per driver to average15,000 miles/yr in 2025, up from 12,000 miles/yr in 2005. For years beyond 2025 VMTis linearly extrapolated to reach 19,500 miles/yr in 2050.
The model also allows two other variables to be specified for automobiles: the energystorage penalty for hydrogen fuel (a default value of 10% LHV represents H2compression to 10,000 psi) and the relative fuel economy advantage of hydrogen or otheralternative fuel vehicles relative to gasoline vehicles (hybrid or conventional). Fuel cellhydrogen vehicles were assumed in this study to achieve 1.6 times greater fuel economythan gasoline hybrid electric vehicles, resulting in projections of 50 mpg gasoline hybridsand 80 mpg equivalent hydrogen fuel cell vehicles.
Useful and Rejected Energy
The model permits user specified values for the efficiency of all energy conversions andend-uses. Guidance available to the user is automatically inferred by calculation fromEIA projections from 2000 to 2025 for the electricity generation sector. 80% efficiency isassumed by default for stationary energy end-uses, with transportation energy efficienciesranging from 40% for commercial freight, 25% for aircraft, and 16%-27% for internalcombustion engine automobiles, 40% for hybrid vehicles, and 60% for fuel cell vehicles.
Database Statistics
The model also includes datasheets for statistics and extrapolation linked to the historicaland projected database drawn from EIA. These sheets allow for quantitative analysis oftrends in individual sectors and statistical quality control of input data easing detection oftypographic and other data input errors.
Flowcharts as scenarios
The LLNL energy flowchart model allows for individual model flowcharts to be saved asa scenario. Up to 12 scenarios can be stored in a single file allowing for rapid crosscomparison. The scenarios can be exported as graphic files removing detailed text butretaining key assumptions, the projection year, energy use totals for sources, intermediateand end-uses as well overall primary energy use, delivered energy, and rejected energy.
Future Scenarios
For illustrative purposes a preliminary set of 12 scenarios was generated. These scenariosgenerally represent growing primary energy use with improving efficiency over the next50 years (scenarios 1-6), along with hydrogen production (scenarios 7-12) to supportfueling of a 100% hydrogen fuel cell light-duty fleet projected at 318 million vehiclesdriven an average 19,500 miles annually in 2050.
Scenario 1: U.S. 2005 EIA Reference Case Projection (97 quads)(20 mpg average light-duty fleet of 220 million autos)
Scenario 2: U.S. 2025 EIA Reference Case Projection (133 Quads)(20 mpg average light-duty fleet of 266 million autos)
Scenario 3: U.S. 2050 Reference Case (181 quads)(20 mpg average light-duty fleet of 318 million autos)
Scenario 4: U.S. 2050 Efficient Electricity Case (167 quads)(50% efficient electricity generation)
Scenario 5: U.S. 2050 Automotive Efficiency Case (152 quads)(33 mpg light-duty fleet fuel economy)
Scenario 6: U.S. 2050 Hybrid Vehicle Case (144 quads)(50 mpg gasoline hybrid light duty fleet)
Scenario 7: U.S. 2050 blended H2 fuel cell light-duty fleet (146 quads)(“80 mpg” compressed hydrogen light duty fleet)
Scenario 8: U.S. 2050 H2 light-duty fleet with wind electrolysis (143 quads)(66% efficient wind electrolysis)
Scenario 9: U.S. 2050 H2 light-duty fleet with steam methane reforming (143 quads)(75% efficient natural gas reforming)
Scenario 10: U.S. 2050 H2 light-duty fleet with biomass gasification (146 quads)(65% efficient biomass gasification)
Scenario 11: U.S. 2050 H2 light-duty fleet with coal gasification (149 quads)(50% efficient coal gasification with CO2 sequestration)
Scenario 12: U.S. 2050 H2 light-duty fleet with nuclear H2 production (153 quads)(42% efficient thermochemical cycle)
The initial scenarios (1-2) display projected current (2005) and intermediate term (2025)energy use, driven principally by existing demographics, capital stock and infrastructure.Subsequent scenarios (3-12) explore potential changes in energy flows over the longerterm (2050) with sufficient lead-time for complete turnover of capital stock (e.g.powerplants, refueling infrastructures, and vehicle fleets). Scenario 3 shows the result ofextrapolating EIA projections from 2025 to 2050. Scenario 4 explores the impact ofdeploying IGCC coal and HTGR nuclear technologies to raise electric generationefficiencies to 50%. This advance is presumed throughout the further scenarios sincethese technologies are consistent with planned hydrogen generation from nuclear-driventhermochemical cycles, such as the sulfur-iodine (S-I) cycle, or from coal gasificationwith sequestration. Scenarios 5-6 indicate the additional impact of improving light-dutyfleet average fuel economy from 20 mpg to 33 mpg (Scenario 5), and later to 50 mpg(Scenario 6) representing a complete transition to gasoline hybrid vehicles.
Scenario 6 is the baseline 2050 scenario from which scenarios 7-12 are projected,representing complete deployment of “80 mpg” compressed hydrogen fuel cell vehicles.Hydrogen for these vehicles may be produced from a balanced blend of energy resources(Scenario 7), including natural gas, coal, biomass, and (wind) electrolysis with a small(5%) contribution from nuclear thermochemical plants. For comparison, the next 5scenarios (8-12) produce equal amounts of hydrogen, but solely from wind power, naturalgas, biomass, coal, and nuclear energy respectively.
Observations
The 12 scenarios in this report are all based on EIA projections which indicate U.S.population growth will be outpaced by energy use over the next 50 years stemmingprincipally from 1) increasing electrification of energy end-use, and 2) increasingtransportation demand, especially for light-duty vehicles. Improving light-duty fleet fueleconomy alone (e.g. from 20 mpg to 50 mpg) over this time frame (scenarios 4-6) willlikely be insufficient to reduce U.S. petroleum use below today’s levels. Full penetrationof 80 mpg hydrogen fuel cell vehicles throughout the light-duty fleet by 2050 will reducepetroleum dependence an additional 15.5 Quads (7.3 million barrels/day) over 50 mpggasoline hybrid vehicles. Producing all of this hydrogen from any individual source willrequire substantial increased use of that source, and in the case of wind and nuclearenergy, a multiplication of otherwise projected supplies. Producing 10.7 quads (100million tonnes H2) of hydrogen from a diverse portfolio (scenario 7) will reduce theadditional use of individual energy sources to levels comparable to projected growth overthe 2005-2050 period.
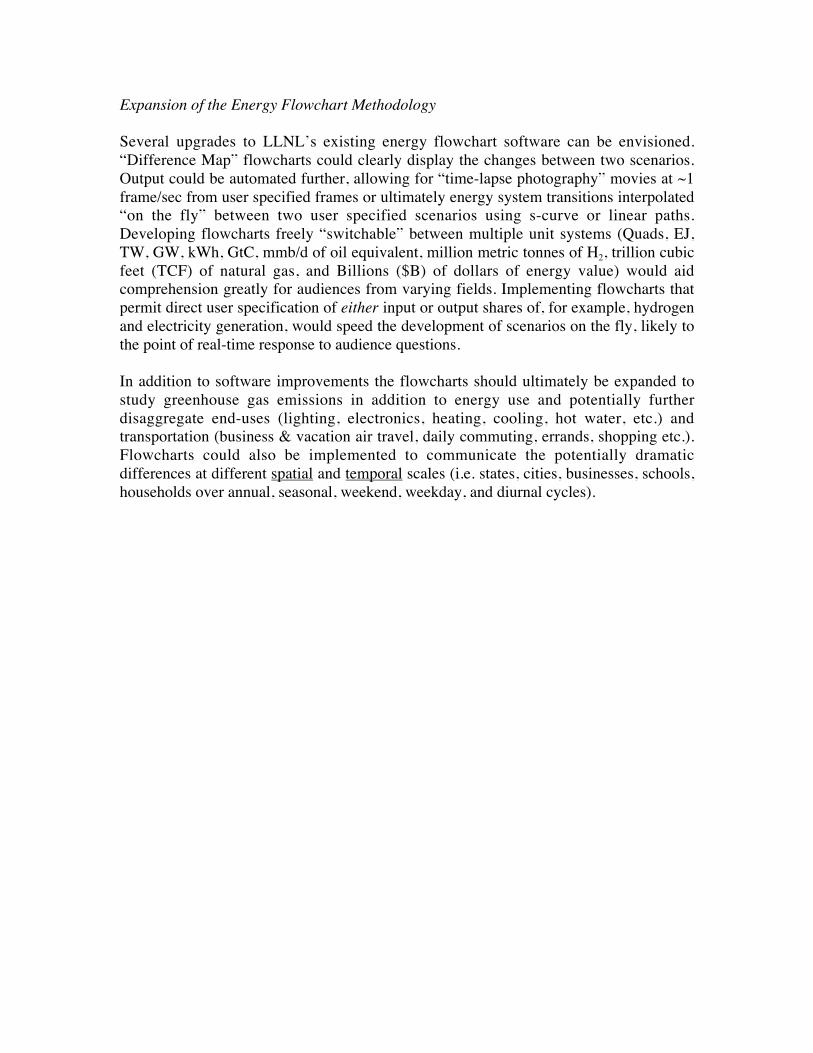
Expansion of the Energy Flowchart Methodology
Several upgrades to LLNL’s existing energy flowchart software can be envisioned.“Difference Map” flowcharts could clearly display the changes between two scenarios.Output could be automated further, allowing for “time-lapse photography” movies at ~1frame/sec from user specified frames or ultimately energy system transitions interpolated“on the fly” between two user specified scenarios using s-curve or linear paths.Developing flowcharts freely “switchable” between multiple unit systems (Quads, EJ,TW, GW, kWh, GtC, mmb/d of oil equivalent, million metric tonnes of H2, trillion cubicfeet (TCF) of natural gas, and Billions ($B) of dollars of energy value) would aidcomprehension greatly for audiences from varying fields. Implementing flowcharts thatpermit direct user specification of either input or output shares of, for example, hydrogenand electricity generation, would speed the development of scenarios on the fly, likely tothe point of real-time response to audience questions.
In addition to software improvements the flowcharts should ultimately be expanded tostudy greenhouse gas emissions in addition to energy use and potentially furtherdisaggregate end-uses (lighting, electronics, heating, cooling, hot water, etc.) andtransportation (business & vacation air travel, daily commuting, errands, shopping etc.).Flowcharts could also be implemented to communicate the potentially dramaticdifferences at different spatial and temporal scales (i.e. states, cities, businesses, schools,households over annual, seasonal, weekend, weekday, and diurnal cycles).

Figure 1. U.S. Energy Flow for 2001 was 97 Quads (Quadrillion Btu) according to the Energy Information Administration’s Annual Energy Review 2001. Transportation and electricity generation account for 70% of energy use and up to 85% of lost energy.

Figure 2. Typical output from LLNL’s automated U.S. Energy Flow model.This figure displays projected 2005 U.S. energy flows adapted from EIA’s 2003 Annual Energy Outlook.

Scenario 1Scenario 1. U.S. Energy flow is projected to be 97 Quadrillion Btu in 2005 by EIA’s Annual Energy Outlook. Light-duty vehicleswill consume 16.2 Quads (~7.6 mmb/d) averaging 20 mpg over 11,800 miles/yr per capita of driving age population (220 million)

Scenario 2. Annual Energy Outlook 2003 projects U.S. energy flow to reach 133 Quads in 2025, driven by electrification ofresidential & commercial sectors and dramatic increases (16 Quads) in petroleum use for freight and passenger transport

Scenario 3. Linear extrapolation of Annual Energy Outlook projections for 2020-2025 out to 2050. A driving age population of318 million, averaging 19,500 miles driven per year in 20 mpg vehicles, requires 39 Quads of petroleum or 18 million bbl/day.
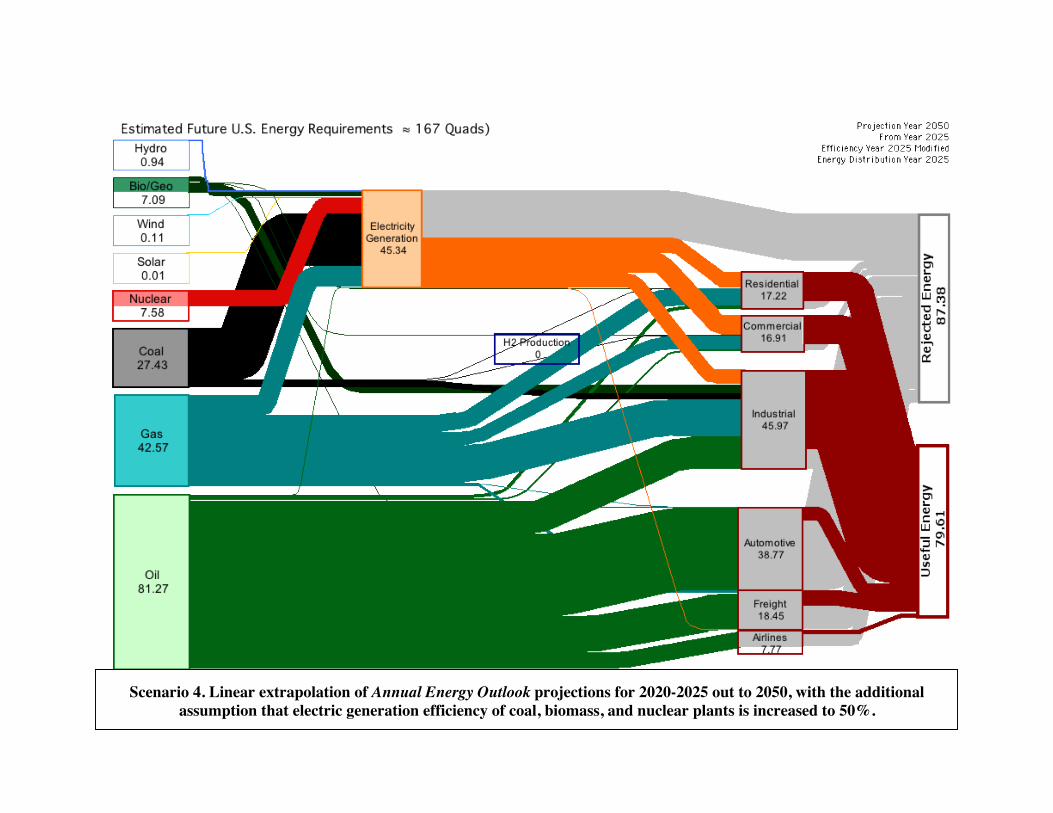
Scenario 4. Linear extrapolation of Annual Energy Outlook projections for 2020-2025 out to 2050, with the additionalassumption that electric generation efficiency of coal, biomass, and nuclear plants is increased to 50%.
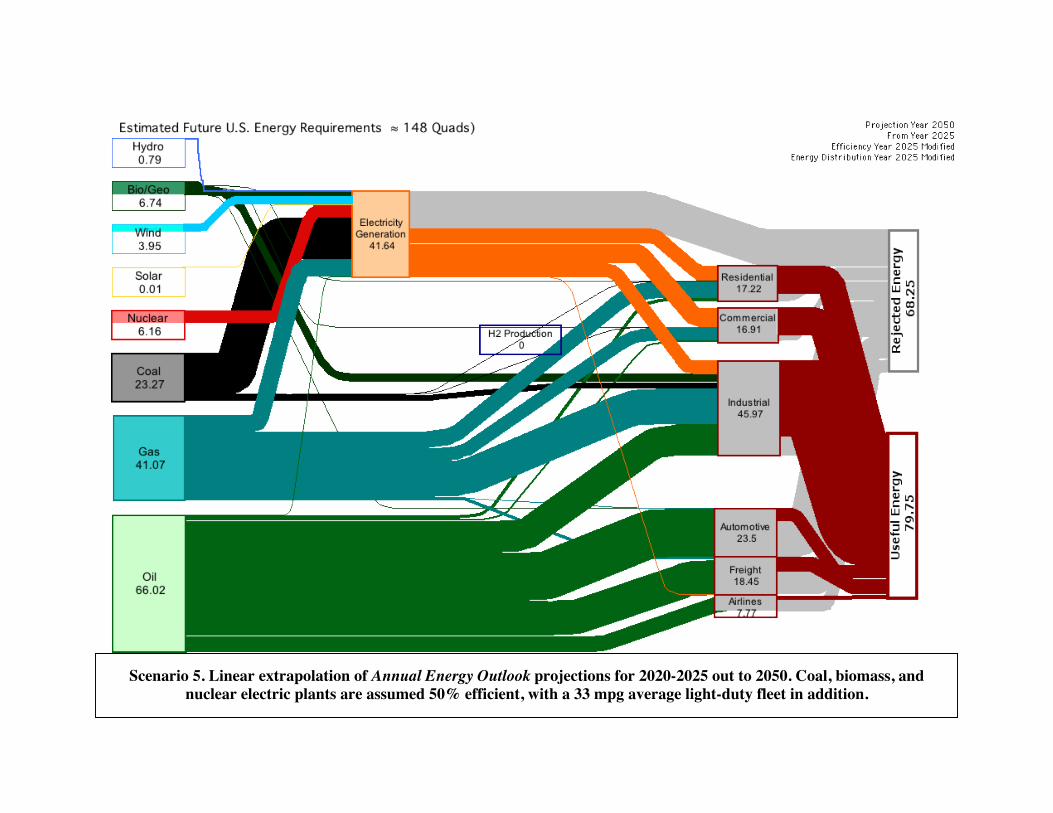
Scenario 5. Linear extrapolation of Annual Energy Outlook projections for 2020-2025 out to 2050. Coal, biomass, andnuclear electric plants are assumed 50% efficient, with a 33 mpg average light-duty fleet in addition.

Scenario 6. Linear extrapolation of Annual Energy Outlook projections for 2020-2025 out to 2050. Coal, biomass, andnuclear plants assumed to achieve 50% efficiency. The light-duty fleet assumed to average 50 mpg using gasoline hybrids.

Scenario 7. Scenario 6 except the light-duty fleet transitions entirely to 80 mpg equivalent hydrogen (H2) fuel cell vehicles by 2050.H2 produced using a mix of gas (20%), coal (25%), biomass (25%), wind electrolysis (25%), and nuclear thermochemical (5%).

Scenario 8. The U.S. light-duty fleet transitions to “80 mpg” 10,000 psi compressed hydrogen (H2) fuel cell vehicles by 2050.15 Quads ( ~ 4.3 trillion kWh) of wind electricity produces H2 by water electrolysis with 66% efficiency (LHV basis).

Scenario 9. The U.S. light-duty fleet transitions to “80 mpg” 10,000 psi compressed hydrogen (H2) fuel cell vehicles by 2050.10.7 Quads of H2 are produced using 75% efficient (LHV basis) steam reforming of natural gas, saving 7.3 barrels of oil daily.

Scenario 10. The U.S. light-duty fleet transitions to “80 mpg” 10,000 psi compressed hydrogen (H2) fuel cell vehicles by 2050.16 Quads of cellulosic biomass produce 100 million tonnes of H2/yr with 60% efficiency (LHV basis).

Scenario 11. The U.S. light-duty fleet transitions to “80 mpg” 10,000 psi compressed hydrogen (H2) fuel cell vehicles by 2050.19 Quads of coal are gasified and sequestered to produce 100 million tonnes of H2/yr with 50% efficiency (LHV basis).

Scenario 12. The U.S. light-duty fleet transitions to “80 mpg” 10,000 psi compressed hydrogen (H2) fuel cell vehicles by 2050.23 Quads of nuclear fuel produce 100 million tonnes of H2/yr with 42% efficiency (LHV basis) using the Sulfur-Iodine cycle.


![A novel energy storage system incorporating electrically ...mezhao/pdf/356.pdf · hydrogen storage system, in which hydrogen is employed as the fuel [10]. Hydrogen can be generated](https://static.fdocuments.in/doc/165x107/600974963a68f047865000d5/a-novel-energy-storage-system-incorporating-electrically-mezhaopdf356pdf.jpg)