Energy Efficiency Lecture Business of Energy Seminar December 2014 DEPARTMENT NAME HERE.
41
Energy Efficiency Lecture Business of Energy Seminar December 2014 DEPARTMENT NAME HERE
-
Upload
terry-elderkin -
Category
Documents
-
view
215 -
download
1
Transcript of Energy Efficiency Lecture Business of Energy Seminar December 2014 DEPARTMENT NAME HERE.

Energy Efficiency LectureBusiness of Energy Seminar
December 2014
DEPARTMENT NAME HERE

Today’s Agenda
• Energy Efficiency 101• Business Model 1: Ratepayer funded programs• Business Model 2: Rate design and On-Bill Financing• Business Model 3: ESCO model and Off-Bill Financing
Energy Efficiency 101

What is wrong with this house?

5
Electricity: Segments in Vertical Chain
• High voltage: 120kV+
• Long distance• Low energy loss
due to low resistance
• Nuclear (>1000MW)
• Hydroelectric (100 MW – 10,000 MW)
• Fossil-fuel (>1000 MW)
• Gas Turbine (<200 MW)
• Medium voltage: 2kV – 35 kV
• Medium to short distance
• Residential• Commercial• Industrial• Municipal
services
Regulated Electric Utility (franchise monopoly)
Retail
DistributionGeneration
Transmission

6
Why Electricity is Different
1. Electricity has the following unique challenges:1. High demand volatility
2. Negligible storage capacity requiring “just-in-time” delivery
3. No viable substitutes resulting in price inelastic demand curve
2. Deregulated power industry susceptible to significant market clearing price fluctuations due to supply or demand shocks without sufficient reserve capacity
1 Source: David Besanko, powerpoint presentation “The California Power Crisis: Day One” MECN430, Winter 2006
7
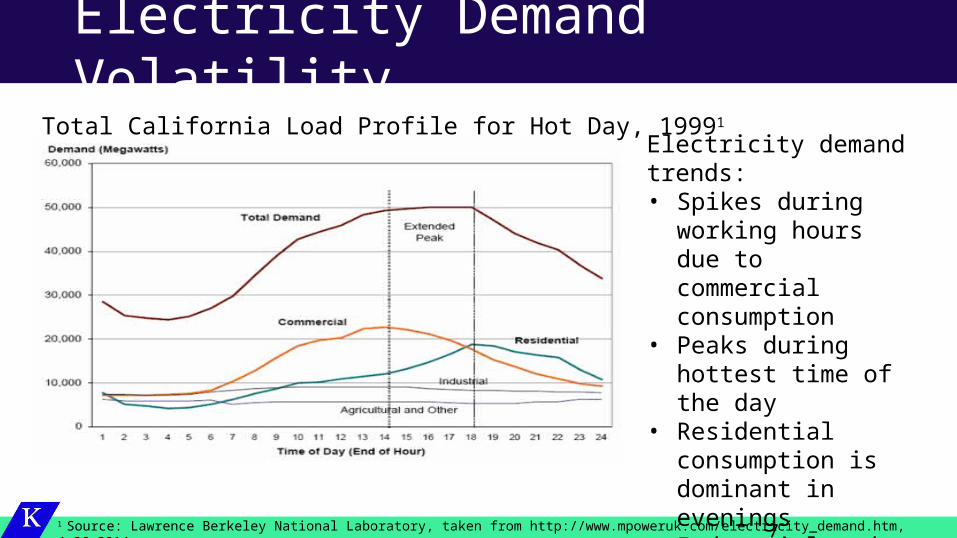
Electricity Demand VolatilityTotal California Load Profile for Hot Day, 19991
1 Source: Lawrence Berkeley National Laboratory, taken from http://www.mpoweruk.com/electricity_demand.htm, 4.26.2014
Electricity demand trends:• Spikes during
working hours due to commercial consumption
• Peaks during hottest time of the day
• Residential consumption is dominant in evenings
• Industrial and agricultural consumption are flat

Defining Demand Management
Program Load Impact Graph
Energy Efficiency and Conservation
Shift down
Demand Response Shave down
Distributed generation Shift down or shave down (depends on intermittency of resource)
Energy Storage Smooth
Pricing Programs (Time-of-use, etc)
Smooth and/or shift down

Tools for Demand Management
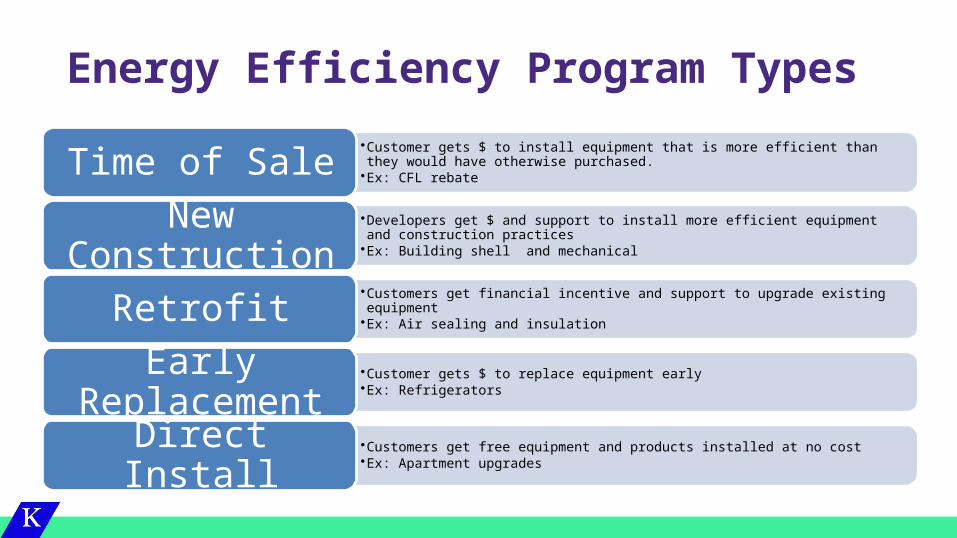
Energy Efficiency Program Types
•Customer gets $ to install equipment that is more efficient than they would have otherwise purchased.
•Ex: CFL rebate Time of Sale•Developers get $ and support to install more efficient equipment and construction practices•Ex: Building shell and mechanicalNew Construction•Customers get financial incentive and support to upgrade existing equipment•Ex: Air sealing and insulationRetrofit•Customer gets $ to replace equipment early•Ex: RefrigeratorsEarly Replacement•Customers get free equipment and products installed at no cost•Ex: Apartment upgradesDirect Install
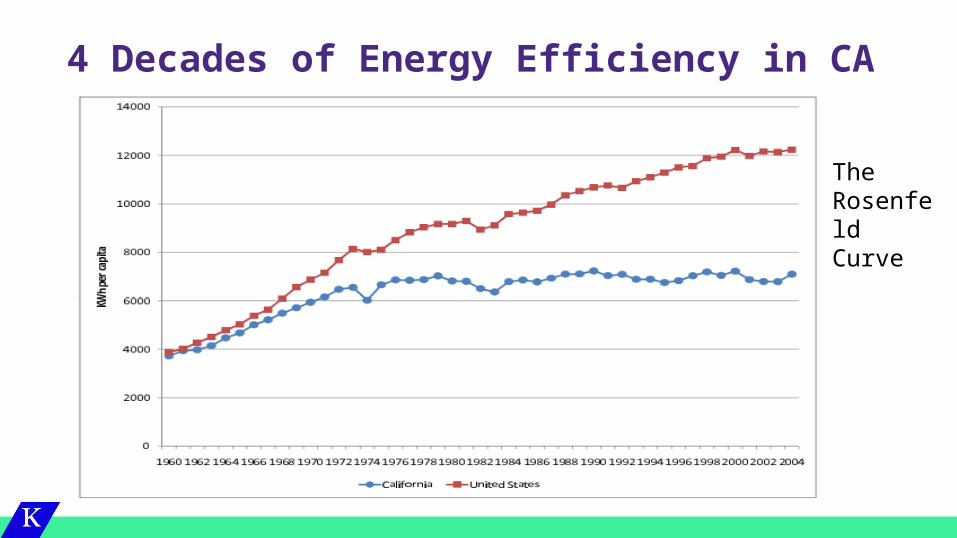
4 Decades of Energy Efficiency in CA
The Rosenfeld Curve
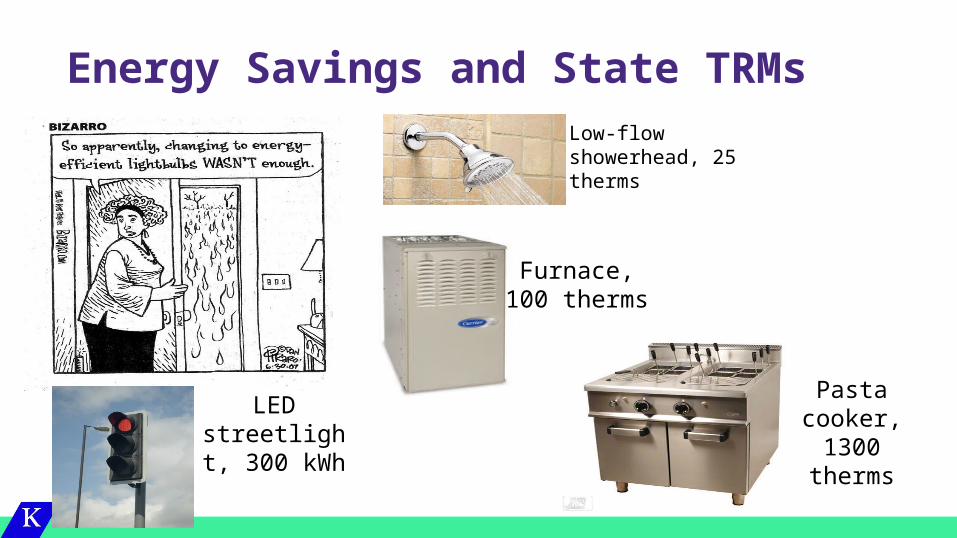
Energy Savings and State TRMsLow-flow showerhead, 25 therms
Furnace, 100 therms
Pasta cooker, 1300
therms
LED streetlight, 300 kWh

Business Model 1: Ratepayer funded programs

Utility Energy Efficiency Market Drivers & Barriers
14
PUC regulations Resource planning Customer satisfaction Corporate strategy Company KPIs Funding stability Political factors Codes & standards
Why would a utility willingly (or even unwillingly) want to sell less of their product?
The answer:
&

The process of an IOU petitioning
their regulators to charge their
customers is called a rate case.
The Regulatory Compact
• An investor owned utility (IOU) should provide returns to investors. It is also generally a natural monopoly.
• Because of this monopoly, the IOU is regulated by a state utility commission that authorizes rate increases and sets a fair return on investment to ensure ratepayers receive a fair price.
15

Policy Framework #2 –Required EE Goals
EE Programs can be funded through a rate case or through line
items on the customer’s bill called a
benefits charge, a tariff, or a surcharge
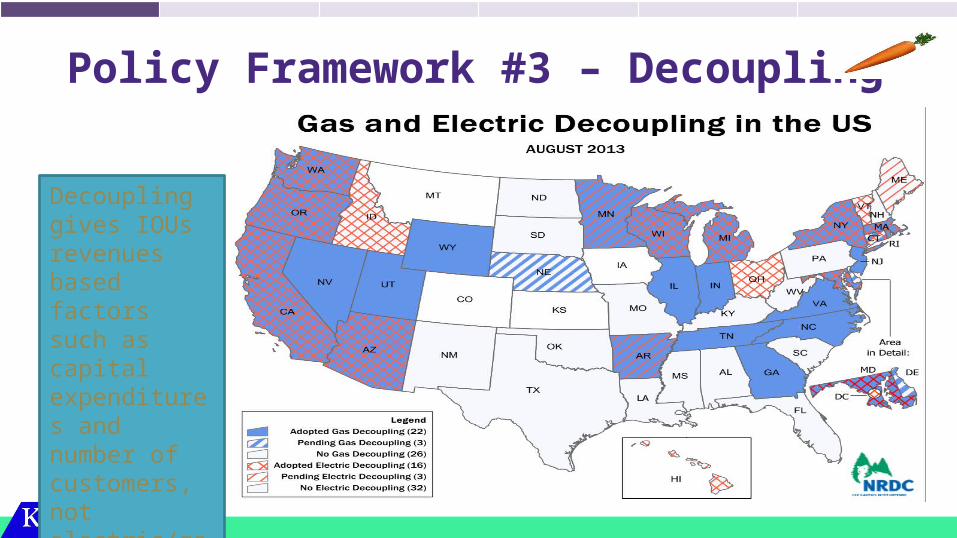
Policy Framework #3 – Decoupling
Decoupling gives IOUs revenues based factors such as capital expenditures and number of customers, not electric/gas sales.

Policy Framework #4 – EE Performance Incentives
Approaches include:• Earn % of program
costs for achieving goal
• Earn share of achieved savings
• Earn % of NPV of avoided costs
• Rate of return for achieving savings

Other Drivers – Electric prices
Can look at rate impacts and bill impacts.

Budget Scope – Midwest and California
21
© CLEAResult, 2014
CA IA IL IN KS KY MI MN MO ND NE OH SD WI $-
$200,000,000 $400,000,000 $600,000,000 $800,000,000
$1,000,000,000 $1,200,000,000 $1,400,000,000 $1,600,000,000
2013 Electric Efficiency Budgets

IOU Procurement• Who administers an EE program is always a big deal
– IOUs generally need to maintain close relationship with customers. JD Powers scores matter.
• Who implements an EE program is usually less of an issue– California has a requirement that 20%+ of portfolio budgets
are bid to non-IOU companies– Illinois and other Midwest states tend to bid out much larger
portions of their portfolio – e.g., Nicor programs are 99% implementer run
• IOUs issue RFP, Implementers submit bids, bids are scored and info requested, and implementers are called for in-person oral presentations.
22
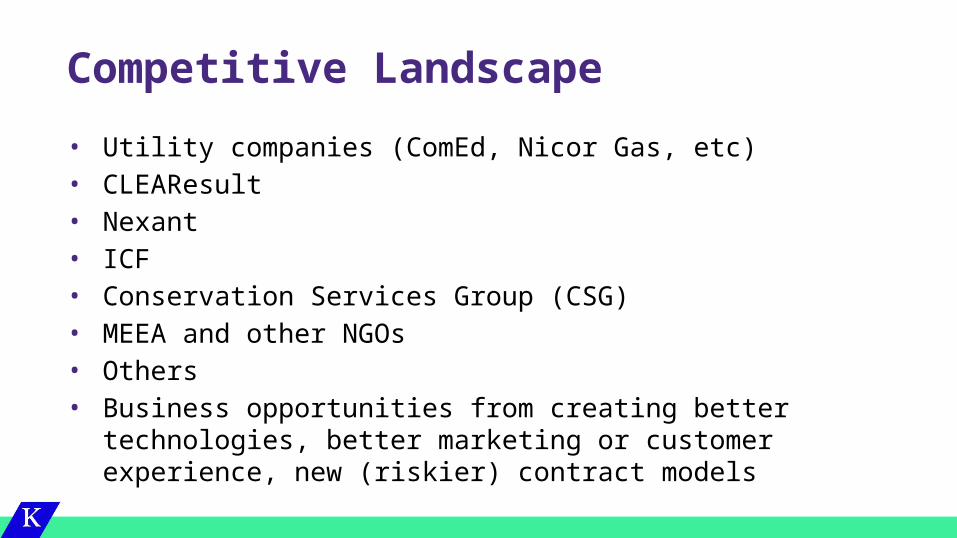
Competitive Landscape
• Utility companies (ComEd, Nicor Gas, etc)• CLEAResult• Nexant• ICF• Conservation Services Group (CSG) • MEEA and other NGOs• Others• Business opportunities from creating better technologies, better
marketing or customer experience, new (riskier) contract models

Business Model 2: Rate design and On-bill Financing
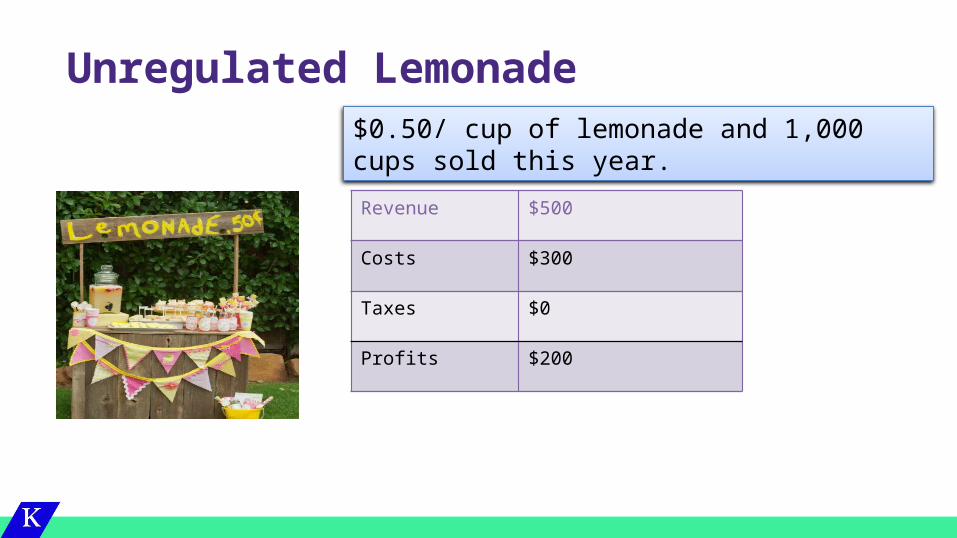
Unregulated Lemonade
Revenue $500
Costs $300
Taxes $0
Profits $200
$0.50/ cup of lemonade and 1,000 cups sold this year.
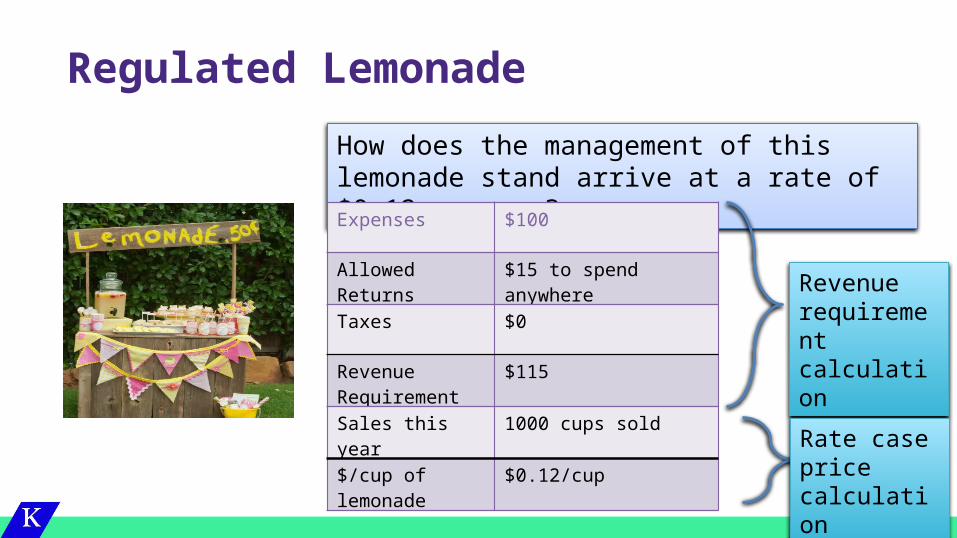
Regulated Lemonade
How does the management of this lemonade stand arrive at a rate of $0.12 per cup?Expenses $100
Allowed Returns $15 to spend anywhere
Taxes $0
Revenue Requirement
$115
Sales this year 1000 cups sold
$/cup of lemonade $0.12/cup
Revenue requirement calculation
Rate case price calculation

27
What happens if there are less sales than estimated?Decoupling attempts to fix this issue.
Some Observations
Plain Lemonade
• Ways company can grow:1. Sell more cups of lemonade
with lower prices by keeping production and service costs low
2. Sell more expensive lemonade by providing customers with better customer service
Regulated Lemonade
• Ways company can grow:1. Sell more cups of lemonade with lower
prices by keeping production and service costs low
2. Sell more expensive lemonade by providing customers with better customer service
3. Convince regulator of the need for more major expenses, e.g., poles, smart grid.
4. Convince regulator of a higher return required given associated investor risk
© CLEAResult, 2014
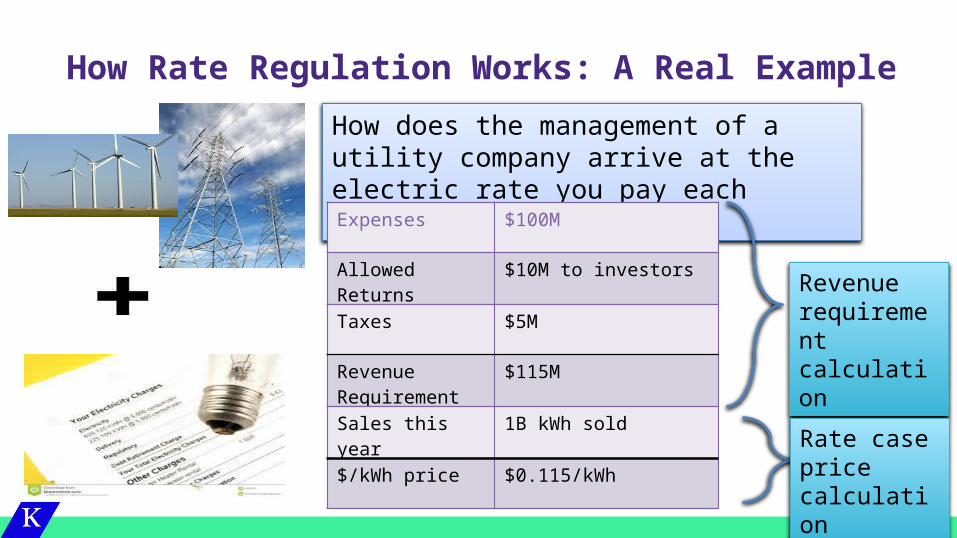
How Rate Regulation Works: A Real Example
How does the management of a utility company arrive at the electric rate you pay each month?
Expenses $100M
Allowed Returns $10M to investors
Taxes $5M
Revenue Requirement
$115M
Sales this year 1B kWh sold
$/kWh price $0.115/kWh
Revenue requirement calculation
Rate case price calculation

Rates & Charges
29

Alternative Rate Structures – Consumption & Demand
Name Description
Seasonally Differentiated
Rates constant for months of similar costs
Time-of-Use Rates vary by time of day. Usually commercial customers.
Block Charges Rates increase/decrease in stairstep fashion.
Critical Peak Pricing Rates are set until a high temperature (or other) event meets set criteria for higher Peak Price rate.
Real-time Pricing Rates change from hour-to-hour according to market prices.
Standby rates for Distributed Gen (incl Net Metering)
Rates designed specifically for customers with rooftop solar or other distributed generation capacity. Covers cost of the utility distribution system, utility generation, and compensates customer for own generation.
30
Customer Charge $15.06
First 500 kWh $0.08
Additional kWh $0.15
Customer Charge $15.06
Off-Peak $0.08
On-Peak $0.15
TOU
Block Charge

On-bill Financing

Competitive Landscape
• Utility companies (ComEd, Nicor Gas, etc)• Retail providers in deregulated markets (Constellation, Integrys,
etc)• Business opportunities from understanding rates and on-bill
financing options and creating programs and products to support
Business Model 3: ESCOs and Off-bill Financing
A Perspective from the Chinese Market
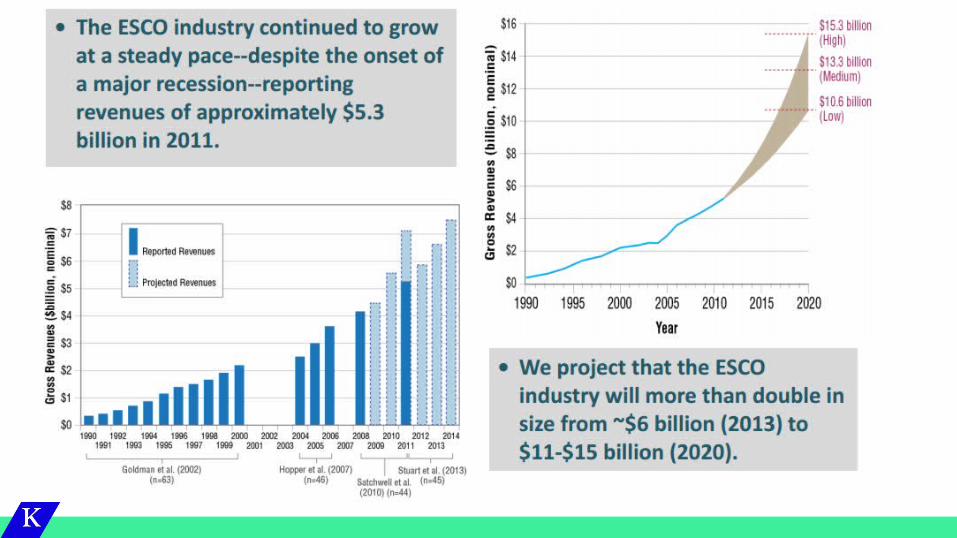
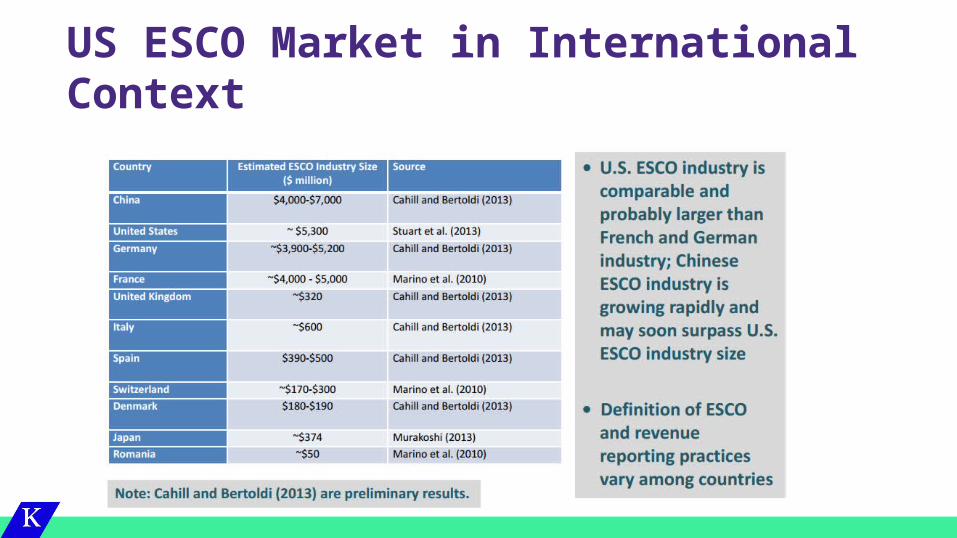
US ESCO Market in International Context

Energy Performance Contracting• There are three common models
used by ESCOs in China: – shared savings (50%) – guaranteed savings (35%)– the energy management
outsourcing model or chauffer model. (15%)
IndustryBuildingTransportation
Energy Performance Contract Projects in Different Sectors

Energy Performance Contracting -History• 1992-1994. Global Environmental Funding and World Bank did a study for “Carbon Dioxide
Emission Control Issue in China”. They also discussed the potential of Energy Performance Contract in Chinese market.
• Dec. 1998. Phase one began. Three pilot ESCOs are founded. To the end of Phase one in Jun.2006, they completed 475 projects for 405 customers. Saving 1,510,000 ton standard coal per year, 5,320,000 ton CO2 per year.
• 2003. Phase two began. (1) EMCA was founded, which is an energy efficiency commission that works on supporting customers and ESCOs. (2) Using $22,000,000 funding provided by WB, China government increases ESCOs’ credit level and give them financing support.
• Jun. 2010. Phase two completed. Which means that Energy Efficiency Program has completed its trial period in China.

Financing Options
Competitive Landscape
• Internationally:– Johnson Controls– Schneider Electric
• Locally:– Effortless Energy– Same international ESCOs operate in IL

In Conclusion….

Big Picture Issues• Who administers an EE program• How Utilities make money (ratemaking) and how they make money
on EE (decoupling, incentive mechanisms)• New contract structures for EE • Who owns EE program data (Smart meters)• Who owns EE savings (Industrial opt-out, carbon markets)• Simplifications on how EE is verified (Smart meters)• Paradigm shifts in how EE is funded (Carbon markets)• Paradigm shifts in how EE is justified (EE as
a supply-side resource) • How codes impact savings (federal/state)
41