Energy efficiency indicators in México: Industry · 1. Background i. 2014, lack of energy...
13
INSERT ORGANISATION´S COLOURED LOGO HERE (in case of more than one logo, plese refer to [email protected]) Energy efficiency indicators in México: Industry National Comission for the Efficiency Use of Energy (Conuee) Pedro Hernández-López Buenos Aires, Argentina 22/02/2018
-
Upload
trinhkhanh -
Category
Documents
-
view
213 -
download
0
Transcript of Energy efficiency indicators in México: Industry · 1. Background i. 2014, lack of energy...

INSERT ORGANISATION´S COLOURED LOGO HERE (in case
of more than one logo,
plese refer to
Energy efficiency indicators in México: Industry
National Comission for the Efficiency Use of Energy (Conuee)
Pedro Hernández-López
Buenos Aires, Argentina
22/02/2018

Index
1. Background
2. Work scheme on energy efficiency information in the Industry
3. Challenges on energy consumption industry of México
4. Challenges on physical production industry of México
5. Industry Energy efficiency Indicators
6. Conclusions and lines of future work

1. Background
i. 2014, lack of energy efficiency (EE) indicators for industrial sector and other sectors of final consumption
ii. 2015, Started work to gather information on energy consumption, physical production and added value : a) review of industrial surveys, economic censuses, statistical yearbooks, national accounts, information
systems of Ministries and others b) Close work with chambers and industrial associations to gather information on activity level and energy
consumption iii. 2016 In the framework of the BIEE-CEPAL program as well as the Mexico-AFD-ADEME cooperation, and with the
technical support of Enerdata, the first indicators of EE are estimated, of two types:: a) energy consumption per unit of added value b) energy consumption per unit of physical production iv. 2017, The Base of Energy Efficiency Indicators (BIEE) Mexico is presented, which includes information on the
industrial sector, and for the following subsectors: Cement, Steel, Chemistry, Sugar, Automotive Manufacturing, Paper, Petrochemicals and Others
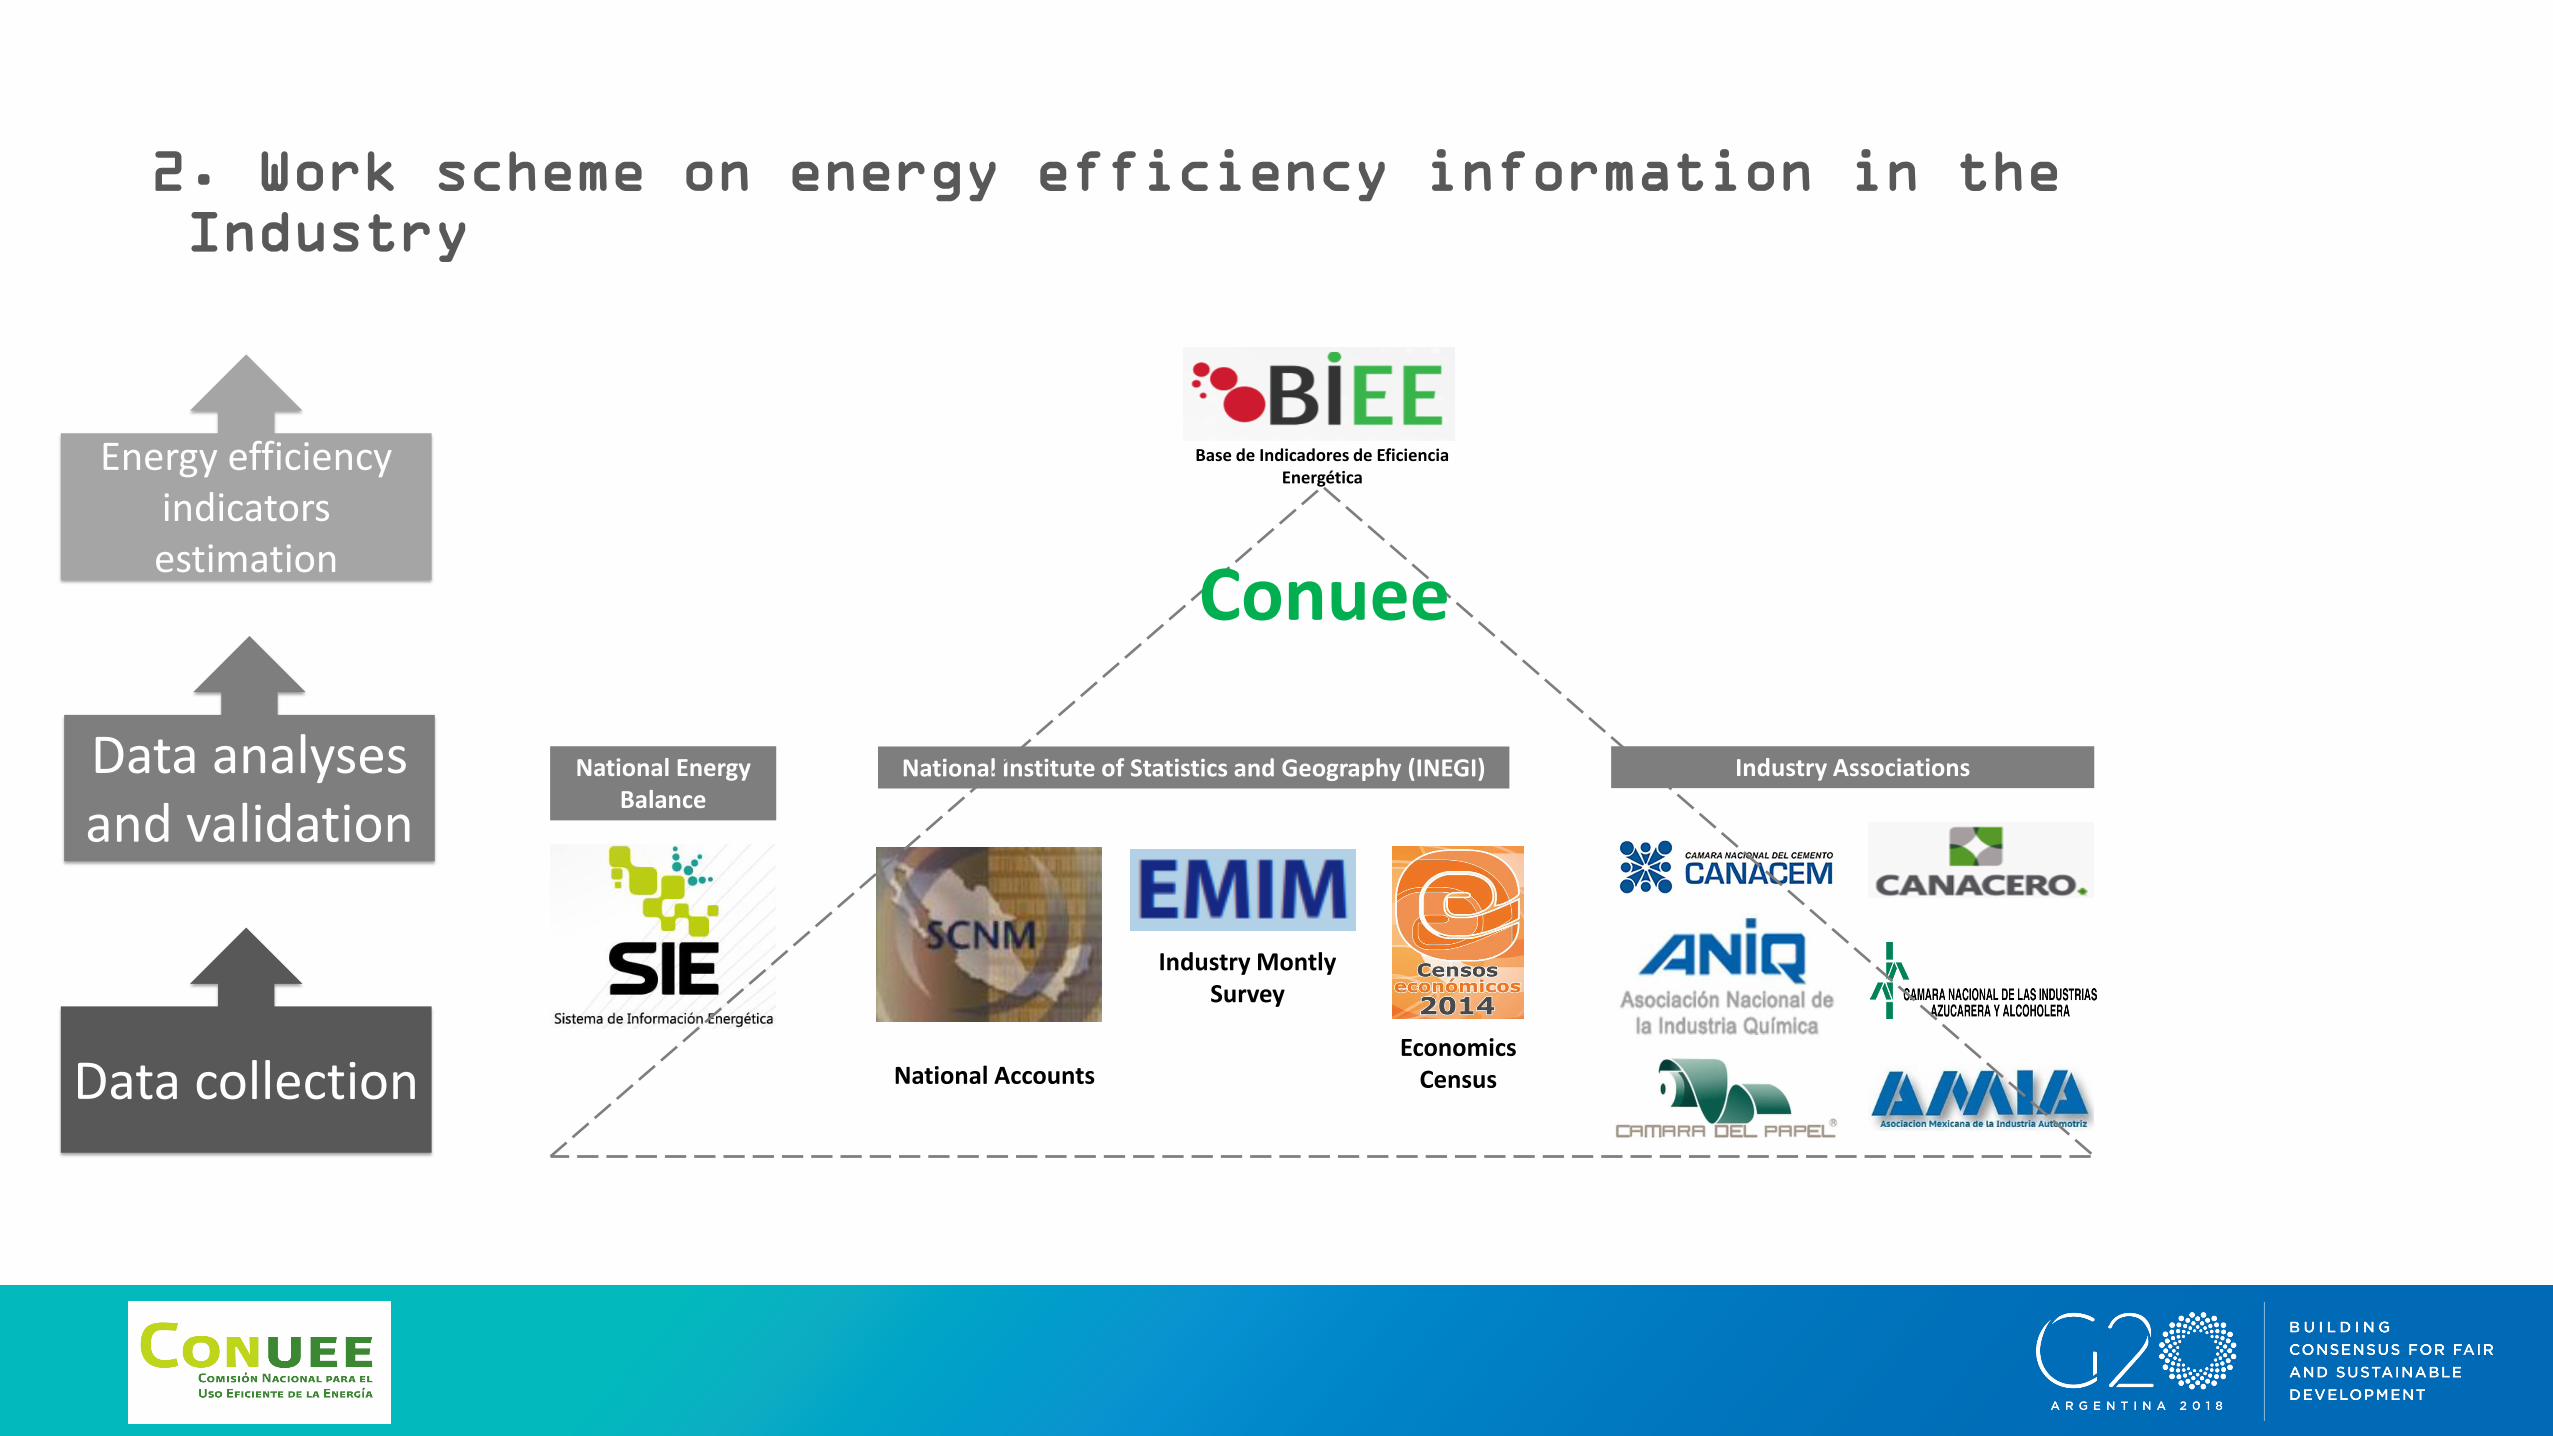
2. Work scheme on energy efficiency information in the
Industry
Base de Indicadores de Eficiencia Energética
National Institute of Statistics and Geography (INEGI)
National Accounts
Industry Montly Survey
Economics Census
Industry Associations National Energy Balance
Data collection
Conuee
Data analyses and validation
Energy efficiency indicators estimation

Energy Efficiency Indicators Base
The BIEE was presented in September 2017 and included information of 7 sectors: 1. Macroeconomic 2. Energy 3. Industry 4. Transport 5. Residential 6. Services 7. Agricultural
http://www.biee-conuee.enerdata.net/ Acceso: Login: biee Password: publico

3. Challenges on energy consumption information of the industrial
sector of Mexico
i. The energy consumption break into by subsector is not enough, there is a category of "Others" that concentrates 46.2%
ii. The classification of industrial sub-sectors of the National Energy Balance does not coincide with that used in the System of National Accounts (SCN) of INEGI, which hinders correct linkage
iii. There is no systematized information on energy consumption for large transformation or production processes
iv. The Economic Census (CE) reports aggregate information on the monetary expenditure for fuels and electricity, which may allow an approximation to the energy consumption of the subsectors, however the CE periodicity is five-yearly
Otras ramas
Siderurgia
Cemento
Química
Minería
Petroquímica de PEMEX
Vidrio
Celulosa y papel
Azúcar
Cerveza y malta
Automotriz Ramas 2
46.2%

4. Challenges on production information of the industrial
sector of Mexico
Insert Organisatrion´s white logo here
i. The National Accounts of INEGI systematically reports the VA of the industrial sub-sectors but there is no physical production information with the same detail, making it difficult to know more precisely the energy performance of the industrial subsectors ii. The Monthly Survey of the Manufacturing Industry (EMIM) reports physical production information for the main transformation activities, however it requires treatment to homogenize an equivalent unit iii. The statistical yearbooks of Chambers and associations represent a valuable source of information on energy consumption and production, however in many cases these are not yet digital, which implies a greater processing effort

5. Indicators of energy efficiency of the Industry
Name Unity Subsectors
Energy intensity per unit
of added value
GJ/VA Cement, Steel, Chemistry, Automotive
Manufacturing, Paper and
Petrochemicals
Energy intensity per unit
of physical production
GJ/tons
produced
Cement, Steel, Chemistry, Sugar,
Automotive Manufacturing, Paper and
Petrochemicals

5. Industry Energy efficiency Indicators
Energy intensity index of the Iron and steel industry, 2000-2015
Fuente: BIEE, Conuee (2017).
Energy intensity index of the Cement industry, 2000-2015
Fuente: BIEE, Conuee (2017).
0.0
2.0
4.0
6.0
8.0
10.0
12.0
14.0
16.0
0.0
200.0
400.0
600.0
800.0
1000.0
1200.0
1400.0
1600.0
20
00
20
01
20
02
20
03
20
04
20
05
20
06
20
07
20
08
20
09
20
10
20
11
20
12
20
13
20
14
20
15
Gj/
ton
Kj/
$ P
eso
s
IIE Kj/ $ Pesos IIE Gj / Tons
0.0
0.5
1.0
1.5
2.0
2.5
3.0
3.5
4.0
0.0
200.0
400.0
600.0
800.0
1000.0
1200.0
1400.0
20
00
20
01
20
02
20
03
20
04
20
05
20
06
20
07
20
08
20
09
20
10
20
11
20
12
20
13
20
14
20
15
GJ
/ T
ON
S
KJ/
$ P
ESO
S
IIE Kj/ $ Pesos IIE Gj / Tons

5. Industry Energy efficiency Indicators
Energy intensity index of the Sugar industry, 2000-2015
Fuente: BIEE, Conuee (2017).
Energy intensity index of the Paper industry, 2000-2015
Fuente: BIEE, Conuee (2017).
0.0
5.0
10.0
15.0
20.0
25.0
2005
2006
2007
2008
2009
2010
2011
2012
2013
2014
2015
IIE Gj / Tons
0.0
2.0
4.0
6.0
8.0
10.0
12.0
14.0
0.0
200.0
400.0
600.0
800.0
1000.0
1200.0
20
00
20
01
20
02
20
03
20
04
20
05
20
06
20
07
20
08
20
09
20
10
20
11
20
12
20
13
20
14
20
15
Gj /
To
ns
Kj/
$ P
esos
IIE Kj/ $ Pesos IIE Gj / Tons

5. Industry Energy efficiency Indicators
Energy intensity index of the Glass industry, 2000-2015
Fuente: BIEE, Conuee (2017).
0.0
2.0
4.0
6.0
8.0
10.0
12.0
14.0
16.0
0.0
200.0
400.0
600.0
800.0
1000.0
1200.0
1400.0
1600.0
20
07
20
08
20
09
20
10
20
11
20
12
20
13
20
14
20
15
Gj /
To
ns
Kj/
$ P
esos
IIE Kj/ $ Pesos IIE Gj / Tons

Conclusions i. With EE indicators is posible an energy policy design based in evidence ii. Assessment and monitoring of the energy targets and climate change policy (EE goal y NDCs) iii. Energy management of large consumers or industrial subsectors : Benchmarking
Lines of future work i. Improve data and energy efficiency indicators with information of environment sector
ii.Disseminate the BIEE with industry chambers
iii. Strengthen of Energy Efficiency Roadmap of Industrial Sector based on data and indicators of BIEE
iv. Implement the PRONASE –Mexican NEEAP- assessment with EE indicator provided by BIEE