Energy efficiency by using daily customer's quality observations to improve public transport
EU SUSTAINABLEENERGY WEEK
18-22 JUNE 2012
Energy
Prof. dr Stojan Petrovic22 June 2012
Energy Efficiency in Transport

2
Presentation Overview
Introduction / Importance of the Transportation Sector
Trends in The Transportation Sector-Energy Consumption
Modes of Transport / Interlinks with Other Sectors
Options for EE in EU Transport Sector
Transport Energy Efficiency in Serbia
Conclusions

3
Introduction
From the wheel to the supersonic jet, to the Bullet Train, and the Space Shuttle, humanity has made leaps and bounds in transportation.
Mobility is one of the main characteristics of modern life. Comprehensive transport is precondition for intensive mobility, developed economy and normal human activities. Since transport still depends mainly on fossil fuels, it was the cause for wars in the past, but also recently and in future

4
Introduction/ Importance of the Transportation Sector
Economy of any country depends essentially on transportation.Leisure is deeply connected with transport possibilities.Ordinary human life frequently depends on fast transport. Business also sometimes depends on transport conditions.It seems that modern life can not exist without developed transportation.

5
Introduction/ Importance of the Transportation Sector
Automotive industry accounts for one third of all manufacturing and employs more than 10% of total employment.
Total population 493.5Total employment 224.1Employed population in manufacturing sector 34.5 - 15.4% of total employed population Automotive manufacturing 3.6Automotive non-manufacturing 9.2Total automotive employment 12.8 - 5.6% of EU employed peopleManufacturing employment related to auto sector 3.5 - 10.2% of employment in EU manufact.
Structure of EU-27 employment (2007):
Source: ACEA Annual Report, 2011

6
Introduction/ Importance of the Transportation Sector
The transport sector is the largest and fastest-growing energy user, with
a forecast annual increase of 2.1% worldwide and 4.3% for East Asia and
the Pacific in 2002-2030.

7
Introduction/ Importance of the Transportation Sector
In 2002. the transport sector in accounts for 27 % of World global carbon emissions …
… and 23 % of global energy use. Serbia is ubder World average.
8
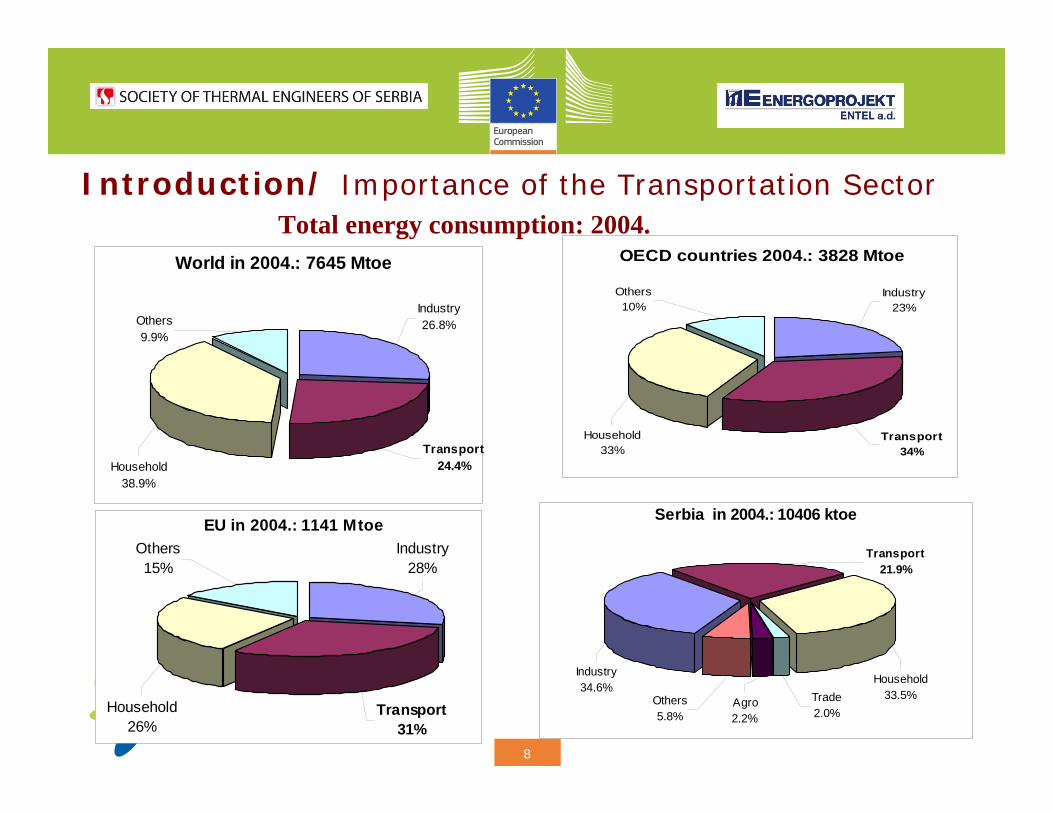
Introduction/ Importance of the Transportation SectorTotal energy consumption: 2004.
EU in 2004.: 1141 Mtoe
Transport31%
Industry28%
Others15%
Household26%
OECD countries 2004.: 3828 Mtoe
Industry23%
Others10%
Household33%
Transport34%
World in 2004.: 7645 Mtoe
Industry26.8%
Transport24.4%Household
38.9%
Others9.9%
Transport21.9%
Industry34.6%
Household33.5%Others
5.8%Agro2.2%
Trade2.0%
Serbia in 2004.: 10406 ktoe

9
Introduction/ Importance of the Transportation Sector
Total energy consumption balance for neighbour countries: 2004.
0%
20%
40%
60%
80%
100%
Serb
ia
Alb
ania
BiH
Bul
garia
Cro
atia
Hun
gary
FYR
Mac
ed.
Rom
ania
Slov
enia
EU-2
5
Ne-energ. kor.
Neodređeno
Poljoprivreda
Javni sektor
Domacinstva
Industrija
Transport

10
Introduction/ Importance of the Transportation Sector
Approximately 60% of total oil production is use in
transport sector.
Transport61.5%
Household11%
Public sect.4.1%
Others3.8%
Non-energ.11.7%
Industry7.8%
EU oil consumption in 2004.: 511 Mtoe Oil consumption in Serbia, 2004.: 3745 ktoeIndustry27.3%
Transport59.8%
Others11.2%Household
1.7%

11
Introduction/ Importance of the Transportation Sector
In the major energy-using industrialized countries
(specifically the 11 highest energy using IEA countries),
nearly all (96 %) of transportation energy comes from
petroleum fuels, such as gasoline(62%) and diesel (35%).
Gas2%
Oil96%
Elektro1%
Renew.1%
Transport energy balance OECD 2004. : 1248
Source> ANFAC, ACEA, 2011
12
Introduction/ Importance of the Transportation Sector
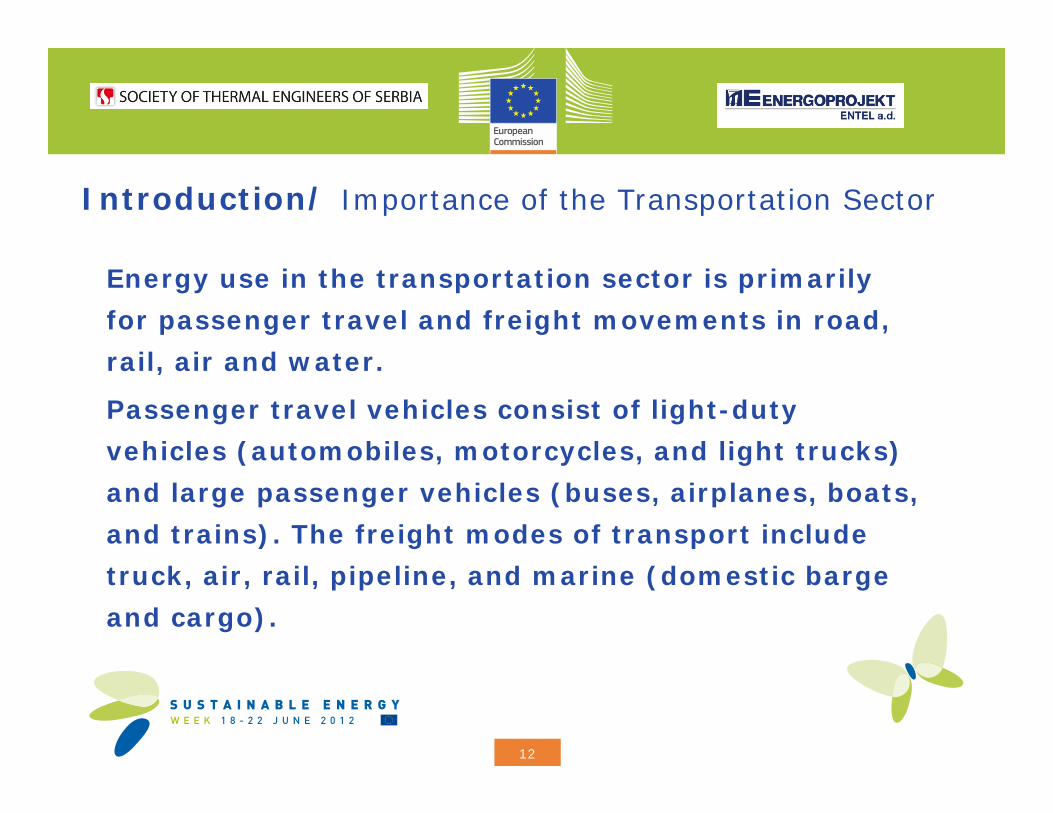
Energy use in the transportation sector is primarily
for passenger travel and freight movements in road,
rail, air and water.
Passenger travel vehicles consist of light-duty
vehicles (automobiles, motorcycles, and light trucks)
and large passenger vehicles (buses, airplanes, boats,
and trains). The freight modes of transport include
truck, air, rail, pipeline, and marine (domestic barge
and cargo).

13
Introduction/ Importance of the Transportation Sector
Road transport account for more than 80% of total energy consumption used by transportation
Air13.0%
Road81.0%
Rail2.0%
Others2.0%
Water2.0%
Transport energy balance, OECD 2004.: 1248 Mtoe
Air4.8%
Road85.6%
Rail2.5%
Others6.1%
Water1.0%
Transport energy balance, Serbia 2004.: 2196 ktoe
EU Transport in 2004.: 350,3 Mtoe
Rail2%
Road84%
Water1%
Air13%

14
Introduction/ Importance of the Transportation Sector
Roughly two-thirds of transport
energy is used for passenger mobility while one-third is
used to move freight.

15
Introduction/ Importance of the Transportation Sector
Definition of the term “transpotation”:In general, transport is a means for the transfer of goods and people.

16
Modes of Transport Use of animal power
17
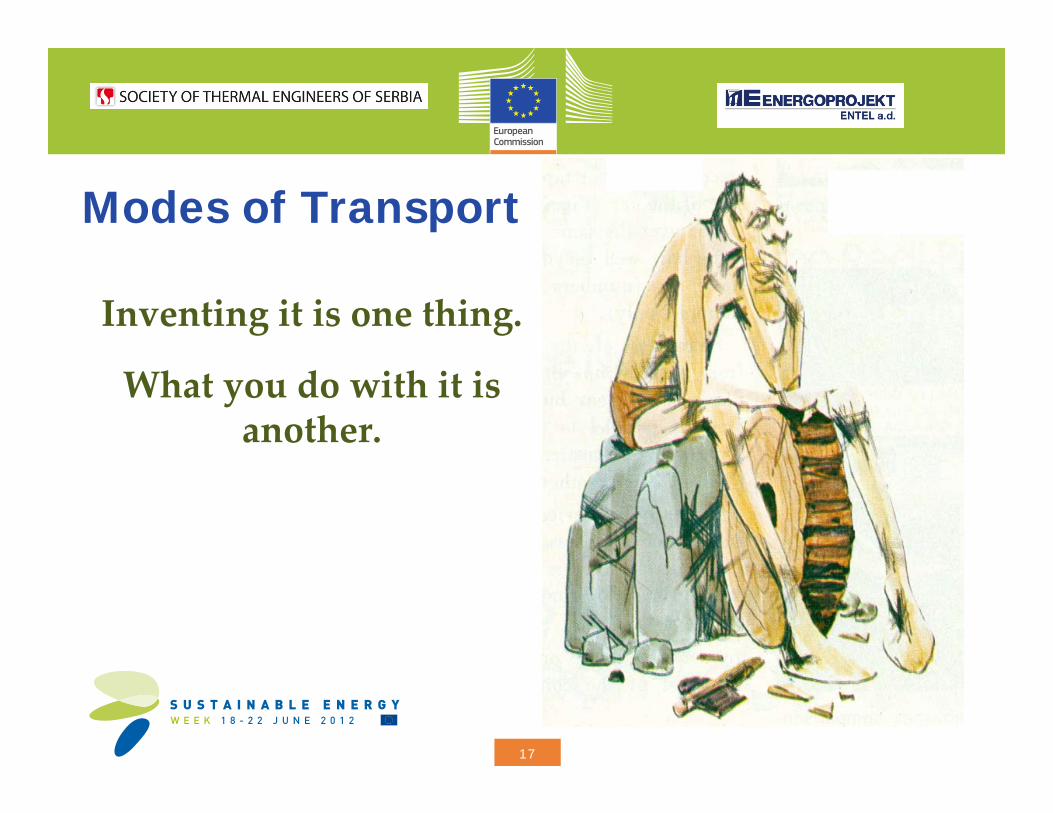
Modes of Transport
Inventing it is one thing.
What you do with it is another.
18
Beginning of wheeled transport
Every great invention has a use.You just need a little help

19
Modes of Transport Use of animal power

20
Modes of Transport Use of human power

21
Modes of Transport Use of electro/ mechanical power

22
Modes of Transport Use of electro/ mechanical power

23
Modes of Transport

24
Modes of Transport The importance of energy efficiency

25
Modes of Transport The importance of energy efficiency

26
Modes of Transport

27
Energy Efficiency in the Transport Sector
Efficiency is usually defined as the ratio of input to output, or the output per each unit of input. Modal variations in efficiency will depend heavily on what is to be carried, the distance traveled, the degree and complexity of logistics required as well as economies of scale.
Freight transport chains rest upon the complementarity of cost-efficient and time-efficient modes, seeking most of the time a balanced compromise rather than an ideal or perfect equilibrium.

28
Energy Efficiency in the Transport Sector
Maritime transport is still the most cost-efficient way to transport bulk merchandise over long distances. On the other hand, while air transport is recognized for its unsurpassed time-efficiency versus other modes over long distances, it remains anexpensive option.
Thus, vertical integration, or the absorption of transportation activities by producers, illustrates the search for these two efficiency attributes by gaining direct control over inputs.

29
EU Position on Energy Efficiency in Transport Sector
In order to improve energy efficiency in transport, a combination of measures could be taken. These may include:
• The use of taxes and other pricing instruments to influence the choice of transport in favor of rail and waterways;
• Tax benefits for energy efficient trucks and cars; • The enforcement of speed limits;
• The introduction of high efficiency engines. • The establishment of mandatory energy efficiency standards;
• Improved transport and mobility planning. Better town and other spatial planning, better integration of logistical services and support for new
combinations of public and private transport; • The consumer education and the use of new information technologies for
better logistical planning.• The steady increase of energy prices, regardless of fluctuations in the price
for energy sources on the market; • Internalising all external costs, such as environmental, pollution and health
costs into transport fuel prices;

30

31
ACEA agreement on fuel consumption reduction

32
ACEA agreement on fuel consumption reduction2005 report: Fiat has already reached the 2008 goal, 3 year in advance (achieving 139 g/km). Citroen (144 g/km) and Renault (149 g/km) are on track to meet the 140 g/km commitment in 2008. Ford (151 g/km) and Peugeot (151 g/km) are almost on track. 2007 report: Only Fiat was able to reach the 2008 planned goal of 140 g/km, with a value of 137.3 g/km. Peugeot (141.9 g/km) and Citroen (142.2 g/km) are still on track.2008 report: Only two brands were able to reach the 2008 planned goal of 140 g/km: Fiat, with a value of 133.7 g/km and Peugeot, with 138.1 g/km. The average for the whole car market for 2008 is 153.7 g/km, so the target has not been achieved.2009 report: More brands reached the (now expired) 2008 140 g/km goal: Fiat (127.8 g/km), Toyota (130.1 g/km), Peugeot (133.6 g/km), Renault(137.5 g/km), Citroen (137.9 g/km) and Ford (140.0 g/km). The Fiat Auto Group (including the Fiat, Alfa Romeo, Lancia, Abarth, Ferrari and Maserati brands) averaged to 131.0 g/km.2010 report: Fiat posted a mean value of 123.1 g/km and it also ranked first as Group, with 125.9 g/km and an improvement of 5 g/km compared to last year.

33
ACEA agreement on fuel consumption reduction
Demands for cars < 120 gCO2/km

34
ACEA agreement on fuel consumption reduction
CO2 emission of new cars from 2001 to 2010

35
ACEA agreement on fuel consumption reduction
Most new cars have a diesel engine

36
Fuel economy labeling of cars for consumer information

37
Fuel economy labeling of cars for consumer informationDirective 199/94/EC
This consumer information system is to be set up using the following four methods:
1. attaching a fuel consumption and CO2 emissions label to the windscreen of all new passenger cars at the point
of sale ; 2. producing a fuel consumption and CO2 emissions guide
for all vehicles in the market; 3. displaying posters with data on fuel consumption and
CO2 emissions for all vehicles in car showrooms; 4. including fuel consumption and CO2 emissions data in
promotional material.

38
Fuel economy labeling of cars for consumer information
United Kingdom, 2004

39
Fuel economy labeling of cars for consumer information
Denmark, 2005

40
Fuel economy labeling of cars for consumer information
Ireland, 2006

41
Fuel economy labeling of cars for consumer information
Slovenia, 2007

42
Fuel economy labeling of cars for consumer informationSwiss, 2007

43
Fiscal measures to promote car fuel efficiency
Diesel Car Petrol Car Alternative Fuel Car
Bands
Band ABand BBand CBand DBand EBand F
CO2 Emission(g/km)
12 m.rate £
6 m.rate £
12 m.rate £
6 m.rate £
12 m.rate £
6 monthsrate £
Up to 100 75.00 41.25 65.00 35.75 55.00 30.25101 to 120 85.00 46.75 75.00 41.25 65.00 35.75121 - 150 115.00 63.25 105.00 57.75 95.00 52.25151 - 165 135.00 74.25 125.00 68.75 115.00 63.25166 - 185 160.00 88.00 150.00 82.50 140.00 77.00Over 185 170.00 93.50 165.00 90.75 160.00 88.00
United Kingdom

44
Fiscal measures to promote car fuel efficiency
Denmark

45
Fiscal measures to promote car fuel efficiencyTax measures are an important tool in shaping consumer demand towards fuel efficient cars, and help create a market for breakthrough technologies, notably during the introduction phase.
CO 2 taxation for passenger cars is well established across the European Union.
In 2010, 17 Member States had CO2-related taxation, up from 16 in 2009, 14 in 2008 and 11 in 2007.
In 2011, the 19 EU countries that levy passenger car taxes partially or totally based on the car’s carbon dioxide (CO2) emissions and/or fuel consumption are: Austria, Belgium, Cyprus, Denmark, Finland, France, Germany, Greece, Ireland, Latvia, Luxembourg, Malta, theNetherlands, Portugal, Romania, Slovenia, Spain, Sweden and the United Kingdom.
In addition, an increasing number of countries – 16 EU Member States at present – provide purchase incentives and/or tax benefits for electric and/or hybrid electric vehicles.

46
Average fuel consumption of new cars in EU

47
Average fuel consumption of all used cars in EU

48

49
Measurement of transport energy efficiency
There isn’t ant good indicator to reflect the overall efficiency trends in the transport sector, mainly because of the difficulty of separating out the energy used by different modes of transport, especially for road transport.
In the ODYSSEE project for Europe, an alternative indicator is used, combining in a single index the energy efficiency trends by mode (ODEX).
(see www.odyssee.indicators.org)

50
Energy efficiency index (ODEX) – EU-15
Source: Mure/Odyssee, 2007

51
Energy efficiency index (ODEX) – EU-27
Source: Mure/Odyssee, 2011
Total energy efficiency improved by about 22% or 1.4% per year between 1990 and 2008 in the EU. Energy efficiency in transport improved by 15% or 0.9% /year since 1990. Most improvement are observed for air transport (around 30%), for cars (15%), for trucks and light vehicles (11%).

52
Energy efficiency index (ODEX) – EU-27
Source: Mure/Odyssee, 2011
The main EU initiative is mandatory CO2 standards as voluntary agreements on performance have failed to reach their target.
The new regulation set an overall average target of 130g CO2/km for new passenger cars in 2015. A long term target is introducedfor 2020 at 95 g CO2/km. Manufacturers will be given interim targets (65% of their fleets in 2012, to 80% in 2014). In case they exceed the targets, they will have to pay fines.
In February 2011 the European Parliament adopted a legislation on CO2 emissions of new light commercial vehicles (LCV) with a target of an average CO2 emission of 175 g/km by 2017 (~185 g/km in 2009) and 147 g/km in 2020.
Air traffic has been included in the EU ETS from 2012, emissions for all flights that arrive at or depart from an EU airport. A similar measure for international marine traffic is under discussion. The promotion of clean and energy-efficient road transport vehicles is set in EU Directive 2009/33/EC.
53
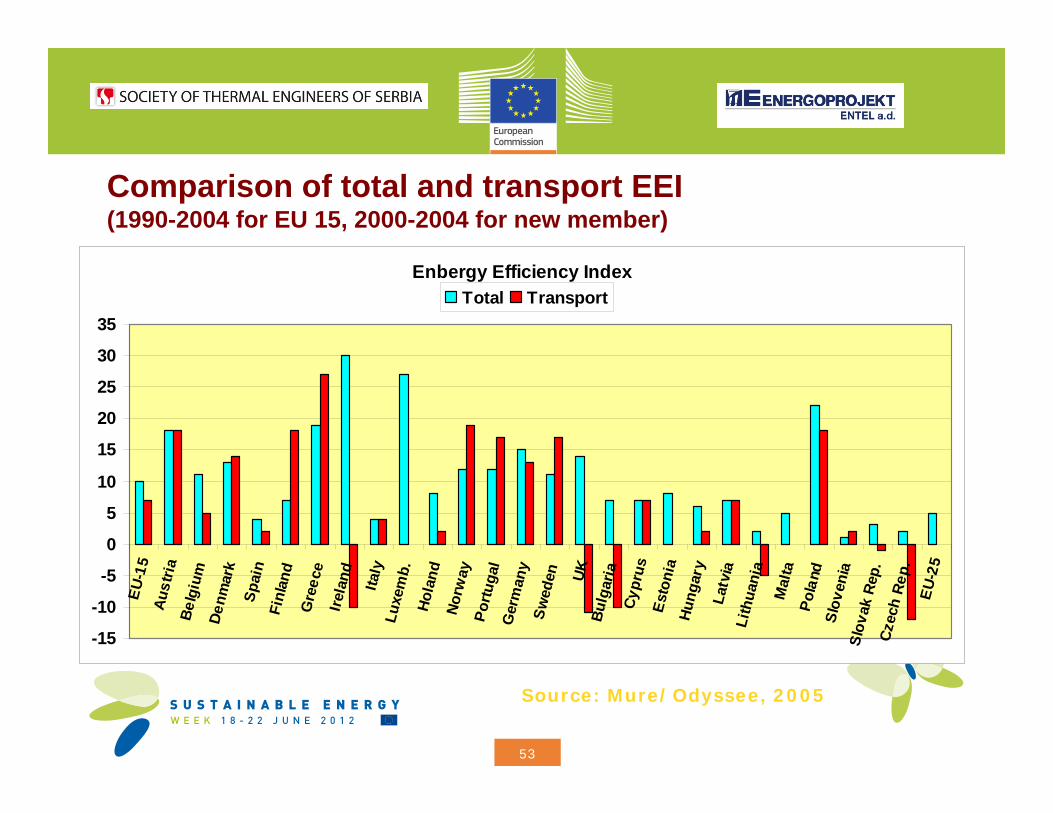
Comparison of total and transport EEI(1990-2004 for EU 15, 2000-2004 for new member)
Enbergy Efficiency Index
-15
-10
-5
0
5
10
15
20
25
30
35
EU-1
5Au
stria
Belg
ium
Denm
ark
Spai
nFi
nlan
dG
reec
eIre
land Italy
Luxe
mb.
Hola
ndNo
rway
Portu
gal
Ger
man
ySw
eden UK
Bulg
aria
Cypr
usEs
toni
aHu
ngar
yLa
tvia
Lith
uani
aM
alta
Pola
ndSl
oven
iaSl
ovak
Rep
.Cz
ech
Rep.
EU-2
5
Total Transport
Source: Mure/Odyssee, 2005

54
Transport energy efficiency in SerbiaThe unfavorable energy efficiency in the transport (though there are not official data) is the result of several factors:
• unfavorable age structure of both passenger and commercial vehicles (road - 15 years, rail - 31, ship - 37, air - 24 years);
• use of vehicle outdated technologies (leaded petrol, diesel D2, EURO 2/3 etc.);
• uncontrolled and often illegal import of foreign cars of dubiousorigin and technical condition (especially true for the last decade);
• use of defective vehicles;• failure to comply with factory instructions on use and maintenance
of vehicles;• bad, improper and irregular maintenance of vehicles;
• low traffic culture of road users;• inadequate travel distance of the vehicle use;
• lack of awareness of drivers on rational use of vehicles;• poor technical control and customer service, etc..
55
Transport energy efficiency in SerbiaThe traffic conditions are very often the cause of the
decreased energy efficiency:
• undeveloped, outdated and inefficient road network;• use of inappropriate infrastracture (especially in central cities, some of
which are from the nineteenth century);• lack of appropriate major arteries and bypass roads major cities;
• inadequate traffic management technology;• frequent traffic congestion despite the low level of motorization (number of
cars per 1000 inhabitants) and so on.

56
Transport energy efficiency in SerbiaAdopted Energy Development Strategy until 2015 has included also
the measures to improve the energy efficiency of transport:
Defining, identifying and adopting a national strategy on development of transport systems including: Program of transport infrastructure development program, Program of development of a unique and efficient transport system,
Program of development of integrated passenger transport in urban, suburban and intercity traffic, Program of traffic safety including the reduction
of negative environmental impact and Programme of the introduction of information systems.
Alignment and harmonization of regulations in the Republic of Serbia with the EU.
Renewal of the fleet in all sectors. Incentives for purchasing new cars and discourage the use of vehicles older than 15 years. Reducing taxes on
imports of certain categories of new, smaller cars and credit to stimulate new car sale from domestic production.

57
Transport energy efficiency in SerbiaEnergy Development Strategy emphasizes the importance of:
• Energy Efficiency Agency of Serbia (SEEA) under the Ministry of Energy and• National Program of Energy Efficiency program (NPEE) of the Ministry of
Science.
The problems treated in the framework of the energy efficiency of transport in NPEE are:
• development of methodology for monitoring the energy efficiency of transport,
• use of alternative fuels to power the vehicle,• problem of vehicle maintenance,
• infrastructure development and alternative modes of transport,• implementation of European legislation on ecology and energy of vehicles,
• development of advanced engines and vehicles.Unfortunately, after four years of successful work, this program has been canceled as unnecessary.

58
Transport Energy Efficiency
CONCLUSIONS:The importance of transport energy efficiency is increasing. To
achieve improvements in energy efficiency of transport in Serbia it is necessary to:
•Implement adopted national strategy on transport energy efficiency.
•Accept European norms, procedures and best practice in this field.•Create the conditions for the use of more rational forms of
transport.•Adopt special acts on the stimulation of energy efficient vehicles.
•Improve the conditions of public transport in order to ensure efficient transport of people and goods.
•Ensure the development and implementation of modern systems for traffic monitoring and control.
•Create conditions for the application of alternative fuels.•Intensify scientific research and development work to improve the
energy efficiency of transport.

59
Transport Energy Efficiency
ADDITIONAL CONCLUSIONS:
A conclusion is the place where you get tired of thinking…. Martin H. Fisher
Teamwork is essential _ it allows you to blame someone else….
Unknown
Thank You !