Energy efficiency in the European water industry
75
Energy efficiency in the European water industry A compendium of best practices and case studies KWR 2010.011 February 2010 2010-44
Transcript of Energy efficiency in the European water industry

Energy efficiency in the European water industry
A compendium of best practices and case studies
KWR 2010.011
February 2010
2010-44
Postbus 1072 3430 BB Nieuwegein The Netherlands P +31 30 606 95 11 F +31 30 606 11 65E [email protected]
Energy efficiency in the European water industry
A compendium of best practices and case studies
KWR 2010.011
February 2010

Colofon
Title Energy efficiency in the European water industry. A compendium of best practices and case studies.
Project number O710013
Client GWRC & UKWIR
Author(s) Jos Frijns (KWR) & Cora Uijterlinde (STOWA) Thanks are due to the case study contributors.
Energy efficiency in the European water industry
© KWR & STOWA - 1 - February 2010
Contents
Contents 1
1 Introduction 2
2 Key characteristics case studies 3
3 Case study descriptions 6
K1. Case Study Netherlands, Andijk (PWN) 7
K2. Case Study Netherlands, Bergambacht (Dunea) 9
K3. Case Study Belgium, Grobbendonk (Pidpa) 12
K4. Case study Belgium, Kluizen (VMW) 15
K5. Case Study Norway, Oslo (Oslo Water and Sewerage Works) 18
S1. Case study Netherlands, Rotterdam (Waterboard Hollandse Delta) 20
S2. Case Study Netherlands, Varsseveld (Waterboard Rijn & IJssel) 23
S3. Case study Netherlands, Rotterdam (Waterboard Hollandse Delta) 26
S4. Case study Netherlands, Amstelveen (Waternet) 28
S5. Case study Netherlands, Apeldoorn (Veluwe Waterboard) 30
S6. Case study Netherlands, Hoensbroek (Waterboard Limburg) 33
S7. Case study Netherlands, Sliedrecht (Waterboard Hollandse Delta) 36
S8. Case study Netherlands, Hapert (Waterboard De Dommel) 38
S9. Case study Netherlands, Tilburg (Waterboard De Dommel) 40
SE1. Case Study France (Lyonnaise de Eaux) 42
SE2. Case Study Spain (Agbar) 45
V1. Case Study France, Paris (SIAAP & Veolia) 48
V2. Case Study France (SIEVI & Veolia) 52
V3. Case Study Denmark, Avore (AWS) 55
V4. Case study Hungary, Budapest (Budapest Sewage Works) 59
E1. Case Study Switzerland, Zurich 63
E2. Case study Switzerland, Bern (arabern) 64
E3. Case Study Switzerland 65
T1. Case study Germany, Krefeld (Krefeld) 68
T2. Case Study Germany, Nindorf (Süderdithmarschen) 70

Energy efficiency in the European water industry
© KWR & STOWA - 2 - February 2010
1 Introduction
This European report on best practices of energy efficiency in the water industry has been compiled by KWR and STOWA. The report showcases 23 energy efficiency initiatives which were collected as case studies from European water utilities. The 25 case studies presented in this report will be submitted to UKWIR and Black and Veatch, for potential inclusion in the Global Water Research Coalition (GWRC) global compendium of best practice case studies. The aim of the GWRC compendium is to identify the promising developments and future opportunities to help deliver:
• Incremental improvements in energy efficiency through optimisation of existing assets and operations.
• More substantial improvements in energy efficiency from the adoption of novel (but proven at full scale) technologies.
The European report describes case studies from:
• Belgium
• Denmark
• France
• Germany
• Hungary
• Netherlands
• Norway
• Spain
• Switzerland Black & Veatch has gathered information on 47 cases from the UK. These are reported separately (B&V, UK Report, 2009) and are not included in this European overview. The information on the case studies has been collected by the following organisations:
• KWR: 2 cases from the Netherlands, 2 from Belgium and 1 from Norway
• STOWA: 9 from the Netherlands
• SUEZ: 1 from France, 1 from Spain
• Veolia: 2 from France, 1 from Denmark, 1 from Hungary
• EAWAG: 3 from Switzerland
• TZW: 2 from Germany. Information was obtained by interviews and subsequent reporting.

Energy efficiency in the European water industry
© KWR & STOWA - 3 - February 2010
2 Key characteristics case studies
The 25 case studies are plotted to the energy saving matrix provided by Black & Veatch (Figure 1). Figure 1: Water cycle energy saving matrix
WATER CYCLE ENERGY SAVING MATRIX Green boxes show priority areas
Raw Water Treatment Distribution Sewerage Treatment Disposal Re-use
Current Energy Usage estimate (%) 25 10 65 20 60 15
Demand Conservation
Management Leakage Reduction
Pumping Optimise Gravity Flow T1
Transfer Pumps K3, T2
Catchment Transfer K2
Aquifer Recharge
Treatment Screens / Preliminary
Sedimentation / PSTs S3, S4
Aeration / Mixing S6, S7
Filtration SSF / RGF
Intermediate / RAS Pumping
Filtration GAC K4, K5
Protection Membrane S2
Desal. Membrane/ Thermal
Disinfection / UV K1
Ozonation K4
Enhanced / Tertiary Treatment
Optimise Ops/Process V3
Sludge Sludge Thick/Dewatering S8, S9
Sludge Digestion S1, SE2, E1
Sludge Drying SE1
Disposal to Land
Building Services
Generation Mini Hydro-Turbines V2 V1
Heat pumps
Wind Turbines
Biogas / Cogeneration S5, V4, E2, E3
Incineration
Energy efficiency in the European water industry
© KWR & STOWA - 4 - February 2010
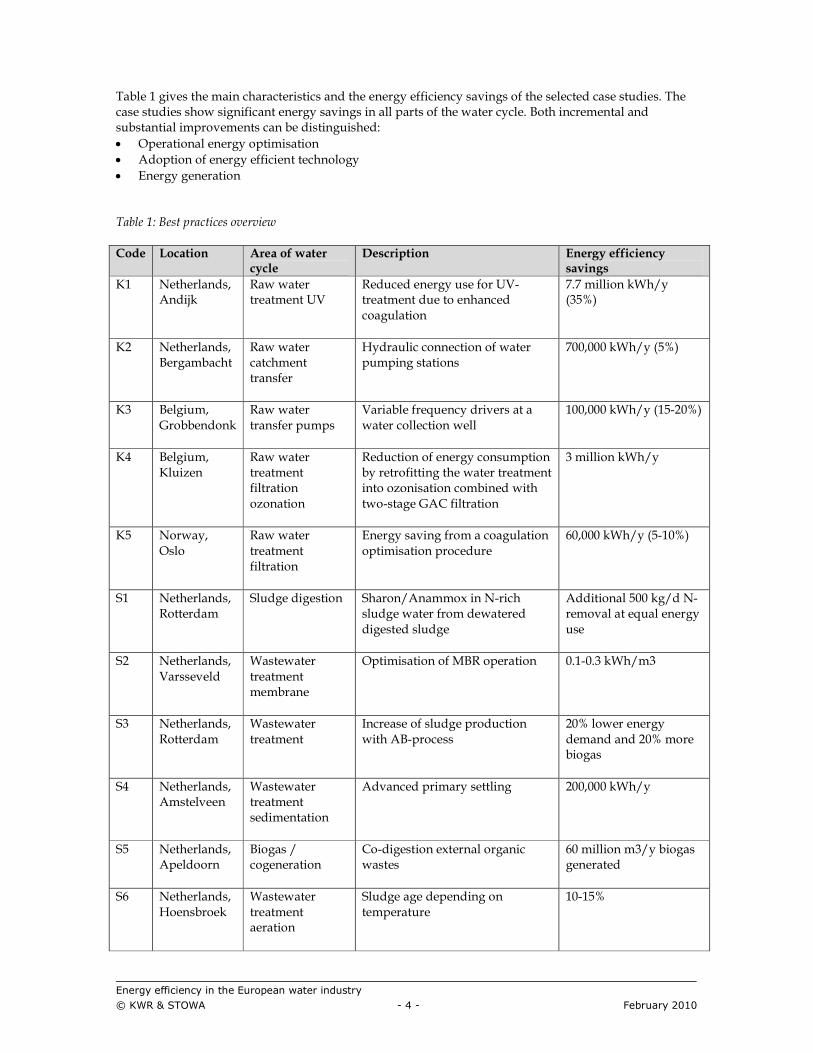
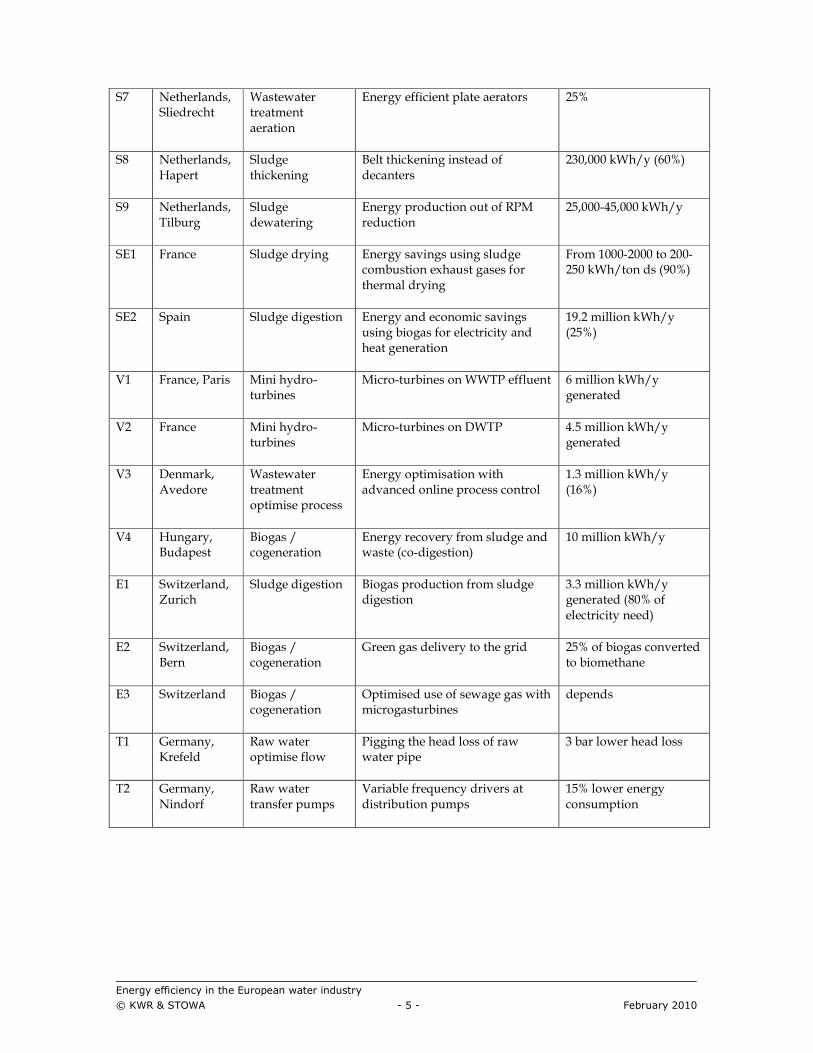
Table 1 gives the main characteristics and the energy efficiency savings of the selected case studies. The case studies show significant energy savings in all parts of the water cycle. Both incremental and substantial improvements can be distinguished:
• Operational energy optimisation
• Adoption of energy efficient technology
• Energy generation Table 1: Best practices overview
Code Location Area of water cycle
Description Energy efficiency savings
K1 Netherlands, Andijk
Raw water treatment UV
Reduced energy use for UV-treatment due to enhanced coagulation
7.7 million kWh/y (35%)
K2 Netherlands, Bergambacht
Raw water catchment transfer
Hydraulic connection of water pumping stations
700,000 kWh/y (5%)
K3 Belgium, Grobbendonk
Raw water transfer pumps
Variable frequency drivers at a water collection well
100,000 kWh/y (15-20%)
K4 Belgium, Kluizen
Raw water treatment filtration ozonation
Reduction of energy consumption by retrofitting the water treatment into ozonisation combined with two-stage GAC filtration
3 million kWh/y
K5 Norway, Oslo
Raw water treatment filtration
Energy saving from a coagulation optimisation procedure
60,000 kWh/y (5-10%)
S1 Netherlands, Rotterdam
Sludge digestion Sharon/Anammox in N-rich sludge water from dewatered digested sludge
Additional 500 kg/d N-removal at equal energy use
S2 Netherlands, Varsseveld
Wastewater treatment membrane
Optimisation of MBR operation 0.1-0.3 kWh/m3
S3 Netherlands, Rotterdam
Wastewater treatment
Increase of sludge production with AB-process
20% lower energy demand and 20% more biogas
S4 Netherlands, Amstelveen
Wastewater treatment sedimentation
Advanced primary settling 200,000 kWh/y
S5 Netherlands, Apeldoorn
Biogas / cogeneration
Co-digestion external organic wastes
60 million m3/y biogas generated
S6 Netherlands, Hoensbroek
Wastewater treatment aeration
Sludge age depending on temperature
10-15%
Energy efficiency in the European water industry
© KWR & STOWA - 5 - February 2010
S7 Netherlands, Sliedrecht
Wastewater treatment aeration
Energy efficient plate aerators 25%
S8 Netherlands, Hapert
Sludge thickening
Belt thickening instead of decanters
230,000 kWh/y (60%)
S9 Netherlands, Tilburg
Sludge dewatering
Energy production out of RPM reduction
25,000-45,000 kWh/y
SE1 France Sludge drying Energy savings using sludge combustion exhaust gases for thermal drying
From 1000-2000 to 200-250 kWh/ton ds (90%)
SE2 Spain Sludge digestion Energy and economic savings using biogas for electricity and heat generation
19.2 million kWh/y (25%)
V1 France, Paris Mini hydro-turbines
Micro-turbines on WWTP effluent 6 million kWh/y generated
V2 France Mini hydro-turbines
Micro-turbines on DWTP 4.5 million kWh/y generated
V3 Denmark, Avedore
Wastewater treatment optimise process
Energy optimisation with advanced online process control
1.3 million kWh/y (16%)
V4 Hungary, Budapest
Biogas / cogeneration
Energy recovery from sludge and waste (co-digestion)
10 million kWh/y
E1 Switzerland, Zurich
Sludge digestion Biogas production from sludge digestion
3.3 million kWh/y generated (80% of electricity need)
E2 Switzerland, Bern
Biogas / cogeneration
Green gas delivery to the grid 25% of biogas converted to biomethane
E3 Switzerland Biogas / cogeneration
Optimised use of sewage gas with microgasturbines
depends
T1 Germany, Krefeld
Raw water optimise flow
Pigging the head loss of raw water pipe
3 bar lower head loss
T2 Germany, Nindorf
Raw water transfer pumps
Variable frequency drivers at distribution pumps
15% lower energy consumption

Energy efficiency in the European water industry
© KWR & STOWA - 6 - February 2010
3 Case study descriptions

Energy efficiency in the European water industry
© KWR & STOWA - 7 - February 2010
K1. Case Study Netherlands, Andijk (PWN)
Reduced energy use for UV-treatment due to enhanced coagulation At WTP Andijk, the energy consumption of UV-treatment was reduced from 0.6 to 0.38 kWh/m3 by decreasing the dissolved organic carbon level. This was achieved by changing the pH-correction after coagulation. The energy gain of this enhanced coagulation before the UV/H2O2-treatment is about 35% ( 7.7 million kWh/year).
Ref Enquiry Item Response information, description and remarks
1 Location: Country, urban or rural: Netherlands, Andijk.
2 Sector: clean, waste or sludge: Clean. Drinking water production. Source: lake IJsselmeer.
3 Works Owner or Operator: with financial set-up, regulatory or not.
PWN. Provincial Water Company of Noord-Holland (1½ million customers). Regulators: Ministry of Environment and Province.
4 Size: flows and loads or population equivalent: Andijk treats 95 000 m3 of water per day and serves over ½ million people.
5 Energy Provider: with costs, incentives, taxes and
conditions:
0.085 €/kWh.
6 Process: physical, chemical, or biological description:
Physical-chemical. Enhanced coagulation prior to advanced oxidation for drinking water production.
7 Component: all or part of the works: Grouped components: coagulation and advanced oxidation.
8 Specific energy problem: including quality or consent details:
UV-treatment is highly energy intensive. By decreasing the dissolved organic carbon level the energy use can be substantially reduced. This can be achieved with enhanced coagulation (by having pH-correction after coagulation). A malfunction with the pH-correction revealed an increase of UV-transmission. This prompted the idea for enhanced coagulation and energy saving.
9 Process/Plant changes: mechanical, electrical or controls:
Process change, pH correction after coagulation.
10 Civil/Physical Changes: to water / effluent quality, civil works, or process:
Sodium hydroxide dosing was replaced from the influent to the effluent of the flocculator.
11 Operational Changes: skill levels, procedures and maintenance routines:
Monitoring required for pH, DOC and UV-transmission.
12 Risks and Dependencies: risk assessment of project and changes.
Stable process with improved biological stability. Sufficient contact time for coagulation is required.
13 Implementation: design, build, procurement, installation and commissioning:
Process change only.
14 Energy Efficiency gains: kWh & kWh/m3 The energy consumption for UV-treatment was reduced from 0.6 to 0.38 kWh/m3 (35%). In total the energy gain is 7.7 million kWh/yr.

Energy efficiency in the European water industry
© KWR & STOWA - 8 - February 2010
15 Cost / Benefit analysis: financial appraisal or payback time.
Mainly a process change, thus limited costs. About 1/3 saving in energy cost (more than 600,000 Euro per year).
16 Project review: could it be improved or developed?
Enhanced coagulation is of potential interest to other sites with high required Fe-dosing.
17 Confidence grade: on data provided. High.
Observations
10-9-2009 Information compiled by Jos Frijns (KWR) in consultation with Erik Koreman (PWN) and based on Koreman et al (2009), H2O (42)16/17: 48-51. At water production site Andijk, PWN treats surface water using the world’s first large scale application of advanced oxidation with UV/H2O2. This advanced oxidation is placed between the existing pretreatment and GAC filtration. UV/H2O2 treatment is a cost-effective method, since two treatment steps are integrated: disinfection and degradation of organic micro-contaminants. However, conventional UV treatment uses relatively much energy (0.6 kWh/m3). Therefore, PWN has investigated the possibility to apply enhanced coagulation with the aim of decreasing the dissolved organic carbon (DOC) which will reduce the energy use of UV-treatment. Enhanced coagulation was implemented by applying pH correction after coagulation (replacing the sodium hydroxide dosing). The resulting lower DOC levels has resulted in a reduced energy consumption of UV-treatment with 35% to 0.38 kWh/m3. This resembles a total energy gain of 7.7 million kWh/yr. In addition, research is being conducted to eventually replace the pretreatment with ion exchange and membrane filtration (likewise substantially reducing the energy use of UV-treatment). PWN uses "green electricity" for the process, and surplus heat is re-used for heating. Also installing wind energy at Andijk is under consideration.

Energy efficiency in the European water industry
© KWR & STOWA - 9 - February 2010
K2. Case Study Netherlands, Bergambacht (Dunea)
Hydraulic connection of water pumping stations Installing an hydraulic connection between the water intake pumping station Brakel and the water transport pumping station Bergambacht, resulted in a substantial reduction of water spillage at Bergambacht. Together with the established harmonised control of water flow between the stations, this has resulted in more than 700,000 kWh/y energy gain.
Ref Enquiry Item Response information, description and remarks
1 Location: Country, urban or rural: Netherlands, Bergambacht.
2 Sector: clean, waste or sludge: Clean. Pretreated river water.
3 Works Owner or Operator: with financial set-
up, regulatory or not.
Dunea. Water company. Shareholders: 19 municipalities. Regulators: Ministry of Environment and Province
4 Size: flows and loads or population equivalent:
75 million m3 per year
5 Energy Provider: with costs, incentives, taxes
and conditions:
Nuon electricity (private) Cost: ± 0.085 € / kWh
6 Process: physical, chemical, or biological description:
Water transport (intake) Physical (hydraulic junction) and control engineering.
7 Component: all or part of the works: River water transport (transport from intake point of surface water to pumping station).
8 Specific energy problem: including quality or consent details:
Main incentive is from environmental objectives of the company and employees: prevention of wastage of water and energy.
9 Process/Plant changes: mechanical, electrical or controls:
Automation control. Control (for water transport from Brakel) linked to basin level (at Bergambacht).
10 Civil/Physical Changes: to water / effluent quality, civil works, or process:
Hydraulic junction of Brakel transport pipe to intake pipe of Bergambacht. Adjustment of intake work (valves).
11 Operational Changes: skill levels, procedures and maintenance routines:
Training in process automation. Harmonise procedures between Brakel and Bergambacht.
12 Risks and Dependencies: risk assessment of project and changes.
Risk assessment was performed, especially in relation to high pressure in pipe versus dike stability.
13 Implementation: design, build, procurement, installation and commissioning:
Construction costs for hydraulic junction were part of a major dike renovation project. Limited costs for control engineering.
14 Energy Efficiency gains: kWh & kWh/m3 Before: 13.4 million kWh/y. Transport of 86 million m3 water of which 4.5 million m3 drain lost. Average: 0.16 kWh/m3, thus potential gain: 700,000 kWh/y. After: 9.7-10.1 million kWh/y. Transport of 76 million m3 water. Average: 0.13 kWh/m3.
15 Cost / Benefit analysis: financial appraisal or

Energy efficiency in the European water industry
© KWR & STOWA - 10 - February 2010
payback time. 16 Project review: could it be improved or
developed?
Key was to take the opportunity of improving the linkage between the transport pipes in combination with planned dike renovation.
17 Confidence grade: on data provided. Low.
Observations
19 August 2009, pumping station Bergambacht, Dunea. Interview by Jos Frijns (KWR) with: Ruud Draak (technical processes) and Rob Noordhuizen (river water intake). Dunea is the water company for the western part of South-Holland (1.2 million inhabitants).Water from the river Meuse is extracted near Brakel and transported to Bergambacht, a distance of 30 km. The water is pre-treated in Bergambacht and then transported to the dunes, a distance of 60 km. After infiltration of the water in the dunes, the water is further treated and distributed. At the intake point of Bergambacht, the water transported from Brakel goes to a small reservoir at the river bank of the Lek. As previously the intake of Bergambacht was not harmonised to the input from Brakel, about 5% of the distributed water from Brakel drained to the river Lek. Thus, a potential of 5% of water and thus of the pumping energy of Brakel, i.e. 700,000 kWh/y, could be gained by establishing an hydraulic connection between Bergambacht and Brakel.

Energy efficiency in the European water industry
© KWR & STOWA - 11 - February 2010
The hydraulic connection was installed at the same time with a major dike maintenance activity. The main incentive came from environmental objectives of the company and employees. As Rob Nieuwenhuizen puts it: “You simply don’t want wasting of resources.” Other examples of energy conservation measures implemented by Dunea (in 1999) are new circulation pumps with VSD (300,000 kWh/y gain) and adjustment of Fe-supply (50,000 kWh/y gain).

Energy efficiency in the European water industry
© KWR & STOWA - 12 - February 2010
K3. Case Study Belgium, Grobbendonk (Pidpa)
Variable frequency drivers at a water collection well The application of variable frequency drivers at the pumps of the water collection well Grobbendonk resulted in about 15-20% energy saving, i.e. ca. 100.000 kWh/y.
Ref Enquiry Item Response information, description and remarks
1 Location: Country, urban or rural: Belgium, Grobbendonk. Rural. Water Production Centre Grobbendonk delivers water to a large rural area South-East of Antwerp.
2 Sector: clean, waste or sludge: Clean. Collection of groundwater in wells for production of drinking water.
3 Works Owner or Operator: with financial set-up, regulatory or not.
Pidpa is the drinking water company of the province of Antwerp. Pidpa is an intercommunity without private interests. Her partners are the Province of Antwerp and 67 communities in this province.
4 Size: flows and loads or population
equivalent:
6.2 million m3 per year. The water collection has 30 wells with a capacity of 20,000 m3/d.
5 Energy Provider: with costs, incentives, taxes and conditions:
Electrabel (electricity, private) Cost: 0.085 € / kWh (due to continuous operation for water collection there is little room for peak discounts). Energy resembles about 1/3 of the variable costs.
6 Process: physical, chemical, or biological description:
Physical: ground water collection in wells equiped with pump. After collection the water is aerated, filtered, desinfected and distributed at Grobbendonk water production centre.
7 Component: all or part of the works: Ground water collection in wells.
8 Specific energy problem: including quality or consent details:
The water collection wells of Grobbendonk are sensible for clogging, increasing the pumping head with up to 10 meters over the years. Moreover, the groundwater level has a 2 meter seasonal variation, and mutual influence on collection between wells can have an effect on the level of about 5 meter. Thus, originally the wells were equiped with oversized pumps that had to be strangled, so that sufficient head would remain available. To overcome the related energy loss, variable frequency drivers have been installed at the low pressure pumps of 11 new wells (of the 30). Variable frequency drivers, or variable speed drivers (VSD) alter the frequency and voltage of the electrical supply to a motor, and allow speed and torque control without wasting power. Main incentive was cost saving from energy saving.
9 Process/Plant changes: mechanical, electrical or controls:
Electrical control: VSD. Electromagnetic flow meter and a PLC for flow control.

Energy efficiency in the European water industry
© KWR & STOWA - 13 - February 2010
10 Civil/Physical Changes: to water / effluent
quality, civil works, or process:
The cover of the water well was equiped with an opening for ventilation of the VSD.
11 Operational Changes: skill levels, procedures and maintenance routines:
No training or new maintenance procedures needed as VSD are common practice at Pidpa.
12 Risks and Dependencies: risk assessment of project and changes.
As there are several wells in operation, the consequences of VSD failure are limited. VSD are proven technology.
13 Implementation: design, build, procurement, installation and commissioning:
The VSD was installed during renewal of the wells, operated by the contractor Smet GWT. The additional costs for equiping the wells with VSD were about 3,000 Euro per well. About 1,000 Euro of this was subsidised (energy conservation subsidy).
14 Energy Efficiency gains: kWh & kWh/m3 On average, about 5 m pumping head could be gained. The pumps discharge 50 m3/h, 365 days per year, with an efficiency of 62.4%. Thus the energy gain is about 9,600 kWh per pump (or about 15%). This equals 0.022 kWh/m3 energy gain. In total, for the 11 pumps, the energy gain is 105,000 kWh/y. The average energy use at the wells without VSD is about 0.11 kWh/m3. Application of VSD thus has a 20% energy efficiency improvement.
15 Cost / Benefit analysis: financial appraisal or payback time.
The yearly cost saving for each pump is 815 Euro. The payback time is 2.5 years.
16 Project review: could it be improved or developed?
In the near future the other 19 water collection wells will also be equiped with VSD. When all 30 wells have VSD, the pumping control regime can be changed from an on-off mode into a continous control. This will result in additional energy savings. Moreover, less operation switching might have a positive effect on the life span of the well.
17 Confidence grade: on data provided. Average. No direct energy monitoring of individual pumps/VSD.
Observations
26 August 2009, Water Production Centre Grobbendonk, Pidpa. Interview by Jos Frijns (KWR) with: Lieven De Maeyer (electromechanics) and Koen Borstlap (production). Pidpa, the Provincial and Interurban Drinking Water Company in the province of Antwerp, provides water to 65 municipalities in the province of Antwerp. At Grobbendonk, drinking water is produced from 30 wells that collect groundwater. In the water distribution system, VSD have been installed at the high pressure pumps, resulting in energy saving from a steady flow control. During renovations of 11 water collection wells, Pidpa decided to apply VSD as well at the low pressure pumps of the wells. This elimated the existing practice of strangling oversized pumps. On average 5 m pumping head was gained, or 9,600 kWh/y energy gain per pump, a 15-20% energy efficiency improvement. Total savings are about 100,000 kWh/y. Payback time is 2.5 years.

Energy efficiency in the European water industry
© KWR & STOWA - 14 - February 2010
The main incentive was cost saving, although Lieven De Maeyer added: “energy is a performance indicator in the balance score card of Pidpa”.
Energy efficiency in the European water industry
© KWR & STOWA - 15 - February 2010
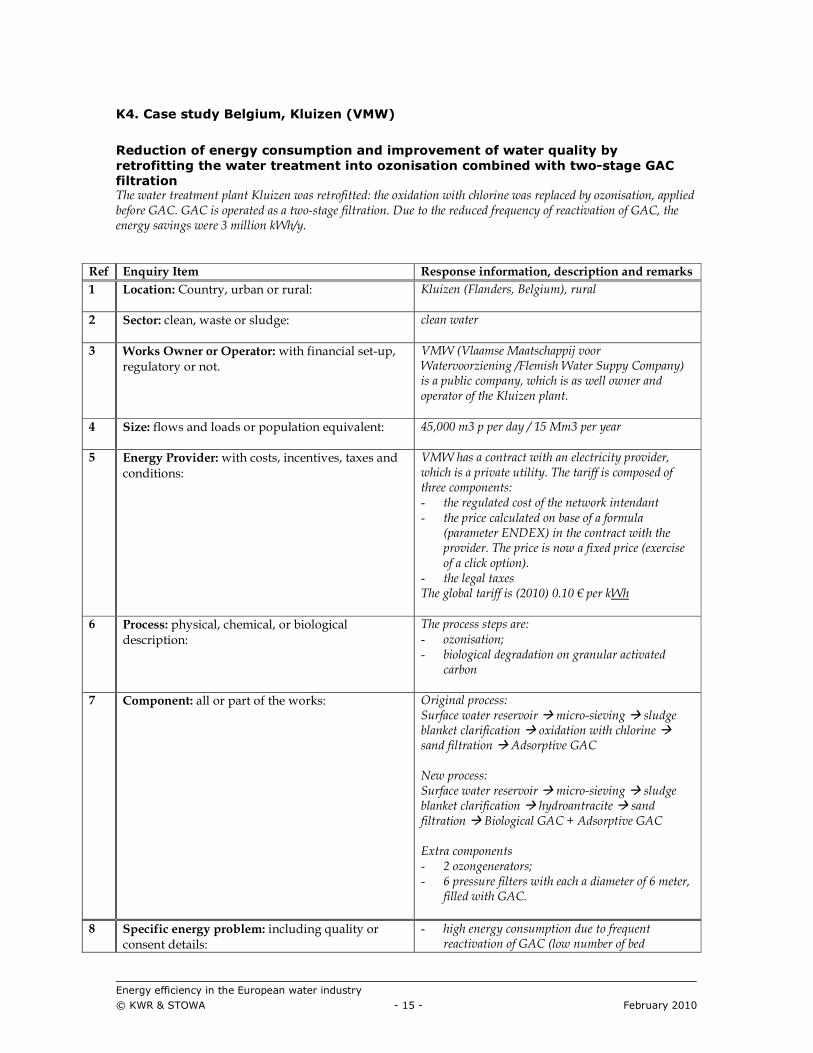
K4. Case study Belgium, Kluizen (VMW)
Reduction of energy consumption and improvement of water quality by
retrofitting the water treatment into ozonisation combined with two-stage GAC
filtration The water treatment plant Kluizen was retrofitted: the oxidation with chlorine was replaced by ozonisation, applied before GAC. GAC is operated as a two-stage filtration. Due to the reduced frequency of reactivation of GAC, the energy savings were 3 million kWh/y.
Ref Enquiry Item Response information, description and remarks
1 Location: Country, urban or rural: Kluizen (Flanders, Belgium), rural
2 Sector: clean, waste or sludge: clean water
3 Works Owner or Operator: with financial set-up, regulatory or not.
VMW (Vlaamse Maatschappij voor Watervoorziening /Flemish Water Suppy Company) is a public company, which is as well owner and operator of the Kluizen plant.
4 Size: flows and loads or population equivalent: 45,000 m3 p per day / 15 Mm3 per year
5 Energy Provider: with costs, incentives, taxes and conditions:
VMW has a contract with an electricity provider, which is a private utility. The tariff is composed of three components: - the regulated cost of the network intendant - the price calculated on base of a formula
(parameter ENDEX) in the contract with the provider. The price is now a fixed price (exercise of a click option).
- the legal taxes The global tariff is (2010) 0.10 € per kWh
6 Process: physical, chemical, or biological description:
The process steps are: - ozonisation; - biological degradation on granular activated
carbon
7 Component: all or part of the works: Original process: Surface water reservoir � micro-sieving � sludge blanket clarification � oxidation with chlorine � sand filtration � Adsorptive GAC New process: Surface water reservoir � micro-sieving � sludge blanket clarification � hydroantracite � sand filtration � Biological GAC + Adsorptive GAC Extra components - 2 ozongenerators; - 6 pressure filters with each a diameter of 6 meter,
filled with GAC.
8 Specific energy problem: including quality or consent details:
- high energy consumption due to frequent reactivation of GAC (low number of bed
Energy efficiency in the European water industry
© KWR & STOWA - 16 - February 2010
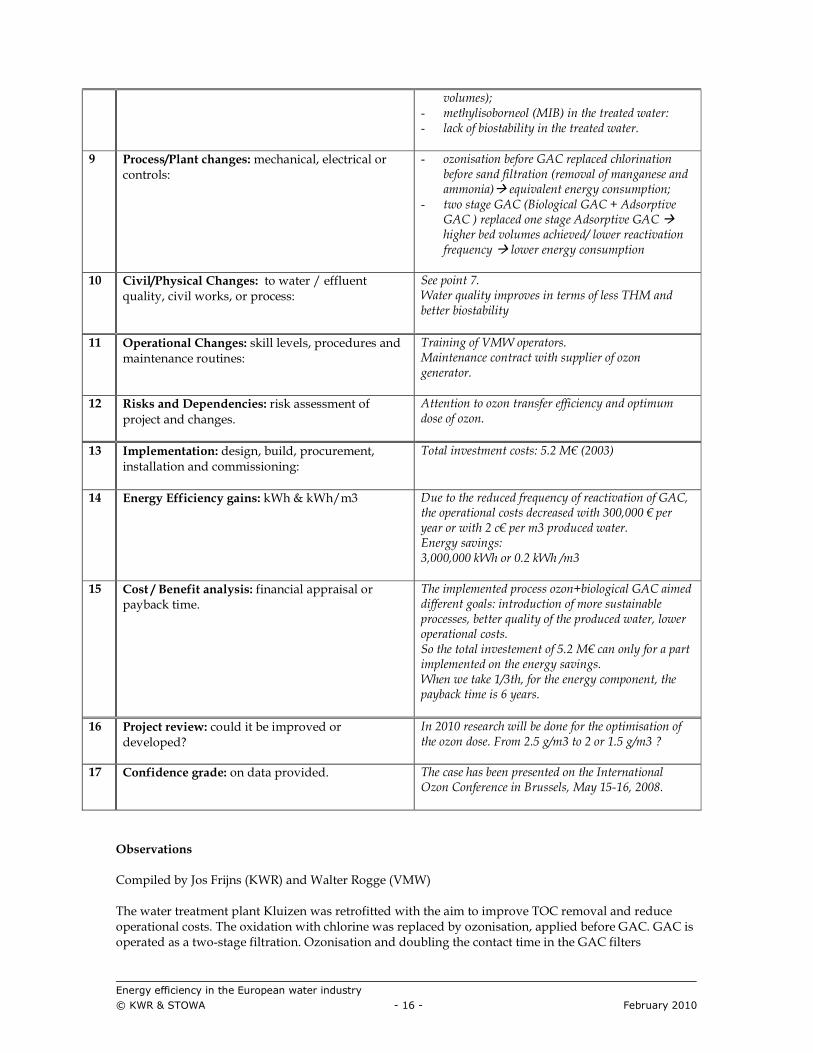
volumes); - methylisoborneol (MIB) in the treated water: - lack of biostability in the treated water.
9 Process/Plant changes: mechanical, electrical or controls:
- ozonisation before GAC replaced chlorination before sand filtration (removal of manganese and ammonia)� equivalent energy consumption;
- two stage GAC (Biological GAC + Adsorptive GAC ) replaced one stage Adsorptive GAC � higher bed volumes achieved/ lower reactivation frequency � lower energy consumption
10 Civil/Physical Changes: to water / effluent quality, civil works, or process:
See point 7. Water quality improves in terms of less THM and better biostability
11 Operational Changes: skill levels, procedures and maintenance routines:
Training of VMW operators. Maintenance contract with supplier of ozon generator.
12 Risks and Dependencies: risk assessment of project and changes.
Attention to ozon transfer efficiency and optimum dose of ozon.
13 Implementation: design, build, procurement, installation and commissioning:
Total investment costs: 5.2 M€ (2003)
14 Energy Efficiency gains: kWh & kWh/m3 Due to the reduced frequency of reactivation of GAC, the operational costs decreased with 300,000 € per year or with 2 c€ per m3 produced water. Energy savings: 3,000,000 kWh or 0.2 kWh /m3
15 Cost / Benefit analysis: financial appraisal or payback time.
The implemented process ozon+biological GAC aimed different goals: introduction of more sustainable processes, better quality of the produced water, lower operational costs. So the total investement of 5.2 M€ can only for a part implemented on the energy savings. When we take 1/3th, for the energy component, the payback time is 6 years.
16 Project review: could it be improved or developed?
In 2010 research will be done for the optimisation of the ozon dose. From 2.5 g/m3 to 2 or 1.5 g/m3 ?
17 Confidence grade: on data provided. The case has been presented on the International Ozon Conference in Brussels, May 15-16, 2008.
Observations Compiled by Jos Frijns (KWR) and Walter Rogge (VMW) The water treatment plant Kluizen was retrofitted with the aim to improve TOC removal and reduce operational costs. The oxidation with chlorine was replaced by ozonisation, applied before GAC. GAC is operated as a two-stage filtration. Ozonisation and doubling the contact time in the GAC filters
Energy efficiency in the European water industry
© KWR & STOWA - 17 - February 2010
improved a number of water quality parameters: THM, biostability and odour compounds. In addition GAC regeneration costs and energy consumption decreased. Due to the reduced frequency of reactivation of GAC, the energy savings were 3 million kWh/y. Reference Cromphout, J. & Vanhoucke, R. (2008), Reduction of exploitation costs and improvement of water quality by the implementation of ozonation at the Waterworks in Kluizen, IOA International Conference, Brussels, May 15-16

Energy efficiency in the European water industry
© KWR & STOWA - 18 - February 2010
K5. Case Study Norway, Oslo (Oslo Water and Sewerage Works)
Energy savings from a coagulation optimisation procedure Introduction of an optimisation procedure for coagulation at Skullerud water treatment plant, revealed possible optimization benefits of: 1) 40% less coagulant usage, 2) 40% less sludge production, and 3) 5-10% less energy usage.
Ref Enquiry Item Response information, description and remarks
1 Location: Country, urban or rural: Norway, urban (Oslo)
2 Sector: clean, waste or sludge: Clean.
3 Works Owner or Operator: with financial set-up,
regulatory or not.
Oslo Water and Sewerage Works is a municipally-run utility responsible for the supply and treatment of drinking water and sewage in the municipalities of Oslo and Ski. All activity is financed through water-and-wastewater collection fees.
4 Size: flows and loads or population equivalent: Skullerud WTP is a direct filtration plant with a treatment capacity of 1800 m3/hr in two parallel lines. Skullerud covers 10% of Oslo population. Water source: Lake Elvaga.
5 Energy Provider: with costs, incentives, taxes and conditions:
6 Process: physical, chemical, or biological description:
Chemical purification and filtering for drinking water production.
7 Component: all or part of the works: Coagulation with aluminum sulphate and polymer to bind humus and particles in floccules.
8 Specific energy problem: including quality or consent details:
Optimisation of coagulation, including chemical dose, sludge, costs and energy. New research and modelling of chemical dose for coagulation caused the project.
9 Process/Plant changes: mechanical, electrical or controls:
A knowledge-based enhanced coagulation optimization procedure.
10 Civil/Physical Changes: to water / effluent quality, civil works, or process:
Reduced coagulation dose levels.
11 Operational Changes: skill levels, procedures and maintenance routines:
Lowering of the coagulant dosage level leads to a narrowing of the pH-window for optimal process performance. A strict process and pH control is therefore required.
12 Risks and Dependencies: risk assessment of project and changes.
When approaching the absolute minimum coagulant dose level, filter effluent turbidity and residual coagulant concentrations are the most sensitive parameters.
13 Implementation: design, build, procurement, installation and commissioning:
Optimisation procedure only. Monitoring.
14 Energy Efficiency gains: kWh & kWh/m3 By utilising the full optimisation potential, close to 40% less coagulant and 40% less sludge production

Energy efficiency in the European water industry
© KWR & STOWA - 19 - February 2010
could be obtained. In addition, 5-10% less energy is needed for water backwash and sludge processing due to less solids loads, less pumping and prolonged filter runs. Energy gain: about 60,000 kWh/y.
15 Cost / Benefit analysis: financial appraisal or payback time.
Immediate payback (limited investment costs, i.e. process modelling only). Operational cost savings of 0.36 cents pr. m3 could be achieved at this WTP. With an annual water production of 11 mill. m3, this amounts to about 39 000 € per year (about 15% due to energy savings).
16 Project review: could it be improved or developed?
Enhanced coagulation optimization procedure can easily be implemented at existing WTPs without compromising treated water quality.
17 Confidence grade: on data provided. Good.
Observations
Compiled by Jos Frijns (KWR) based on information from Bjornar Eikebrokk (SINTEF) and Techneau report ‘Water treatment by enhanced coagulation and ozonation-biofiltration’ (2007) Skullerud WTP is a direct filtration plant of Oslo Water and Sewerage Works (VAV). The treatment includes alum coagulation, flocculation and 3-M filtration. Backwashing is performed with air and water. In order to identify optimization potentials and possible benefits, SINTEF and VAV performed a full-scale optimisation procedure of the coagulation at Skullerud WTP. Based on experiences from a number of plants and model predictions, the existing applied dose was considered too high, thus indicating a potential for reductions in coagulant dose level and related energy gain (e.g. less frequent backwash due to a reduced solids load, i.e. extended filter run length), less sludge production and lower operation costs. By utilising the full optimisation potential, close to 40% less coagulant usage (from 23 to 14 mg Al per liter) and 40% less sludge production could be obtained at Skullerud WTP. In addition, 5-10% less energy (about 60,000 kWh/y) is needed for water backwash and sludge processing due to less solids load, less pumping and less backwash due to prolonged filter runs. This corresponded to a cost saving potential of about 0.36 cents/m3, without compromising treated water quality. As the full optimisation potential requires a very strict pH and process control, utilising 50-70 % rather that 100 % of the full potential should be preferable in most cases.

Energy efficiency in the European water industry
© KWR & STOWA - 20 - February 2010
S1. Case study Netherlands, Rotterdam (Waterboard Hollandse Delta)
Sharon/Anammox in N-rich sludge water from dewatered digested sludge The oxygen demand and therefore the energy consumption of Sharon/Anammox process is very low, due to the partial oxidation. Introduction of this process at the digester effluent resulted in an extra 500 kg N/d removal at an equal energy consumption.
Ref Enquiry Item Response information, description and remarks
1 Location: Country, urban or rural: NL, urban
2 Sector: clean, waste or sludge: Wastewater, sludge
3 Works Owner or Operator: with financial set-up, regulatory or not.
Sludge treatment Sluisjesdijk/WWTP Dokhaven Rotterdam; Waterboard Hollandse Delta, public authority
4 Size: flows and loads or population equivalent:
600-700 kg N/d; 500-600 m3/d
5 Energy Provider: with costs, incentives, taxes and conditions:
-
6 Process: physical, chemical, or biological description:
Biological N-removal with low energy demand
7 Component: all or part of the works: Supplemental process in sludge water from dewatered digester effluent
8 Specific energy problem: including quality or consent details:
Treatment of sludge water from dewatered digester effluent (e.eg in aeration tank has a high energy demand in conventional nitrification/denitrification process
9 Process/Plant changes: mechanical, electrical or controls:
Sludge water from dewatered digester effluent treated in two supplemental reactors instead of treatment in aerations tank
10 Civil/Physical Changes: to water / effluent quality, civil works, or process
Two supplemental reactors; large reduction of N-discharge in effluent
11 Operational Changes: skill levels, procedures and maintenance routines:
Two supplemental reactors; sensitivity of anammox bacteria for oxygen and toxics and control of process requires continuous monitoring and automatic control
12 Risks and Dependencies: risk assessment of project and changes.
Low growing rate of anammox bacteria; toxicity of oxygen, sulphide and some organics
13 Implementation: design, build, procurement, installation and commissioning:
Process was first full scale demonstration with on site optimization
14 Energy Efficiency gains: kWh & kWh/m3 Equal energy consumption and extra N-removal of 500 kg/d;
15 Cost / Benefit analysis: financial appraisal or payback time.
Benefits compared with aerobic treatment in activated sludge plant: 100.000 euro/y

Energy efficiency in the European water industry
© KWR & STOWA - 21 - February 2010
16 Project review: could it be improved or developed?
Process applicable on sites with N-rich flows resulting in 60% reduction energy demand at equal N-removal; further optimization possible by integrating Sharon and Anammox process in one reactor (Canon)
17 Confidence grade: on data provided. During start-up years unstable process, many data available. Currently all important process parameters are available and process is applicable on many N-rich streams
Observations Compiled by Eef Leeuw and Cora Uijterlinde (STOWA) The WWTP Rotterdam-Dokhaven is a municipal wastewater treatment plant with a capacity of 620.000 p.e. and 19.000 m3/h. The treatment is based on biological AB-process. The excess sludge is thickened, digested and dewatered in the nearby location of Sluisjesdijk. The digester effluent, which is high N-concentrated (approx. 1,0-1,2 gN/l), is recycled to the WWTP and contributes for about 15-20% in the total N-load (4.000-4.500 kg N/d) of the plant. The N-removal in the activated sludge system was based on conventional nitrification and denitrification. In this project the SHARON/ANAMMOX-process was introduced as a separated treatment for the digester effluent. The SHARON-process is based on a partial ammonium oxidation. Partial in two ways: oxidation from ammonium to nitrite (no nitrate) and only 50% of the ammonium is oxidized. Therefore the SHARON-effluent is a 50%/50% mixture of ammonium and nitrite. Due to the partial oxidation, the oxygen demand (and therefore the energy consumption) is very low. The SHARON-effluent is treated in the ANAMMOX –reactor where the ammonium and nitrite is reduced in one step by special anammox bacteria to nitrogen gas. Oxygen is toxic, therefore no aeration, only a limited energy demand for mixing. Although a 50-60% energy reduction might be reached in the treatment of the N-rich digester effluent, this was not achieved in the Dokhaven-project. However, the SHARON-ANAMMOX-process resulted in an extra 500 kg N/d removal at an equal energy consumption.
For other projects, where the N-removal is already optimal/maximal, the introduction of the SHARON/ANAMMOX can achieve a significant reduction of the energy demand. Other advantage of the process is that no carbon source is neaded/used for denitrification. Also the small excess sludge production is an advantage, however, this is at the same time a risk factor: after a disturbance of the anammox bacteria population it takes a long time to regrow in the system. Although

Energy efficiency in the European water industry
© KWR & STOWA - 22 - February 2010
this has happened several times during the start up period, much knowledge of the process has been gained and the process is reliable now for implementation. The SHARON/ANAMMOX-process is also successfully used for several N-rich industrial waste water (tannery, food-processing). In one case the process has been optimized in the one reactor CANON-process with lower investment costs. More information: http://www.stowa.nl/Service/Publicaties/Zuiveren_van_afvalwater.aspx?rId=5290 http://www.anammox.com/application.html http://www.stowa.nl/Uploads/agenda/8%20Olaf%20Duin.pdf http://www.vlm.fme.nl/vlm/webPages.do;jsessionid=7AC5F6D353F55FF488740F4710B880CE?pageID=201471 http://www.paques.nl/documents/papers/PAPER%20347%20-%20The%20advance%20of%20Anammox.pdf
Energy efficiency in the European water industry
© KWR & STOWA - 23 - February 2010
S2. Case Study Netherlands, Varsseveld (Waterboard Rijn & IJssel)
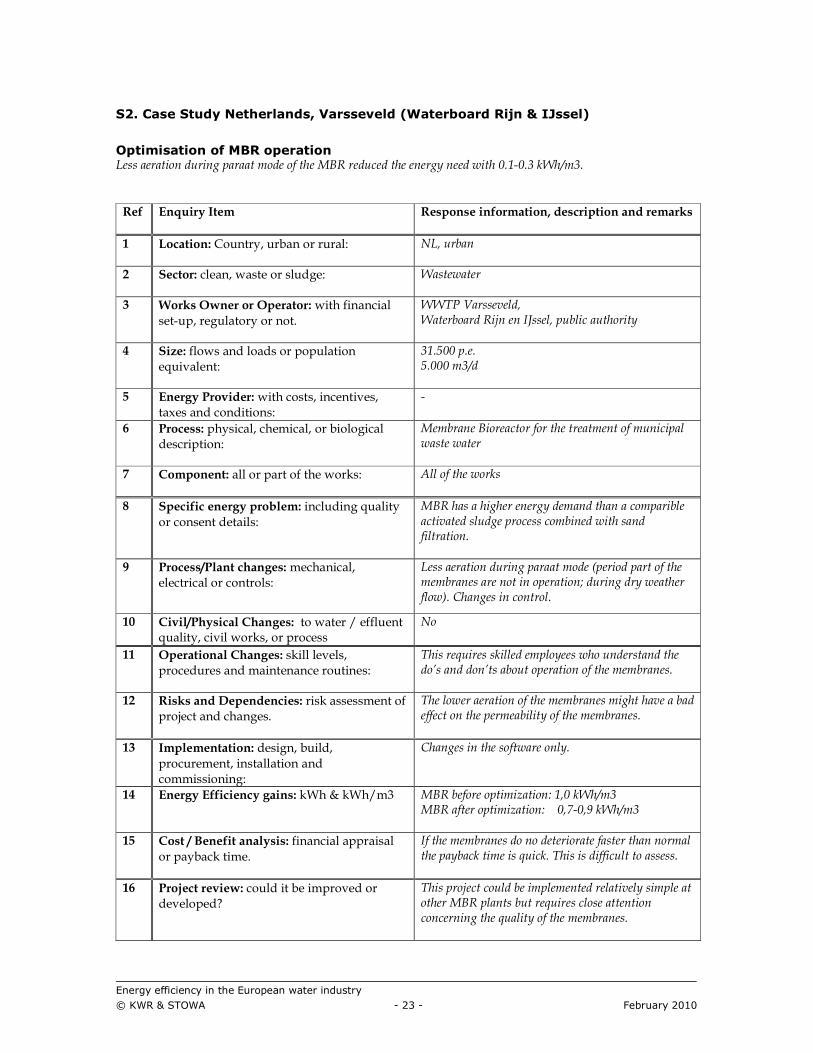
Optimisation of MBR operation Less aeration during paraat mode of the MBR reduced the energy need with 0.1-0.3 kWh/m3.
Ref Enquiry Item Response information, description and remarks
1 Location: Country, urban or rural: NL, urban
2 Sector: clean, waste or sludge: Wastewater
3 Works Owner or Operator: with financial set-up, regulatory or not.
WWTP Varsseveld, Waterboard Rijn en IJssel, public authority
4 Size: flows and loads or population equivalent:
31.500 p.e. 5.000 m3/d
5 Energy Provider: with costs, incentives, taxes and conditions:
-
6 Process: physical, chemical, or biological description:
Membrane Bioreactor for the treatment of municipal waste water
7 Component: all or part of the works: All of the works
8 Specific energy problem: including quality or consent details:
MBR has a higher energy demand than a comparible activated sludge process combined with sand filtration.
9 Process/Plant changes: mechanical, electrical or controls:
Less aeration during paraat mode (period part of the membranes are not in operation; during dry weather flow). Changes in control.
10 Civil/Physical Changes: to water / effluent quality, civil works, or process
No
11 Operational Changes: skill levels, procedures and maintenance routines:
This requires skilled employees who understand the do’s and don’ts about operation of the membranes.
12 Risks and Dependencies: risk assessment of project and changes.
The lower aeration of the membranes might have a bad effect on the permeability of the membranes.
13 Implementation: design, build, procurement, installation and commissioning:
Changes in the software only.
14 Energy Efficiency gains: kWh & kWh/m3 MBR before optimization: 1,0 kWh/m3 MBR after optimization: 0,7-0,9 kWh/m3
15 Cost / Benefit analysis: financial appraisal or payback time.
If the membranes do no deteriorate faster than normal the payback time is quick. This is difficult to assess.
16 Project review: could it be improved or developed?
This project could be implemented relatively simple at other MBR plants but requires close attention concerning the quality of the membranes.

Energy efficiency in the European water industry
© KWR & STOWA - 24 - February 2010
17 Confidence grade: on data provided. -
Observations
Compiled by Eef Leeuw and Cora Uijterlinde (STOWA) From 2005 tot 2007 the energy consumption per m3 wastewater treated went down from 0,97 to 0,77 kWh/m3. This was mainly achieved by lowering the aeration of the membranes not in operation during dry weather flow (paraat mode). In 2008 the consumption, however, increased again to 0,93 kWh/m3. This was caused by the increased aeration during “paraat mode”, needed to protect the membranes by then. At the end of 2008 the aeration again was lowered and the consumption is expected to go down again to about 0,85 kWh/m3. Although energy consumption is reduced, this MBR process still has a higher energy demand than its reference of the conventional activated sludge combined with sand filtration (0,65 kWh/m3).
Furthermore the use of permeate as process water for the grit chamber pump was lowered end 2008 from 25 m3/h to 5-7 m3/h. This reduces the amount of water to be pumped through the membranes. The MLSS concentration in the aeration tank has been lowered from 10 to 8 g/l which will lower the (endogenous respiration) energy consumption. In dry periods the energy consumption per m3 water treated is relatively high because energy consumption for membranes continues also in ‘paraat mode’. 2008 for example was a relatively dry (1,3 million m3 compared tot 1,56 million m3 in other years). It is expected that the 2009 energy consumption can become as low as in 2007.

Energy efficiency in the European water industry
© KWR & STOWA - 25 - February 2010
More information: http://www.mbrvarsseveld.nl/ http://www.iwapublishing.com/template.cfm?name=isbn1843391732 http://www.stowa.nl/Service/Publicaties/Zuiveren_van_afvalwater.aspx?rId=5022 http://www.stowa.nl/Service/Publicaties/Zuiveren_van_afvalwater.aspx?rId=5018

Energy efficiency in the European water industry
© KWR & STOWA - 26 - February 2010
S3. Case study Netherlands, Rotterdam (Waterboard Hollandse Delta)
Increase of sludge production with AB-process The two-step biological AB-process has the advantage of increased sludge production, resulting in 20% more biogas production, and at the same time a 20% lower energy demand for the wastewater treatment.
Ref Enquiry Item Response information, description and remarks
1 Location: Country, urban or rural: NL, urban
2 Sector: clean, waste or sludge: Wastewater, sludge
3 Works Owner or Operator: with financial set-up, regulatory or not.
WWTP Dokhaven Rotterdam; Waterboard Hollandse Delta, public authority
4 Size: flows and loads or population equivalent:
Capacity 620.000 p.e., Sludge production 6.000 ton SS/y
5 Energy Provider: with costs, incentives, taxes and conditions:
-
6 Process: physical, chemical, or biological description:
Wastewater treatment in AB-process resulting in more excess sludge and higher biogas production in digester
7 Component: all or part of the works: Treatment designed as a two stage activated sludge process
8 Specific energy problem: including quality or consent details:
AB-process results in approx. 20% more excess sludge than conventional one step low loaded process with presedimentation. More excess sludge results in more biogas in digester. Overall low energy demand because a major part op carbon is removed in A-step by adsorption; in conventional one step activated sludge this is aerobically oxidized
9 Process/Plant changes: mechanical, electrical or controls:
Activated sludge treatment designed as a two step process instead of one step aeration
10 Civil/Physical Changes: to water / effluent quality, civil works, or process
See 9
11 Operational Changes: skill levels, procedures and maintenance routines:
Two excess sludge flows to thickening and digestion
12 Risks and Dependencies: risk assessment of project and changes.
Hydraulic overload A-step; settling properties A-step sludge; lack of carbon in B-step, therefore poor denitrification without external carbon source
13 Implementation: design, build, procurement, installation and commissioning:
-
14 Energy Efficiency gains: kWh & kWh/m3
20% more excess sludge results in at least 20% more biogas; high C-removal in A-step results approx. 20% lower energy demand compared to one step process

Energy efficiency in the European water industry
© KWR & STOWA - 27 - February 2010
15 Cost / Benefit analysis: financial appraisal or payback time.
-
16 Project review: could it be improved or developed?
AB-process is a compact activated sludge systems, however, it has a poor denitrification in B-step because of lack of carbon; these disadvantages can be overcome by combining the process with SHARON/ ANAMMOX-treatment in digester effluent
17 Confidence grade: on data provided. Process is in operational during several years. Many data collected.
Observations
Compiled by Eef Leeuw and Cora Uijterlinde (STOWA) The WWTP Rotterdam-Dokhaven is a municipal wastewater treatment plant with a capacity of 620.000 p.e. and 19.000 m3/h. The treatment is based on two step biological AB-process. The high-loaded A-step achieves a 70-80% C-removal and 30-40% N-removal mainly by adsorption at the sludge. Therefore the volume of the low loaded B-step is much smaller than in a one step process. Also the overall volume of both steps is smaller than in the one step process with presedimentation. Due to the high C-removal by adsorption, a major part of the COD is removed by the excess sludge. In a one step process the COD is mainly removed by oxidation. Therefore the AB-process has a 20-30% lower energy demand than the one step process. The high C-removal rate in the A-step results in a 20-30% higher excess sludge production. Especially the A-step sludge is very well biodegradable and results therefore if digested in more biogas. The extra biogas treated in the heat-power combination results in a 20-30% increase of the electricity production compared with the one step sludge. The AB-process was introduced in the late 80s. During that period there was a focus on compact building, low investments and low energy demand. Total-N removal and denitrification was a minor issue. When this became an issue in the 90s and the beginning of this century, the AB-process appeared to have a disadvantage compared with the one step process. In the A-step C-removal appeared to be that high that there was an insufficiency in the B-step for denitrification. Many years later this problem was solved by introducing the SHARON/ANAMMOX-process (see case S1) for N-treatment of the digester effluent. Without this treatment there was an approx. 20% recycle of nitrogen back to the AB-process. Therefore the overall process was able to reach an overall 55-60% N-removal. The AB-process was further improved by introducing the FAST-process (see other case). In the FAST-process the removal in the A-step was further improved by flocculant dosing, resulting in more excess sludge, more biogas and more electricity production. More information: http://www.energietech.info/groengas/projecten/dokhaven.htm
http://www.neerslag-magazine.nl/?template=article_detail&object_id=229
http://www.stowa.nl/uploads/publicaties2/mID_4924_cID_3914_08226731_R90-02_AB-systemen-
inventarisatie.pdf
Energy efficiency in the European water industry
© KWR & STOWA - 28 - February 2010
S4. Case study Netherlands, Amstelveen (Waternet)
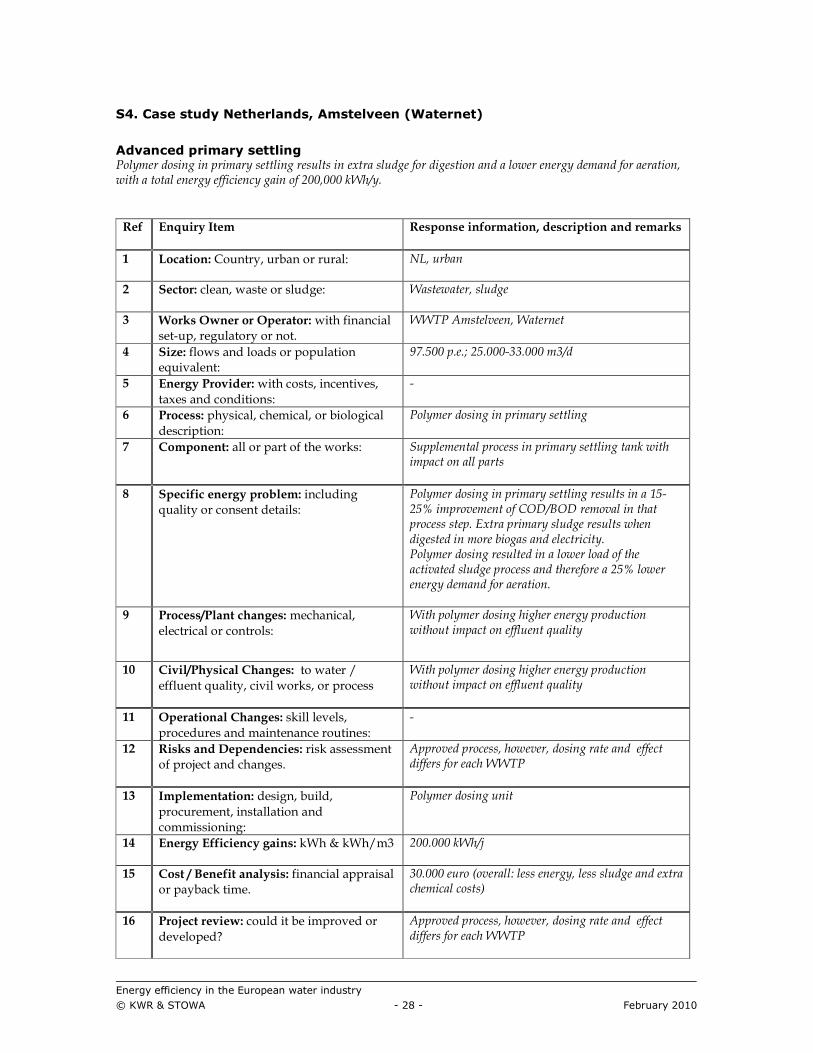
Advanced primary settling Polymer dosing in primary settling results in extra sludge for digestion and a lower energy demand for aeration, with a total energy efficiency gain of 200,000 kWh/y.
Ref Enquiry Item Response information, description and remarks
1 Location: Country, urban or rural: NL, urban
2 Sector: clean, waste or sludge: Wastewater, sludge
3 Works Owner or Operator: with financial set-up, regulatory or not.
WWTP Amstelveen, Waternet
4 Size: flows and loads or population equivalent:
97.500 p.e.; 25.000-33.000 m3/d
5 Energy Provider: with costs, incentives, taxes and conditions:
-
6 Process: physical, chemical, or biological description:
Polymer dosing in primary settling
7 Component: all or part of the works: Supplemental process in primary settling tank with impact on all parts
8 Specific energy problem: including quality or consent details:
Polymer dosing in primary settling results in a 15-25% improvement of COD/BOD removal in that process step. Extra primary sludge results when digested in more biogas and electricity. Polymer dosing resulted in a lower load of the activated sludge process and therefore a 25% lower energy demand for aeration.
9 Process/Plant changes: mechanical, electrical or controls:
With polymer dosing higher energy production without impact on effluent quality
10 Civil/Physical Changes: to water / effluent quality, civil works, or process
With polymer dosing higher energy production without impact on effluent quality
11 Operational Changes: skill levels, procedures and maintenance routines:
-
12 Risks and Dependencies: risk assessment of project and changes.
Approved process, however, dosing rate and effect differs for each WWTP
13 Implementation: design, build, procurement, installation and commissioning:
Polymer dosing unit
14 Energy Efficiency gains: kWh & kWh/m3 200.000 kWh/j
15 Cost / Benefit analysis: financial appraisal or payback time.
30.000 euro (overall: less energy, less sludge and extra chemical costs)
16 Project review: could it be improved or developed?
Approved process, however, dosing rate and effect differs for each WWTP

Energy efficiency in the European water industry
© KWR & STOWA - 29 - February 2010
17 Confidence grade: on data provided. Data obtained in three year research project compared with Fe-dosing
Observations Compiled by Eef Leeuw and Cora Uijterlinde (STOWA) The WWTP Amstelveen is treatment plant based primary settling and biological treatment by activated sludge. The plant has a capacity of 97.500 p.e. and 25.000-33.000 m3/d. In the reference situation the primary settling tank achieved a 25-30% COD and BOD removal. In the new situation the plant was extended with a polymer dosing on the primary settling. This improved the COD/BOD-removal with 15-25%. The polymer dosing had no impact on the overall COD/BOD/N-removal which was good and stabile. The improvement of the COD/BOD-removal did result in a decrease of the sludge load in the aeration tank. This resulted in reduction in the energy demand for aeration of approximately 25%. Another impact was that the polymer dosing did increase the primary sludge production and resulted at the same time an improvement of the thickening of the sludge. The lower sludge load of the activated sludge, however, resulted in a reduction of the secondary sludge production. Overall the increase of primary sludge, the decrease of secondary sludge and the improvement of the thickening characteristics resulted in a lower hydraulic load of the digester. Therefore the digestion appeared to be more effective, which resulted in a higher biogas production and therefore higher electricity production. During the process the quality of the collected data was insufficient, therefore the extra biogas production couldn’t be calculated. Overall sludge production was 20-25% lower. In the research project the polymer dosing at the primary settling was compared with a ferric/aluminium dosing. Both processes appeared to have approximately equal removal of COD/BOD/N/P. Also in both cases an equal reduction of energy demand for aeration was achieved. The major advantage of the polymer dosing, however, was the lower sludge production, where the chemical dosing resulted in an increase. Polymer dosing is applicable at many WWTPs, however, the introduction is no standard procedure. The dosing rate, dosing location and the impact on sludge production and energy demand can differ a lot between several WWTPs More information:
http://www.landwater.nl/sitemanager.asp?pid=47&artikel=534
http://www.amstelveenweb.com/nieuws-Miljoeneninjectie+rioolwaterzuivering&newsid=22814643
http://www.stowa.nl/Service/Publicaties/Zuiveren_van_afvalwater.aspx?rId=5011

Energy efficiency in the European water industry
© KWR & STOWA - 30 - February 2010
S5. Case study Netherlands, Apeldoorn (Veluwe Waterboard)
Co-digestion external organic wastes Co-digestion of organic industrial waste at the sludge digester of WWTP Apeldoorn generated 60 million m3 biogas per year.
Ref Enquiry Item Response information, description and remarks
1 Location: Country, urban or rural: NL, urban
2 Sector: clean, waste or sludge: Sludge, organic industrial wastes
3 Works Owner or Operator: with financial set-up, regulatory or not.
WWTP Apeldoorn, Veluwe Waterboard
4 Size: flows and loads or population equivalent:
340.000 p.e.; 12.000 m3/h 50.000 tons/y external wastes (approx. 10% SS)
5 Energy Provider: with costs, incentives, taxes and conditions:
-
6 Process: physical, chemical, or biological description:
(Co-)digestion of external organic wastes
7 Component: all or part of the works: Supplemental digestion tank, two heat/power generator, sanitation unit, use of generated heat for heating buildings/houses, nitrogen removal in digester effluent
8 Specific energy problem: including quality or consent details:
(Co-)digestion results in increase energy production, both electricity and heat; WWTP is energy is selfsupporting for energy
9 Process/Plant changes: mechanical, electrical or controls:
(Co-)digestion results in supplemental excess sludge, biogas, heath and nitrogen input to WWTP
10 Civil/Physical Changes: to water / effluent quality, civil works, or process
Codigestion results in supplemental excess sludge, biogas and nitrogen input to WWTP
11 Operational Changes: skill levels, procedures and maintenance routines:
Moderate feeding of digestors in order to equalize biogas production
12 Risks and Dependencies: risk assessment of project and changes.
Toxicity of input wastes; stability of nitrogen removal in digestor effluent; special permits required; removal of plastics, capacity of gas piping
13 Implementation: design, build, procurement, installation and commissioning:
-
14 Energy Efficiency gains: kWh & kWh/m3 Biogas production: 60.000.000 m3/y Energy production: 9.500.000 kWhe/y; Heath production: 60.000 GJt/y Energy consumption: 9.000.000 kWh/y (overall)
15 Cost / Benefit analysis: financial appraisal or payback time.
Payback time: 6 years (no green energy benefits)
Energy efficiency in the European water industry
© KWR & STOWA - 31 - February 2010
16 Project review: could it be improved or developed?
Mix of digested excess sludge and digested industrial wastes is dewatered
17 Confidence grade: on data provided. In full operation, however, specs on nitrogen removal aren’t achieved yet
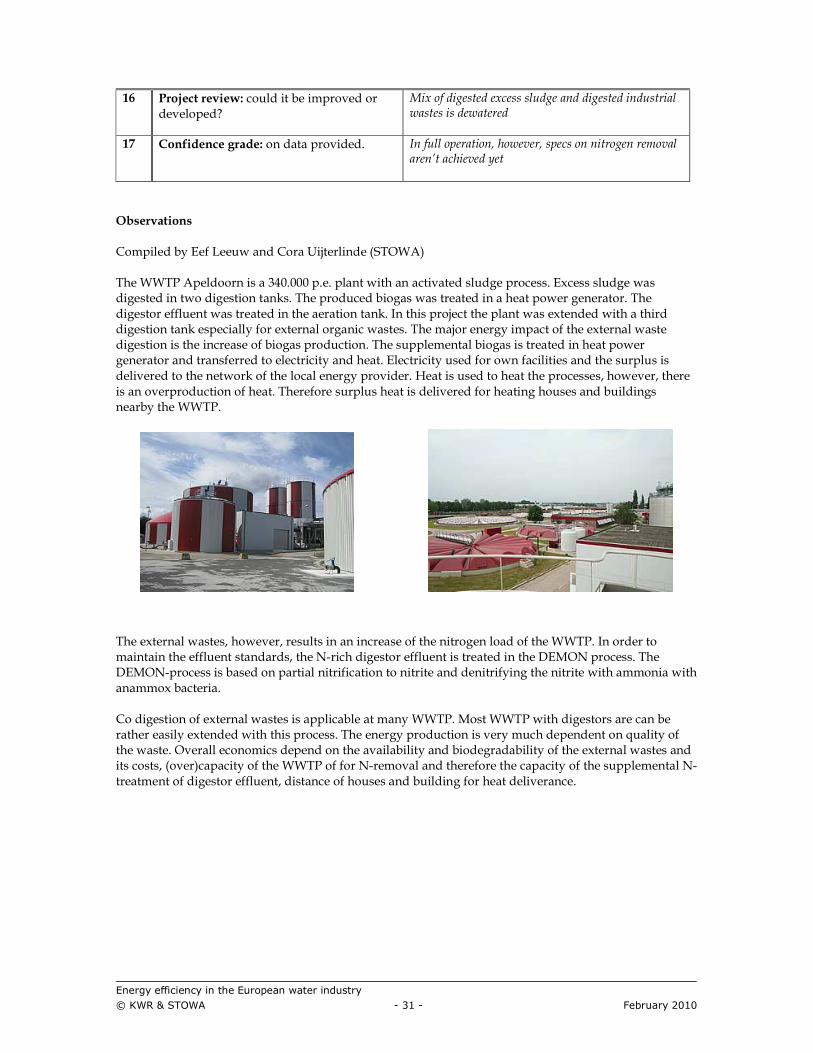
Observations Compiled by Eef Leeuw and Cora Uijterlinde (STOWA) The WWTP Apeldoorn is a 340.000 p.e. plant with an activated sludge process. Excess sludge was digested in two digestion tanks. The produced biogas was treated in a heat power generator. The digestor effluent was treated in the aeration tank. In this project the plant was extended with a third digestion tank especially for external organic wastes. The major energy impact of the external waste digestion is the increase of biogas production. The supplemental biogas is treated in heat power generator and transferred to electricity and heat. Electricity used for own facilities and the surplus is delivered to the network of the local energy provider. Heat is used to heat the processes, however, there is an overproduction of heat. Therefore surplus heat is delivered for heating houses and buildings nearby the WWTP.
The external wastes, however, results in an increase of the nitrogen load of the WWTP. In order to maintain the effluent standards, the N-rich digestor effluent is treated in the DEMON process. The DEMON-process is based on partial nitrification to nitrite and denitrifying the nitrite with ammonia with anammox bacteria. Co digestion of external wastes is applicable at many WWTP. Most WWTP with digestors are can be rather easily extended with this process. The energy production is very much dependent on quality of the waste. Overall economics depend on the availability and biodegradability of the external wastes and its costs, (over)capacity of the WWTP of for N-removal and therefore the capacity of the supplemental N-treatment of digestor effluent, distance of houses and building for heat deliverance.

Energy efficiency in the European water industry
© KWR & STOWA - 32 - February 2010
More information:
http://www.host.nl/nl/wp-content/uploads/2009/02/rwbnl1-p12-13-praktijk-abs.pdf
http://www.veluwe.nl/navigatie_boven/zoeken/@83841/pagina/
http://www.veluwe.nl/werk_bij_u_in_de/actueel/projecten/rwzi_apeldoorn_demon
http://www.host.nl/nl/2009/05/voortgang-bouw-installatie-waterschap-veluwe-2/
http://www.waternetwerk.nl/downloads/news/waPSfuJHCunV1NqY.pdf
http://www.neerslagmagazine.nl/view.cfm?website_id=187&template=article_detail&object_id=794&r
eferer=edition_detail%7C85

Energy efficiency in the European water industry
© KWR & STOWA - 33 - February 2010
S6. Case study Netherlands, Hoensbroek (Waterboard Limburg)
Sludge age depending on temperature Lowering MLSS during summer operation decreases the energy demand with 10-15%.
Ref Enquiry Item Response information, description and remarks
1 Location: Country, urban or rural: NL, urban
2 Sector: clean, waste or sludge: Wastewater
3 Works Owner or Operator: with financial set-up, regulatory or not.
WWTP Hoensbroek; Waterboard Limburg
4 Size: flows and loads or population equivalent:
240.000 p.e.; 75.000 m3/d
5 Energy Provider: with costs, incentives, taxes and conditions:
-
6 Process: physical, chemical, or biological description:
Decreasing MLSS in summer and increasing during winter operation
7 Component: all or part of the works: Aeration tank
8 Specific energy problem: including quality or consent details:
Acitivity and oxygen demand of activated sludge depends on temperature. At operation temperatures above the design parameters, MLSS can be decreased in order to reduce energy demand
9 Process/Plant changes: mechanical, electrical or controls:
MLSS concentration control depending on temperature activated sludge
10 Civil/Physical Changes: to water / effluent quality, civil works, or process
No physical changes
11 Operational Changes: skill levels, procedures and maintenance routines:
See 9
12 Risks and Dependencies: risk assessment of project and changes.
Lowering MLSS during summer operation decreases the sludge mineralization and therefore increases sludge production
13 Implementation: design, build, procurement, installation and commissioning:
-
14 Energy Efficiency gains: kWh & kWh/m3 From 41-48 Wh/kg TOD-removed to 35-38 Wh/kg TOD-removed
15 Cost / Benefit analysis: financial appraisal or payback time.
See 14, however, reduction of energy costs might be compensated by extra costs for sludge disposal
16 Project review: could it be improved or developed?
Improvement optional if increase of sludge production can be digested
17 Confidence grade: on data provided. Energy data have high confidence grade, however, data of impact on sludge production have lower confidence
Energy efficiency in the European water industry
© KWR & STOWA - 34 - February 2010
Observations
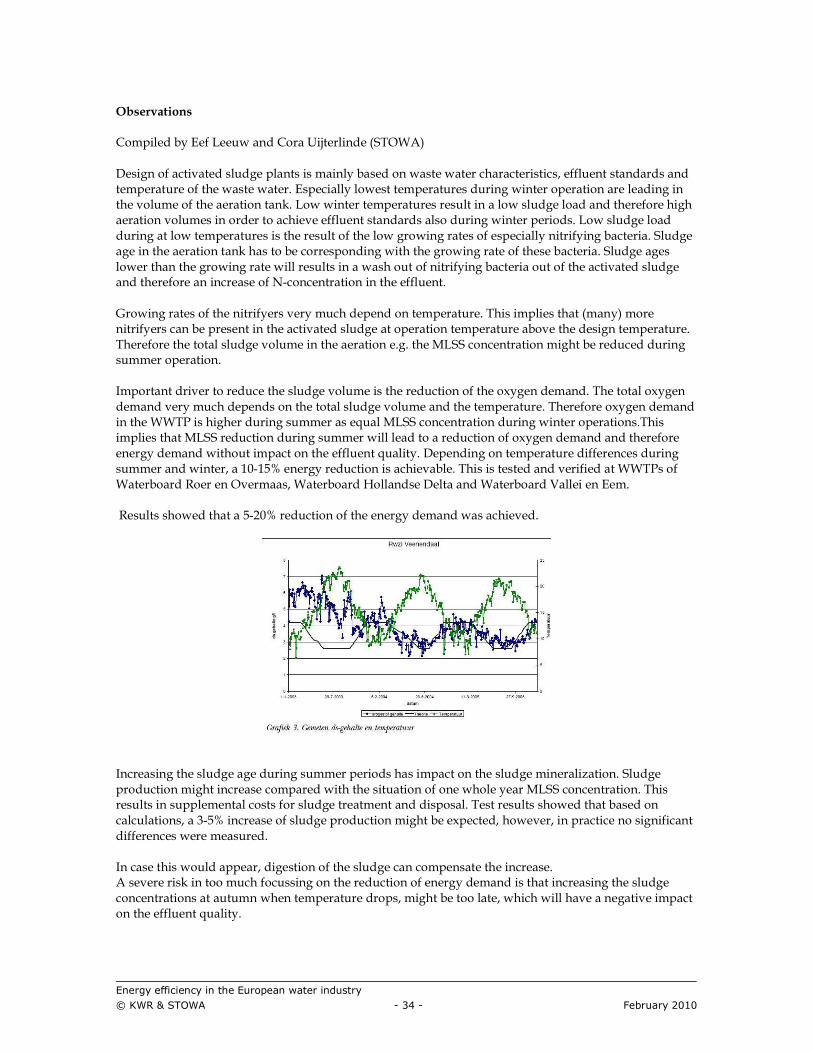
Compiled by Eef Leeuw and Cora Uijterlinde (STOWA) Design of activated sludge plants is mainly based on waste water characteristics, effluent standards and temperature of the waste water. Especially lowest temperatures during winter operation are leading in the volume of the aeration tank. Low winter temperatures result in a low sludge load and therefore high aeration volumes in order to achieve effluent standards also during winter periods. Low sludge load during at low temperatures is the result of the low growing rates of especially nitrifying bacteria. Sludge age in the aeration tank has to be corresponding with the growing rate of these bacteria. Sludge ages lower than the growing rate will results in a wash out of nitrifying bacteria out of the activated sludge and therefore an increase of N-concentration in the effluent. Growing rates of the nitrifyers very much depend on temperature. This implies that (many) more nitrifyers can be present in the activated sludge at operation temperature above the design temperature. Therefore the total sludge volume in the aeration e.g. the MLSS concentration might be reduced during summer operation. Important driver to reduce the sludge volume is the reduction of the oxygen demand. The total oxygen demand very much depends on the total sludge volume and the temperature. Therefore oxygen demand in the WWTP is higher during summer as equal MLSS concentration during winter operations.This implies that MLSS reduction during summer will lead to a reduction of oxygen demand and therefore energy demand without impact on the effluent quality. Depending on temperature differences during summer and winter, a 10-15% energy reduction is achievable. This is tested and verified at WWTPs of Waterboard Roer en Overmaas, Waterboard Hollandse Delta and Waterboard Vallei en Eem. Results showed that a 5-20% reduction of the energy demand was achieved.
Increasing the sludge age during summer periods has impact on the sludge mineralization. Sludge production might increase compared with the situation of one whole year MLSS concentration. This results in supplemental costs for sludge treatment and disposal. Test results showed that based on calculations, a 3-5% increase of sludge production might be expected, however, in practice no significant differences were measured. In case this would appear, digestion of the sludge can compensate the increase. A severe risk in too much focussing on the reduction of energy demand is that increasing the sludge concentrations at autumn when temperature drops, might be too late, which will have a negative impact on the effluent quality.

Energy efficiency in the European water industry
© KWR & STOWA - 35 - February 2010
More information: http://www.neerslag-magazine.nl/view.cfm?website_id=187&template=article_detail&object_id=1247&referer=edition_detail|119 http://www.neerslag-magazine.nl/view.cfm?website_id=187&template=article_detail&object_id=498&referer=edition_detail|53 http://www.overmaas.nl/algemene_onderdelen/downloads/kerngegevens
Energy efficiency in the European water industry
© KWR & STOWA - 36 - February 2010
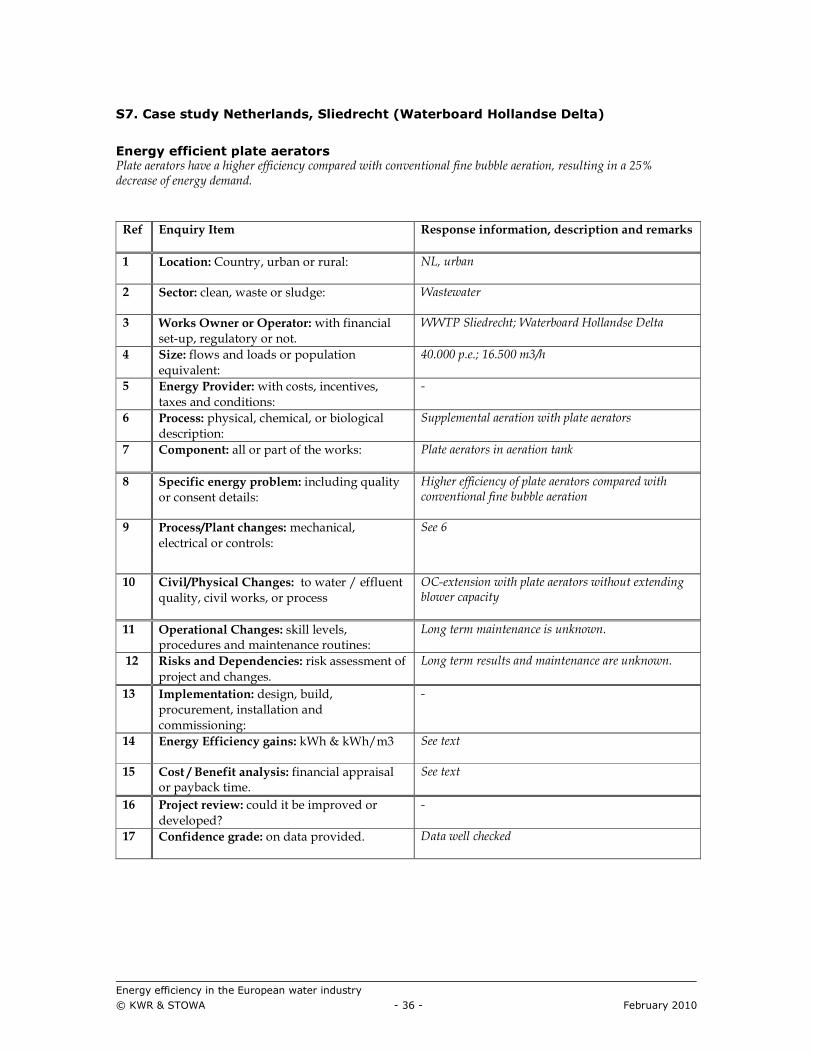
S7. Case study Netherlands, Sliedrecht (Waterboard Hollandse Delta)
Energy efficient plate aerators Plate aerators have a higher efficiency compared with conventional fine bubble aeration, resulting in a 25% decrease of energy demand.
Ref Enquiry Item Response information, description and remarks
1 Location: Country, urban or rural: NL, urban
2 Sector: clean, waste or sludge: Wastewater
3 Works Owner or Operator: with financial set-up, regulatory or not.
WWTP Sliedrecht; Waterboard Hollandse Delta
4 Size: flows and loads or population equivalent:
40.000 p.e.; 16.500 m3/h
5 Energy Provider: with costs, incentives, taxes and conditions:
-
6 Process: physical, chemical, or biological description:
Supplemental aeration with plate aerators
7 Component: all or part of the works: Plate aerators in aeration tank
8 Specific energy problem: including quality or consent details:
Higher efficiency of plate aerators compared with conventional fine bubble aeration
9 Process/Plant changes: mechanical, electrical or controls:
See 6
10 Civil/Physical Changes: to water / effluent quality, civil works, or process
OC-extension with plate aerators without extending blower capacity
11 Operational Changes: skill levels, procedures and maintenance routines:
Long term maintenance is unknown.
12 Risks and Dependencies: risk assessment of project and changes.
Long term results and maintenance are unknown.
13 Implementation: design, build, procurement, installation and commissioning:
-
14 Energy Efficiency gains: kWh & kWh/m3 See text
15 Cost / Benefit analysis: financial appraisal or payback time.
See text
16 Project review: could it be improved or developed?
-
17 Confidence grade: on data provided. Data well checked

Energy efficiency in the European water industry
© KWR & STOWA - 37 - February 2010
Observations Compiled by Eef Leeuw and Cora Uijterlinde (STOWA) The WWTP Sliedrecht is treatment plant based on the activated sludge process with a capacity 40.000 p.e. and 16.500 m3/h. Aeration was carried out by conventional fine bubble aerators fed by two blowers. Due to an increase of the load and stricter effluent standards the aeration capacity had to be extended approximately 25% (from 281 to 354 kg O2/h). At first it was planned to extend the aeration by supplemental conventional fine bubble aerators, a third blower piping and installing extra energy power. In the advanced design the extension of aeration was carried out by installing supplemental plate aerators with a high specific OC capacity. Due to this high specific capacity the supplemental aeration could be reached by only installing the plate aerators without extension of the blower capacity and extra piping. Compared to the conventional fine bubble aerators, plate aerators have a much higher efficiency: Conventional fine bubble aerator: 17-20 g/Nm3,m; 3,0-3,5 kg O2/kWh Plate aerators: 25-30 g/Nm3,m; 4,0-5,0 kg O2/kWh Compared with surface aerators (1,8-2,0 kg O2/kWh) the energy efficiency is even higher, however, this type of aeration has lower maintenance costs.
The high efficiency of the plate aerators is mainly caused by the smaller diameter of the produced air bubbles, which cause a much higher oxygen transfer ton the water than by bigger bubbles. A second reason of the higher efficiency is that distance between the plate aerators and the bottom of the aeration tank is less than with conventional fine bubble aerator. Therefore the aerators have more depth, more contact time and more oxygen transfer to the water. More information: http://www.bosman-water.nl/docs/97.pdf http://www.neerslag-magazine.nl/view.cfm?website_id=187&template=article_detail&object_id=243&referer=edition_detail%7C32 http://www.bosman-water.nl/en/49_WWTP+Sliedrecht.htm http://www.vakbladh2o.nl/h2o_archief.php?indexnummer=7075&zoeken=plaatbeluchting http://www.vakbladh2o.nl/h2o_archief.php?indexnummer=4010&zoeken=plaatbeluchting

Energy efficiency in the European water industry
© KWR & STOWA - 38 - February 2010
S8. Case study Netherlands, Hapert (Waterboard De Dommel)
Belt thickening instead of decanters Belt thickeners have a higher energy efficiency than decanters, resulting in 230,000 kWh/y energy savings.
Ref Enquiry Item Response information, description and remarks
1 Location: Country, urban or rural: NL, urban
2 Sector: clean, waste or sludge: Wastewater, sludge
3 Works Owner or Operator: with financial set-up, regulatory or not.
WWTP Hapert. Waterboard De Dommel
4 Size: flows and loads or population equivalent:
71.000 p.e.; 14.500 m3/d; 1.000 ton SS/y
5 Energy Provider: with costs, incentives, taxes and conditions:
-
6 Process: physical, chemical, or biological description:
Replacement of decanter by belt thickener in sludge thickening process
7 Component: all or part of the works: Belt thickener in sludge treatment process
8 Specific energy problem: including quality or consent details:
Higher energy efficiency of belt thickener than decanters
9 Process/Plant changes: mechanical, electrical or controls:
See 6
10 Civil/Physical Changes: to water / effluent quality, civil works, or process
Improvement of thickening at lower energy demand
11 Operational Changes: skill levels, procedures and maintenance routines:
-
12 Risks and Dependencies: risk assessment of project and changes.
Experience at other WWTPs that thickening results may get worse
13 Implementation: design, build, procurement, installation and commissioning:
Two decanter replaced by two belt thickeners
14 Energy Efficiency gains: kWh & kWh/m3 Improvement energy demand of thickening from 250 to approx. 100 kWh/ton SS; 230.000 kWh/y
15 Cost / Benefit analysis: financial appraisal or payback time.
Investments: 223.000 euro;
16 Project review: could it be improved or developed?
-
17 Confidence grade: on data provided. -

Energy efficiency in the European water industry
© KWR & STOWA - 39 - February 2010
Observations Compiled by Eef Leeuw and Cora Uijterlinde (STOWA) The WWTP Hapert is an activated sludge plant with a capacity of 71.000 p.e. Sludge thickening has been carried by two decanters. Both decanters were replaced by belt thickeners.
The following results were achieved:
Decanter Belt thickener
Thickened sludge Ton % SS ton SS.
19.811 4,8 961
16.289 6,0 980
Energy demand kWh 246.121 94.617
Spec. Energy demand kWh/ton SS 256 97 62%
Sludge thickening by belt thickeners appeared to be more energy efficient than decanters. Also the thickening results improved. Decanters at the WWTP Haaren were also replaced by belt thickeners. At this location the improvement of the energy efficiency appeared to be approximately equal as at the WWTP Hapert, however, thickening results were worse (6,9 to 5,3 %SS). Therefore it can be concluded that although belt thickener are more energy efficient than decanters, equal thickening results might not be guaranteed.
More information: http://www.dommel.nl/wat_doen_we/schoon_water/rioolwater_en_de/rioolwater_zuiveren/hapert http://www.solis.nl/rwzi-hapert/767 http://www.dommel.nl/wat_doen_we/schoon_water/rioolwater_en_de/rioolwater_zuiveren/hapert/hapert_feiten_en

Energy efficiency in the European water industry
© KWR & STOWA - 40 - February 2010
S9. Case study Netherlands, Tilburg (Waterboard De Dommel)
Energy production out of RPM reduction Out of RPM speed reduction at sludge centrifuges energy can be produced: 25,000 – 45,000 kWh/y.
Ref Enquiry Item Response information, description and remarks
1 Location: Country, urban or rural: NL, urban
2 Sector: clean, waste or sludge: Wastewater, sludge
3 Works Owner or Operator: with financial set-up, regulatory or not.
WWTP Tilburg. Waterboard De Dommel
4 Size: flows and loads or population equivalent:
375.000 p.e.; 66.300 m3/d
5 Energy Provider: with costs, incentives, taxes and conditions:
-
6 Process: physical, chemical, or biological description:
Energy production out of speed reduction sludge centrifuges
7 Component: all or part of the works: Sludge dewatering
8 Specific energy problem: including quality or consent details:
See 6
9 Process/Plant changes: mechanical, electrical or controls:
Mechanical: electricity production out RPM reduction sludge dewatering centrifuges
10 Civil/Physical Changes: to water / effluent quality, civil works, or process
Supplemental energy production
11 Operational Changes: skill levels, procedures and maintenance routines:
-
12 Risks and Dependencies: risk assessment of project and changes.
No energy production in case of continuous operation
13 Implementation: design, build, procurement, installation and commissioning:
14 Energy Efficiency gains: kWh & kWh/m3 8-10% production of energy input; 25.000-45.000 kWh/j
15 Cost / Benefit analysis: financial appraisal or payback time.
Payback cannot be calculated because of poor investment costs data.
16 Project review: could it be improved or developed?
Optional for oversized centrifuges
17 Confidence grade: on data provided. Poor data of investments

Energy efficiency in the European water industry
© KWR & STOWA - 41 - February 2010
Observations Compiled by Eef Leeuw and Cora Uijterlinde (STOWA) The WWTP Tilburg is treatment plant based on the activated sludge process and has a capacity of 375.000 p.e. and 66.300 m3/d The excess sludge is dewatered in two centrifuges. At each centrifuges energy is produced out of RPM reduction. With this method 8-10% of the energy input can be regained.
2006 2007 2008
Energy input (kWh/j) 451.667 345.384 416.130
Energy production (kWh/j 44.447 26.209 36.700
Out/input 10% 8% 9%
Substantial energy production can only be obtained in case of an oversized dewatering capacity, whereas the centrifuges often reduces speed. In case of continuous operation at a fixed RPM no energy production occurs. Payback time cannot be calculated because of poor investment data, however, economical benefit is doubtful. In case of significant energy productions, there is a significant overcapacity of the centrifuge and therefore extra investment costs. More information: http://www.dommel.nl/wat_doen_we/schoon_water/rioolwater_en_de/rioolwater_zuiveren/tilburg/tilburg_feiten_en http://www.dommel.nl/wat_doen_we/schoon_water/rioolwater_en_de/rioolwater_zuiveren/tilburg

Energy efficiency in the European water industry
© KWR & STOWA - 42 - February 2010
SE1. Case Study France (Lyonnaise de Eaux)
Energy savings using sludge combustion exhaust gases for thermal drying Energy required for the sludge processing drops radically after the implementation of the proposed heat recovery step. In fact nowadays the process saves up to 90% of the fossil fuels that used to be consumed.
Ref Enquiry Item Response information, description and remarks
1 Location: Country, urban or rural: France, urban.
2 Sector: clean, waste or sludge: Sludge
3 Works Owner or Operator: with financial set-up, regulatory or not.
Lyonnaise des Eaux (Group Suez Environnement) is a private utility company responsible for the supply and treatment of sewage in the municipality.
4 Size: flows and loads or population equivalent: The plant has a capacity of 400 000 population equivalent. It is able to handle annually: -26 000 000 m3 of waste water -8 300 tons of volatile matter -2 100 tons of reduced nitrogen -585 tons of phosphorus
5 Energy Provider: with costs, incentives, taxes and
conditions:
Natural gas from the National provider. (Costs in 2009: 2-4c€/kWh)
6 Process: physical, chemical, or biological description:
Sludge is first gravitationally thickened, then mechanically dewatered using a centrifugal device. Then one fraction of the total sludge is thermally dried in a belt drier. Finally, a mixture of the dewatered and dried sludge is formed to be combusted in a fluidized bed.
7 Component: all or part of the works: Thermal drier and fluidised bed combustors are arranged in a such a way that combustion exhaust gases are allowed to pre-heat the combustion air and dry the sludge adding only few amounts of external fuel.
8 Specific energy problem: including quality or consent details:
High energy consumption for the thermal drying of sewage sludge.
9 Process/Plant changes: mechanical, electrical or controls:
Combining heat excess from the sludge combustion and heat demand for the sludge thermal drying.
10 Civil/Physical Changes: to water / effluent quality, civil works, or process:
A new thermal drying was put into the system using a heat exchanger allowing the heat recovery from the exhaust gases in a liquid thermal oil. A pre-mixing of full dried and dewatered sewage sludge is required before combustion in order to reach auto-thermal conditions.
11 Operational Changes: skill levels, procedures and maintenance routines:
Combustion and Thermal drying are operations requiring specific skills which are different to those that are normally found in WWTP operators.

Energy efficiency in the European water industry
© KWR & STOWA - 43 - February 2010
12 Risks and Dependencies: risk assessment of
project and changes.
Although the system was designed to take advantage of the thermal integration of the thermal drying and combustion, these two operations may also operate separately if one of the two stops for maintenance or failure. Indeed, the sludge can be totally dried and stored if the combustor is stopped, on the one hand. On the other hand, the combustor can be operated using only dewatered sludge during the maintenance of the dryer.
13 Implementation: design, build, procurement, installation and commissioning:
The solution was designed and built by the thermal dryer manufacturer with a close collaboration of the utility company which verified the quality requirements during the commissioning stage.
14 Energy Efficiency gains: kWh & kWh/m3 The sludge processing avoids completely the diesel consumption and significantly reduced gas thanks to the use of sludge as a fuel. (Fossil fuels consumption per ton of dry solids used to be ranged between 1 000 to 2 000kWh. Implementing heat recovery from the sludge combustion for the thermal drying has dropped this number to 200-250 kWh).
15 Cost / Benefit analysis: financial appraisal or payback time.
16 Project review: could it be improved or developed?
Implementing more advanced low temperature thermal energy recovery strategies may increase the net gain of energy from sludge combustion.
17 Confidence grade: on data provided. Good.
Observations
Compiled by Carlos Peregrina (SE) based on information from Large et al. (SE) Road to energy self-sustainability, World Water and Environmental Engineering, May June 2009, pages 33-34. Upgrading a wastewater treatment plant with advanced processes to achieve new, strict water quality regulations and save energy may seem paradoxical, but a project in France, illustrates how these facilities can improve their overall energy balance by using sludge and other organic waste as fuel in the process. Since 2006 the upgraded facility has treated wastewater for 400,000 persons equivalent (pe), a substantial increase from its original capacity of 140,000 pe when it was constructed in 1955. By 1975, a new independent branch increased capacity to 240,000 pe. These two facilities were designed to treat exclusively the carbon pollution to comply with regulations. The original structure treated sludge in two different lines. The first treated sludge using a sequential order consisting of digestion, solar drying, and storage. Biogas was flared and most of the produced heat warmed the digester. In the new treatment branch, sludge was first gravitationally thickened, then mechanically dewatered, and finally burned in a fluidized bed. The sludge was chemically conditioned prior to its mechanical dewatering in a press filter. Exhaust gases were allowed to pre-heat the combustion air, and the combustion ashes were disposed into a controlled landfill. The new facility was upgraded to meet European directives, which were non-existent during the previous expansion in 1975, and to handle wastewater from a larger population. Its design aims to reduce not only carbon, but also nitrogen and phosphorous pollution.

Energy efficiency in the European water industry
© KWR & STOWA - 44 - February 2010
The upgraded wastewater treatment plant opted for a common line to treat all the produced sludge. The new sludge treatment was still organized around the combustor since it was the principal equipment in the previous configuration; however the design engineers instituted some major experimental changes. First, the static gravitational thickening was substituted for a dynamic drip grid. Then the former press filter was replaced for a new continuous centrifuge. Finally, although the combustor remained, a new belt dryer was installed in order to use the heat produced by means of a closed loop with the combustion exhaust gases. Thus, moisture is evaporated by direct contact between the wet sludge and combustion hot gases, which have low oxygen content. The resulting byproduct, dried and dewatered sludge, is used as agricultural fertilizer. Combustion ashes, another by-product, are disposed into landfills according to European sanitary policies. The case study shows that it is possible to make a trade-off between installing more advanced treatment processes and saving energy. More advanced treatment processes produce the same amount of treated effluent, yet doubled the consumption of electricity compared to the first configuration. Most importantly, the major cost savings were achieved by the new design of the sludge line. The new sludge processing avoids completely the diesel consumption and significantly reduced gas use. The total energy consumed (electricity, diesel, and gas) in the two lines remains nearly the same with only a slight increase (13%) for the upgraded version. The new sludge line configuration takes advantage of the sludge volatile matter potential as a tool to reduce overall energy consumption, whereas there was nearly no use of this potential in the first configuration. The new arrangement also provides operating advantages because it is much more flexible in terms of sludge disposal routes since it can accept external sludge from other wastewater treatment plants, industry, and also grease wastes. The final, dewatered product (90-95% dry content) can be used for agricultural needs, energy recovery, or landfill if no other possibility.
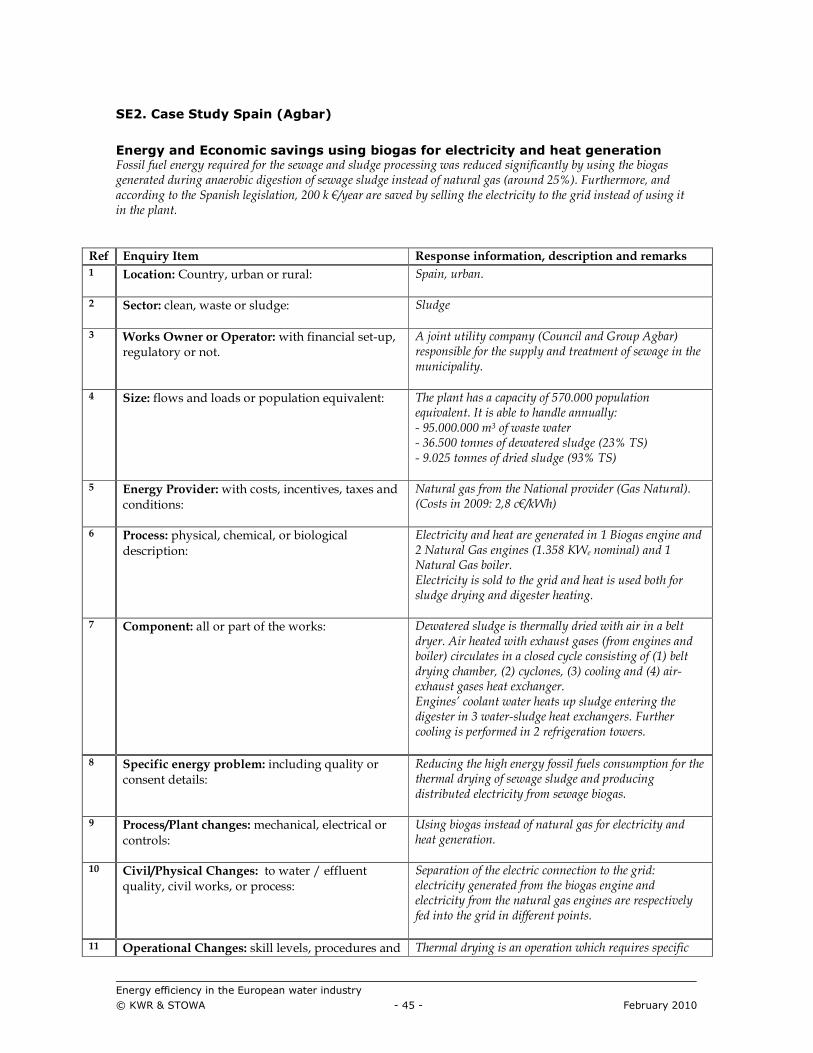
Energy efficiency in the European water industry
© KWR & STOWA - 45 - February 2010
SE2. Case Study Spain (Agbar)
Energy and Economic savings using biogas for electricity and heat generation Fossil fuel energy required for the sewage and sludge processing was reduced significantly by using the biogas generated during anaerobic digestion of sewage sludge instead of natural gas (around 25%). Furthermore, and according to the Spanish legislation, 200 k €/year are saved by selling the electricity to the grid instead of using it in the plant.
Ref Enquiry Item Response information, description and remarks
1 Location: Country, urban or rural: Spain, urban.
2 Sector: clean, waste or sludge: Sludge
3 Works Owner or Operator: with financial set-up,
regulatory or not.
A joint utility company (Council and Group Agbar) responsible for the supply and treatment of sewage in the municipality.
4 Size: flows and loads or population equivalent: The plant has a capacity of 570.000 population equivalent. It is able to handle annually: - 95.000.000 m3 of waste water - 36.500 tonnes of dewatered sludge (23% TS) - 9.025 tonnes of dried sludge (93% TS)
5 Energy Provider: with costs, incentives, taxes and conditions:
Natural gas from the National provider (Gas Natural). (Costs in 2009: 2,8 c€/kWh)
6 Process: physical, chemical, or biological
description:
Electricity and heat are generated in 1 Biogas engine and 2 Natural Gas engines (1.358 KWe nominal) and 1 Natural Gas boiler. Electricity is sold to the grid and heat is used both for sludge drying and digester heating.
7 Component: all or part of the works: Dewatered sludge is thermally dried with air in a belt dryer. Air heated with exhaust gases (from engines and boiler) circulates in a closed cycle consisting of (1) belt drying chamber, (2) cyclones, (3) cooling and (4) air-exhaust gases heat exchanger. Engines’ coolant water heats up sludge entering the digester in 3 water-sludge heat exchangers. Further cooling is performed in 2 refrigeration towers.
8 Specific energy problem: including quality or consent details:
Reducing the high energy fossil fuels consumption for the thermal drying of sewage sludge and producing distributed electricity from sewage biogas.
9 Process/Plant changes: mechanical, electrical or controls:
Using biogas instead of natural gas for electricity and heat generation.
10 Civil/Physical Changes: to water / effluent quality, civil works, or process:
Separation of the electric connection to the grid: electricity generated from the biogas engine and electricity from the natural gas engines are respectively fed into the grid in different points.
11 Operational Changes: skill levels, procedures and Thermal drying is an operation which requires specific

Energy efficiency in the European water industry
© KWR & STOWA - 46 - February 2010
maintenance routines: skills which are different to those that are normally found in WWTP operators. Furthermore, it requires of permanent presence of personnel.
12 Risks and Dependencies: risk assessment of project and changes.
The system is dependent on the feed of sewage biogas. If the biogas production is stopped, the motor that is normally operated with sewage biogas turns into natural gas without any technical incidence in the process.
13 Implementation: design, build, procurement, installation and commissioning:
The solution was designed and built by Vanderbroek (the Netherlands) with a close collaboration of the utility company which verified the quality requirements during the commissioning stage.
14 Energy Efficiency gains: kWh & kWh/m3 The use of the biogas engine reduced significantly the natural gas consumption for sludge drying (fossil fuels consumption would have been around 82.500 MWh per year. Using biogas this number is reduced to 63.300 MWh). Furthermore, selling the electricity to the grid allowed to save 200 k €/year (according to Orden ITC/3801/2008 and Orden ITC/1723/2009).
15 Cost / Benefit analysis: financial appraisal or payback time.
16 Project review: could it be improved or developed?
Biogas treatment is not required for this particular application because the pollutant’s concentration is low. However, it needs to be taken into account for other similar applications. Maintenance actions to reduce air losses in the closed circuit would be recommended to reduce heat losses.
17 Confidence grade: on data provided. Good.
Observations Compiled by Carlos Penegrina (SE). Using advanced sludge treatment technologies in order to decrease sludge’s disposal requirements and reduce the energy consumption may seem controversial, but a project in Spain shows that it can be easily achieved by using biogas as fuel in the process. The WWTP is a relatively new treatment plant designed in 1997 which treats around 260.000 m3/day (600.000 population equivalent). The facility could be expanded in the future to 715.000 PE (25% increase) if necessary. The sewage treatment consists of pre-treatment (screening, fats and grits removal), lamellar primary settling, activated sludge (with anaerobic, anoxic and aerobic chambers, for simultaneous C, N and P removal) and secondary settling. The effluent is discharged into a river. Primary sludge is first sieved and then mixed with the biological sludge. The mixed sludge is then thickened to 3-4% TS by centrifugation and anaerobically digested under two-stage mesophilic conditions (38ºC). Finally, it is mechanically dewatered by a centrifuge (23% TS) and thermally dried with air in a direct dryer (upto 93% TS). The benefits of sludge drying are well-known, namely (1) volume reduction (which facilitates storage or final disposal), (2) possibility of dried sludge valorization (cement industry, gasification…) and (3) improvement of the sludge properties (sludge energy content
Energy efficiency in the European water industry
© KWR & STOWA - 47 - February 2010
increase, enhanced biological stability…). However, sludge drying has a high energy requirements (thermal), thus it is an interesting disposal solution if a heat source is available. Around 9.000 Nm3/day of biogas are produced during the anaerobic digestion of sewage sludge in this plant. The utilization of this methane-rich gas (with an energy content between 6,2 and 6,7 KWh/Nm3) in an internal combustion engine was considered as a very interesting option in order to reduce the plant’s overall fossil fuel consumption. One biogas and two natural gas engines (nominal electric power 1.358 KW each) were installed when the plant was built. There is an additional boiler powered with natural gas to cope with the overall heat demands on the plant. The total gas consumption on the plant is about 63.300 MWh/year. Electricity. Until 2008, the electricity produced in the three engines (24.756 MWh/year) was mainly used in the plant for sewage aeration and pumping and only a modest amount was sold to the grid (6.662 MWh/year), thus the plant could have been working without connection into the power grid. This action was economically improved in 2009 with the implementation of incentives for green energy production. In fact, according to the Spanish legislation (Orden ITC/3801/2008 and Orden ITC/1723/2009), electricity from the biogas and natural gas engines are sold at 10.335 and 8,795 c€/kWh respectively. With the application of these fees, the plant’s total savings can be estimated to be 200 k€/year. Thermal. The engines’ heat is used for two basic operations in the sludge line: sludge drying and digester’s heating. Exhaust gases from the three engines and the auxiliary boiler are mixed together and directed to the adjacent sludge drying plant for heat recovery: a gas/gas heat exchanger heats air for the dryer. These gases are then discharged into the atmosphere at around 200ºC. In addition, cooling water circulates through the engines and its heat is used for digester heating. In total, engines’ heat stands for around 13.000 MWh/year (thermal), of which 9.276 MWh correspond to more than a third of the sludge drying requirements (the rest is supplied by the exhaust gases from the auxiliary burner) and to 100% of digester’s heating (i.e: 3.720 MWh/year). This case study shows how energy from sewage sludge allows WWTP to save energy and therefore contribute to climate change mitigation. Biogas utilization in internal combustion engines saves up to 19.200 MWh/year (around 25% of the total gas consumption) and can be easily coupled to a sludge drying facility, showing that its energy content can not be underestimated.

Energy efficiency in the European water industry
© KWR & STOWA - 48 - February 2010
V1. Case Study France, Paris (SIAAP & Veolia)
Micro-turbines on WWTP effluent Installation of 2 low heads micro-turbines to recover potential energy: 6 million kWh/y.
Ref Enquiry Item Response information, description and remarks
1 Location: Country, urban or rural: France, Parisian Suburbs (Urban area)
2 Sector: clean, waste or sludge: Wastewater (Seine Aval WWTP)
3 Works Owner or Operator: with financial set-up,
regulatory or not.
Work owner & operator : SIAAP (Syndicat interdépartemental pour l’assainissement de l’agglomération parisienne) Micro-turbines contractor : Veolia Water Solutions & Technologies
4 Size: flows and loads or population equivalent: 2.106 m3 influent /day
5 Energy Provider: with costs, incentives, taxes and
conditions:
EDF (Electricité de France) No incentive
6 Process: physical, chemical, or biological description:
Microturbines on nitrified WWTP effluent
7 Component: all or part of the works: 2 micro hydropower plants, each including 1 Kaplan turbine (installed power: 417 kW, average flowrate: 4 m3/s, efficiency= 87%), 1 asynchron generator + condenser battery
8 Specific energy problem: including quality or consent details:
The BiostyrsTM hydraulic design at the nitrification plant was determined so as to allow gravitational supply of the downstream BioforsTM, whereas only ¼ of the water needs to be treated by this unit, and discharge of the wastewater into the Seine occurs without pumping. Microturbines allow to convert the hydraulic potential energy loss resulting from this hydraulic design (8 meters) into electrical energy
9 Process/Plant changes: mechanical, electrical or controls:
Not process related
10 Civil/Physical Changes: to water / effluent quality, civil works, or process:
Installation of two micro hydropower plants
11 Operational Changes: skill levels, procedures and maintenance routines:
Use control systems to guarantee stability during turbine operation by active control (use of a hydraulic actuator and a regulator to optimize inlet flow); in this way, vibration phenomena are controlled (radial vibrations inside water pipes, mechanical vibrations, cavitation noise, etc.);

Energy efficiency in the European water industry
© KWR & STOWA - 49 - February 2010
Careful maintenance (otherwise : quick wear, drop in efficiency, erosion of materials, noise) Avoid runaway speed by using security instruments : guard gates, ball valves (Otherwise: mechanical damage).
12 Risks and Dependencies: risk assessment of project and changes.
No risk on process. Strong regulation on micro turbine operating conditions (minimum and maximum flows) are necessary to avoid turbine cavitation.
13 Implementation: design, build, procurement, installation and commissioning:
-
14 Energy Efficiency gains: kWh & kWh/m3 6 GWh/year of electricity gained
15 Cost / Benefit analysis: financial appraisal or payback time.
Undisclosed due to confidentiality issues
16 Project review: could it be improved or developed?
-
17 Confidence grade: on data provided. High technical and economical confidence on project repeatability.
Observations Compiled by Francois Vince (Veolia) A water turbine is a rotating machine that uses water force to convert the mechanical energy provided to turbine blades into electrical energy, by means of an electrical generator (alternator). The electrical power that can be recovered from a turbine is:

Energy efficiency in the European water industry
© KWR & STOWA - 50 - February 2010
Industrial turbines are classified as follows:
• Impulse: the water comes out of the turbine at atmospheric pressure. Ex : Pelton
• Reaction: the water comes out of the turbine under pressure. Ex : Francis, Kaplan The most used turbines are Pelton, Francis and Kaplan turbines. There are also horizontal turbines (Bulbe) and Ossberger turbine or others. All these turbines may be used for a large range of flow rates. Usually, turbine yield is quite good (85% – 90%), and the higher the discharge rate, the better the yield. One or the other technology is used according to the water head upstream:
• very low heads: Bulbe ( < 10 m);
• low heads : Kaplan (around 5 – 20 meters)
• average heads : Francis (around 10 to 300 m)
• high heads : Pelton (> around 150 m)
Figure 1: Kaplan turbine blades
Figure 2: Seine Aval WWTP Nitrification unit: Location of micro-tubines

Energy efficiency in the European water industry
© KWR & STOWA - 51 - February 2010
Figure 3: Installation of Kaplan turbine in Seine Aval WWTP (Nitrification Unit)
Figure 4: Alternator in Seine Aval WWTP (Nitrification Unit)

Energy efficiency in the European water industry
© KWR & STOWA - 52 - February 2010
V2. Case Study France (SIEVI & Veolia)
Micro-turbines on DWTP Installation of 4 micro-turbines on drinking water supply network: 4.5 million kWh/y generated.
Ref Enquiry Item Response information, description and remarks
1 Location: Country, urban or rural: South of France (Peri-urban, Mountainous)
2 Sector: clean, waste or sludge: Raw water intake and drinking water supply network (DWTP: Super Rimiez)
3 Works Owner or Operator: with financial set-up,
regulatory or not.
Work owner : Syndicat Intercommunal Estéron Var Inférieur (SIEVI) Work operator : Veolia Water
4 Size: flows and loads or population equivalent: 2 106 m3 influent /day
5 Energy Provider: with costs, incentives, taxes and
conditions:
EDF (Electricité de France) Feed-in tariffs: 60 € per MWh produced by micro-hydropower
6 Process: physical, chemical, or biological
description:
- (not relevant)
7 Component: all or part of the works: 3 micro hydropower plants dispatched along the gravitating potable water supply network
8 Specific energy problem: including quality or consent details:
The DWTP of SUPER RIMIEZ is located higher than the customers leading to an excess pressure (>17 bars) at domestic network inlets. Microturbines installed on drinking water supply network allow to convert the hydraulic potential energy loss resulting from this hydraulic design into electrical energy
9 Process/Plant changes: mechanical, electrical or controls:
Not process related
10 Civil/Physical Changes: to water / effluent quality, civil works, or process:
Installation of 4 Francis microturbines: � 1 turbine on DW supply network (installed
power: 120 kW, average flow= 0,5 m3/s, height differential: 40 meters)
� 1 turbine on DW supply network (installed power: 291 kW, average flow= 0,3 m3/s, height differential: 120 meters)
� 1 turbine on DW supply network (installed power: 171 kW, average flow= 0,4 m3/s, height differential: 52 meters)
11 Operational Changes: skill levels, procedures and
maintenance routines:
Use control systems to guarantee stability during turbine operation by active control (use of a hydraulic actuator and a regulator to optimize inlet flow); in this way, vibration phenomena are controlled (radial vibrations inside water pipes, mechanical vibrations,

Energy efficiency in the European water industry
© KWR & STOWA - 53 - February 2010
cavitation noise, etc.); Careful maintenance (otherwise : quick wear, drop in efficiency, erosion of materials, noise) Avoid runaway speed by using security instruments : guard gates, ball valves (Otherwise: mechanical damage).
12 Risks and Dependencies: risk assessment of project and changes.
No risk on process. Strong regulation on micro turbine operating conditions (minimum and maximum flows) are necessary to avoid turbine cavitation.
13 Implementation: design, build, procurement, installation and commissioning:
-
14 Energy Efficiency gains: kWh & kWh/m3 4,5 GWh/year
15 Cost / Benefit analysis: financial appraisal or payback time.
CAPEX: 1,3 M€ Payback time= 6 years (because of preferential feed-in tariffs)
16 Project review: could it be improved or developed?
-
17 Confidence grade: on data provided. High technical and economical confidence on project repeatability.
Observations
Compiled by Francois Vince (Veolia) A water turbine is a rotating machine that uses water force to convert the mechanical energy provided to turbine blades into electrical energy, by means of an electrical generator (alternator). The electrical power that can be recovered from a turbine is:

Energy efficiency in the European water industry
© KWR & STOWA - 54 - February 2010
Industrial turbines are classified as follows:
• Impulse: the water comes out of the turbine at atmospheric pressure. Ex : Pelton
• Reaction: the water comes out of the turbine under pressure. Ex: Francis, Kaplan The most used turbines are Pelton, Francis and Kaplan turbines. There are also horizontal turbines (Bulbe) and Ossberger turbine or others. All these turbines may be used for a large range of flow rates. Usually, turbine yield is quite good (85% – 90%), and the higher the discharge rate, the better the yield. One or the other technology is used according to the water head upstream:
• very low heads: Bulbe ( < 10 m);
• low heads : Kaplan (around 5 – 20 meters) or
• average heads : Francis (around 10 to 300 m)
• high heads : Pelton (> around 150 m)

Energy efficiency in the European water industry
© KWR & STOWA - 55 - February 2010
V3. Case Study Denmark, Avore (AWS)
Energy optimization with advanced online process control Focus and efforts on energy optimisation in mainstream BNR wastewater treatment with STAR control® pays off well at Avedøre Wastewater Services, AWS. During more than 6 years the focus on energy optimisation has continuously improved the energy footprint more than 16% mainly by installation of advanced online process control. During the years two R&D projects (funded by EU InterregIIIA) has supported the optimisation and supplied detailed results.
Ref Enquiry Item Response information, description and remarks
1 Location: Country, urban or rural: Denmark, Urban
2 Sector: clean, waste or sludge: wastewater mainstream, BNR process
3 Works Owner or Operator: with financial set-up, regulatory or not.
Avedøre Wastewater Services (AWS) is a municipal company jointly owned by 10 municipalities 10 km west of Copenhagen, the capital of Denmark.
4 Size: flows and loads or population equivalent: Operation and maintenance of wastewater and sludge incineration facilities corresponding to 345,000 person-equivalents. The company receives and treats roughly 25 million m3 of wastewater annually.
5 Energy Provider: with costs, incentives, taxes and conditions:
In 2008 power consumed 15,0 GWh Power supplied from public utility 8,1 GWh Power internally produced 6,9 GWh
6 Process: physical, chemical, or biological description:
Optimisation of biological wastewater treatment as nitrification, denitrification and chemical/biological phosphorous removal to minimise consumptions of energy and chemicals. Effluent in 2008 [standards to meet]: 2,7 mg BOD5/l [<15] 4,8 mg Total-N /l [<8] 0,7 mg Total-P /l [<1,5] 7,9 mg Suspended Solids/l [<20]
7 Component: all or part of the works: Advanced online process control by STAR control® installed at wastewater process tanks, primary and secondary settlers.
8 Specific energy problem: including quality or consent details:
Focus from AWS management to
• Improve removal efficiencies thereby reduced impact on environment and economical savings in terms of reduced green taxes
• Reduce electricity consumption thereby reduced impact on environment and economical savings in terms of reduced green taxes
• Increase hydraulic capacities by ATS stormwater control strategies and thereby reduced negative impact on environment
9 Process/Plant changes: mechanical, electrical or
controls:
Installation of Ammonia, Nitrate and Phosphate sensors in process tanks.

Energy efficiency in the European water industry
© KWR & STOWA - 56 - February 2010
Installation of STAR control system. Permanent stop of 50% the number of mixers without affecting the denitrification process.
10 Civil/Physical Changes: to water / effluent quality, civil works, or process:
None Control system will adapt to existing wwtp and postpone/eliminate the need for Civil constructions.
11 Operational Changes: skill levels, procedures and maintenance routines:
Good maintenance and calibration of on-line sensors very important for the performance of automatic process control.
12 Risks and Dependencies: risk assessment of project and changes.
Poor performance of on-line sensors. Poor or limited capacity and automation of aeration equipment, sludge pumps, dosing pumps etc.
13 Implementation: design, build, procurement, installation and commissioning:
Advanced online process control by STAR control® based on measurement of Ammonia, Nitrate, Oxygen, Phosphate in wastewater. STAR modules control dynamically:
• N/DN phase length
• DO set point
• Metal dosing
• Return activated sludge
• ATS storm water flow to process
• Sludge age Communication to existing PLCs, startup of active controls, training and commissioning.
14 Energy Efficiency gains: kWh & kWh/m3 Decrease in energy consumption (average of 6 years) for biological wastewater treatment at 16% ~ 1,3 GWh per year (from 8,36 to 7,02 GWh/year). OBS: Biological treatment accounts for ~50% of Total energy consumption at BNR wwtp. Specific from 0,32 kWh/m3 to 0,28 kWh/m3. Additional decrease in energy consumption for Incineration & Dewatering of sludge at 6% ~ 0,2 GWh per year as spin-off from optimised biological wastewater treatment as less chemical sludge production
15 Cost / Benefit analysis: financial appraisal or payback time.
Payback of investment in approx. 3,5 years. Equals payback experienced from >20 other installations in Denmark between 3-5 years. Payback experienced from >10 other installations International markets (Europe + Korea) vary 3-8 years.
16 Project review: could it be improved or developed?
Project results highly documented during intense R&D work at the wwtp and Lund University. Not often experienced from other cases. Krüger benefit from patent regarding Biological P removal by on-line control developed during projects at AWS. Basic work started for development of “Energy focus

Energy efficiency in the European water industry
© KWR & STOWA - 57 - February 2010
module” in STAR control®
17 Confidence grade: on data provided. Results in energy savings and effluent stability has similar results from >25 implementations of STAR control®
Observations: Compiled by Francois Vince (Veolia) Avedøre Wastewater Services:
Power (GWh), Incineration & Dewatering
Power (GWh), Biological WWTP steps
0
2
4
6
8
10
12GWh
2003 2004 2005 2006 2007 2008
-16%
-6%
Power (GWh), Incineration & Dewatering
Power (GWh), Biological WWTP steps
Power (GWh), Incineration & Dewatering
Power (GWh), Biological WWTP steps
0
2
4
6
8
10
12GWh
2003 2004 2005 2006 2007 2008
-16%
-6%
0
2
4
6
8
10
12GWh
2003 2004 2005 2006 2007 2008
-16%
-6%
Figure 1 Energy consumption at Avedøre Wastewater Services.
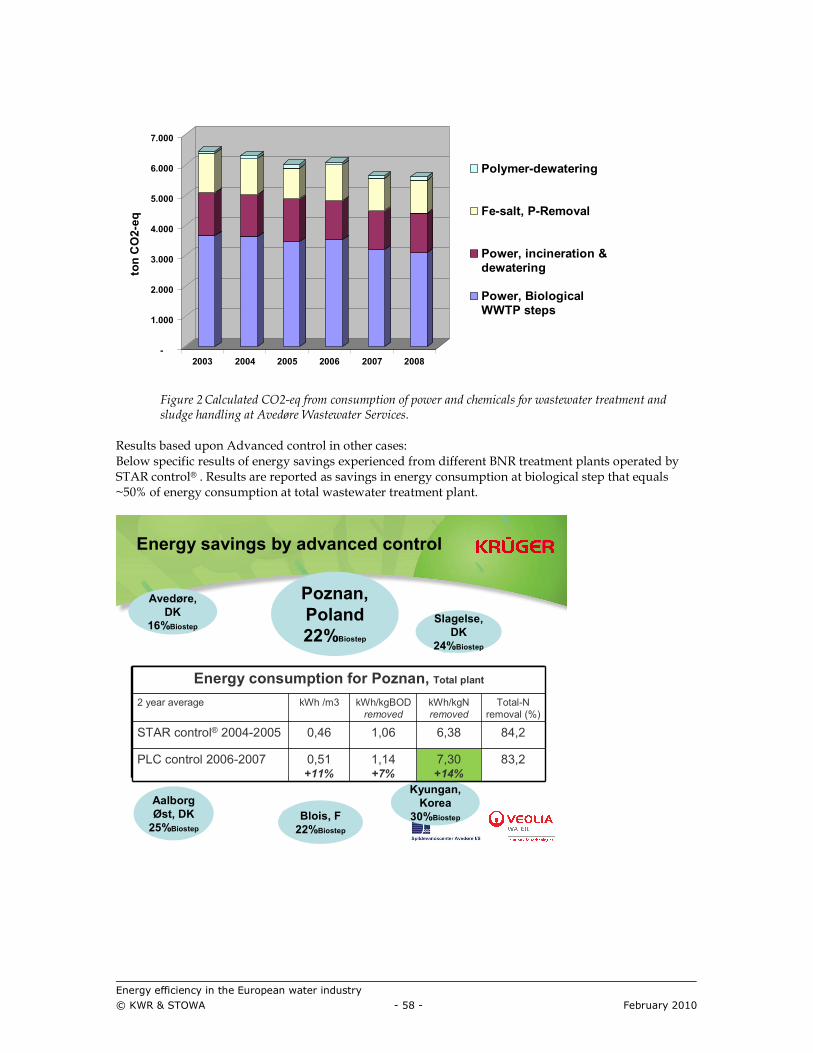
Energy efficiency in the European water industry
© KWR & STOWA - 58 - February 2010
-
1.000
2.000
3.000
4.000
5.000
6.000
7.000ton CO2-eq
2003 2004 2005 2006 2007 2008
Polymer-dewatering
Fe-salt, P-Removal
Power, incineration &dewatering
Power, BiologicalWWTP steps
Figure 2 Calculated CO2-eq from consumption of power and chemicals for wastewater treatment and sludge handling at Avedøre Wastewater Services.
Results based upon Advanced control in other cases: Below specific results of energy savings experienced from different BNR treatment plants operated by STAR control® . Results are reported as savings in energy consumption at biological step that equals ~50% of energy consumption at total wastewater treatment plant.
Energy savings by advanced control
Energy consumption for Total plant
2 year average kWh /m3 kWh/kgBOD
removed
kWh/kgN
removed
Total-N
removal (%)
STAR control® 2004-2005 0,46 1,06 6,38 84,2
PLC control 2006-2007 0,51 +11%
1,14 +7%
7,30 +14%
83,2
Blois, F
22%Biostep
Aalborg
Øst, DK
25%Biostep
Poznan,
Poland22%Biostep
Avedøre,
DK 16%Biostep
Slagelse,
DK
24%Biostep
Kyungan,
Korea
30%Biostep
Energy consumption for Poznan, Total plant
2 year average kWh /m3 kWh/kgBOD
removed
kWh/kgN
removed
Total-N
removal (%)
STAR control® 2004-2005 0,46 1,06 6,38 84,2
PLC control 2006-2007 0,51 +11%
1,14 +7%
7,30 +14%
83,2

Energy efficiency in the European water industry
© KWR & STOWA - 59 - February 2010
V4. Case study Hungary, Budapest (Budapest Sewage Works)
Energy recovery from sludge and waste (co-digestion) Integration of a waste processing unit + a thermophilic co-digester on a WWTP already equiped with a sludge mesophilic digester in order to simultaneously optimize organic waste treatment (food & beverages wastes, restaurants, supermarkets, slaughterhauses, milk industry…), protect the sewage network from illegal waste / grease inputs and increase the energy efficiency of the WWTP. 1 Location: Country, urban or rural: Budapest (Hungary)
2 Sector: clean, waste or sludge: WWTP – sludge treatment
3 Works Owner or Operator: with financial set-up,
regulatory or not. Work owner : Municipality of Budapest
Work operator : Budapest Sewage Works Company Ltd (main owners: Municipality of Budapest, Berlinwasser, Veolia Water)
4 Size: flows and loads or population equivalent: 300 000 PE for the WWTP
+ 49 Tons /year of sludge from other wastewater treatment plant, + 28 Tons /year of waste animal tissues, and kitchen waste + 11,5 Tons /year of dairy waste
5 Energy Provider: with costs, incentives, taxes and
conditions:
Hungarian feed-in tariffs: 100€cts /kWh for electricity produced from biogas
6 Process: physical, chemical, or biological description:
see flow sheet below
7 Component: all or part of the works: 1) Waste collection and processing (e.g. shredding, pulping, mixing, water addition, pasteurisation, and decontamination): 2 coarse waste processing units (total kitchen waste processing capacity: 55 m3/h) + 1 liquid waste receiving station (pump capacity 60 m3/h) + 1 pasteurisation unit 2) Thermophilic digester
Volume: 2000 m3
Temperature: 55 oC
Heat exchanger: 210 kW
Agitator: SCABA 100FVTP 2,5 kW 3) Mesophilic digester:
Volume: 3*3000 m3
Temperature: 37 oC
Heat exchanger: 210 kW
Agitator: Halberg-MAN 13,2 kW 4) Digested sludge treatment and end-use

Energy efficiency in the European water industry
© KWR & STOWA - 60 - February 2010
(dewatering centrifuge + dewatered sludge silo + bio filter) 5) Biogas Handling and conditioning (1 2000 m3 gas tank, biogas compressors, 2 desulfurization units) 5) Electricity and heat production
2 Jenbacher gas engines for a total power output of 1330 kW and a heat output of 1700 kW
4 boilers for a total heat output of 3,1 MW
1 waste gas flare
8 Specific energy problem: including quality or consent details:
-
9 Process/Plant changes: mechanical, electrical or controls:
The mesophilic digester - installed in an earlier phase – was dedicated to WWTP digestion only. It was retrofitted by adding an upstream thermophilic digester for waste.
10 Civil/Physical Changes: to water / effluent quality, civil works, or process:
11 Operational Changes: skill levels, procedures and maintenance routines:
Parameters influencing the maximization of biogas production:
Continual feeding of digestors
Optimal mixing of sludge and waste
Increase of retention time by optimisation of sludge thickening and digestors mixing
Increase of operational temperature (from 37°C to 55°C)
Co-digestion – feeding by biodegradable wastes
Reduction of time of immobilisation of digestors
12 Risks and Dependencies: risk assessment of project and changes.
To be managed before the construction of co-digestion processes:
Local authority authorization;
Necessity to install on-site waste pasteurization (especially in case of biological wastes like in South-Pest)
Ensure sufficient digestion capacity
Ensure that the WWTP water line design can cope with the additional N and P loads from external biowaste inputs
13 Implementation: design, build, procurement,
installation and commissioning:
-
14 Energy Efficiency gains: kWh & kWh/m3 10 GWh/year of electricity savings The WWTP is heat self-sufficient and produces 70% of its power needs
15 Cost / Benefit analysis: financial appraisal or payback time.
Total CAPEX : 18,8 M€ (including the CAPEX for the initial sludge digestion: mesophilic digester + biogas engine) Economical savings due to electricity production: 1

Energy efficiency in the European water industry
© KWR & STOWA - 61 - February 2010
M€/year (feed-in tariffs) Economical savings due to extra sludge and waste treatment: 1,1 M€/year Payback time= 9 years
16 Project review: could it be improved or developed?
-
17 Confidence grade: on data provided. Technical and economical confidence on project repeatability. However, co-digestion is highly dependent on local context (e.g. municipality agreement, waste sources availability)
Observations
Compiled by Francois Vince (Veolia)
Figure: Sludge and waste treatment flow sheet (South-Pest WWTP)
Thickener
Dewatering
centrifuge
Filter belt
thickener
Received waste
Thermophilic digester
37
°C
55°
C
Mesophilic digester
polymer
polymer
Gasholder
Flare
Boilers
Cogenerations
Desulph.
reject water reject water
reject water
raw sludge
excess sludge
Heat
Heat+
electricity
Thickener
Dewatering
centrifuge
Filter belt
thickener
Received waste
Thermophilic digester
37
°C
37
°C
55°
C
55°
C
Mesophilic digester
polymer
polymer
polymer
polymer
Gasholder
Flare
Boilers
Cogenerations
Boilers
Cogenerations
Desulph.
reject water reject water
reject water
reject water reject water
reject water
raw sludge
excess sludge
raw sludge
excess sludge
Heat
Heat+
electricity
Heat
Heat+
electricity

Energy efficiency in the European water industry
© KWR & STOWA - 62 - February 2010
Global view of Pest-South WWTP
Coarse waste receiving and processing unit (above) and
biowaste pasteurization and unit digesters (below)

Energy efficiency in the European water industry
© KWR & STOWA - 63 - February 2010
E1. Case Study Switzerland, Zurich
Biogas production from sludge digestion At the activated sludge WWTP Zurich, sludge is digested to produce electricity and heat. Of the 0.3 kWh/m3 energy required for treatment, about 80% is gained from the own biogas production, resulting in a net energy consumption of 0.05 kWh/m3.
1) Name of Plant:
WWTP Zürich Werdhoelzli
2) Location (city, state, country):
Zurich, Switzerland
3) Capacity (m3/day):
QDW,average = 180’000 m3/d Qmax = 6 m3/sec
4) Sources of wastewater: mixed sewage (80% municipal, 20% industrial)
5) Population served (no. of people): 500’000
6) How do you treat your wastewater?
By physical / chemical as well as biological processes
7) Which biological treatment processes do you have to treat your wastewater?
Aerobic treatment
8) If your plant contains aerobic process, which treatment processes do you have in your plant?
Activated sludge (SRT = 11 d), chemical P-precip.
10) How do you treat the sludge resulting from your liquid treatment?
Anaerobic sludge digester: 2 digester with total 40 d HRT
11) If you treat your sludge using anaerobic digester, do you utilize the biogas?
Yes, please specify for what purpose: to produce electrical energy and heat
12) Do you have odor treatment in your plant?
a. Yes, please specify: sludge treatment (dewatering, storage of dewatered sludge) with biofilter
13) Estimated total energy consumption (kWH/m3)
0.3 kWh/m3, net energy 0.05 kWh/m3
Do you practice energy recovery? Yes ( 80%)
Have you ever conducted energy audit? Yes
Observations
Compiled by Hansruedi Siegrist (EAWAG) Energy generated: 3.3 million kWh/y.
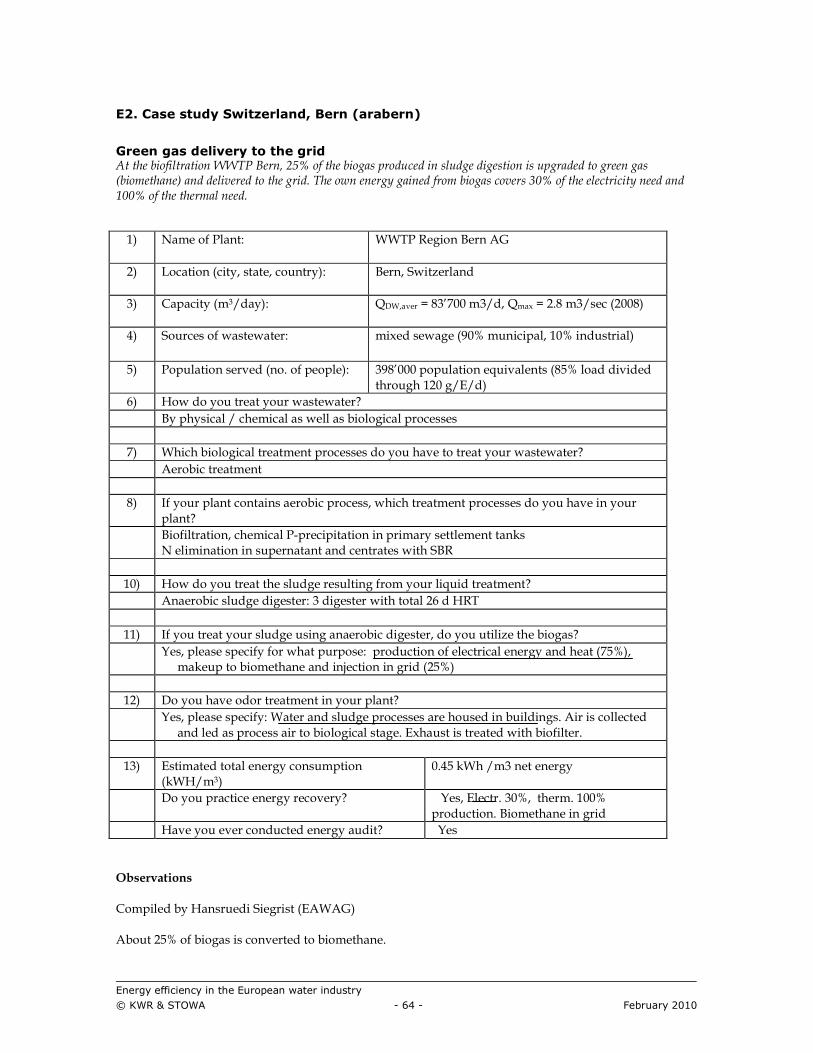
Energy efficiency in the European water industry
© KWR & STOWA - 64 - February 2010
E2. Case study Switzerland, Bern (arabern)
Green gas delivery to the grid At the biofiltration WWTP Bern, 25% of the biogas produced in sludge digestion is upgraded to green gas (biomethane) and delivered to the grid. The own energy gained from biogas covers 30% of the electricity need and 100% of the thermal need.
1) Name of Plant:
WWTP Region Bern AG
2) Location (city, state, country):
Bern, Switzerland
3) Capacity (m3/day):
QDW,aver = 83’700 m3/d, Qmax = 2.8 m3/sec (2008)
4) Sources of wastewater: mixed sewage (90% municipal, 10% industrial)
5) Population served (no. of people): 398’000 population equivalents (85% load divided through 120 g/E/d)
6) How do you treat your wastewater?
By physical / chemical as well as biological processes
7) Which biological treatment processes do you have to treat your wastewater?
Aerobic treatment
8) If your plant contains aerobic process, which treatment processes do you have in your plant?
Biofiltration, chemical P-precipitation in primary settlement tanks N elimination in supernatant and centrates with SBR
10) How do you treat the sludge resulting from your liquid treatment?
Anaerobic sludge digester: 3 digester with total 26 d HRT
11) If you treat your sludge using anaerobic digester, do you utilize the biogas?
Yes, please specify for what purpose: production of electrical energy and heat (75%), makeup to biomethane and injection in grid (25%)
12) Do you have odor treatment in your plant?
Yes, please specify: Water and sludge processes are housed in buildings. Air is collected and led as process air to biological stage. Exhaust is treated with biofilter.
13) Estimated total energy consumption (kWH/m3)
0.45 kWh /m3 net energy
Do you practice energy recovery? Yes, Electr. 30%, therm. 100% production. Biomethane in grid
Have you ever conducted energy audit? Yes
Observations Compiled by Hansruedi Siegrist (EAWAG) About 25% of biogas is converted to biomethane.
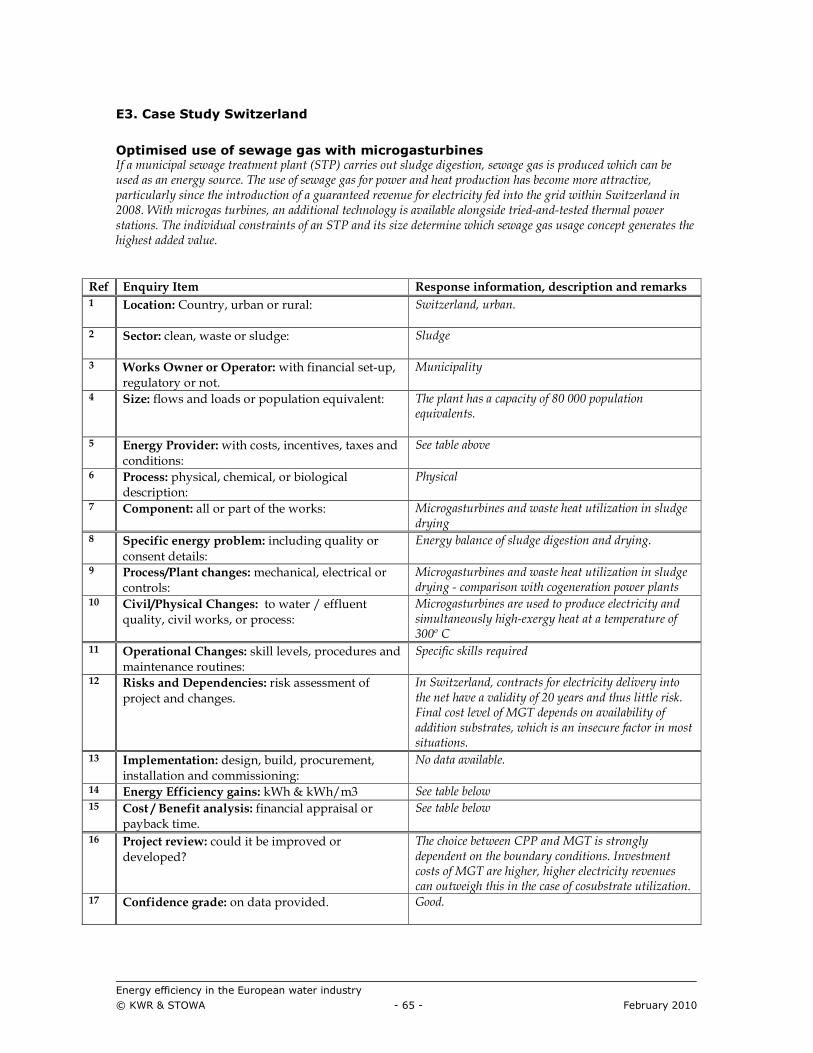
Energy efficiency in the European water industry
© KWR & STOWA - 65 - February 2010
E3. Case Study Switzerland
Optimised use of sewage gas with microgasturbines If a municipal sewage treatment plant (STP) carries out sludge digestion, sewage gas is produced which can be used as an energy source. The use of sewage gas for power and heat production has become more attractive, particularly since the introduction of a guaranteed revenue for electricity fed into the grid within Switzerland in 2008. With microgas turbines, an additional technology is available alongside tried-and-tested thermal power stations. The individual constraints of an STP and its size determine which sewage gas usage concept generates the highest added value.
Ref Enquiry Item Response information, description and remarks 1 Location: Country, urban or rural: Switzerland, urban.
2 Sector: clean, waste or sludge: Sludge
3 Works Owner or Operator: with financial set-up,
regulatory or not.
Municipality
4 Size: flows and loads or population equivalent: The plant has a capacity of 80 000 population equivalents.
5 Energy Provider: with costs, incentives, taxes and
conditions:
See table above
6 Process: physical, chemical, or biological description:
Physical
7 Component: all or part of the works: Microgasturbines and waste heat utilization in sludge drying
8 Specific energy problem: including quality or consent details:
Energy balance of sludge digestion and drying.
9 Process/Plant changes: mechanical, electrical or controls:
Microgasturbines and waste heat utilization in sludge drying - comparison with cogeneration power plants
10 Civil/Physical Changes: to water / effluent quality, civil works, or process:
Microgasturbines are used to produce electricity and simultaneously high-exergy heat at a temperature of 300º C
11 Operational Changes: skill levels, procedures and maintenance routines:
Specific skills required
12 Risks and Dependencies: risk assessment of project and changes.
In Switzerland, contracts for electricity delivery into the net have a validity of 20 years and thus little risk. Final cost level of MGT depends on availability of addition substrates, which is an insecure factor in most situations.
13 Implementation: design, build, procurement, installation and commissioning:
No data available.
14 Energy Efficiency gains: kWh & kWh/m3 See table below 15 Cost / Benefit analysis: financial appraisal or
payback time.
See table below
16 Project review: could it be improved or developed?
The choice between CPP and MGT is strongly dependent on the boundary conditions. Investment costs of MGT are higher, higher electricity revenues can outweigh this in the case of cosubstrate utilization.
17 Confidence grade: on data provided. Good.

Energy efficiency in the European water industry
© KWR & STOWA - 66 - February 2010
Observations Compiled by Wouter Pronk (EAWAG). Reference: M. Mendler, GWA, 10-2009, 811-816 Since several decades, usage of sewage gas has been used for generation of electricity in Switzerland in cogeneration power plants (CPP). In these plants, electricity is generated and the excess heat is produced at a temperature of around 80º C which is very suitable to warm up the sludge to around 37º C for the sludge digestion. In recent years, the 70 STP’s which deliver electricity into the net have produced around 50 GWh per year. Since 2008, a regulation was introduced in Switzerland, which guaranteed the revenues for electricity into the net for a period of at least 20 years. This of course has provided a motivation for many STP’s to consider the option of gas recovery and utilization. This case study deals with an alternative process for the utilization of sewage gas, using microgasturbines (MGT). So far, MGT’s have only been used in 8 different STP’s in Switzerland, and the experiences with these installations and a comparison with CCP is reported. The most important conclusions are:
• The electrical yield of MGT’s is smaller than for CPP: For plants with a mid-range capacity (100- 150 kWel), 37% of the energy is converted into electricity with CPP, while 29% is generated with MGT
• On the other hand, the rest heat generated by MGT has a much higher temperature and thus, a much higher exergy than that generated by CCP: The temperature is around 275-300º C compared to 80º C for CCP. This gives a much higher range of potential of high-value applications for this waste heat (see below).
• Also some more heat is generated in MGT (56% instead of 51%)
• MGT’s are much more flexible in handling variations in methane content of the sewage gas than CPP’s. MGT’s can handle even gases with methane contents of 50% (the content in sewage gas is around 60-64%)
• In MGT, excess heat (summer) can be disposed of by a waste gas exhaust. The heat exchanger only comes into play when actually needed. This option is mostly not available in CCP’s
Because of the higher temperature of the heat released, MGT enables the use of fluid-bed sludge drying. This concept will be realised in a STP with the following key properties: Capacity of the STP: 80,000 population equivalents Amount of sewage gas produced: 1 Mm3/year (total energy content : 6400 MWh/a) In the current situation, 84% of the sewage gas is used for sludge drying, also of sludge from other STP’s. In future only the own sludge will be treated, so there will be a surplus of gas available. The application of CCP was compared with MGT combined with fluid-bed sludge drying. In future, it is foreseen that additional substrates (from external providers) will be digested in the sludge digestion. An economical comparison of the two different technologies is shown in the table below for the case without and with co-digestion. As can be seen, the use of MGT results in a similar cost balance as CCP if no co-digestion is used. The reason lies mainly in the higher investment costs of MGT. The real advantage appears when co-digestion is applied. The higher electricity yield clearly outweighs the increased investment costs and thus, the net cost balance is better than in the case of CCP.
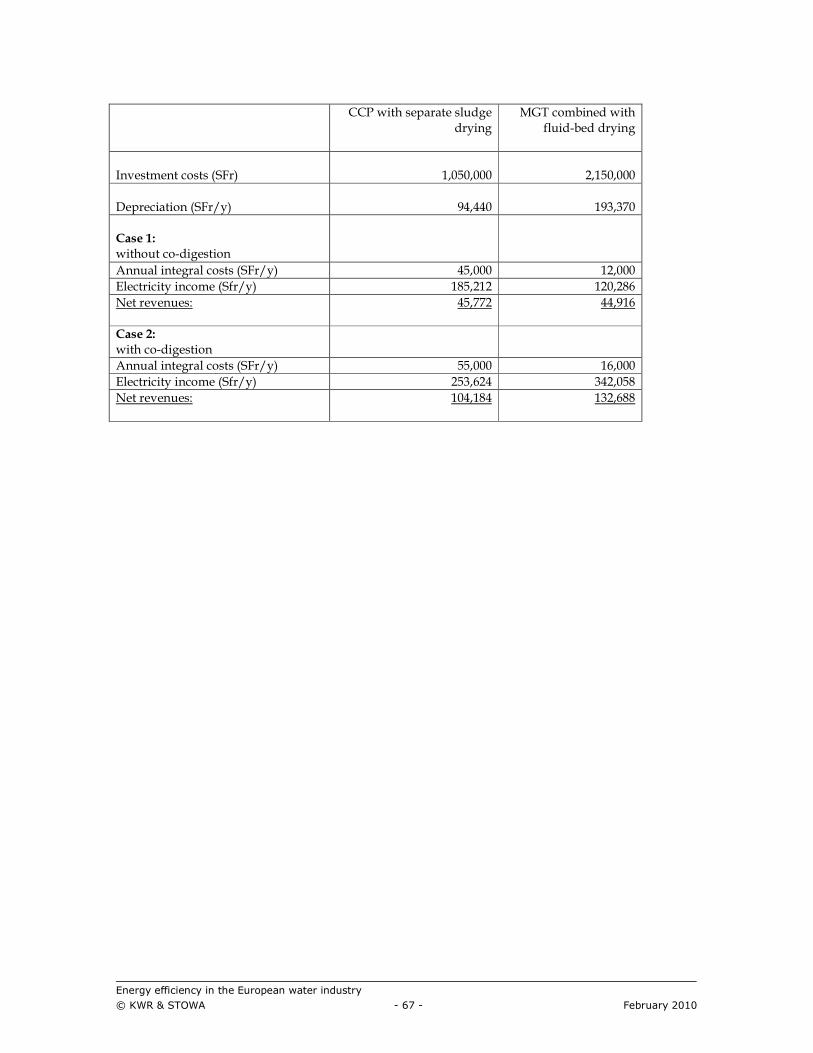
Energy efficiency in the European water industry
© KWR & STOWA - 67 - February 2010
CCP with separate sludge drying
MGT combined with fluid-bed drying
Investment costs (SFr)
1,050,000
2,150,000
Depreciation (SFr/y)
94,440
193,370
Case 1:
without co-digestion
Annual integral costs (SFr/y) 45,000 12,000
Electricity income (Sfr/y) 185,212 120,286
Net revenues:
45,772 44,916
Case 2:
with co-digestion
Annual integral costs (SFr/y) 55,000 16,000
Electricity income (Sfr/y) 253,624 342,058
Net revenues:
104,184 132,688

Energy efficiency in the European water industry
© KWR & STOWA - 68 - February 2010
T1. Case study Germany, Krefeld (Krefeld)
Pigging of a raw water pipe Over the years, the head loss increased of a water supply pipe of the municipal utility Krefeld. After pigging the head loss was approximately 3 bar lower.
Ref Enquiry Item Response information, description and remarks
1 Location: Country, urban or rural: Germany, Krefeld, Urban.
2 Sector: clean, waste or sludge: Clean. Raw water pipe, collection of raw water from reduced groundwater.
3 Works Owner or Operator: with financial set-up, regulatory or not.
The municipal utility Krefeld provides the town of Krefeld with drinking water (approximately 14 Mio. M³/year).
4 Size: flows and loads or population equivalent: Approximately 14 million m³ per year in the considered pipe system approximately 3,6 million m³ per year as first stage.
5 Energy Provider: with costs, incentives, taxes and conditions:
From the market.
6 Process: physical, chemical, or biological
description:
Physical: pumping, head loss in cause of friction depending on iron oxidation, sedimentation and clogging due to oxidation products.
7 Component: all or part of the works: Raw water Pumps and pipesystem.
8 Specific energy problem: including quality or consent details:
Because of friction the specific energy consumption (kWh/m³) rises up.
9 Process/Plant changes: mechanical, electrical or controls:
No process related
10 Civil/Physical Changes: to water / effluent quality, civil works, or process:
No changes
11 Operational Changes: skill levels, procedures and maintenance routines:
New procedures of operation.
12 Risks and Dependencies: risk assessment of project and changes.
No risks expected, better performance of operation.
13 Implementation: design, build, procurement, installation and commissioning:
Installed and operated.-
14 Energy Efficiency gains: kWh & kWh/m3 After pigging the head loss was approximately 3 bar lower. Calculation of the energy-saving is difficult, because after pigging the head loss increases continously again.
15 Cost / Benefit analysis: financial appraisal or payback time.
The costs per pigging are 2200 Euro. The pigging costs were low, because the pipe was build with special controls and instruments (higher investment). Energy-saving not calculated.
16 Project review: could it be improved or developed?
The optimized intervals of pigging will be calculated, depending on development of head loss. .

Energy efficiency in the European water industry
© KWR & STOWA - 69 - February 2010
17 Confidence grade: on data provided. High
Observations Compiled by TZW The municipal utility Krefeld provides the town of Krefeld with approximately 14 Mio. m³ drinking water per year. The supply consists of two waterworks. One of the waterworks is feed by two raw water pipes. One of these pipes (DN 500) is approximately 4.5 km long. Because of friction depending on iron oxidation, sedimentation and clogging due to oxidation products, the head loss increases. After pigging the head loss was approximately 3 bar lower. Head loss in pipes produces an additional power consumption by the pumps. The costs of pigging could be reduced significantly by the installation of watergates to place and replace the pig. For this reason it’s possible to pig the pipe from an ecomonic point of view all 18 month.

Energy efficiency in the European water industry
© KWR & STOWA - 70 - February 2010
T2. Case Study Germany, Nindorf (Süderdithmarschen)
New drinkingwater pumps and operational control At waterwork Odderade new drinking water pumps and operational control were installed. The specific energy consumption [kWh/m³] of the new frequency driven pumps was about 15.7 % lower.
Ref Enquiry Item Response information, description and remarks
1 Location: Country, urban or rural: Germany, Nindorf. rural.
2 Sector: clean, waste or sludge: Clean. New drinking water pumps.
3 Works Owner or Operator: with financial set-up,
regulatory or not.
The water utility Süderdithmarschen provides southern Dithmarschen with drinking water (approximately 6 Mio. M³/year).
4 Size: flows and loads or population equivalent: Circa 6 million m³ per year
with the pumps and operational control
5 Energy Provider: with costs, incentives, taxes and
conditions:
From the market.
6 Process: physical, chemical, or biological
description:
Physical: pumping
7 Component: all or part of the works: Pumps and operational control
8 Specific energy problem: including quality or consent details:
Because of low pump efficiency the energy consumption (kWh/m³) has increased.
9 Process/Plant changes: mechanical, electrical or controls:
Mechanical and controls
10 Civil/Physical Changes: to water / effluent quality, civil works, or process:
No changes
11 Operational Changes: skill levels, procedures and maintenance routines:
Increased operational control.
12 Risks and Dependencies: risk assessment of project and changes.
Not expected, in contrary better service results expected.
13 Implementation: design, build, procurement, installation and commissioning:
design and installation in 2009.
14 Energy Efficiency gains: kWh & kWh/m3 The specific energy consumption was 15,7 % lower due to new pumps and operational control.
15 Cost / Benefit analysis: financial appraisal or payback time.
The costs for pumps and controls. Payback time approximately 11 years
16 Project review: could it be improved or developed?
project documentation and analysis of results in next years.
17 Confidence grade: on data provided. High

Energy efficiency in the European water industry
© KWR & STOWA - 71 - February 2010
Observations
Compiled by TZW The water utility Süderdithmarschen supplies southern Dithmarschen with drinking water. The waterwork Odderade produces approximately 6 Mio. m³ drinking water per year. New drinking water pumps and operational control were installed. Before modernization six pumps with different dimensions generated the required pressure of 5.4 bar. Two of the pumps had a frequency control, the other four pumps were operated with only one speed. In the course of the modernization the six old pumps were replaced by four frequency driven pumps. The specific energy consumption [kWh/m³] of the new pumps was about 15.7 % lower. In 11 to 12 years the modernization is amortized.

Postbus 1072 3430 BB Nieuwegein The Netherlands P +31 30 606 95 11 F +31 30 606 11 65 E [email protected]