Energy Efficiency in Road Transport Sector in the SAARC ... Efficiency in... · The study on Energy...
79
Energy Efficiency in Road Transport Sector in the SAARC Member States SAARC Energy Centre, Islamabad 2015
-
Upload
truonglien -
Category
Documents
-
view
213 -
download
0
Transcript of Energy Efficiency in Road Transport Sector in the SAARC ... Efficiency in... · The study on Energy...

Energy Efficiency in Road Transport Sector
in the SAARC Member States
SAARC Energy Centre, Islamabad
2015

Energy Efficiency in Road Transport Sector
in the SAARC Member States
SAARC Energy Centre, Islamabad
December 2015
i
Author:
Suresh Shrestha
Research Fellow
SAARC Energy Centre
Reviewed by:
Engr. Asad Mahmood
Energy Efficiency Expert
Islamabad, Pakistan
Disclaimer:
Findings, interpretation and conclusions expressed in this report are based on information
acquired from the SAARC Member States, the documents available in printed and online
versions and also on the assumptions made by the author in developing the model. These do
not necessarily reflect the views of SAARC Energy Centre and the author does not guarantee
the accuracy, completeness or usefulness of information in this report, and as such not
responsible for any errors, omissions, or losses which emerge from its use.
Published by:
SAARC Energy Centre 697, Street 43, NPF, E-11/4, Islamabad, Pakistan
Tel: +95 51 222 8802, +92 51 222 8804
Fax: +92 51 2221937
www.saarcenergy.org

ii
Foreword
SAARC Energy Centre (SEC) is mandated to initiate, coordinate and facilitate regional
cooperation in South Asia. Among the various areas of the energy sector in which SEC is
working, Energy Conservation and Energy Efficiency are one of its prime focuses. With a
view to promoting and achieving energy conservation in an integrated approach, SEC
published SAARC Action Plan on Energy Conservation in the year 2012.
Import dependence for petroleum products varies among countries in South Asia, but all of
them are importers of petroleum products. With a rapid growth in population as well as in
urbanization, transport sector in the region is growing at an unprecedented rate. The
economic growth engendering increase in urbanization, mobility of goods and people,
growing middle class segment and faster motorization and private vehicle ownership in each
country in the region has put an increased pressure on the import dependence for petroleum
products.
Improving energy efficiency and avoiding and reducing transport needs can bring about a
significant reduction in the demand for petroleum products and the associated environmental
impacts. Reduction in traffic congestion, reduction in noise pollution and reduction in
accidents are some indirect benefits associated with these strategies. Realizing this, SEC has
undertaken an in-house study to estimate the potential of energy saving in the road transport
sector in each member state of SAARC with an objective to draw policy recommendations to
reduce energy demand in the sector.
The study provides useful guidelines and actions required to be taken by the member states to
relax its import dependence for petroleum fuels through adoption of efficient technologies and
other non-engine related strategies in the road transport sector. The report and the energy
demand model are available at our website www.saarcenergy.org. Suggestions and feedback
from all stakeholders to improve the model shall be highly appreciated.
Muhammad Naeem Malik
Director,
SAARC Energy Centre, Islamabad

iii
Acknowledgements
The study on Energy Efficiency in Road Transport Sector in the SAARC Member States
has been carried out by Mr. Suresh Shrestha, Research Fellow (ETE), SAARC Energy Centre.
The author would like to extend gratitude to SAARC Energy Centre for providing the
opportunity to carry out this study. Sincere thanks are extended to the member states that
provided the requisite data for the study. The effort was also supported by all the professionals
in the SAARC Energy Centre.
The contributions of Mr. Saqib Abbas Abbasi, BBA (Semester IV), COMSATS Institute of
Information Technology, internee in the SAARC Energy Centre, are highly appreciated. Mr.
Saqib extended support in the study by collection, organization and preparation of inputs for
the energy demand model. The author would also like to extend sincere gratitude to Engr.
Asad Mahmood, an energy efficiency expert who conducted peer review. His experienced
remarks and suggestions have made a remarkable value addition in refining the report.

iv
Contents
Foreword ...................................................................................................................................................... ii
Acknowledgements .................................................................................................................................... iii
Abbreviations ............................................................................................................................................. vi
List of Figures ............................................................................................................................................ vii
List of Tables ............................................................................................................................................. vii
Executive Summary .................................................................................................................................... 1
1 Introduction ......................................................................................................................................... 3
1.1 The Role of Transport ................................................................................................................ 3
1.2 Objective of the Study................................................................................................................. 4
1.3 Methodology ................................................................................................................................ 4
1.4 Travel demand ............................................................................................................................ 6
1.5 Vehicle km ................................................................................................................................... 6
1.6 Calculating Passenger- km ......................................................................................................... 6
1.7 Energy Intensity/ Fuel Economy ............................................................................................... 6
1.8 Calculating Energy Intensities ................................................................................................... 7
1.9 Energy demand ........................................................................................................................... 7
1.10 Limitations of the Study ............................................................................................................. 8
1.11 Study Area ................................................................................................................................... 8
2 Global Transport Energy Situation ................................................................................................... 9
3 Road Transport in the SAARC Region ........................................................................................... 12
3.1 Afghanistan ................................................................................................................................ 12
3.2 Bangladesh ................................................................................................................................. 13
3.3 Bhutan ........................................................................................................................................ 14
3.4 India ........................................................................................................................................... 15
3.5 Maldives ..................................................................................................................................... 16
3.6 Nepal........................................................................................................................................... 17
3.7 Pakistan ...................................................................................................................................... 18
3.8 Sri Lanka ................................................................................................................................... 19
4 Drivers for Energy Demand in Transport Sector .......................................................................... 20
5 Energy Consumption in Road Transport Sector in the SAARC Region ..................................... 22
6 Scenario Analysis .............................................................................................................................. 25
6.1 BAU Scenario ............................................................................................................................ 25
6.2 GASELEC Scenario .................................................................................................................. 25
6.3 EFF-TECH Scenario ................................................................................................................ 25

v
6.4 MASSTRANS Scenario ............................................................................................................ 26
7 Energy Demand in the Road Transport Sector in SAARC Region .............................................. 28
8 Approaches for Reducing Energy Demand in the Road Transport Sector ................................. 33
9 Conclusions and Recommendations ................................................................................................ 35
9.1 Conclusions ................................................................................................................................ 35
9.2 Recommendations ..................................................................................................................... 35
References .................................................................................................................................................. 38
Annexure-A ............................................................................................................................................... 39
Annexure-B ................................................................................................................................................ 47
Annexure-C ............................................................................................................................................... 53

vi
Abbreviations
ADB Asian Development Bank
BAU Business as Usual
CAGR Compound Annual Growth Rate
CNG Compressed Natural Gas
ED Energy Demand
EFF-TECH Transformation to Energy Efficient Systems and Technologies
FE Fuel Economy
GASELEC Compressed Natural Gas and Electricity
GDP Gross Domestic Product
Km Kilometer
KTOE Kilo Tonnes of Oil Equivalent
LEAP Long range Energy Alternatives Planning
LPG Liquefied Petroleum Gas
MASSTRANS Mass Transport
MTOE Million Tonnes of Oil Equivalent
MVE Motor Vehicle Examination
NV Number of Registered Vehicles
SAARC South Asian Association for Regional Cooperation
SEC SAARC Energy Centre
SEDB SAARC Energy Data Book
VKT Vehicle Kilometer of Travel

vii
List of Figures Figure 1 Road Transport Energy Demand .................................................................................................... 7
Figure 2 Primary Energy Consumption ....................................................................................................... 9
Figure 3 World CO2 emissions by Fuel .................................................................................................... 10
Figure 4 Total Final Consumption Sector ................................................................................................... 11
Figure 5 Increase in Demand for road transport in Afghanistan ................................................................. 12
Figure 6 Increase in Demand for road transport in Bangladesh .................................................................. 13
Figure 7 Increase in Demand for road transport in Bhutan ......................................................................... 14
Figure 8 Increase in Demand for road transport in India ............................................................................ 15
Figure 9 Increase in Demand for road transport in Maldives ..................................................................... 16
Figure 10 Increase in Demand for road transport in Nepal ......................................................................... 17
Figure 11 Increase in Demand for road transport in Pakistan ..................................................................... 18
Figure 12 Increase in Demand for road transport in Srilanka ..................................................................... 19
Figure 13 Factors effecting Transport Demand .......................................................................................... 20
Figure 14 Population and GDP growth in SAARC region ........................................................................ 22
Figure 15 Theurban rural split in the SAARC countries ............................................................................ 22
Figure 16 Final Energy Consumption in the SAARC Region by Countries .............................................. 23
Figure 17 Final Energy Consumption in the SAARC Region by country and by fuel types ..................... 23
Figure 18 Energy Consumption in the Road Transport Sector in the SAARC Region ............................. 24
Figure 19 Fuel-wise Energy Consumption in the Road Transport Sector in the SAARC Region ............. 24
Figure 20 Road Transport Energy Demand: Afghanistan .......................................................................... 28
Figure 21 Road Transport Energy Demand: Bangladesh .......................................................................... 28
Figure 22 Road Transport Energy Demand: Bhutan .................................................................................. 29
Figure 23 Road Transport Energy Demand: India ..................................................................................... 29
Figure 24 Road Transport Energy Demand: Maldives .............................................................................. 30
Figure 25 Road Transport Energy Demand: Nepal .................................................................................... 30
Figure 26 Road Transport Energy Demand: Pakistan ................................................................................ 31
Figure 27 Road Transport Energy Demand: Sri Lanka ............................................................................. 31
Figure 28 Road Transport Energy Demand: SAARC Region ................................................................... 32
Figure 29 Schematic Diagram of Efficient Transport Concepts ................................................................. 33
List of Tables Table 1 Vehicle Classification and Fuel Type .............................................................................................. 5
Table 2 Comparative Analyses of Different Scenarios ............................................................................... 27


1
Executive Summary
Transport is the sector with a high final energy consumption. Energy consumption in this
sector is expected to grow significantly and emissions could increase at a faster rate if
aggressive and sustained mitigation policies are not undertaken. The sector has direct and
indirect linkages with all important sectors of the respective national economies.
As transport sector is the crucial driver of economic growth, all transport modes in SAARC
countries are expected to show substantial increases in activity and fuel use in the future. Road
transport (passenger and freight), in particular, will continue to dominate overall transport
energy and oil use in the SAARC region although air travel and shipping too are expected to
grow substantially. In view of the foregoing, Long range Energy Alternatives Planning
Systems (LEAP) model was used to forecast energy demand in the road transport sector in the
SAARC member countries upto 2040.
The study covers the global transport energy situation and road transport situation in the
SAARC countries including information on different types of registered vehicle population
and road infrastructure information upto some extent. An overview of the drivers for energy
demand in transport sector in the context of SAARC countries has also been given.
The different scenarios such as BAU (Business as Usual), GASELEC (Compressed Natural
Gas and Electricity Conversion), EFF-TECH (Transformation to Energy Efficient Systems
and Technologies), MASSTRANS (Mass Transport) are analyzed in the Long range Energy
Alternatives Planning System (LEAP) model by setting an interval of five years in between
2010 to 2040. LEAP is a widely-used software tool for energy policy analysis. The graphical
trajectories of energy consumption in different scenarios for each member country are plotted
and analyzed. Ultimately all the scenarios are combined as per the assumptions, which show a
potential of about 35% of energy saving in the region by the end of year 2040 if best practices
for energy efficiency in road transport sector are applied.

2
Approaches for reducing energy demand in road transport sector are also covered in the study
with a focus on Reduce-Shift-Improve policies. This study concludes with the key findings
drawn from the output of the model. Certain recommendations are also given at the end which
the SAARC countries can consider while developing transport related policies, plans and
strategies.

3
1 Introduction
1.1 The Role of Transport
Transport is strongly linked with economic activities. Economic growth triggers transport
demand for the facilitation of movement of people and goods. Transport connects the
economic activities and increases access to markets and services. Transport is a key to
enhancing integration to global economy.
Today, the transport needs have changed drastically. Personal mobility today is a major
energy-consuming activity. Mobility of individuals has increased by many folds and is
expected to continuously increase in the future. New patterns of trade and businesses have
evolved. The road networks within the countries and beyond the borders have increased.
Freight transport has grown rapidly and is expected to continue to do so in the future.
SAARC region is the home of over 1.6 billion people, which is approximately one fourth of
the world population. A long period of economic growth has translated into declining poverty
and significant improvements in human development in the region. A large number of people
continue to migrate to the urban areas from the rural areas of the country. This has resulted in
the rapid growth in demand for transport in the urban areas. However, the region requires
improvement in transport infrastructure.
The transport sector is a huge consumer of energy; it is indeed the largest consumer of
petroleum-based fuels, accounting for 20% of global final energy consumption and 60% of
total oil consumption. More than one third of the total greenhouse gas emission comes from
the transport sector. With the economic growth of the SAARC countries, all transport modes
have shown substantial increases in activity, which in turn has resulted dramatic surge in
energy demand. Along with the growth of industrial, commercial and transport sectors, people
are using energy at unprecedented rates. Demand for energy in all the sectors in the region is
expected to grow significantly in the future. All modes of transport are expected to grow
significantly and the road transport (passenger and freight), in particular, will continue to
dominate overall transport energy and oil use in the region although air travel and shipping too
are expected to grow substantially.

4
To unleash the region’s economic potential, every country in South Asia is in a paradoxical
situation between the economic growth and depleting energy resources. The consequent
energy security and greenhouse gas emission implications of oil-dominated transportation
imply that reducing the fuel used in this sector should be one of the highest priorities for all
the SAARC countries.
1.2 Objective of the Study
The study aims to analyze the road transportation situation and trends in the SAARC
countries. The road transport energy demand has been forecasted for each member state under
different scenarios for thirty years with base year 2010 and the end year 2040, using Long
range Energy Alternatives Planning System (LEAP). The study also aims to recommend
strategy options for bringing about energy saving in the road transport sector, so that oil
demands and hence the environmental impacts are minimized. The study deals with
improvement in energy efficiency and also oil saving through fuel switch, non-engine
components, modal shift and operational efficiencies.
1.3 Methodology
In order to achieve the objectives of the study, the Long range Energy Alternatives Planning
(LEAP) model was used to analyze and forecast energy demand in the road transport sector in
the SAARC countries for 30 years from 2010 to 2040. LEAP is a widely-used software tool
for energy policy analysis and climate change mitigation assessment developed at the
Stockholm Environment Institute, within which different energy system models can be created
for demand and supply of energy. However, in this study, analysis focuses on the demand side
only in order to estimate road transport sector energy demand in different scenarios. Various
other attributes of LEAP could be seen at http://www.energycommunity.org.
The study was carried out in two parts. Historical analyses of energy with respect to travel
demand was carried out using excel spreadsheets, while different analyses related to the future
scenarios were carried out using LEAP software. In order to predict energy demand in the
transport sector, a bottom-up approach was undertaken due to its capability to account for the
flow of energy based on travel demand, fuel consumption and vehicle numbers. The energy
demand function in the transportation sector was modeled as:
EDij = NVij × VKTj × FEij

5
The energy demand can be determined by integrating the results over every fuel type ―i‖ and
vehicle type ―j‖. However, the developing countries like the SAARC countries still lack many
necessary time-series transport data. In addition to difficulty in data collection, some
assumptions are necessary to be made to predict the future energy demand.
As a first step, the data pertaining to number of registered vehicles (NV) were gathered from
the member countries and from the relevant web sites. Subsequently, the number of vehicles
was categorized into different types and technologies as shown in the table below. This
categorization of vehicles into different types and technologies was necessary as the annual
travel activities vary according to the vehicle type/class and the fuel economy also varies
accordingly. Wherever the vehicle category data was not available, some assumptions were
made. Similarly the necessary data like Vehicle Kilometer of Travel (VKT) was not
adequately available; assumptions were therefore applied in computation. Other associated
data statistics, like Fuel Economy (FE), were assumed as the function of engine size, engine
technology and fuel used, which are dependent on vehicle type.
S.
No.
Vehicle
Type Sub-Classification Fuel Used
1 Car G D C E
2 Bus
Large (Seating Capacity, 26-40) D C E
Medium (Seating Capacity 11-25) D C E
Small (Seating Capacity upto 10) D C E
3 Motorcycle G E
4 Three
Wheelers
G C E L
5
Truck
Large (Loading capacity above 10
tons)
D
Medium (Loading capacity 4-7 tons) D
Small (Loading capacity upto 4 tons) D
Table 1 Vehicle Classification and Fuel Type
G: Gasoline D: Diesel C: Compressed Natural Gas (CNG) E: Electricity L: Liquefied Petroleum Gas (LPG)

6
1.4 Travel demand
The energy demand in road transportation was formulated as a function of the number of
vehicles, average distance traveled, proportion of vehicle type and fuel economy or fuel
efficiency of vehicle. However, in the LEAP framework, total passenger-travel demand was
expressed in terms of Passenger-km and Ton-km for passenger and freight vehicles
respectively.
1.5 Vehicle km
The vehicle kilometer of travel (VKT) is a parameter to reflect how heavily the considered
vehicle is used. Hence, this parameter varies depending on the vehicle type and its driven
distance. Moreover, it should be noted that the VKT is not constant with time because the
gross road distance and/or traffic conditions change. Unfortunately, the VKT data are not
recorded on a regular basis and these data were not available for the SAARC countries.
Estimates were made on the basis of judgment.
1.6 Calculating Passenger- km
The Passenger-km for different passenger vehicle types was computed as per the following
relations:
The Ton-km for different freight vehicle types was computed as per the following relations:
1.7 Energy Intensity/ Fuel Economy
Energy intensity / Fuel economy is the relation between the distance traveled and amount of
fuel consumed. Energy intensity of a vehicle depends on the vehicle size, vehicle type,
vehicle’s engine type and fuel type used. Fuel economy is commonly expressed in terms of
Vehicle-km/L. The activity based energy intensity is the quantity of energy or fuel required to
Vehicle Use (Vehicle-km) , A
Load Factor (Passenger-km/Vehicle-km), B
Total Passenger-km, C= A*B
Vehicle Use (Vehicle-km) , X
Load Factor (Ton-km/Vehicle-km), Y
Total Ton-km, Z= X*Y

7
GDP
Population
Historical
Trends
Passenger
Transport
Inte
rcit
y
Passenger-
km
Intr
acit
y
Load
Fac
tor
Fuel
Ec
on
om
y
Ro
ad T
ran
spo
rt E
ne
rgy
De
man
d
Freight
Transport Ton- km
produce a unit of travel activity, i.e., L/ Passenger-km for passenger transport activity and
L/Ton-km for freight transport activity.
1.8 Calculating Energy Intensities
Energy intensities were computed as per the following relations:
1.9 Energy Demand
The energy demand of the vehicle by fuel types was formulated as a function of the number of
vehicles, the average vehicle kilometer traveling and the fuel economy. Therefore, total
energy consumption of vehicle was calculated by the following equation:
EDij = NVij × VKTj × FEij
The input data used for member countries could be seen at Annexures A along with
assumptions taken.
Figure 1 Road Transport Energy Demand
Passenger Transport
Fuel Economy (Vehicle-km/L), X
Freight Transport
Fuel Economy (Vehicle-km/L), M
Load Factor (Passenger-km/Vehicle-km), Y Load Factor (Ton-km/Vehicle-km), N
Energy Intensity(L/Passenger-km), Z=1/(X*Y) Energy Intensity (L/Ton-km), O=1/(M*N)

8
1.10 Limitations of the Study
Unavailability of accurate transport data was the biggest challenge for the study. Wherever the
required data could not be acquired due to different limitations and barriers, assumptions were
made in categorizing the vehicles into different types, the technology they use, the vehicle
usage, load factors and energy intensity. The LEAP module developed in this study can be
further improved as and when more accurate and authentic data become available.
1.11 Study Area
The study was carried out for all the eight countries of SAARC for a period of 30 years from
the year 2010 as the base year to the year 2040. Energy demand in different scenarios with the
intervals of five years between these years was computed and policy recommendations are
made accordingly.

9
2 Global Transport Energy Situation
Global energy demand has significantly increased over the last decades. According to IEA, the
global energy demand has almost doubled from the year 1971 to 2012. Fossil fuel is the
primary source of energy and will remain the primary source worldwide. 40% of the 8979
MTOE of the world’s total energy consumption is contributed by oil and 35.3% of the total
31734 Mt of CO2 emission comes from oil1.
Figure 2 Primary Energy Consumption2
1IEA World Energy Outlook, 2012
2IEA World Energy Outlook, 2012

10
Figure 3 World CO2 emissions by Fuel3
Mobility is an essential human need. The movement of people and goods is very important for
social interaction and eventually for the survival of the human beings. The world in itself has
become a global market particularly because of transport system. It cannot be denied that one
of the preconditions for economic well-being is the accessibility of goods and services to the
people. The different sectors of end use (households, industry, transport, service, agriculture)
drive the growth but the transport sector will remain the single largest final energy consuming
sector.
3 IEA World Energy Outlook, 2012

11
Figure 4 Total Final Energy Consumption by Sector4
According to IEA, 63.7% of 3652 MTOE oil consumption goes to the transport sector alone.
Within Transport Sector, road transport consumes approximately 70% the total energy used in
the global transport system. Road passenger transport alone accounts for 50% of this energy
consumption. Only small proportion of energy used derives from natural gas, LPG, electricity
or biofuels. It is estimated that the share of renewable energy will increase in future. However,
energy consumption in the transport sector will come mostly from oil. This will therefore
imminently lead to an increase in oil consumption.
4 IEA World Energy Outlook, 2012

12
3 Road Transport in the SAARC Region
3.1 Afghanistan
Afghanistan is a landlocked country with a population of almost 30 million dispersed across
the largely mountainous terrain of 652,000 square kilometers. Roads are the principal means
of transport in the country. The regional highway network fosters regional trade and economic
linkages.5
Demand for road transport is increasing rapidly, which is evidenced by the supply of
registered vehicles. The vehicle population is increasing rapidly with an annual average
growth rate of over 8 percent over the period between 2008 and 2010, with small vehicles
including cars and motorcycles increasing annually at an average of 10%. Transport services
in the country are inadequate, and of low quality.
Figure 5 Increase in Demand for road transport in Afghanistan6
5ADB: Transport Network Development Investment Programme
6Afghanistan Statistical Year Book 2009/10
0
200000
400000
600000
800000
1000000
1200000
2007/08 2008/09 2009/10
Foreigner
Rickshaw
Motor Cycle
Passenger Cars
Buses
Lorries

13
3.2 Bangladesh
According to the Roads and Highways Department of Bangladesh, the country has about
21,000 Km of major roads, of which National and Regional Highways constitute about 8000
Km and the remaining are Zilla roads.
The country has seen a rapid growth in the vehicular population in the last decade. Small
passenger transport traffic grew at an average annual rate of 11.2 % in between the year 2009
and 2013. Motor cycle registrations increased by more than 150% during the period.
Figure 6 Increase in Demand for road transport in Bangladesh7
7Bangladesh Road Transport Authority
0
200000
400000
600000
800000
1000000
1200000
1400000
1600000
1800000
2000000
2009 2010 2011 2012 2013
Others
Truck
Tractor
Taxi Cab
Tanker
Special Purpose Vehicle
Private Passenger Car
Pick Up (Double/Single Cabin)
Motor Cycle
Minibus
Microbus
Jeep (Hard/Soft)
Human Hauler
Delivery Van
Covered Van
Cargo Van
Bus
Auto Tempo
Auto Rickshaw
Ambulance

14
3.3 Bhutan
Roads are the main mode of passenger and freight transport within the country and with
neighboring country, India. The current network comprises about 10,577 kilometers of roads.
An estimated 80% of rural people have access to essential services in less than 1 hour of travel
time.8
The use of motor vehicles is highly concentrated in the western region of the country,
especially in Thimphu and Phuentsholing. Nationally, registrations increased sharply from
22,5274 in 2001 to 67,926 in 2013.
Figure 7 Increase in Demand for road transport in Bhutan9
Total traffic increased at an annual average rate of 9.6% in the period between 2001 and 2013.
The motorcycles increased at an average annual rate of almost 15% and the light vehicles at
the rate of more than 12% during the same period.
8ADB: South Asia Sub regional Economic Cooperation Road Connectivity Project (RRP BHU 39225)
9 Road Safety and Transport Authority, Bhutan
0
10000
20000
30000
40000
50000
60000
70000
20
01
20
02
20
03
20
04
20
05
20
06
20
07
20
08
20
09
20
10
20
11
20
12
20
13
Other
EME
Tractor
Power Tiller
Taxi
Two wheeler
Light
Medium
vehicles Heavy

15
3.4 India
The road transport sector in India has expanded many folds during the last five decades, both
in terms of spread and capacity. Light motor vehicles and two wheelers dominate the road
transport sector. An average annual growth rate of motorcycles from the year 2001 to 2011
was more than 10% and that of cars during the same period was also almost 11%. On an
average overall road traffic grew at an average annual rate of 10% during the period.
Figure 8 Increase in Demand for road transport in India10
10
Road Transport Year Book (2009-2010 & 2010-2011)
0
20000000
40000000
60000000
80000000
100000000
120000000
140000000
160000000
20
01
20
02
20
03
20
04
20
05
20
06
20
07
20
08
20
09
20
10
20
11
Miscellaneous-
Goods Vehicles
Buses (b)
Taxis
Cars
Jeeps
Light Motor Vehicles(Passengers)
Two Wheelers

16
3.5 Maldives
Maldives has a very few paved roads: some 60 km in Male, and 14 km each on the Laamu and
Addu Atolls. Village roads are mainly of compacted coral. The rapid increase in vehicle
ownership is a growing threat to passenger safety and the environment11
. In the year 2011, the
number of two wheelers registered was 42,393. Almost 4000 light motor vehicles and 128
buses were on road. As far as the freight transport is concerned, the number of registered
goods vehicles was 4115 in the year 2011.
Figure 9 Increase in Demand for road transport in Maldives12
11
ADB: Interim Country Partnership Strategy: Maldives, 2014–2015 12
Transport Authority, Male, Maldives
0
10,000
20,000
30,000
40,000
50,000
60,000
2011
BATTERY CARDOUBLE CABMILLING MACHINEFUEL TANK TRUCKCONCRETE MOBILE TRUCKG.COMPACTOR TRUCKPILE DRIVERMINI TRUCKBATTERY SCOOTERTOW TRUCKCOMPACTORWHEEL PAVERROAD SWEEPERBOOM LIFTMICROBINROLLERGRADERDOZER CRAWLERDITCH WITCHT-TYPE TRACTORLOADERBACKHOE LOADERFIRE VEHICLESLAND CRUISERREACH STACKERTRACTORDUMPEREXCAVATORFORK-LIFTTRUCKCRANEBOUSERAMBULANCEJEEPVANLORRYPICK-UPBUSCARMOTOR CYCLE

17
3.6 Nepal
Nepal has a total of 25,599 Km long road with 10,810Km black topped; 5,925 Km graveled
and 8,666Km earthen (fair weather) by the fiscal year 2013/14.13
The number of transport
vehicles registered between FY 1989/90 and FY 2012/13 across the country stood at
1,557,478.
The country has seen a very rapid growth in the light vehicles and two wheelers. The
registered number of two wheelers grew at an average annual rate of almost 16 percent
between the year 2001 and 2010. Similarly, the annual average growth of light vehicles was
about 7.5 percent within the same period.
Figure 10 Increase in Demand for road transport in Nepal14
13
Economic Survey of Nepal 2013-14
14
Department of Transport Management, Nepal
0
200000
400000
600000
800000
1000000
1200000
1400000
1600000
1800000
Others
Tractor/Power Tiller
Motorcycle
Tempo
Microbus
Pick up
Car/Jeep/Van
Crane/Dozer/Excavator/Truck
Mini Bus/Truck
Bus

18
3.7 Pakistan
The road network in Pakistan carries over 96 percent of inland freight and 92 percent of
passenger traffic. About 63% of the population lives in villages. The topography of the region
consists of hilly mountainous areas, far flung agriculture leveled lands and the productive
resources. Roads provide easy and efficient means of transportation. The total road-network in
Pakistan is about 263,415 km consisting of 9,324 km. (3.53%) of National highways and
2,280 km of motorways (0.87%). Strategic roads and Expressways contribute 262 km and 100
km respectively (i.e. 0.10%). The rest of the road network contains provincial highways and
the roads under respective local administration e.g. cantonment boards, municipal
corporations, local development authorities, etc.15
The population of the two wheelers grew by
an annual average rate of almost 8 percent between the year 2002 and 2010, while the annual
growth rate of light motor vehicles remained at about 4% average.
Figure 11 Increase in Demand for road transport in Pakistan16
15
Economic Survey of Pakistan 2012-13
16Pakistan Statistical Year Book 2011
0
1000000
2000000
3000000
4000000
5000000
6000000
7000000
8000000
9000000
10000000 Others
Motor Cycles/ Motorrickshaws/three wheelers
Mortor Cycles/Two wheelers
Trucks
Buses/Mini buses
Motor Cabs/Taxis
Motor cars/Jeeps and stationwagons

19
3.8 Sri Lanka
Sri Lanka relies heavily on road transport. About 97% of freight traffic is conveyed by road.
The 113,000-km road network in the country includes about 11,900 km of national highways.
The condition and the standards of these roads are inadequate to accommodate rapidly
growing freight and passenger traffic.17
Figure 12 Increase in Demand for road transport in Sri Lanka18
An average annual growth of light motor vehicles was about 6 percent and that of motorcycles
was about 11 percent between the year 2003 and 2010. In Sri Lanka also the population of
light vehicles including motor cycles dominates the passenger transport sector.
17
ADB’s Support for the Transport Sector in Sri Lanka 18
Department Of Motor Traffic, Sri Lanka
0
1,000,000
2,000,000
3,000,000
4,000,000
5,000,000
6,000,000
20
03
20
04
20
05
20
06
20
07
20
08
20
09
20
10
20
11
20
12
20
13
At
End
Ju
ly
Land vehicles-Trailers
Land vehicles-Tractors
Lorries
Dual purpose vehicles
Buses
Motor Cycles
Motor Tricycle
Motor cars

20
4 Drivers for Energy Demand in Transport Sector
A rapid motorization is taking place in the countries of South Asia due to the growth in socio-
economic conditions. As a result of rising incomes, per capita vehicle ownership is rising
exceptionally fast; motor vehicle fleets are doubling every 5–7 years. Since fleets are growing
from a low base, very rapid growth will continue for the foreseeable future. Freight transport
has also been growing rapidly and is expected to continue to do so in the future.
Figure 13 Factors effecting Transport Demand
Different people have different travel demands. People with higher income will have different
travel demand as compared to those with lower income. Similarly, people of different ages
have different preferences for travel modes and so travel demands can vary according to age
as well.
Transport Demand
Economic Growth
Rising Income
Level
Increasing Urbanization
Changing Household Structure
Changing Life Styles
Demographic Changes
Land Use Factors
Transport Quality

21
Land use factors such as roadway connectivity, road structure can also engender difference in
travel demands. The rural populations with no road or less motorable roads might resort to
walking more or the demand for manual and animal pulled vehicles would be more as
compared to the urban areas where more engine vehicles would be used. Similarly, the density
of pedestrians would depend upon the pedestrian-friendliness of the roads in the city areas.
Economic activities have a very positive relationship with the travel demand. Increased
economic activities result in increase in transport demand both passenger as well as freight.
Mobility of people and goods is not high in places where there are lesser economic and
commercial activities.
Travel behavior also depends upon the variety of options available to people. Presence of
affordable air transport would obviously have impact on the road transport and availability of
railways and metros in the cities would have impact on the number of cars plying over on the
roads.
Transport demand also depends upon the quality of transport options. In the places where
there is quality public transport, people would opt for public transport instead of using private
vehicles. Lack of adequate and quality public transport is generally a driving factor for
increased number of private vehicles in economically growing developing countries. In the
region, we can see a very rapid growth in the private vehicle ownership, particularly cars and
two wheelers on account of public transport being insufficient and at the same time the quality
being poor.
22
5 Energy Consumption in Road Transport Sector in the SAARC Region
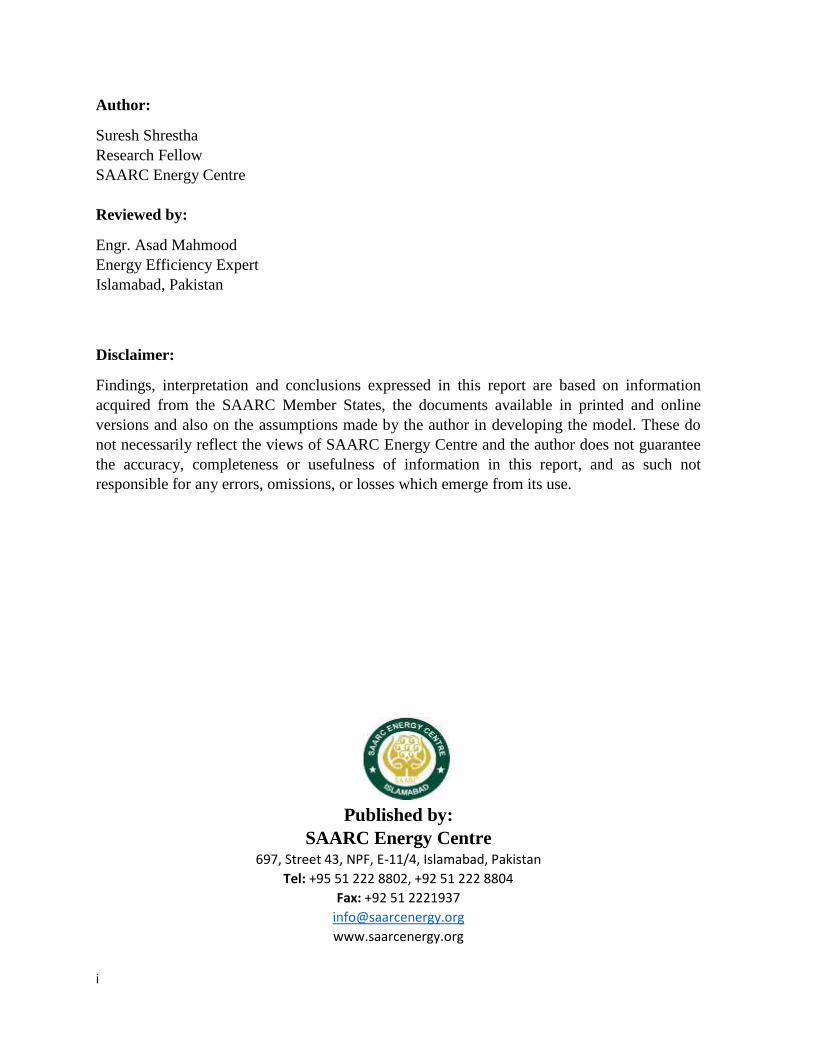
The population in the SAARC region is growing at an average annual rate of 1.5%, while the
GDP in the region is growing at a rate of 7.6% between the year 2001 and 2011.
Figure 14 Population and GDP growth in SAARC region19
Figure 15 The urban rural split in the SAARC countries (Source: Central Intelligence Agency)
19
SAARC Energy Data Book 2001-2011
0
1000
2000
3000
4000
5000
6000
2001 2002 2003 2004 2005 2006 2007 2008 2009 2010 2011
Population
GDP
GDP (PPP)
TPES
Net imports
Population in Millions GDP in Billion 2005 USD Energy Consumption in Million
0%
10%
20%
30%
40%
50%
60%
70%
80%
90%
100%
Afghnistan Bangladesh Bhutan India Maldives Nepal Pakistan Sri Lanka
Rural
Urban

23
The total final energy consumption in the SAARC region in the year 2010 was 570 Million
Tonnes of Oil Equivalent20
. The final liquid fuel consumption in the region in the year 2010
was 135 Million Tonnes of Oil Equivalent.
Figure 16 Final Energy Consumption in the SAARC Region by Countries21
Figure 17 Final Energy Consumption in the SAARC Region by country and by fuel types22
South Asian countries are highly dependent on imported oil and petroleum products. The
imports range from 25% of commercial energy consumption in the case of Bhutan to 100% in
20
SAARC Energy Data Book 2001-2011 21
SAARC Energy Data Book 2001-2011 22
SAARC Energy Data Book 2001-2011
Afghanistan
5% Bangladesh 7%
Bhutan 0%
India 49% Maldives
0%
Nepal 2%
Pakistan 31%
Sri Lanka 6%
0% 20% 40% 60% 80% 100%
Afghanistan
Bangladesh
Bhutan
India
Maldives
Nepal
Pakistan
Sri Lanka
Hard Coal Lignite and Peat
Briquetts and Cokes
Light Petroleum Products
Heavy Petroleum Products
LPG and Refinery Gas
Natural Gas
Derived Gases
Electricity
Biomass Energy

24
the case of Maldives. This pattern of energy consumption places an enormous burden on
foreign exchange reserves, to the detriment of national economies of the region. While
countries like Sri Lanka and Maldives, which lack indigenous fossil fuel sources, are
especially hard hit, even countries like India, Pakistan, and Bangladesh now meet less of their
demand with indigenous fuel sources and face increased dependence on energy imports.
Figure 18 Energy Consumption in the Road Transport Sector in the SAARC Region23
Figure 19 Fuel-wise Energy Consumption in the Road Transport Sector in the SAARC Region24
23
SAARC Energy Data Book 2001-2011 24
SAARC Energy Data Book 2001-2011
Afghanistan 5%
Bangladesh 7%
Bhutan 0%
India 49%
Maldives 0%
Nepal 2%
Pakistan 31%
Sri Lanka 6%
0% 20% 40% 60% 80% 100%
Afghanistan
Bangladesh
Bhutan
India
Maldives
Nepal
Pakistan
Sri Lanka Light PetroleumProducts
Heavy PetroleumProducts
LPG and Refinery Gas
Natural Gas

25
6 Scenario Analysis
Scenarios analyses are widely used to visualize possible energy futures. Scenarios are an
appropriate means to analyse a complex dynamic system with many interdependencies.
This study on improvement of energy efficiency in road transport sector is based on a scenario
analysis for the future development until the year 2040. The scenarios are analyzed for each
member state and then for the SAARC region as a whole.
6.1 BAU Scenario
This describes the regular development based on the knowledge of the past. The BAU
scenario can also be considered as an extrapolation of the historic development of the past
with inclusion of presently taken measures and policies. The BAU-Scenario is also called
baseline scenario.
The transport activity, i.e. the annual vehicle Passenger-km in case of passenger transport and
annual vehicle Ton-km in case of freight transport are directly linked with population. As
transport activities are correlated with the income level of the population and the overall GDP
of a country, the future transport demand was forecasted with the average annual growth of
income and GDP on the basis of elasticity that these variables have with transport demand.
Transport activities and the energy intensity of each technology were used to calculate the
energy consumption.
With the assumptions that the historic trend as seen at Annexure-B will continue to follow for
various segments, energy consumption for the future years from 2010 to 2040 with an interval
of five years is forecasted using LEAP model.
6.2 GASELEC Scenario
In this scenario a certain share of motor fuel is expected to be substituted by compressed
natural gas in the countries where natural gas is indigenously available and by electricity in all
the countries.
6.3 EFF-TECH Scenario
In this scenario, energy efficiency of vehicles is improved by phasing out old fleet of vehicles
and replacing with newer and more energy efficient vehicle fleet. This is a scenario where

26
vehicles would be offered regular maintenance and also the import of second hand vehicles
would be banned.
6.4 MASSTRANS Scenario
In mass transport scenario, part of travel activities of the small vehicles would gradually be
replaced by large buses and interventions shall be made for modal shift to non-road means of
transportation.
The assumptions were made for different scenarios for different countries as indicated in table
2 below.
Country GASELEC EFFTECH MASSTRANS
Afghanistan By 2040, 20% of small vehicle
passenger-km will be replaced
by electricity; 10% of bus
passenger-km by electricity
By 2040, energy
efficiency of all
conventional vehicle
technologies will
improve by 10%
25% of small vehicle
activities will be
replaced by larger
vehicles and non-
road means of
transportation.
Bangladesh By 2040, 20% of small vehicle
passenger-km will be replaced
by electricity; 20% of bus
passenger-km by 10%
electricity and 10% CNG.
By 2040, energy
efficiency of all
conventional vehicle
technologies will
improve by 10%
25% of small vehicle
activities will be
replaced by larger
vehicles and non-
road means of
transportation.
Bhutan By 2040, 20% of small vehicle
passenger-km will be replaced
by electricity; 10% of bus
passenger-km by electricity
By 2040, energy
efficiency of all
conventional vehicle
technologies will
improve by 10%
25% of small
bus/truck activities
will be replaced by
large buses and that
of small trucks by
large trucks
India By 2040, 20% of small vehicle
passenger-km will be replaced
electricity and CNG; 20% of
bus passenger km by 10%
By 2040, energy
efficiency of all
conventional vehicle
technologies will
25% of small vehicle
activities will be
replaced by large
buses and Non-road

27
Country GASELEC EFFTECH MASSTRANS
electricity and 10% CNG. improve by 10% means of
transportation
Maldives By 2040, 20% of small vehicle
passenger km will be replaced
by electricity and 10% of bus
passenger km by electricity
By 2040, energy
efficiency of all
conventional vehicle
technologies will
improve by 10%
25% of small
bus/truck activities
will be replaced by
large buses.
Nepal By 2040, 20% of small vehicle
passenger km will be replaced
by electricity and 10% of bus
passenger km by electricity
By 2040, energy
efficiency of all
conventional vehicle
technologies will
improve by 10%
25% of small vehicle
activities will be
replaced by large
buses and non-road
means of
transportation
Pakistan By 2040, 20% of small vehicle
passenger km will be replaced
by electricity and 10% of bus
passenger km by electricity
By 2040, energy
efficiency of all
conventional vehicle
technologies will
improve by 10%
25% of small vehicle
activities will be
replaced by large
buses and non-road
means of
transportation
Sri Lanka By 2040, 20% of small vehicle
passenger km will be replaced
by electricity and 10% of bus
passenger km by electricity
By 2040, energy
efficiency of all
conventional vehicle
technologies will
improve by 10%
25% of small vehicle
activities will be
replaced by large
buses and non-road
means of
transportation
Table 2 Comparative Analyses of Different Scenarios

28
7 Energy Demand in the Road Transport Sector in SAARC
Region
The forecasted energy demand for transport sector in each SAARC member country keeping
in view different scenarios is depicted in the graphs below and associated data sheets could be
seen at Annexure-C.
Figure 20 Road Transport Energy Demand: Afghanistan (KTOE)
Figure 21 Road Transport Energy Demand: Bangladesh (KTOE)
0
1000
2000
3000
4000
5000
6000
7000
2010 2015 2020 2025 2030 2035 2040
BAU
GASELEC
EFFTECH
MASSTRANS
Combined
0
1000
2000
3000
4000
5000
6000
7000
8000
2010 2015 2020 2025 2030 2035 2040
BAU
GASELEC
EFFTECH
MASSTRANS
Combined

29
Figure 22 Road Transport Energy Demand: Bhutan (KTOE)
Figure 23 Road Transport Energy Demand: India (MTOE)
0
200
400
600
800
1000
1200
1400
1600
2010 2015 2020 2025 2030 2035 2040
BAU
GASELEC
EFFTECH
MASSTRANS
Combined
0
100
200
300
400
500
600
2010 2015 2020 2025 2030 2035 2040
BAU
GASELEC
EFFTECH
MASSTRANS
Combined

30
Figure 24 Road Transport Energy Demand: Maldives (KTOE)
Figure 25 Road Transport Energy Demand: Nepal (KTOE)
0
20
40
60
80
100
120
140
2010 2015 2020 2025 2030 2035 2040
BAU
GASELEC
EFFTECH
MASSTRANS
Combined
0
500
1000
1500
2000
2500
3000
3500
2010 2015 2020 2025 2030 2035 2040
BAU
GASELEC
EFFTECH
MASSTRANS
Combined

31
Figure 26 Road Transport Energy Demand: Pakistan (KTOE)
Figure 27 Road Transport Energy Demand: Sri Lanka (KTOE)
0
5000
10000
15000
20000
25000
2010 2015 2020 2025 2030 2035 2040
BAU
GASELEC
EFFTECH
MASSTRANS
Combined
0
1000
2000
3000
4000
5000
6000
7000
2010 2015 2020 2025 2030 2035 2040
BAU
GASELEC
EFFTECH
MASSTRANS
Combined

32
Figure 28 Road Transport Energy Demand: SAARC Region (KTOE)
It is seen from the model that with the penetration of electric vehicles, energy can be saved in
the region by about 5%, while with more energy efficient technologies penetration and proper
maintenance of the vehicles, the energy can be saved by about 14%. By moving towards mass
transportation, as much as 16% energy can be saved. The graph curve obtained by combining
all the model shift scenarios as per assumptions shows a potential of about 35% of energy
saving in the region by the end of the model period.
0
100000
200000
300000
400000
500000
600000
700000
2010 2015 2020 2025 2030 2035 2040
BAU
GASSELEC
EFFTECH
MASSTRANS
Comibined

33
8 Approaches for Reducing Energy Demand in the Road
Transport Sector
There can be three-pronged approaches to reducing energy consumption in the road transport
sector—Avoid/Reduce, Shift and Improve policies.
Figure 29 Schematic Diagram of Efficient Transport Concepts
Shift
Policies
-Shift to mass
transport
- Increase share of
non-motorized
transport
- Transport Demand
Management
Reduce Energy Use
Improve Policies
- Reduce travel
activities
-No. of trips per
person
-Reduce length of
each trip
-Smart Logistics
Concepts
-Improvement in traffic
management
-Improve vehicle technology
(EE improvement, Electricity,
Biofuel)
-Improve fuel quality
-Eco driving
-Vehicle Maintenance
Reduce Growth of Motor
Vehicles
Reduce Energy Use per Km
of Vehicles traveled
Avoid Policies

34
As has been seen from the growth trend of vehicles in the region, one of the very important
policies would be to reduce the growth in the use of motor vehicles. This can be achieved by
Avoid and Shift policies.
―Avoid‖ policies aim to reduce the travel activities. Reduction in travel activities can be
brought about by either reducing the number of trips per person or by reducing the length of
each trip that a person makes. Through the integrated land use planning, the need to travel and
length of trip may be reduced.
A modal shift from motorized transport to non-motorized transport also helps in reducing
energy consumption. A shift to walking, cycling or mass transport leads to better environment
as energy consumption per Passenger-km will decrease considerably with modal shift policy.
The ―improve‖ policy focuses on vehicle and fuel efficiency. With improved technologies in
the conventional internal combustion engine, improvement in energy efficiency can be
brought about so that the mileage improves and energy consumption will be less with more
energy efficient technologies. Another important aspect of improvement is through fuel
efficiency. Proper traffic management, eco driving and proper vehicle maintenance also
results in improvement in energy efficiency.

35
9 Conclusions and Recommendations
The following conclusions and recommendations are deduced from of this study.
9.1 Conclusions
SAARC region is in a rapid developing trend. The growth in economy is bound to result in the
growth in the energy demand in the transport sector. The growth of urbanization level and of
the middle class segment will certainly lead to the increase in vehicle ownership. It is very
evident that the private vehicle ownership is increasing at an unprecedented rate in each
member country of SAARC. The rate of growth of the light vehicles including cars and motor
cycles is very fast. As all the SAARC countries are importers of petroleum products, each
country needs to follow Reduce-Shift-Improve policy to minimize the dependence on
imported petroleum products and to minimize environmental impacts.
Based on scenarios analyzed on LEAP model, up to 35 percent of energy demand reduction
potential exists in transport sector in the region. The energy demands for each SAARC
country in different scenarios at an interval of five years from the base year 2010 to the end
year 2040 are placed in Annexure C.
9.2 Recommendations
- A wide set of data is necessary to have accurate transport energy efficiency indicators in
SAARC member countries for developing realistic scenarios and minimizing assumptions
taken in the model. Vehicle stock is the key indicator; but more detailed the
characterization better would be the baseline for any model, and more effective policy
levers can be developed. The SAARC countries need to conduct transport survey
periodically and also energy consumption data in different modes of transport by vehicle
type and fuel type for future planning purpose.
- The SAARC countries should focus on developing more viable projects for increasing the
public transport capacity such as Bus Rapid Transport (BRT) under avoid/shift policies
which have numerous advantages.

36
- Effective land use planning should be the main component for urban planning in the
SAARC countries as mostly increase in urban density reduces per capita vehicle travel.
- The SAARC countries need to introduce or revise regulations for fuel efficiency
standards for light and heavy duty vehicles, speed limits, fuel taxation and strengthen the
motor vehicle examination systems. Many member countries do have the Motor Vehicle
Examination (MVE) system in place but the present system of inspection of vehicles and
issuance of fitness certificates is old and ineffective in many countries in ensuring vehicle
road worthiness and mostly covers the commercial vehicles. There is a need to revise the
MVE mechanism and introduce new completely automated and computerized system by
bringing the private vehicles in the ambit of MVE regulatory regime.
- A major problem which SAARC member countries could face in requiring personal
vehicles to obtain certificates of fitness is the setting up of the requisite number of
inspection and maintenance centers for carrying out the tests and certified examiners
availability. A detailed study of existing MVE system in member countries is required to
be undertaken.
- Monetary incentives could be considered by the SAARC countries as per their respective
policies to reduce annual vehicle taxation to be applied against fuel use or emissions, toll
plazas tax exemptions, tax exemption on purchase of electric vehicles and battery banks,
registration tax incentives for efficient vehicles and reduction in the MVE inspection fees
for each efficient vehicle category for various safety and emissions tests.
- Many SAARC countries do have the Energy Efficiency Legislation and in some countries
it is under promulgation but transport sector is not effectively being covered under the
existing provisions. Under the Energy Standards & Labeling schemes in member
countries, mostly the electrical appliances are being covered. However, there is a need to
develop tyre-labeling and car-labeling scheme based on fuel use or emissions.
- Removal of fuel subsidies will lead towards usage of more efficient vehicles as fuel
prices have strong influence on driving culture.

37
- Miscellaneous other measures/best practices could be adopted by SAARC countries
pertaining to model shift such as pedestrian friendly policies: safe sidewalks, well-marked
cross walks, car-free zones, traffic calming measures, better law enforcement, improving
road surface, identifying infrastructure requirement to make non-motorized transport
attractive such as biking lanes, bike parking, traffic signals & info-campaigns to make
cycling & walking attractive.
- With the influx of latest technologies/fuels like fuel cell (hydrogen) and electric hybrid
technology in transport sector, the SAARC countries should aim at taking capacity
building initiatives to enhance knowledge and skill of automobile mechanics and
electricians.
- The way a person drives a vehicle – whether a car or a truck – can have a major effect on
fuel economy. The SAARC countries can establish driving training centers for drivers of
all modes of transports offering short practical learning courses in respective
local/national languages and the same platform could be used for dissemination of eco-
driving tips to help drivers improve their driving style to save fuel.

38
References
1. World Development Indicators 2014, Washington, DC: World Bank. Doi:
10.1596/9781-4648-0163-1. License: Creative Commons Attribution CC BY 3.0 IGO
2. World Bank Group. 2015. Global Economic Prospects, June 2015. The Global
Economy in Transition. Washington, DC: World Bank. Doi: 10.1596/978-1-4648-
0483-0. License: Creative Commons Attribution CC BY 3.0 IGO
3. BP Energy Outlook 2030
South Africa, March 2012
4. 2015 World Population Data Sheet
Population Reference Bureau, Washington, DC 20009 USA
5. Subhes C Bhattacharya and Gobinda R Timilsina, 2009, Energy Demand Models for
Policy Formulation, The World Bank, Development Research Group, Environment
and Energy Team
6. Susan Bohlar-Baedekar, Hana Huging, 2012, Sustainable Transport and Energy
Efficiency, Federal Ministry of Economic Cooperation and Development (BMZ),
Germany
7. J. Pongthanaisawan, C. Soraipipatana and B. Limmeechokchai, 2007, Road Transport
Energy Demand Analysis and Energy Saving Potentials in Thailand, Joint Graduate
School of Energy and Environment, Thailand
8. Sustainable Transport Initiative, 2010, Asian Development Bank, Manila Philippines
9. SAARC Energy Data Book 2001-2010, SAARC Energy Centre, Islamabad, Pakistan
10. SAARC Energy Data Book 2001-2011, SAARC Energy Centre, Islamabad, Pakistan
11. International Energy Agency, 2010, Transport Energy Efficiency, IEA, Paris, France

39
Annexure-A
Afghanistan Number (Thousand) Fuel
Share by Fuel
Average Annual Usage
Vehicle Km
Occupancy
Passenger Km
Average Fuel Economy
Energy Intensity Fuel Use
Fuel Use
Fuel Use
Km Million Persons Billion Vehicle Km/Litre Litres/Pass-Km
Million Litres
Million GJ
KTOE
Tons Vehicle Km/Kwh Litres/Ton-Km Million Kwh
Kwh/Pass-Km
Passenger 20108.16 80.85 1350.59 Car 649.76 16244.00 40.61
584.78 Gasoline
90% 25000 14619.60 2.5 36.55 11 0.04 1329.05 44.83 1070.69 64.98 Diesel 10% 25000 1624.40 2.5 4.06 12 0.03 135.37 4.88 0.12
CNG
Bus 71.58 2093.74 37.04
Large 10.74
10.74 Diesel 100% 25000 268.43 40 10.74 4 0.01 67.11 2.42 57.78
CNG
Medium
17.90
17.90 Diesel 100% 30000 536.86 25 13.42 6 0.01 89.48 3.23 77.04
CNG
Small 42.95
42.95 Diesel 100% 30000 1288.46 10 12.88 8 0.01 161.06 5.81 138.67
CNG
Motorcycle 134.60 1615.15 2.42
134.60 Gasoline
100% 12000 1615.15 1.5 2.42 35 0.02 46.15 1.56 0.04
Electricity
Three Wheelers
10.35 155.27 0.78
CNG
10.35 Gasoline
100% 15000 155.27 5 0.78 20 0.01 7.76 0.26 6.25
Electricity
0.00
LPG
Freight 4243.43 18.88 487.15
Truck 169.74 4243.43 18.88
Large 8.49
8.49 Diesel 100% 25000 212.17 10 2.12 4 0.03 53.04 1.91 45.67
Medium
8.49
8.49 Diesel 100% 25000 212.17 7 1.49 6 0.02 35.36 1.27 30.45
Small 152.76
152.76 Diesel 100% 25000 3819.08 4 15.28 8 0.03 477.39 17.21 411.03

40
Bangladesh Number (Thousand) Fuel
Share by Fuel
Average Annual Usage
Vehicle Km
Occupancy
Passenger Km
Average Fuel Economy
Energy Intensity Fuel Use
Fuel Use
Fuel Use
Km Million Persons Billion Vehicle Km/Litre Litres/Pass-Km
Million Litres
Million GJ
KTOE Tons Vehicle Km/Kwh Litres/Ton-
Km Million Kwh
Kwh/Pass-
Km
Passenger 20692.99
98.91 1084.37 Car 306.98 7444.19 20.91 1084.37 76.74 Gasoline 25% 25000 1918.61 2.5 4.80 12 0.03 159.88 5.39 128.8
0 46.05 Diesel 15% 20000 920.93 2.5 2.30 14 0.03 65.78 2.37 56.64 184.19 CNG 60% 25000 4604.66 3 13.81 18 0.02 255.81 4.85 115.9
3 Bus 119.80 2130.50 48.98 Large 27.78 27.78 Diesel 100% 20000 555.56 40 22.22 5 0.01 111.11 4.01 95.67 CNG Medium
um 25.64
25.64 Diesel 100% 20000 512.88 25 12.82 7 0.01 73.27 2.64 63.08 CNG Small 66.38 53.10 Diesel 80% 20000 1062.06 10 10.62 8 0.01 132.76 4.79 114.3
1 13.28 CNG 20% 25000 331.90 10 3.32 10 0.01 33.19 1.12 26.74 Motorcycle 759.26 7592.57 11.39 759.26 Gasoline 100% 10000 7592.57 1.5 11.39 35 0.02 216.93 7.32 174.7
6 Electricity Three Wheelers
141.03 3525.73 17.63 42.31 CNG 30% 25000 1057.72 5 5.29 8 0.03 132.21 2.51 59.92 98.72 Gasoline 70% 25000 2468.01 5 12.34 8 0.03 308.50 10.41 248.5
3 LPG
Freight 3788.80 27.09 681.6
1 Truck 166.31 3788.80 27.09 Large 85.58 85.58 Diesel 100% 23000 1968.27 10 19.68 3.5 0.03 562.36 20.27 484.2
0 Medium 1.65 1.65 Diesel 100% 25000 41.17 7 0.29 6 0.02 6.86 0.25 5.91 Small 79.08 79.08 Diesel 100% 22500 1779.37 4 7.12 8 0.03 222.42 8.02 191.5
1

41
Bhutan Number (Thousand) Fuel
Share by Fuel
Average Annual Usage
Vehicle Km
Occupancy
Passenger Km
Average Fuel Economy
Energy Intensity Fuel Use
Fuel Use
Fuel Use
Km Million Persons Billion Vehicle Km/Litre Litres/Pass-Km
Million Litres
Million GJ
KTOE Tons Vehicle Km/Kwh Litres/Ton-
Km Million Kwh
Kwh/Pass-
Km
Passenger 829.8125
7.60 86.51 Car 3.60 125.1 0.25 3.42 Gasoline 95% 35000 119.7 2 0.24 11 0.05 10.88 0.37 8.77 0.18 Diesel 5% 30000 5.4 2 0.01 12 0.04 0.45 0.02 0.36 Bus 19.37 484.212
5 7.02
Large 3.28 3.28 Diesel 100% 25000 82.1 35 2.87 3.5 0.01 23.46 0.85 20.20 CNG Medium
um 0.50
0.50 Diesel 100% 25000 12.5875 20 0.25 5 0.01 2.52 0.09 2.17 CNG Small 15.58 15.58 Diesel 100% 25000 389.525 10 3.90 7 0.01 55.65 2.01 47.91 CNG Motorcycle 8.82 220.5 0.33 8.82 Gasoline 100% 25000 220.5 1.5 0.33 25 0.03 8.82 0.30 7.11 Electricity
yity
Three Wheelers
CNG Gasoline LPG 0.00 0.00
Freight 539.8625
2.88 93.10 Truck 21.59 539.862
5 2.88
Large 4.54 4.54 Diesel 100% 25000 113.6 10 1.14 2.5 0.04 45.44 1.64 39.12 Medium 0.50 0.50 Diesel 100% 25000 12.5875 7 0.09 3.5 0.04 3.60 0.13 3.10 Small 16.55 16.55 Diesel 100% 25000 413.675 4 1.65 7 0.04 59.10 2.13 50.88

42
India Number (Thousand) Fuel
Share by Fuel
Average Annual Usage
Vehicle Km
Occupancy
Passenger Km
Average Fuel Economy
Energy Intensity Fuel Use
Fuel Use
Fuel Use
Million Persons Billion Vehicle Km/Litre Litres/Pass-km
Million Litres
Million GJ
KTOE Tons Vehicle Km/Kwh Litres/Ton-
km Million Kwh
Kwh/Pass-
km
1458890.10
3221.82 55371.15 Cars 22740.00 566226.
00 1415.57
454.80 Gasoline 2% 20000 9096.00 2.5 22.74 12 0.03 758.00 25.57 610.64 13644.00 Diesel 60% 25000 341100.
00 2.5 852.75 13 0.03 26238.46 945.85 22591
.32 8641.20 CNG 38% 25000 216030.00
2.5 540.08 14 0.03 15430.71 292.78 6992.89
Bus 176.64 8832.10 253.92 Large 88.32 88.32 Diesel 100% 50000 4416.05 40 176.64 3.5 0.01 1261.73 45.48 1086.
35 CNG Medium
um 44.16
44.16 Diesel 100% 50000 2208.03 25 55.20 5 0.01 441.61 15.92 380.23 CNG
Small 44.16 44.16 Diesel 100% 50000 2208.03 10 22.08 8 0.01 276.00 9.95 237.6
4 CNG Motorcycle 91597.00 732776.
00 1099.16
91597.00 Gasoline 100% 8000 732776.00
1.5 1099.16 35 0.02 20936.46 706.16 16866.41 Electricity
yyyy
Three Wheelers
7552.80 151056.00
453.17 6797.52 CNG 90% 20000 135950.
40 3 407.85 15 0.02 9063.36 227.49 5433.
48 755.28 Gasoline 10% 20000 15105.60
3 45.32 12 0.03 1258.80 49.08 1172.19 LPG
Freight Transport
321596.30
2395.89 81486.55 Truck 6431.93 321596.
30 2395.89
Large 2894.37 2894.37 Diesel 100% 50000 144718.
34 10 1447.18 2.5 0.04 57887.33 2086.7
4 49841
.48 Medium 1607.98 1607.98 Diesel 100% 50000 80399.0
8 7 562.79 3.5 0.04 22971.16 828.07 19778
.17 Small 1929.58 1929.58 Diesel 100% 50000 96478.8
9 4 385.92 7 0.04 13782.70 496.84 11866
.90
43
Nepal Number (Thousand) Fuel
Share by Fuel
Average Annual Usage
Vehicle Km
Occupancy
Passenger Km
Average Fuel Economy
Energy Intensity Fuel Use
Fuel Use
Fuel Use
Km Million Billion Vehicle Km/Litre Litres/Pass-Km
Million Litres
Million GJ
KTOE Vehicle Km/Kwh Litres/Ton-
Km Million Kwh
Kwh/Pass-
Km
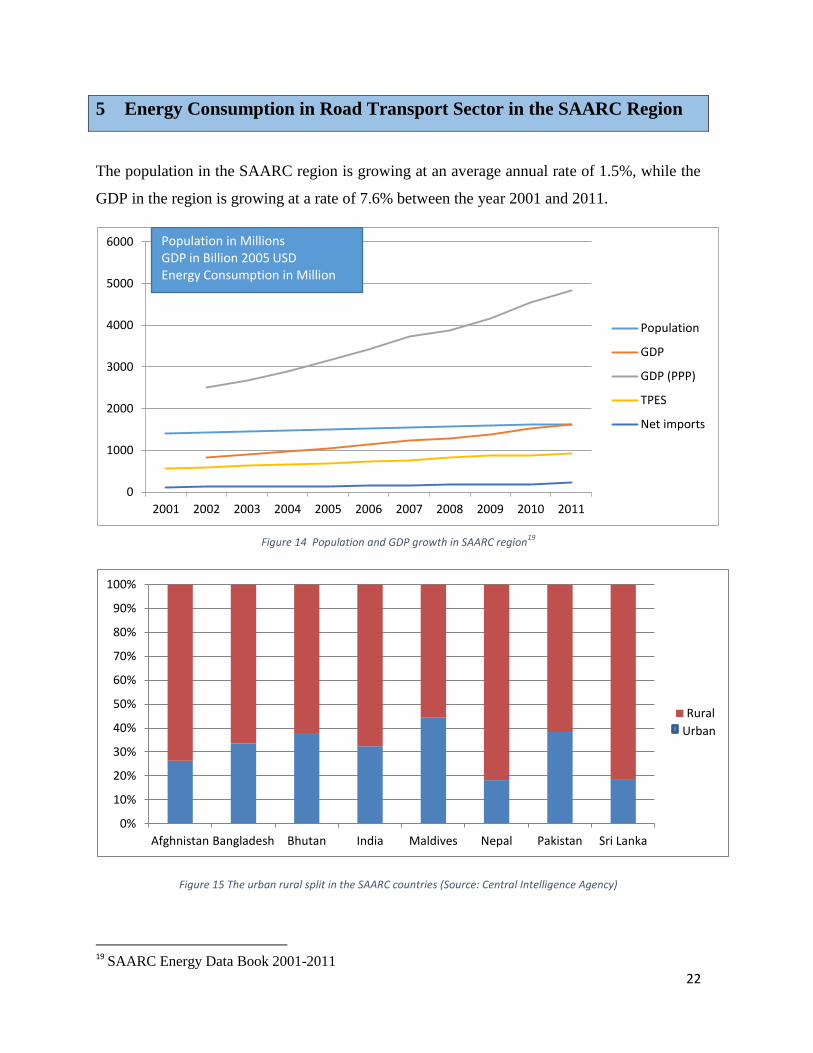
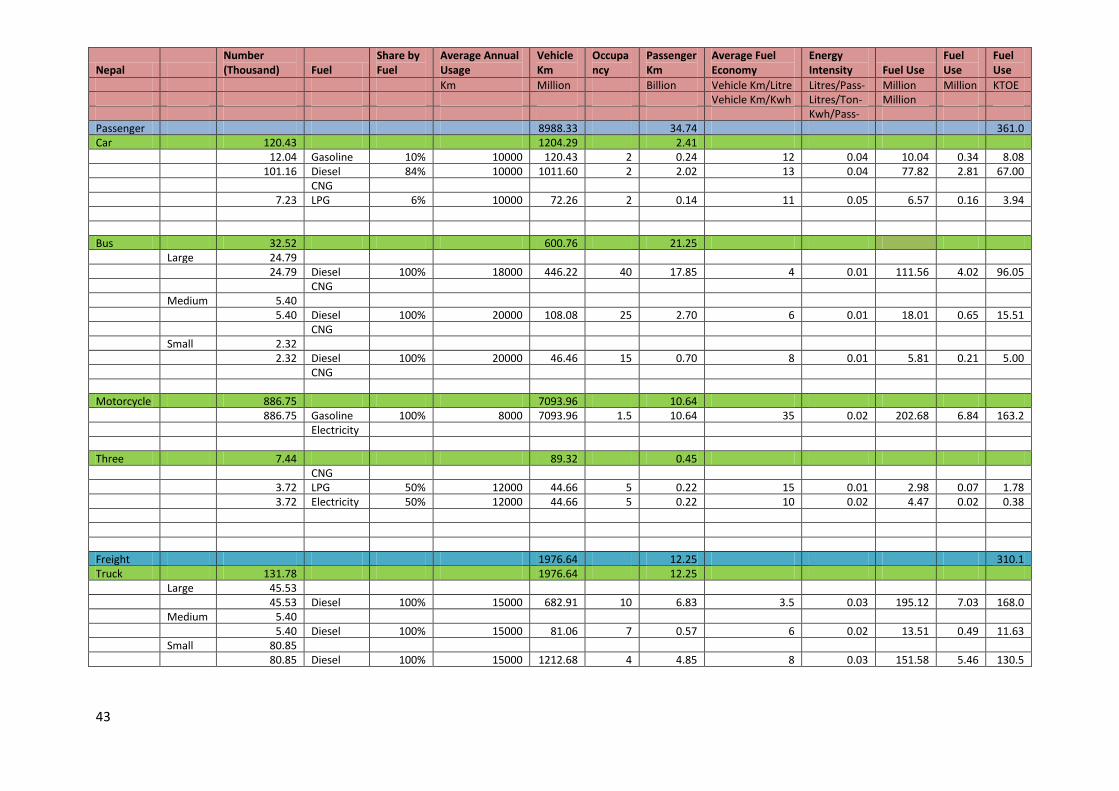
Passenger 8988.33 34.74 361.03 Car 120.43 1204.29 2.41
12.04 Gasoline 10% 10000 120.43 2 0.24 12 0.04 10.04 0.34 8.08 101.16 Diesel 84% 10000 1011.60 2 2.02 13 0.04 77.82 2.81 67.00 CNG 7.23 LPG 6% 10000 72.26 2 0.14 11 0.05 6.57 0.16 3.94 Bus 32.52 600.76 21.25 Large 24.79 24.79 Diesel 100% 18000 446.22 40 17.85 4 0.01 111.56 4.02 96.05 CNG Medium
um 5.40
5.40 Diesel 100% 20000 108.08 25 2.70 6 0.01 18.01 0.65 15.51 CNG Small 2.32 2.32 Diesel 100% 20000 46.46 15 0.70 8 0.01 5.81 0.21 5.00 CNG Motorcycle 886.75 7093.96 10.64 886.75 Gasoline 100% 8000 7093.96 1.5 10.64 35 0.02 202.68 6.84 163.2
8 Electricityyyyy
Three Wheelers
7.44 89.32 0.45 CNG 3.72 LPG 50% 12000 44.66 5 0.22 15 0.01 2.98 0.07 1.78 3.72 Electricity 50% 12000 44.66 5 0.22 10 0.02 4.47 0.02 0.38 Freight 1976.64 12.25 310.1
4 Truck 131.78 1976.64 12.25 Large 45.53 45.53 Diesel 100% 15000 682.91 10 6.83 3.5 0.03 195.12 7.03 168.0
0 Medium 5.40 5.40 Diesel 100% 15000 81.06 7 0.57 6 0.02 13.51 0.49 11.63 Small 80.85 80.85 Diesel 100% 15000 1212.68 4 4.85 8 0.03 151.58 5.46 130.5
2

44
Maldives Number (Thousand) Fuel
Share by Fuel
Average Annual Usage
Vehicle Km
Occupancy
Passenger Km
Average Fuel Economy
Energy Intensity Fuel Use
Fuel Use
Fuel Use
Km Million Persons Billion Vehicle Km/Litre Litres/Pass-Km
Million Litres
Million GJ
KTOE Tons Vehicle Km/Kwh Litres/Ton-
Km Million Kwh
Kwh/Pass-
Km
Passenger 873.15 1.39 32.22 Car 3.74 93.48 0.19 3.37 Gasoline 90% 25000 84.13 2 0.17 11 0.05 7.65 0.26 6.16 0.37 Diesel 10% 25000 9.35 2 0.02 12 0.04 0.78 0.03 0.67 CNG Bus 0.10 2.48 0.04 Large 0.01 0.01 Diesel 100% 25000 0.25 30 0.01 3.5 0.01 0.07 0.00 0.06 0.10 CNG Medium
um 0.02
0.02 Diesel 100% 25000 0.62 20 0.01 5 0.01 0.12 0.00 0.11 0.25 CNG Small 0.06 0.06 Diesel 100% 25000 1.61 10 0.02 8 0.01 0.20 0.01 0.17 0.65 CNG Motorcycle 38.86 777.20 1.17 38.86 Gasoline 100% 20000 777.20 1.5 1.17 25 0.03 31.09 1.05 25.04 Electricity
yyyy
Three Wheelers
CNG LPG Electricity Freight 130.48 0.82 18.32 Truck 5.22 130.48 0.82 Large 1.30 0.25 1.30 Diesel 100% 25000 32.62 10 0.33 5 0.02 6.52 0.24 5.62 Medium 1.30 1.30 Diesel 100% 25000 32.62 7 0.23 6 0.02 5.44 0.20 4.68 Small 2.61 2.61 Diesel 100% 25000 65.24 4 0.26 7 0.04 9.32 0.34 8.02

45
Pakistan Number (Thousand) Fuel
Share by Fuel
Average Annual Usage
Vehicle Km
Occupancy
Passenger Km
Average Fuel Economy
Energy Intensity Fuel Use
Fuel Use
Fuel Use
Km Million Persons Billion Vehicle Km/Litre Litres/Pass-Km
Million Litres
Million GJ
KTOE Tons Vehicle Km/Kwh Litres/Ton-
Km Million Kwh
Kwh/Pass-
Km
Passenger 188904.0872
533.66 6086.35 Car 3055.27 117016.9
176 351.05
305.53 Gasoline 10% 35000 10693.45 3 32.08 12 0.03 891.12 30.06 717.89 305.53 Diesel 10% 28000 8554.76 3 25.66 14 0.02 611.05 22.03 526.12 2444.22 CNG 80% 40000 97768.70 3 293.31 16 0.02 6110.54 115.94 2769.
20 LPG Electricity
yity
Bus 125.58 3566.59 77.26 Large 25.12 s 25.12 Diesel 100% 30000 753.50 40 30.14 4 0.01 188.38 6.79 162.1
9 CNG 0.00 Medium
um 25.12 0.00
25.12 Diesel 100% 28000 703.27 25 17.58 7 0.01 100.47 3.62 86.50 CNG 0.00 Small 75.35 0.00 75.35 Diesel 100% 28000 2109.81 14 29.54 8 0.01 263.73 9.51 227.0
7 CNG Motorcycle 5468.85 65626.22 91.88 5468.85 Gasoline 100% 12000 65626.22 1.4 91.88 35 0.02 1875.03 63.24 1510.
54 Electricity Three Wheelers
89.81 2694.36 13.47 CNG 89.81 Gasoline 100% 30000 2694.36 5 13.47 25 0.01 107.77 3.64 86.82 Electricity Freight 32450.88 232.02 5014.
32 Truck 1298.04 32450.88 232.02 Large 519.21 519.21 Diesel 100% 25000 12980.35 10 129.80 4 0.03 3245.09 116.98 2794.
05 Medium 324.51 324.51 Diesel 100% 25000 8112.72 7 56.79 7 0.02 1158.96 41.78 997.8
7 Small 454.31 454.31 Diesel 100% 25000 11357.81 4 45.43 8 0.03 1419.73 51.18 1222.
40
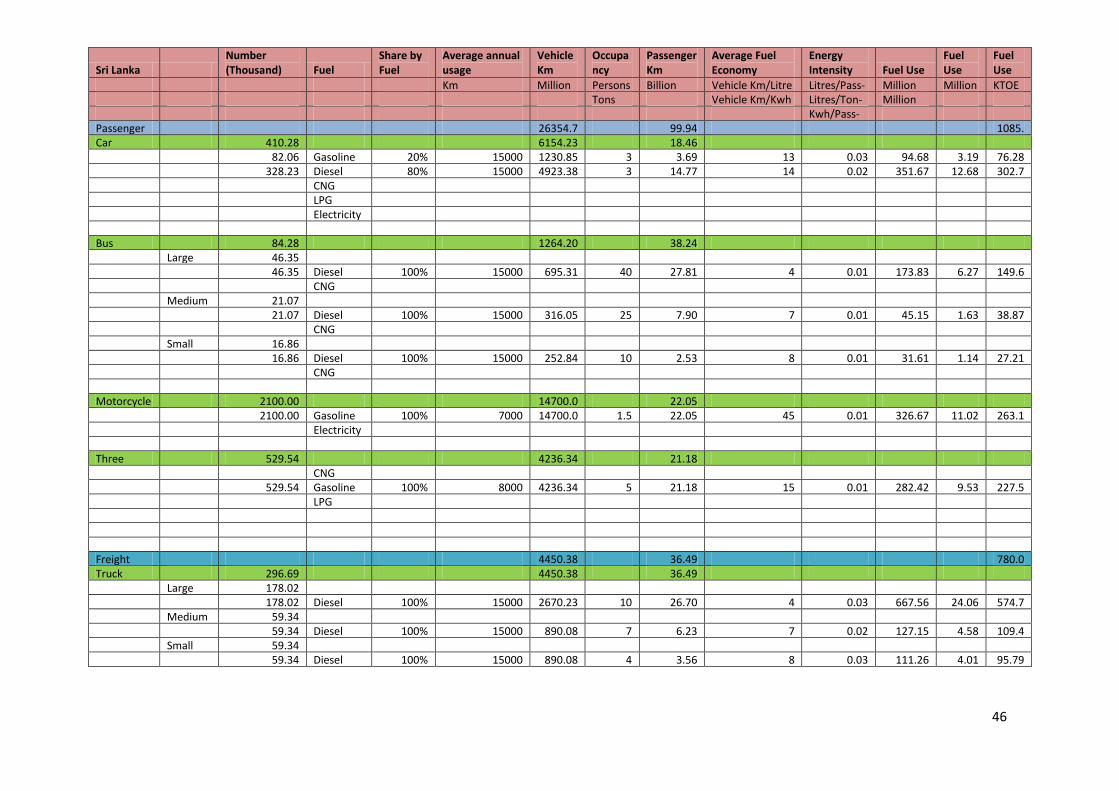
46
Sri Lanka Number (Thousand) Fuel
Share by Fuel
Average annual usage
Vehicle Km
Occupancy
Passenger Km
Average Fuel Economy
Energy Intensity Fuel Use
Fuel Use
Fuel Use
Km Million Persons Billion Vehicle Km/Litre Litres/Pass-Km
Million Litres
Million GJ
KTOE Tons Vehicle Km/Kwh Litres/Ton-
Km Million Kwh
Kwh/Pass-
Km
Passenger 26354.77
99.94 1085.50 Car 410.28 6154.23 18.46
82.06 Gasoline 20% 15000 1230.85 3 3.69 13 0.03 94.68 3.19 76.28 328.23 Diesel 80% 15000 4923.38 3 14.77 14 0.02 351.67 12.68 302.7
9 CNG LPG Electricity
yyyy
Bus 84.28 1264.20 38.24 Large 46.35 46.35 Diesel 100% 15000 695.31 40 27.81 4 0.01 173.83 6.27 149.6
7 CNG Medium
m 21.07
21.07 Diesel 100% 15000 316.05 25 7.90 7 0.01 45.15 1.63 38.87 CNG Small 16.86 16.86 Diesel 100% 15000 252.84 10 2.53 8 0.01 31.61 1.14 27.21 CNG Motorcycle 2100.00 14700.0
0 22.05
2100.00 Gasoline 100% 7000 14700.00
1.5 22.05 45 0.01 326.67 11.02 263.17 Electricity
Three Wheelers
529.54 4236.34 21.18 CNG 529.54 Gasoline 100% 8000 4236.34 5 21.18 15 0.01 282.42 9.53 227.5
2 LPG Freight 4450.38 36.49 780.0
4 Truck 296.69 4450.38 36.49 Large 178.02 178.02 Diesel 100% 15000 2670.23 10 26.70 4 0.03 667.56 24.06 574.7
7 Mediummm
59.34 59.34 Diesel 100% 15000 890.08 7 6.23 7 0.02 127.15 4.58 109.4
8 Small 59.34 59.34 Diesel 100% 15000 890.08 4 3.56 8 0.03 111.26 4.01 95.79

47
Annexure-B
Countries Years
(2001-2010) Population
(Million)
No. of Passenger Vehicles
Transport Demand
Passenger (Pass-Km)
No. of Freight vehicles
Transport Demand Freight
(Ton-Km)
AFGHANISTAN
2001 21.30
2002 22.20
2003 23.10
2004 24.00
2005 24.90
2006 25.60
2007 26.30
2008 27.00 348614 66970037000 135446 15068367500
2009 27.70 793167 73611820000 156469 17407176250
2010 28.40 866288.00 80852220500 169737 18883241250
Average Annual Growth Rate 3.25% 57.64% 9.88% 11.95% 11.95%
BANGLADESH
2001 134.70
2002 137.00
2003 139.20
2004 141.20
2005 143.10
2006 144.90
2007 146.50
2008 148.00

48
Countries Years
(2001-2010) Population
(Million)
No. of Passenger Vehicles
Transport Demand
Passenger (Pass-Km)
No. of Freight vehicles
Transport Demand Freight
(Ton-Km)
2009 149.50 1163462.00 90840905625 138078 23823227900
2010 151.10 1327064.00 98914278125 164660 26024513000
Average Annual Growth Rate 1.28% 14.06% 8.89% 19.25% 9.24%
BHUTAN
2001 0.60 15381.50 1549141125 7145 474814625
2002 0.60 17108.00 1674486125 7322 485546250
2003 0.60 17813.00 1936479875 8683 585653500
2004 0.60 18162.00 1998536875 10067 677935000
2005 0.70 18602.50 2188142000 9869 686472500
2006 0.70 20901.00 2488264500 11680 798064875
2007 0.70 22082.00 2755311625 13622 906569125
2008 0.70 25008.50 3237792000 16269 1082960375
2009 0.70 27450.50 3606709250 18368 1218634500
2010 0.70 31787.50 4193128000 21594 1426209875
Average Annual Growth Rate 1.73% 8.40% 11.70% 13.08% 13.00%
INDIA
2001 1060 51707810 972708573 7216527 19261159225000
2002 1077 58953605 994350134 8053679 21960217862500
2003 1094 64308066 1055608745 8409869 23954754585000
2004 1111 72135801 1122435207 9365918 26870585872500
2005 1127 79524637 1210090228 9093630 29622927282500
2006 1143 85573812 1303992693 11133448 31876244970000
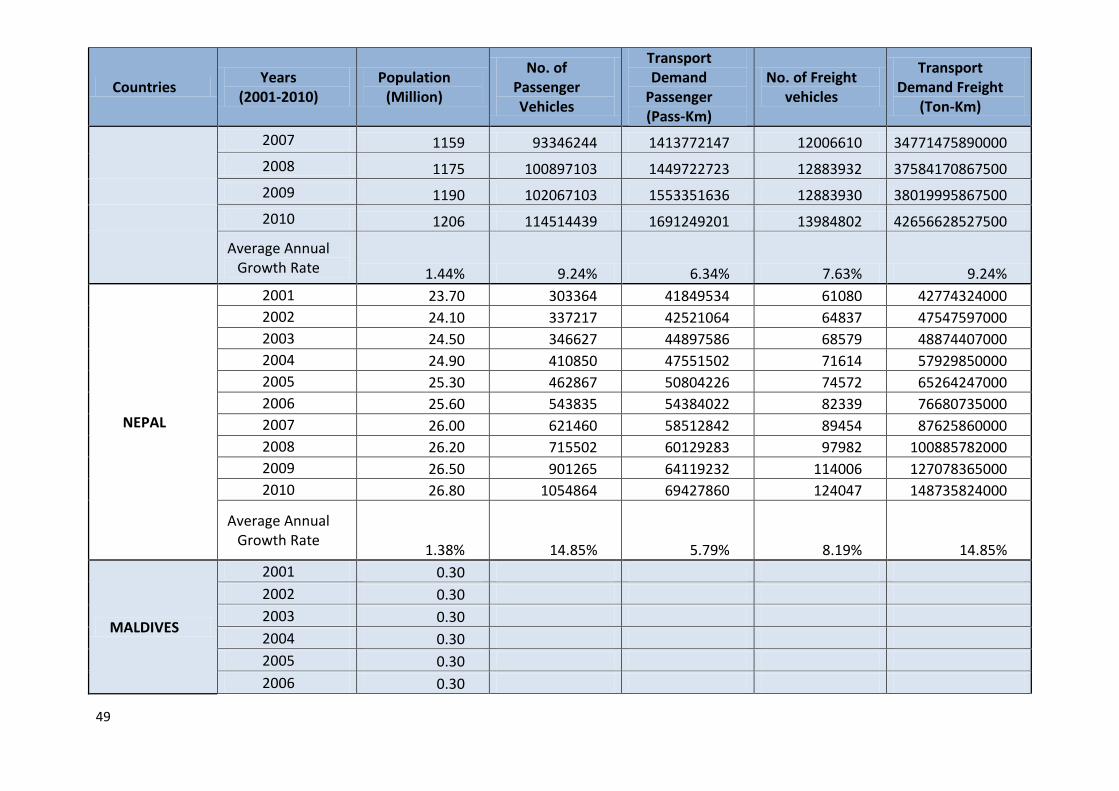
49
Countries Years
(2001-2010) Population
(Million)
No. of Passenger Vehicles
Transport Demand
Passenger (Pass-Km)
No. of Freight vehicles
Transport Demand Freight
(Ton-Km)
2007 1159 93346244 1413772147 12006610 34771475890000
2008 1175 100897103 1449722723 12883932 37584170867500
2009 1190 102067103 1553351636 12883930 38019995867500
2010 1206 114514439 1691249201 13984802 42656628527500
Average Annual Growth Rate 1.44% 9.24% 6.34% 7.63% 9.24%
NEPAL
2001 23.70 303364 41849534 61080 42774324000
2002 24.10 337217 42521064 64837 47547597000
2003 24.50 346627 44897586 68579 48874407000
2004 24.90 410850 47551502 71614 57929850000
2005 25.30 462867 50804226 74572 65264247000
2006 25.60 543835 54384022 82339 76680735000
2007 26.00 621460 58512842 89454 87625860000
2008 26.20 715502 60129283 97982 100885782000
2009 26.50 901265 64119232 114006 127078365000
2010 26.80 1054864 69427860 124047 148735824000
Average Annual Growth Rate
1.38% 14.85% 5.79% 8.19% 14.85%
MALDIVES
2001 0.30
2002 0.30
2003 0.30
2004 0.30
2005 0.30
2006 0.30

50
Countries Years
(2001-2010) Population
(Million)
No. of Passenger Vehicles
Transport Demand
Passenger (Pass-Km)
No. of Freight vehicles
Transport Demand Freight
(Ton-Km)
2007 0.30
2008 0.30
2009 0.30 42698 1388637500 5122 800312500
2010 0.30 46509 1517590000 5219 815468750
Average Annual Growth Rate
0.00 8.93% 9.29% 1.89% 1.89%
PAKISTAN
2001 146.90
2002 149.70 3986614 310460983900 983513 175802948750
2003 152.40 4052744 319697969400 1011902 180877482500
2004 155.20 4302544 326343056500 1028415 183829181250
2005 158.00 4330062 325522202500 1044367 186680601250
2006 160.90 4547389 344585302000 1085964 194116065000
2007 163.90 4767515 360982125000 1140298 203828267500
2008 167.00 5037535 379824616900 1164220 208104325000
2009 170.10 5342979 401993284700 1216385 217428818750
2010 173.10 6554967 437372102900 1298035 232023756250
Average Annual Growth Rate
1.84% 6.41% 4.38% 3.53% 3.53%
SRILANKA
2001 18.80
2002 18.90
2003 19.20 1670159 60037952000 585212 23107593750
2004 19.40 1903037 64899354000 618516 24351817500
2005 19.60 2095757 69592812000 661292 26009775000

51
Countries Years
(2001-2010) Population
(Million)
No. of Passenger Vehicles
Transport Demand
Passenger (Pass-Km)
No. of Freight vehicles
Transport Demand Freight
(Ton-Km)
2006 19.90 2408656 76512545000 719768 28385460000
2007 20.00 2658272 82315829000 765414 30525390000
2008 20.20 2851802 87169450000 804390 32157307500
2009 20.50 2988201 90666685500 810942 33113463750
2010 20.70 3440959 98364946000 872595 34490445000
Average Annual Growth Rate 1.08% 10.88% 7.31% 5.87% `5.89%
GNI Per Capita (Current USD)
Countries
Year
2001 2002 2003 2004 2005 2006 2007 2008 2009 2010
Afghanistan 220 250 280 340 370 470 520
Bangladesh 430 420 450 490 540 560 590 650 710 780
Bhutan 820 860 950 1070 1220 1340 1630 1750 1830 1990
India 460 470 530 620 730 810 950 1030 1150 1260
Maldives 3500 4100 3770 4530 4570 5430 5460 5960
Nepal 240 240 260 290 310 340 380 440 490 540
Pakistan 500 520 560 640 740 820 910 1020 1060 1080
Sri Lanka 830 860 950 1070 1220 1350 1540 17770 1970 2360
Source: World Bank
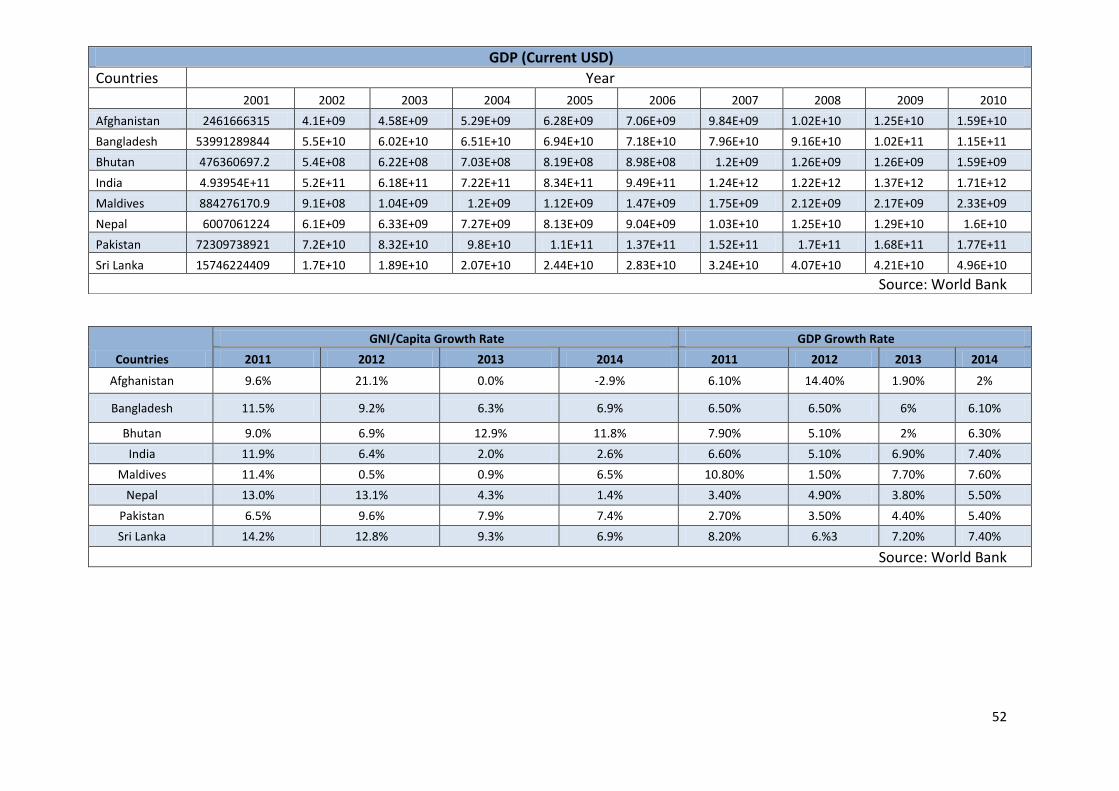
52
Countries
GNI/Capita Growth Rate GDP Growth Rate
2011 2012 2013 2014 2011 2012 2013 2014
Afghanistan 9.6% 21.1% 0.0% -2.9% 6.10% 14.40% 1.90% 2%
Bangladesh 11.5% 9.2% 6.3% 6.9% 6.50% 6.50% 6% 6.10%
Bhutan 9.0% 6.9% 12.9% 11.8% 7.90% 5.10% 2% 6.30%
India 11.9% 6.4% 2.0% 2.6% 6.60% 5.10% 6.90% 7.40%
Maldives 11.4% 0.5% 0.9% 6.5% 10.80% 1.50% 7.70% 7.60%
Nepal 13.0% 13.1% 4.3% 1.4% 3.40% 4.90% 3.80% 5.50%
Pakistan 6.5% 9.6% 7.9% 7.4% 2.70% 3.50% 4.40% 5.40%
Sri Lanka 14.2% 12.8% 9.3% 6.9% 8.20% 6.%3 7.20% 7.40%
Source: World Bank
GDP (Current USD)
Countries Year
2001 2002 2003 2004 2005 2006 2007 2008 2009 2010
Afghanistan 2461666315 4.1E+09 4.58E+09 5.29E+09 6.28E+09 7.06E+09 9.84E+09 1.02E+10 1.25E+10 1.59E+10
Bangladesh 53991289844 5.5E+10 6.02E+10 6.51E+10 6.94E+10 7.18E+10 7.96E+10 9.16E+10 1.02E+11 1.15E+11
Bhutan 476360697.2 5.4E+08 6.22E+08 7.03E+08 8.19E+08 8.98E+08 1.2E+09 1.26E+09 1.26E+09 1.59E+09
India 4.93954E+11 5.2E+11 6.18E+11 7.22E+11 8.34E+11 9.49E+11 1.24E+12 1.22E+12 1.37E+12 1.71E+12
Maldives 884276170.9 9.1E+08 1.04E+09 1.2E+09 1.12E+09 1.47E+09 1.75E+09 2.12E+09 2.17E+09 2.33E+09
Nepal 6007061224 6.1E+09 6.33E+09 7.27E+09 8.13E+09 9.04E+09 1.03E+10 1.25E+10 1.29E+10 1.6E+10
Pakistan 72309738921 7.2E+10 8.32E+10 9.8E+10 1.1E+11 1.37E+11 1.52E+11 1.7E+11 1.68E+11 1.77E+11
Sri Lanka 15746224409 1.7E+10 1.89E+10 2.07E+10 2.44E+10 2.83E+10 3.24E+10 4.07E+10 4.21E+10 4.96E+10
Source: World Bank
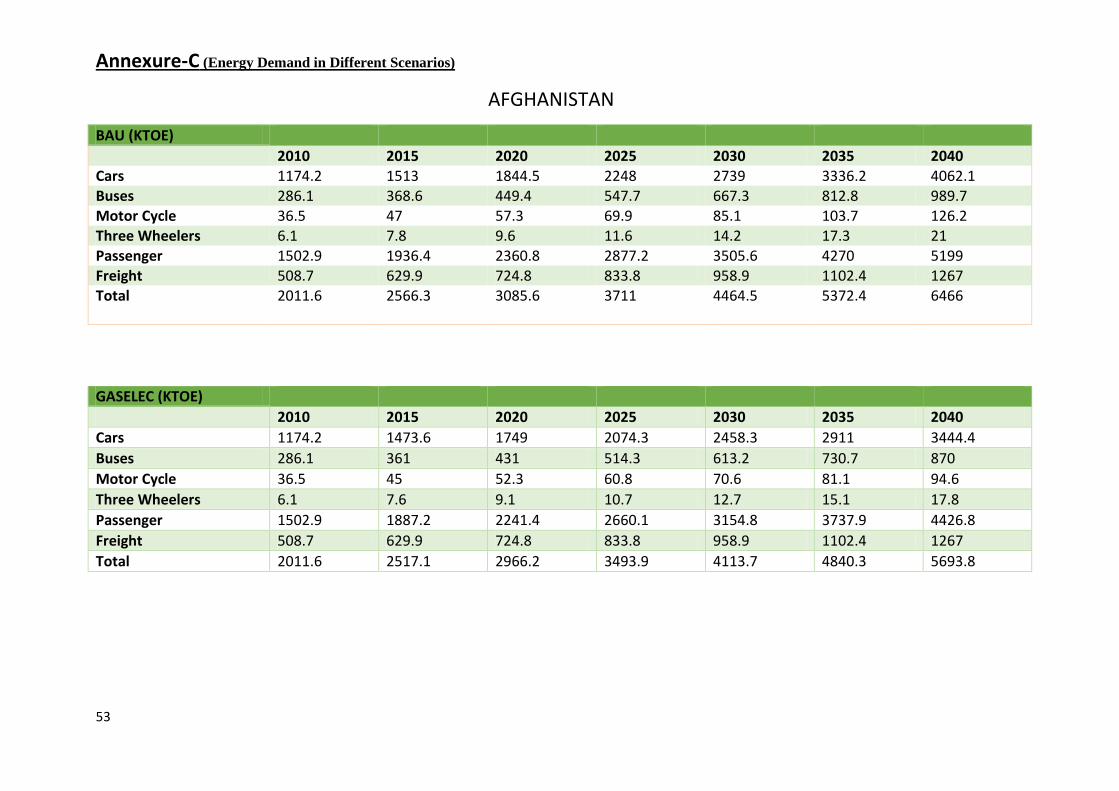
53
Annexure-C (Energy Demand in Different Scenarios)
AFGHANISTAN
BAU (KTOE)
2010 2015 2020 2025 2030 2035 2040 Cars 1174.2 1513 1844.5 2248 2739 3336.2 4062.1 Buses 286.1 368.6 449.4 547.7 667.3 812.8 989.7 Motor Cycle 36.5 47 57.3 69.9 85.1 103.7 126.2 Three Wheelers 6.1 7.8 9.6 11.6 14.2 17.3 21
Passenger 1502.9 1936.4 2360.8 2877.2 3505.6 4270 5199 Freight 508.7 629.9 724.8 833.8 958.9 1102.4 1267 Total 2011.6 2566.3 3085.6 3711 4464.5 5372.4 6466
GASELEC (KTOE)
2010 2015 2020 2025 2030 2035 2040
Cars 1174.2 1473.6 1749 2074.3 2458.3 2911 3444.4
Buses 286.1 361 431 514.3 613.2 730.7 870
Motor Cycle 36.5 45 52.3 60.8 70.6 81.1 94.6
Three Wheelers 6.1 7.6 9.1 10.7 12.7 15.1 17.8
Passenger 1502.9 1887.2 2241.4 2660.1 3154.8 3737.9 4426.8
Freight 508.7 629.9 724.8 833.8 958.9 1102.4 1267
Total 2011.6 2517.1 2966.2 3493.9 4113.7 4840.3 5693.8

54
MASSTRANS (KTOE)
2010 2015 2020 2025 2030 2035 2040
Cars 1174.2 1449.9 1690.8 1967 2282.5 2641.1 3046.6
Buses 286.1 366.7 444.6 539 653.2 791.3 958.3
Motor Cycle 36.5 45.1 52.5 61.1 70.9 82.1 94.7
Three Wheelers 6.1 7.5 8.8 10.2 11.8 13.7 15.8
Passenger 1502.9 1869.2 2196.7 2577.3 3018.4 3528.2 4115.4
Freight 509.7 609.9 679.1 755.3 839.2 931.3 1032.3
Total 2011.6 2479.1 2875.8 3332.6 3857.6 4459.5 5147.7
(KTOE)
2010 2015 2020 2025 2030 2035 2040
BAU 2011.6 2566.3 3085.6 3711 4464.5 5372.4 6466
GASELEC 2011.6 2517.1 2966.2 3493.9 4113.7 4840.3 5693.8
EFFTECH 2011.6 2522.8 2979.1 3515.7 4145.8 4884 5747.6
MASSTRANS 2011.6 2479.1 2875.8 3332.6 3857.6 4459.5 5147.7
Combined 2011.6 2386.4 2649.9 2920.2 3188.1 3439 3657.1
EFFTECH (KTOE)
2010 2015 2020 2025 2030 2035 2040
Cars 1174.2 1487.3 1780.9 2129.7 2543.4 3032.9 3610.8
Buses 286.1 362.4 433.9 518.9 619.7 738.9 879.7
Motor Cycle 36.5 46.2 55.3 66.2 79.1 94.3 112.2
Three Wheelers 6.1 7.7 9.2 11 13.2 15.7 18.7
Passenger 1502.9 1903.6 2279.3 2725.8 3255.4 3881.8 4621.4
Freight 508.7 619.2 699.8 789.9 890.4 1002.2 1126.2
Total 2011.6 2522.8 2979.1 3515.7 4145.8 4884 5747.6

55
BANGLADESH
BAU (KTOE)
2010 2015 2020 2025 2030 2035 2040
Cars 219.3 310.9 376.8 455.7 550 662.1 795.1
Buses 291.5 423.7 527.3 656 815.8 1014.2 1260.5
Motor Cycle 171.3 249 309.8 385.4 479.4 596 740.7
Three Wheelers 261.8 381 474.6 591.2 736.1 916.4 1140.5
Passenger 943.9 1364.6 1688.5 2088.3 2581.3 3188.7 3936.8
Freight 713.5 919.8 1178.9 1509.4 1930.4 2466 3146.2
Total 1657.4 2284.4 2867.4 3597.7 4511.7 5654.7 7083
GASELEC (KTOE)
2010 2015 2020 2025 2030 2035 2040
Cars 219.3 310.8 377 457.2 554.3 671.9 814.2
Buses 291.5 419.9 517.9 638.7 787.8 971.6 1198.4
Motor Cycle 171.3 244.1 297.6 362.5 441.2 536.6 652
Three Wheelers 261.8 390.6 498.2 634.7 807.4 1025.7 1301.2
Passenger 943.9 1365.4 1690.7 2093.1 2590.7 3205.8 3965.8
Freight 713.5 919.8 1178.9 1509.4 1930.4 2466 3146.2
Total 1657.4 2285.2 2869.6 3602.5 4521.1 5671.8 7112

56
EFFTECH (KTOE)
2010 2015 2020 2025 2030 2035 2040
Cars 219.3 307.3 367.6 438.4 520.7 615.8 724.7
Buses 291.5 416.5 509.1 621.4 757.5 922 1120.5
Motor Cycle 171.3 244.8 299.2 365.2 445.1 541.8 658.4
Three Wheelers 261.8 375 459.4 562.2 687.3 839.1 1023
Passenger 943.9 1343.6 1635.3 1987.2 2410.6 2918.7 3526.6
Freight 713.5 916.8 1170.9 1493.4 1902.3 2419.5 3072.4
Total 1657.4 2260.4 2806.2 3480.6 4312.9 5338.2 6599
BHUTAN
MASSTRANS (KTOE)
2010 2015 2020 2025 2030 2035 2040
Cars 219.3 293 333.5 377.2 423.6 471.9 521
Buses 291.5 415.4 506.6 617.4 751.9 914.9 1112.4
Motor Cycle 171.3 267.1 355 469.8 619.2 813.4 1064.9
Three Wheelers 261.8 374.1 457.5 559.2 683 833.7 1017
Passenger 943.9 1349.6 1652.6 2023.6 2477.7 3033.9 3715.3
Freight 713.5 919.8 1178.9 1509.4 1930.5 2466 3146.2
Total 1657.4 2269.4 2831.5 3533 4408.2 5499.9 6861.5
(KTOE)
2010 2015 2020 2025 2030 2035 2040
BAU 1657.4 2284.4 2867.4 3597.7 4511.7 5654.7 7083
GASELEC 1657.4 2285.2 2869.6 3602.5 4521.1 5671.8 7112
EFFTECH 1657.4 2260.4 2806.2 3480.6 4312.9 5338.2 6599
MASSTRANS 1657.4 2269.4 2831.5 3533 4408.2 5499.9 6861.5
Combined 1657.4 2244.6 2768.1 3411.1 4200 5166.3 6348.5

57
BAU(KTOE)
2010 2015 2020 2025 2030 2035 2040
Cars 9 15.6 20.7 27.4 36.4 48.3 64
Buses 73.5 126.9 168.5 223.6 296.7 393.5 521.7
Motor Cycle 7 12.1 16 21.3 28.3 37.5 49.7
Three Wheelers
Passenger 89.5 154.6 205.2 272.3 361.4 479.3 635.4
Freight 97.4 132.9 187.6 264.8 373.6 527 743
Total 186.9 287.5 392.8 537.1 735 1006.3 1378.4
GASELEC (KTOE)
2010 2015 2020 2025 2030 2035 2040
Cars 9 15.1 19.5 25.2 32.4 41.7 53.7
Buses 73.5 123.9 160.7 208.2 269.8 349.4 452.4
Motor Cycle 7 11.9 15.6 25.2 32.4 41.7 53.7
Three Wheelers
Passenger 89.5 150.9 195.8 258.6 334.6 432.8 559.8
Freight 97.4 132.9 187.6 264.8 373.6 527 743
Total 186.9 283.8 383.4 523.4 708.2 959.8 1302.8

58
EFFTECH (KTOE)
2010 2015 2020 2025 2030 2035 2040
Cars 9 15.3 20 26 33.8 43.9 56.9
Buses 73.5 124.7 162.7 211.8 275.5 357.7 463.7
Motor Cycle 7 11.9 15.5 20.2 26.2 34.1 44.2
Three Wheelers
Passenger 89.5 151.9 198.2 258 335.5 435.7 564.8
Freight 97.4 130.6 181.1 250.8 346.9 479.1 660.5
Total 186.9 282.5 379.3 508.8 682.4 914.8 1225.3
MASSTRANS (KTOE)
2010 2015 2020 2025 2030 2035 2040
Cars 9 15.6 20.7 27.4 36.4 48.3 64
Buses 73.5 125.3 164.2 215.1 281.7 368.7 482.2
Motor Cycle 7 12.1 16 21.3 28.3 37.5 49.7
Three Wheelers
Passenger 89.5 153 200.9 263.8 346.4 454.5 595.9
Freight 97.4 133.2 188.6 267 377.7 534.2 755.3
Total 186.9 286.2 389.5 530.8 724.1 988.7 1351.2
(KTOE) 2010 2015 2020 2025 2030 2035 2040
BAU 186.9 287.5 392.8 537.1 735 1006.3 1378.4
GASELEC 186.9 283.8 383.4 523.4 708.2 959.8 1302.8
EFFTECH 186.9 282.5 379.3 508.8 682.4 914.8 1225.3
MASSTRANS 186.9 286.2 389.5 530.8 724.1 988.7 1351.2
Combined 186.9 277.5 366.6 488.8 644.7 850.7 1122.5
INDIA

59
BAU (MTOE)
2010 2015 2020 2025 2030 2035 2040
Cars 26.3 31.8 37.3 43.6 51 59.6 69.6
Buses 1.8 2.2 2.5 3 3.5 4 4.7
Motor Cycle 16.6 20.1 23.5 27.5 32.2 37.6 43.9
Three Wheelers 2.2 2.7 3.1 3.6 4.2 5 5.8
Passenger 46.9 56.8 66.4 77.7 90.9 106.2 124
Freight 85.2 109.5 142.3 185 240.4 312.3 405.6
Total 132.1 166.3 208.7 262.7 331.3 418.5 529.6
GASELEC (MTOE)
2010 2015 2020 2025 2030 2035 2040
Cars 26.3 30.3 33.7 37.4 41.3 45.6 50.1
Buses 1.8 2.1 2.5 2.9 3.3 3.9 4.5
Motor Cycle 16.6 19.8 22.7 26.1 30 34.5 39.6
Three Wheelers 2.2 2.5 2.7 2.9 3.1 3.3 3.4
Passenger 46.9 54.7 61.6 69.3 77.7 87.3 97.6
Freight 85.2 109.5 142.3 185 240.4 312.3 405.6
Total 132.1 164.2 203.9 254.3 318.1 399.6 503.2

60
EFFTECH (MTOE)
2010 2015 2020 2025 2030 2035 2040
Cars 26.3 31.3 36.1 41.5 47.6 54.6 62.5
Buses 1.8 2.1 2.4 2.8 3.2 3.7 4.2
Motor Cycle 16.6 19.8 22.7 26.1 29.9 34.2 39.1
Three Wheelers 2.2 2.6 3.1 3.5 4.1 4.8 5.5
Passenger 46.9 55.8 64.3 73.9 84.8 97.3 111.3
Freight 85.2 106.7 135.2 171.1 216.4 273.3 344.7
Total 132.1 162.5 199.5 245 301.2 370.6 456
MASSTRANS (MTOE)
2010 2015 2020 2025 2030 2035 2040
Cars 26.3 30.5 34.2 38.1 42.5 47.2 52.2
Buses 1.8 2.5 3.4 4.5 5.8 7.5 9.5
Motor Cycle 16.6 19.3 21.6 24.1 26.8 29.8 33
Three Wheelers 2.2 2.5 2.8 3.2 3.5 3.9 4.4
Passenger 46.9 54.8 62 69.9 78.6 88.4 99.1
Freight 85.2 106.7 135.2 171.1 216.4 273.3 344.7
Total 132.1 161.5 197.2 241 295 361.7 443.8
(MTOE) 2010 2015 2020 2025 2030 2035 2040
BAU 132.1 166.3 208.7 262.7 331.3 418.5 529.6
GASELEC 132.1 164.2 203.9 254.3 318.1 399.6 503.2
EFFTECH 132.1 162.5 199.5 245 301.2 370.6 456
MASSTRANS 132.1 161.5 197.2 241 295 361.7 443.8
Combined 132.1 155.6 183.2 214.9 251.7 294.9 343.8

61
MALDIVES
BAU (KTOE) 2010 2015 2020 2025 2030 2035 2040
Cars 6.7 8.3 9.9 11.8 14.1 16.8 20
Buses 0.4 0.4 0.5 0.6 0.7 0.9 1.1
Motor Cycle 24.5 30.2 36 42.9 51.2 61 72.7
Three Wheelers
Passenger 31.6 38.9 46.4 55.3 66 78.7 93.8
Freight 22.6 24.2 26 28 30.1 32.4 34.9
Total 54.2 63.1 72.4 83.3 96.1 111.1 128.7
GASELEC (KTOE)
2010 2015 2020 2025 2030 2035 2040
Cars 6.7 8 9.3 10.8 12.5 14.5 16.7
Buses 0.4 0.4 0.5 0.6 0.7 0.8 1
Motor Cycle 24.5 29.3 33.9 39.2 45.3 52.2 60.2
Three Wheelers
Passenger 31.6 37.7 43.7 50.6 58.5 67.5 77.9
Freight 22.6 24.2 26 28 30.1 32.4 34.9
Total 54.2 61.9 69.7 78.6 88.6 99.9 112.8

62
EFFTECH (KTOE)
2010 2015 2020 2025 2030 2035 2040
Cars 6.7 8.1 9.5 11.2 13 15.2 17.7
Buses 0.4 0.4 0.5 0.6 0.7 0.8 0.9
Motor Cycle 24.5 29.6 34.7 40.7 47.5 55.5 64.7
Three Wheelers
Passenger 31.6 38.1 44.7 52.5 61.2 71.5 83.3
Freight 22.6 23.8 25.1 26.5 28 29.5 31
Total 54.2 61.9 69.8 79 89.2 101 114.3
MASSTRANS (KTOE)
2010 2015 2020 2025 2030 2035 2040
Cars 6.7 7.9 9.1 10.3 11.7 13.3 15
Buses 0.4 1.1 2.2 3.5 5.4 7.8 11
Motor Cycle 24.5 28.9 33 37.6 42.7 48.3 54.6
Three Wheelers
Passenger 31.6 37.9 44.3 51.4 59.8 69.4 80.6
Freight 22.6 23.9 25.4 27 28.7 30.5 32.4
Total 54.2 61.8 69.7 78.4 88.5 99.9 113
(KTOE) 2010 2015 2020 2025 2030 2035 2040
BAU 54.2 63.1 72.4 83.3 96.1 111.1 128.7
GASELEC 54.2 61.9 69.7 78.6 88.6 99.9 112.8
EFFTECH 54.2 61.9 69.8 79 89.2 101 114.3
MASSTRANS 54.2 61.8 69.7 78.4 88.5 99.9 113
Combined 54.2 59.4 64.4 69.4 74.1 78.6 82.7

63
NEPAL
BAU (KTOE) 2010 2015 2020 2025 2030 2035 2040
Cars 78.6 101.8 120.4 142.5 168.5 199.1 235.3
Buses 121.9 157.9 186.9 221.1 261.4 309.1 365.3
Motor Cycle 160 207.3 245.3 290.2 343.1 405.6 479.3
Three Wheelers 2.2 2.8 3.4 4 4.8 5.6 6.7
Passenger 362.7 469.8 556 657.8 777.8 919.4 1086.6
Freight 323.9 430 596 825.8 1143.8 1583.8 2192.4
Total 686.6 899.8 1152 1483.6 1921.6 2503.2 3279
GASELEC (KTOE)
2010 2015 2020 2025 2030 2035 2040
Cars 78.6 99.4 114.8 132.6 153 176.3 203.1
Buses 121.9 156.6 183.7 215.6 252.9 296.8 348.2
Motor Cycle 160 201.6 231.8 266.3 305.7 350.6 401.6
Three Wheelers 2.2 2.9 3.4 4 4.8 5.7 6.7
Passenger 362.7 460.5 533.7 618.5 716.4 829.4 959.6
Freight 323.9 430 596 825.8 1143.8 1583.8 2192.4
Total 686.6 890.5 1129.7 1444.3 1860.2 2413.2 3152

64
EFFTECH (KTOE)
2010 2015 2020 2025 2030 2035 2040
Cars 78.6 100 116.2 134.9 156.4 181 209.2
Buses 121.9 155.3 180.5 209.5 242.9 281.2 325.1
Motor Cycle 160 203.8 236.9 274.9 318.6 368.7 426
Three Wheelers 2.2 2.8 3.3 3.8 4.5 5.2 6.1
Passenger 362.7 461.9 536.9 623.1 722.4 836.1 966.4
Freight 323.9 422.7 575.4 782.3 1062.1 1439.9 1948.8
Total 686.6 884.6 1112.3 1405.4 1784.5 2276 2915.2
MASSTRANS (KTOE)
2010 2015 2020 2025 2030 2035 2040
Cars 78.6 97.6 110.4 124.7 140.4 157.6 176.5
Buses 121.9 157.8 186.5 220.5 260.6 307.8 363.5
Motor Cycle 160 198.7 224.8 253.9 285.9 321.1 359.2
Three Wheelers 2.2 2.8 3.1 3.5 4 4.5 5
Passenger 362.7 456.9 524.8 602.6 690.9 791 904.2
Freight 323.9 419.3 566.2 763.8 1029.4 1385.9 1863.6
Total 686.6 876.2 1091 1366.4 1720.3 2176.9 2767.8
(KTOE) 2010 2015 2020 2025 2030 2035 2040
BAU 686.6 899.8 1152 1483.6 1921.6 2503.2 3279
GASELEC 686.6 890.5 1129.7 1444.3 1860.2 2413.2 3152
EFFTECH 686.6 884.6 1112.3 1405.4 1784.5 2276 2915.2
MASSTRANS 686.6 876.2 1091 1366.4 1720.3 2176.9 2767.8
Combined 686.6 851.7 1029 1248.9 1521.8 1859.7 2277

65
PAKISTAN
BAU (KTOE) 2010 2015 2020 2025 2030 2035 2040
Cars 2058.1 2251.4 2445.5 2655.7 2883 3128.7 3394.2
Buses 497.1 544.1 591.1 642 697 756.5 820.9
Motor Cycle 1484.1 1264 1764.3 1916.2 2080.5 2258.2 2450.2
Three Wheelers 85.4 93.2 101.3 110 119.4 129.6 140.6
Passenger 4124.7 4152.7 4902.2 5323.9 5779.9 6273 6805.9
Freight 5400 6200 7300 8400 9800 11400 13300
Total 9524.7 10352.7 12202.2 13723.9 15579.9 17673 20105.9
GASELEC (KTOE)
2010 2015 2020 2025 2030 2035 2040
Cars 2058.1 2278.6 2507.7 2761.9 3044.4 3358.3 3707.5
Buses 497.2 543.7 590.7 641.5 696.5 756.0 820.3
Motor Cycle 1484.1 1624.0 1764.3 1916.2 2080.5 2258.2 2450.2
Three Wheelers 85.4 90.5 94.9 99.4 103.9 108.4 112.9
Passenger 4124.8 4536.8 4957.6 5419.0 5925.3 6480.9 7090.9
Freight 5400.0 6200.0 7300.0 8400.0 9800.0 11400.0 13300.0
Total 9524.8 10736.8 12257.6 13819.0 15725.3 17880.9 20390.9

66
EFFTECH (KTOE)
2010 2015 2020 2025 2030 2035 2040
Cars 2058.1 2228.1 2394.2 2570.5 2757.5 2955.3 3164.3
Buses 497.2 534.9 570.7 608.2 647.2 687.8 729.7
Motor Cycle 1484.1 1596.5 1703.5 1815.3 1931.9 2052.9 2177.9
Three Wheelers 85.4 91.6 97.8 104.2 110.9 117.8 125
Passenger 4124.8 4451.1 4766.2 5098.2 5447.5 5813.8 6196.9
Freight 5400 6100 7000 8000 9100 10400 11800
Total 9524.8 10551.1 11766.2 13098.2 14547.5 16213.8 17996.9
MASSTRANS (KTOE)
2010 2015 2020 2025 2030 2035 2040
Cars 2058.1 2157.6 2241.7 2323.7 2402.5 2476.9 2545.6
Buses 497.2 583.9 677.7 783.2 901.5 1034 1182.1
Motor Cycle 1484.1 1556 1617 1676.4 1733.6 1787.6 1837.6
Three Wheelers 85.4 89.6 93.1 96.5 99.8 103 105.9
Passenger 4124.8 4387.1 4629.5 4879.8 5137.4 5401.5 5671.2
Freight 5400 6100 6900 7800 8800 10000 11300
Toal 9524.8 10487.1 11529.5 12679.8 13937.4 15401.5 16971.2
(KTOE) 2010 2015 2020 2025 2030 2035 2040
BAU 9524.7 10352.7 12202.2 13723.9 15579.9 17673 20105.9
GASELEC 9524.7 10336.6 12257.6 13819.0 15725.3 17880.9 20390.9
EFFTECH 9524.7 10225.2 11766.2 13098.2 14547.5 16213.8 17996.9
MASSTRANS 9524.8 10487.1 11529.5 12679.8 13937.4 15401.5 16971.2
Combined 9524.7 10343 11038 11959 12760 13734 14577

67
SRILANKA
BAU (KTOE)
2010 2015 2020 2025 2030 2035 2040
Cars 391.3 561.6 669.8 798.6 951.8 1134.1 1350.8
Buses 225.6 323.8 386.2 460.4 548.8 653.9 778.8
Motor Cycle 258.4 390.9 442.3 527.4 628.6 749 892.1
Three Wheelers 223.1 320.3 381.9 455.4 542.8 646.7 770.3
Passenger 1098.4 1596.6 1880.2 2241.8 2672 3183.7 3792
Freight 815.5 973.3 1163.4 1390.2 1660.8 1983.4 2367.9
Total 1913.9 2569.9 3043.6 3632 4332.8 5167.1 6159.9
GASELEC (KTOE)
2010 2015 2020 2025 2030 2035 2040
Cars 391.3 548.3 638 742.1 862.8 1002.6 1164.5
Buses 225.6 321.1 379.8 449.2 531.3 628.4 743.1
Motor Cycle 258.4 361.2 419.5 486.8 564.4 654 757.2
Three Wheelers 223.1 312.2 362.9 421.6 489.4 567.7 658.2
Passenger 1098.4 1542.8 1800.2 2099.7 2447.9 2852.7 3323
Freight 815.5 973.3 1163.4 1390.2 1660.8 1983.4 2367.9
Total 1913.9 2516.1 2963.6 3489.9 4108.7 4836.1 5690.9

68
EFFTECH (KTOE)
2010 2015 2020 2025 2030 2035 2040
Cars 391.3 552.1 646.7 756.5 883.8 1031 1200.7
Buses 225.6 318.3 372.9 436.2 509.6 594.4 692.3
Motor Cycle 258.4 364.6 427.1 499.6 583.7 680.9 793
Three Wheelers 223.1 314.6 368.8 431.4 504 587.9 684.7
Passenger 1098.4 1549.6 1815.5 2123.7 2481.1 2894.2 3370.7
Freight 815.5 956.8 1123.3 1317.1 1542.2 1803.1 2104.8
Total 1913.9 2506.4 2938.8 3440.8 4023.3 4697.3 5475.5
MASSTRANS (KTOE)
2010 2015 2020 2025 2030 2035 2040
Cars 391.3 538.2 614 698.7 793.2 897.8 1013.1
Buses 225.6 381.5 404.4 493.1 600.7 731.2 889.4
Motor Cycle 258.4 355.4 405.5 461.5 523.8 592.9 669.1
Three Wheelers 223.1 306.9 350.1 398.5 452.3 512 577.7
Passenger 1098.4 1582 1774 2051.8 2370 2733.9 3149.3
Freight 815.5 973.3 1163.4 1390.2 1660.8 1983.4 2167.9
Total 1913.9 2555.3 2937.4 3442 4030.8 4717.3 5317.2
(KTOE) 2010 2015 2020 2025 2030 2035 2040
BAU 1913.9 2569.9 3043.6 3632 4332.8 5167.1 6159.9
GASELEC 1913.9 2516.1 2963.6 3489.9 4108.7 4836.1 5690.9
EFFTECH 1913.9 2506.4 2938.8 3440.8 4023.3 4697.3 5475.5
MASSTRANS 1913.9 2555.3 2937.4 3442 4030.8 4717.3 5317.2
Combined 1913.9 2438 2752.6 3108.7 3497.2 3916.5 4163.8

Published by:
SAARC Energy Centre
697, Street 43, NPF, E-11/4, Islamabad, Pakistan
Tel: +95 51 222 8802, +92 51 222 8804
Fax: +92 51 2221937
www.saarcenergy.org