
Energy Efficiency in Industrial Areas: Examples, Chances ... · Energy Efficiency in Industrial...
25
www.renewables-made-in-germany.com Energy Efficiency in Industrial Areas: Examples, Chances and Challenges Dr.-Ing. Alexander Schlüter
Transcript of Energy Efficiency in Industrial Areas: Examples, Chances ... · Energy Efficiency in Industrial...

www.renewables-made-in-germany.com
Energy Efficiency in Industrial Areas: Examples,
Chances and Challenges
Dr.-Ing. Alexander Schlüter

Introduction
0
250
500
750
1000
1250
1500
1750
2000
0
1000
2000
3000
4000
5000
6000
7000
8000
Prim
ary
en
erg
y/
MW
h/a
Gre
enhouse
gas
em
issio
ns
/t
CO
2e
/a
Present state Step a Step b Step c Step d Step e
Source: Schlüter et al. (2011)

Introduction
General information about energy efficiency measures
Single measures
Holistic approach
Conclusion
Content of the presentation

Energy efficiency fields
Increasingenergy efficiency
HouseholdsIndustry,
manufacturing trade
Services, energy supply
Transport, mobility
• Monitoring
• Development of controls
• Systems, machines and plants
• Organisation
• Sectoral addressing and implementation
• Monitoring (smart metering)
• Basic structure of buildings (financing programmes)
• Heat supply
• Pattern of use
• Intelligent decentralised hybrid structures
• Minimise conversion losses
• Usage of waste heat
• Minimise transport losses
• Lightweight construction
• Drive concepts
Source: Hesselbach (2012), p.3
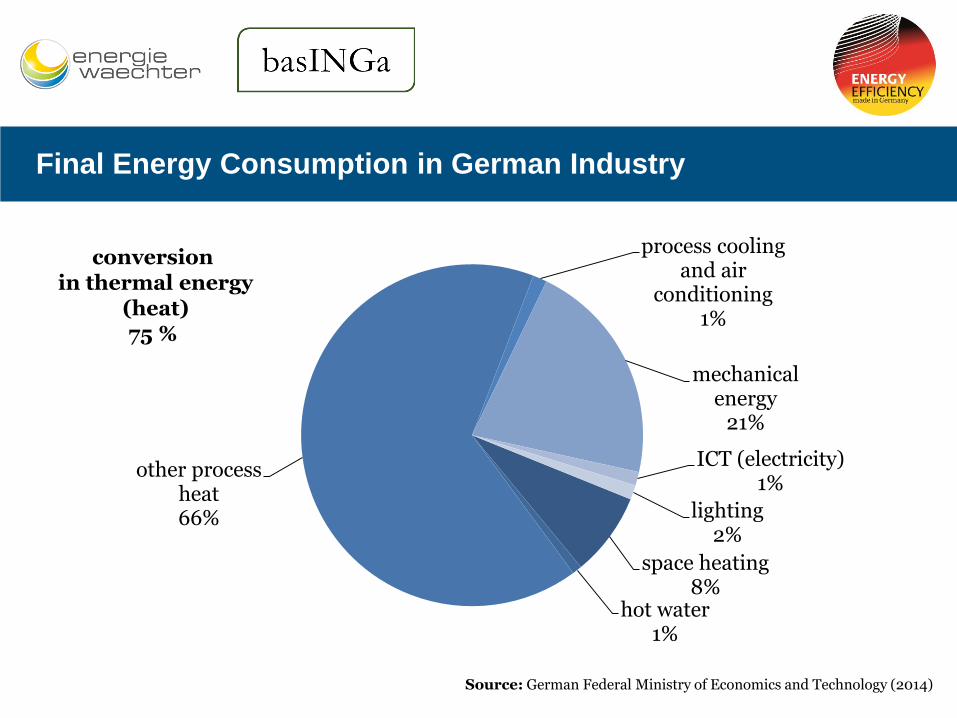
space heating8%
hot water1%
other process heat66%
process cooling and air
conditioning1%
mechanical energy
21%
ICT (electricity)1%
lighting2%
conversionin thermal energy
(heat)75 %
Source: German Federal Ministry of Economics and Technology (2014)
Final Energy Consumption in German Industry

Example: Way to decrease energy costs
Trend of costs when applying short
time energy management
Activities for saving energy only
occasionally, without continuous control
und improvement
Trend of costs when applying continuous enms-processes (constant improvements, training and motivation)
Successful and longterm reduction of energy costs
Decision to implement an EnMS according toISO 50001
InvestmentOngoingInvestment
Risingdemandof energy
Simple measures ofenergy savingsdropping costs
moremeasures
Saving energybecomes part ofthe company`sculture
Source: Austrian Energy Agency (2007), p. 6

Before optimization: know your energy flows!
Measures on the basis of energetic comparison
Energy monitoring
Live monitoring
Analysis ofhistoric data
Key values andbenchmarking
kWh/part, kWh/kg
Volume compressed air per day
coefficient of performanceSource: Limón GmbH

Main primary energy demand in a plastic processing factory
Source: Schlüter, Rosano (2016)
HVAC: heating, ventilation and airconditioning

Energy efficiency by increasing productivity
Optimization of robots
Usage of coolers instead of compression chillers
Lighting
Adaption of the cooling water temperature
Auto industry: Quick wins I
6
8
10
12
1,0
1,5
2,0
2,5
3,0
3,5
4,0
2529
3337
4145
49
1,0-1,5 1,5-2,0 2,0-2,5
2,5-3,0 3,0-3,5 3,5-4,0
Sources: Ostfalia (2014); Schlüter (2013)

Optimization of pneumatic system
Insulation of hot processes
Heating, ventilation, air conditioning (HVAC)
Auto industry: Quick wins 2
geschlossener
Strömungs-
kanal
Produkt
Luftein- und
auslass
Source: Müller et al. (2009), Gloor (2000); J. Wagner (2014)
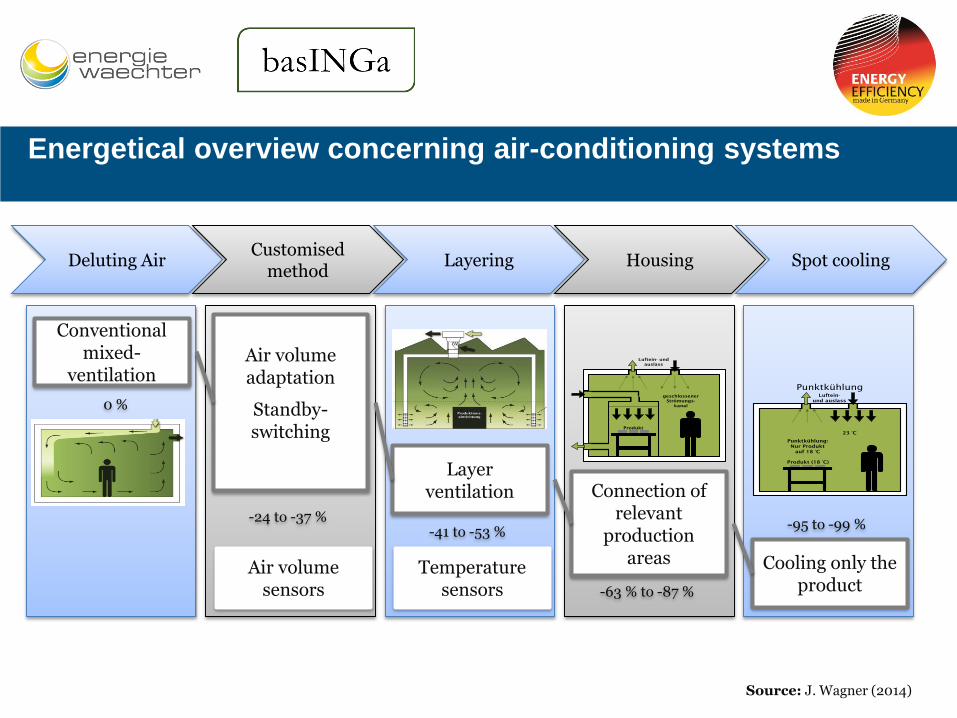
Energetical overview concerning air-conditioning systems
Deluting Air
Conventionalmixed-
ventilation
0 %
Customisedmethod
-24 to -37 %
Air volumeadaptation
Standby-switching
Layering
Layer ventilation
-41 to -53 %
Housing
Connection ofrelevant
productionareas
geschlossener
Strömungs-
kanal
Produkt
Luftein- und
auslass
-63 % to -87 %
Spot cooling
Cooling only theproduct
-95 to -99 %
Punktkühlung
Produkt (18 °C)
Luftein-
und auslass
Punktkühlung:
Nur Produkt
auf 18 °C
23 °C
23.02.2016
11Source: J. Wagner (2014)
Temperaturesensors
Air volumesensors

Optimization of pneumatic system
Insulation of hot processes
Heating, ventilation and air conditioning (HVAC)
Utilization of waste heat
Heat recovery
Switch off belts/machines when possible
Auto industry: Quick wins 2
geschlossener
Strömungs-
kanal
Produkt
Luftein- und
auslass
Source: Müller et al. (2009), Gloor (2000); J. Wagner (2014)

Changing a whole plastics factory –
Impact of a holistic approach
Holistic approach clearly betterSource: Schlüter, Rosano (2016)
23.02.2016 Dr.-Ing. Alexander Schlüter 13
Σ = 26 %
Σ = 41 %

• There are several opportunities to increase your energy efficiency!
• Conduct energy management system according to ISO 50001!
• Train your staff they might bring in ideas.
• Start with quick wins but try to think and conduct holistically!
Conclusion

www.renewables-made-in-germany.com
basINGa Engineering office B. A. Schlüter
Percevalstr. 27
D-23564 Lübeck, Germany
Contact
Dr.-Ing. Alexander Schlüter
Tel.: + 49 (0) 176 – 222 89 532

Thank you very much for your attention!

• Hesselbach, J.: Energie- und klimaeffiziente Produktion: Grundlagen,
Leitlinien und Praxisbeispiele, Vieweg+Teubner, 2012
• Austrian Energy Agency. Guide – Step by step direction for im-plementation
of an energy management system, Vienna, Austria, 2007
• German Federal Ministry of Economics and Technology, 2014
• Limón GmbH, product for energy monitoring “e.VISOR“, www.limon-
gmbh.de/
• Schlüter, B.A.; Rosano, M.B.: A holistic approach to energy efficiency
assessment in plastic processing. J. of Cleaner Production, 2016
• Ostfalia Hochschule für angewandte Wissenschaften; talk of Geckler, D.,
Roboterkinetik: Energieeinsparungen bei Robotern, Munich, Germany, 2014
• Müller, E. et al: Energieeffiziente Fabriken planen und betreiben, Springer,
Berlin, Heidelberg, 2009
List of references I

• Gloor, R.: Energieeinsparung bei Druckluftanlagen in der Schweiz, Sufers, 2000
• Schlüter, A.: Beitrag zur thermischen Energieversorgung in der Kunststoffverarbeitung – Systemische Lösungen und Potenziale, Dissertation, Kassel Univ. Press, 2013
• Unpublished figures and results of J. Wagner, Univ. of Kassel, Germany, 2014
• EU, Eurostat, http://epp.eurostat.ec.europa.eu/, 2012
• VDI 6025; VDI-Guideline. Betriebswirtschaftliche Berechnungen für Investitionsgüter und Anlagen, 2012
• Schumm, G.; Philipp, M.; Energieeffizienz in der milchverarbeitenden Industrie, talk, Kassel, Germany, 02/20/2015
List of references 2

www.renewables-made-in-germany.com
Backup

Final energy consumption in the EU
Source: EU, Eurostat, (2012)
Services 16%
Industry24%
Transport33%
Households 27%

Degree of efficiency is very low: about 10 %
Example: Compressed air system
Compressor manufacturers: enlarge usage of waste heat
Problem: demand at 65-90 °C
Heating demand for building only in cold days
Increase of overall degree of efficency from 10 to ca. 25 %
Source: Müller et al. (2009), Gloor (2000)
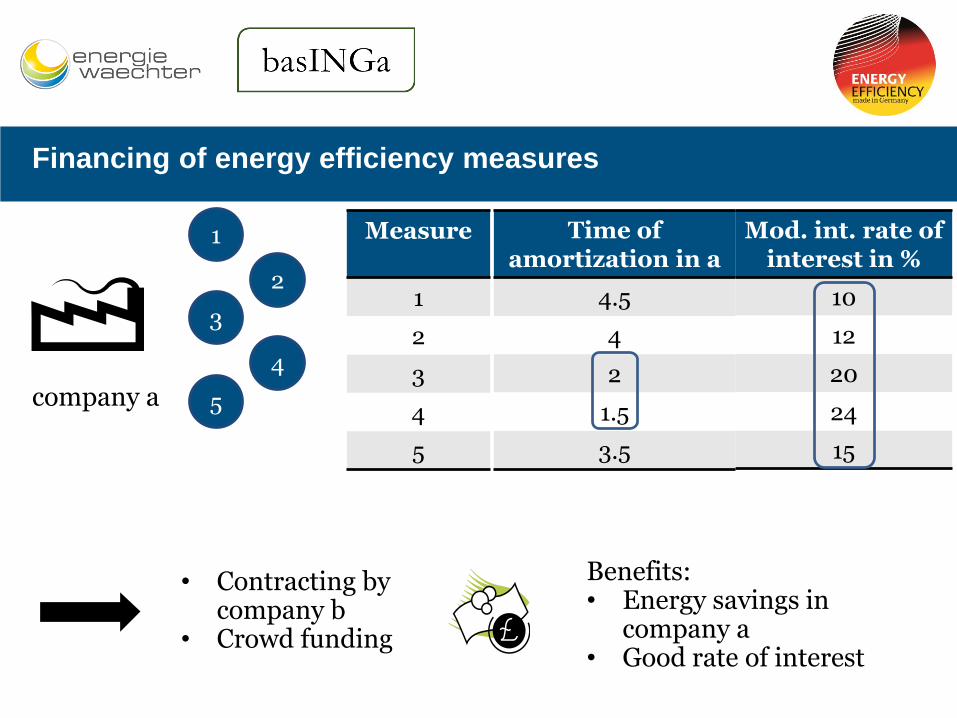
Financing of energy efficiency measures
1 Measure
1
2
3
4
5
Mod. int. rate ofinterest in %
10
12
20
24
15
Time ofamortization in a
4.5
4
2
1.5
3.5
• Contracting bycompany b
• Crowd funding
Benefits:• Energy savings in
company a• Good rate of interest
company a
2
3
4
5

Modified internal rate of return
• im: mod. internal rate of interest
• E: earnings
• A: expenses
• A0: initial invest
• n: number of periods
• N: complete number of periods
• i: market interest rate
source: VDI-Richtlinie 6025, 2012

Example: Consumption footprint of a dairy
Steam
Power
Natural gas
Dry air
Power
Losses
Filtrating-facilities, Engines, Refrigareting machines…
Evaporizer,Pasteurizer,Cleaning …
Dry tower
Source: Schumm, G.; Philipp, M. (2015)
End energy
Partly cogeneration-suitable
Dr.-Ing. Alexander Schlüter

Example: Usage of a CHP in a dairy
Steam
Dryer
Power
Losses
CHP
Warm water
Dry air
Losses
Evaporizer
Cleaning,Pasteurizer
• 23 % CO2-saving• 20 % primary energy-saving• 22 % energy costs-saving
Very cogeneration-suitable
Dr.-Ing. Alexander Schlüter
Filtrating-facilities, Engines, Refrigareting machines…
Source: Schumm, G.; Philipp, M. (2015)