Energy Efficiency and Poverty Alleviation - gov.uk · Energy Efficiency and Poverty Alleviation...
134
NATURAL RESOURCES INSTITUTE Energy Efficiency and Poverty Alleviation Final Report SUB-SECTOR: ENERGY PROJECT NO: R7222
Transcript of Energy Efficiency and Poverty Alleviation - gov.uk · Energy Efficiency and Poverty Alleviation...

N A T U R A L R E S O U R C E S I N S T I T U T E
Energy Efficiency
and Poverty Alleviation
Final Report
SUB-SECTOR: ENERGY
PROJECT NO: R7222
Energy Efficiency and Poverty Alleviation
Nandini Dasgupta
With
Alec HollingdaleAbdul Tariq
Man Kwan ChanClaire Coote
Natural Resources InstituteUniversity of Greenwich

i
EXECUTIVE SUMMARY
Project Purpose: The 1997 UK Government White Paper on International Development commits theDepartment for International Development (DFID) to the ‘elimination of poverty and encouragementof economic growth which benefits the poor’ and to promoting ‘sustainable livelihoods. Departmentswithin DFID are trying to establish what this means for their policy. This project is funded by theEnergy Sub-sector, DFID- UK. It seeks to identify activities and sectors where improved energyefficiency could have direct environmental and socio-economic gains for the poor. The overall aim isto inform policy making in the energy sector.
Energy-poverty links: Understanding the links between energy efficiency and poverty is central tothis study. The integrated development recognises the complex nature of environment-poverty links. Itis within this holistic analytical framework that poverty is defined. Here poverty is seen as a multi-dimensional problem where one of the determinants of well-being is the physical environment. Thequality of this environment depends on the presence of pollutants and pathogens in air, water and soil.Among the range of factors affecting the environment, combustion is one of the potential sources ofair pollution. Inefficient energy use combined with poor work practice can be deleterious. It istherefore argued that, targeting assistance to enhance efficiency of fuel use in those sectors andactivities which directly affect the urban poor, could improve the physical environment and generatebenefits for the poor in terms of improved health, greater earning capacity and increased disposableincome. Additionally, enhanced efficiency would mean higher returns to inputs and reduced pollutionload for industry.
The objectives of this report are to♦ contextualise the research problem with reference to poverty, air pollution and energy use;♦ based on secondary data search and in-country research, identify those activities and sub-sectors in
industry, commerce and domestic sectors, where interventions could generate direct benefits forthe urban poor;
♦ identify energy intensive activities within these sub-sectors, as one of the main objectives of theEnergy Sub-sector, DFID, is to target energy intensive activities;
♦ assess the scope, benefits and constraints for targeting assistance; and♦ make recommendations based on these findings.
The methodology: The study first undertook a desk review to explore the links between energy use,environment and poverty at city, sectoral and household levels. A review of energy use and povertylinks in industry, commerce and households in Asian and African countries was also undertaken.Given the time constraints and the expertise of the study team, India was selected for in-depth casestudy. Once India was selected for case-study, the first activity was to obtain national aggregated datafor energy use in industry, commerce and for household use as cooking fuel. These areas of energy usewere then reviewed to identify any links that exist between energy efficiency and poverty. Strongerenergy use-pollution-poverty linkages were noted in industrial and domestic sectors. The scope forefficiency improvements was noted in the commercial sector, but it was difficult to establish energy-poverty linkages, given the database.
Based on the data available, industrial and domestic sectors were taken up for detailed analysis. Thisexamination showed that targeting assistance to small industries would have greater poverty impactsand also benefit industry. For the domestic sector, the review indicated that it would be more
ii
appropriate to focus on urban household where enhanced efficiency could have measurable povertyimpacts. These issues were further investigated, while in the UK and then in India.
In New Delhi and Calcutta, India, wide ranging discussions were undertaken with differentorganisations, experts and practitioners to obtain views on the research problem, on the provisionalfindings of this study and to assess recent developments and initiatives to enhance energy efficiency inindustrial and domestic sectors and in environmental management.
The main findings of this study are:
Domestic Sector
Applicable to developing countries in general
1. Benefits of enhanced energy efficiency at the household level could be in terms of increaseddisposable income and improved health following reduction in pollution. Therefore, measures ofpoverty impact could be savings in fuel bills; proportionate share of uptake by poor households;proportion of improved stoves in use after measuring drop-out rate; and range of expected benefitsgenerated, as defined by the target group.
2. There are two main management options for enhancing energy efficiency in household fuel use.
These are: A. Improved stoves; and B: Fuel Switching- Moving Up the Energy Ladder. 3. Enhanced efficiency leading to reduced fuel needs will reduce the mass of pollutants generated.
This will have health impact if cooking is undertaken indoors. 4. There has to be careful evaluation at project design stage of levels of economic benefits that could
accrue in terms of disposable income from enhanced energy efficiency. 5. It is important to define minimum exposure limits before judgement can be made if improved
stoves do really do reduce health risks posed by PAH class of compounds. 6. Energy is an issue, though not a priority, for poor people in urban areas. Specific to India 7. The bulk of the urban poor in major cities of India appear to have made a shift up the energy
ladder from biomass fuel to kerosene. 8. The shift from biomass to kerosene has moved cooking indoors increasing the environmental
health risks for women and children of indoor pollution. 9. Kerosene users need to be targeted through health programmes and to increase their awareness of
dangers of using kerosene in a poorly ventilated rooms. 10. There may be limited opportunities for improving efficiency of energy use, other than assisting
households to move up the energy ladder, in the big cities. In towns, small cities and peri-urban
iii
areas there may be more interest in investing in an improved wood-burning chulha, thoughpossibly from an improved health perspective than from potential energy savings.
11. Woodfuel users are the poorest in urban areas, often transient/new arrivals. They are difficult totarget. Many will probably eventually switch to kerosene (due to opportunity cost of woodfuelcollection; peer pressure, safety aspects). This implies a need to examine opportunity forsupporting improved Chulha programme in appropriate areas.
12. There is need to put energy on the urban planning agenda. At present it has no place in urbanmanagement in India.
Industrial Sector
Applicable to cities in developing countries
1. Given the aim and objectives of this study, assistance to large scale industries cannot be justified. 2. In the context of small scale sector in developing countries, initiatives targeting only combustion
related pollution will have little impact on overall air pollution and therefore have no impact onpoverty.
3. Energy-led initiatives in small scale industries with the scope to address other sources of pollution,
leading to environmental improvements could reduce intra-urban differentiation in pollutionimpact and generate benefits for the poor.
4. Pollution control and energy efficiency in small industries cannot be expected to follow from
simply superimposing models that have been used for large industries. These operations are stillessentially rooted in a socio-economic culture that has largely been displaced in developedcountries.
5. There is need for flexible, sub-sector approach to the environmental management in small
industries. 6. The people who participate in the manufacturing sector are not the ‘poorest of the poor’ but the
workers in the small scale sector constitute an extremely vulnerable segment of the society.Insecurity of job tenure, appalling working conditions and threat of closure and loss of livelihoodmake them an important target group.
7. Communities of low income housing with low levels of empowerment but subject to high levels of
industrial pollution form an equally important target group. 8. It is important to develop strategies that lessen pollution control costs and also reduce
manufacturing costs. It is crucial to inform industry of economic gains that could be made interms of increased efficiency, higher material recovery and lower waste generation fromtechnological upgradation and process improvements.
iv
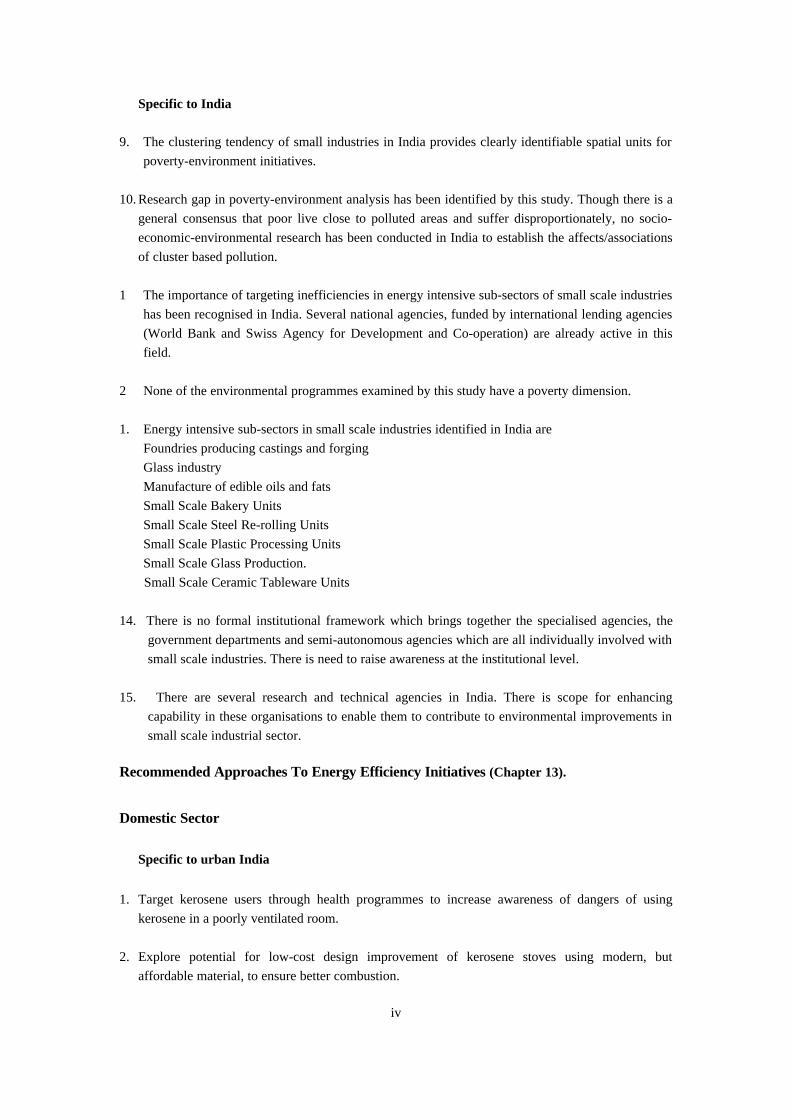
Specific to India 9. The clustering tendency of small industries in India provides clearly identifiable spatial units for
poverty-environment initiatives. 10. Research gap in poverty-environment analysis has been identified by this study. Though there is a
general consensus that poor live close to polluted areas and suffer disproportionately, no socio-economic-environmental research has been conducted in India to establish the affects/associationsof cluster based pollution.
1 The importance of targeting inefficiencies in energy intensive sub-sectors of small scale industries
has been recognised in India. Several national agencies, funded by international lending agencies(World Bank and Swiss Agency for Development and Co-operation) are already active in thisfield.
2 None of the environmental programmes examined by this study have a poverty dimension. 1. Energy intensive sub-sectors in small scale industries identified in India are
Foundries producing castings and forgingGlass industryManufacture of edible oils and fatsSmall Scale Bakery UnitsSmall Scale Steel Re-rolling UnitsSmall Scale Plastic Processing UnitsSmall Scale Glass Production.
Small Scale Ceramic Tableware Units
14. There is no formal institutional framework which brings together the specialised agencies, thegovernment departments and semi-autonomous agencies which are all individually involved withsmall scale industries. There is need to raise awareness at the institutional level.
15. There are several research and technical agencies in India. There is scope for enhancingcapability in these organisations to enable them to contribute to environmental improvements insmall scale industrial sector.
Recommended Approaches To Energy Efficiency Initiatives (Chapter 13).
Domestic Sector
Specific to urban India
1. Target kerosene users through health programmes to increase awareness of dangers of using
kerosene in a poorly ventilated room. 2. Explore potential for low-cost design improvement of kerosene stoves using modern, but
affordable material, to ensure better combustion.

v
Applicable in other developing countries and India 3. Examine opportunities for supporting improved stove programme in appropriate areas. 4. Assist to define minimum exposure limits so that judgement can be made if improved stoves do
really reduce the health risks posed by PAH class of compounds. 5. Put domestic energy demand management on urban planning and management agenda.
Industrial Sector
The study indicates that the recommendation made below have applicability in Indian and other Asiancities. It is expected that environmental improvements in small industries (given their employmentand polluting potential) will become an important component of overall urban environmentalmanagement.
1. Target inefficiencies in clusters of small scale industries to generate benefits for a large group ofurban poor.
2. Disseminate information on benefits which can accrue to industry from enhanced efficiency of
fuel and resource use. 3. An energy led initiative where the core objective is to enhance energy efficiency but with the
scope to address other related sources of air pollution so as to generate maximum benefits for thepoor.
4. Target the large number of vulnerable low income workers in small industries and those living
adjacent to highly polluting clusters of industries. 5. Any energy led initiative in small scale industries should incorporate the lessons learnt from
other on-going programmes. 6. Facilitate the development of a participatory approach to enhancing efficiencies in energy and
resource use as it has more scope for success. 7. Assist in institutional awareness raising and capability building. 8. Assist in developing an appropriate institutional framework which can incorporate the flexibility
of a participatory approach to environmental improvements. These recommendations imply that DFID as an organisation can act at either one or at two levels.These are, one, at cluster level for example, to help develop procedures/methodologies forparticipatory environmental improvements in energy intensive sub-sectors; and two, at the sectorallevel to assist in institution and capability building.

vi
Commercial Sector
1. Need for a systematic study and greater understanding to identify poverty links.
Influencing Policy
1. Put demand management of energy on the agenda.Demand management is a neglected policy area in India. Assist to develop a demand managementstrategy at the national level to rationalise and plan fuel use.
2. Put energy on the agenda of urban development programmesUrban domestic fuel use is a neglected issue. DFID could assist in the establishment of energy task-force, with national and state governments, NGOs, research organisations and slum improvementboards. Liase with other DFID-supported initiatives. Energy task force could inform DFID healthgroups of impacts of indoor pollution.
Lessons For Participatory Environmental Initiatives
The experience of projects targeting inefficiencies of energy and resource use have important lessonsfor a participatory approach to environmental problems. These are detailed in Section 13.3, page 103.
Future Research Needs
1. Study on poverty impact of reduction in subsidy on kerosene:.2. Study to assess impact of reduction of cluster based pollution on low income workers and
residents.
3. Systematic scoping study to assess the need for an improved stoves programme in India.

vii
CONTENTS
PagePART I SETTING THE CONTEXT
1 INTRODUCTION 11.1 Project Purpose 11.2 Background 11.3 Objectives of the Report 21.4 Methodology 21.5 Plan of Report 31.6 Definition 41.7 The Study Team 5
2 DEFINING POVERTY 72.1 Definition 72.2 Approaches to Poverty 72.3 Who are the Poor? 9
3 POVERTY, ENVIRONMENT AND AIR POLLUTION 103.1 Introduction 103.2 Framework of Analysis 103.3 Spatial Analysis of Urban Environmental Problems 10
4 ENVIRONMENT AND HEALTH IMPACTS 144.1 Air Pollution and Respiratory Diseases 144.2 Health and Income 15
5 ENERGY USE: TRENDS, PATTERNS AND POLICIES 165.1 Introduction 165.2 Sustainable Development and Energy Efficiency 165.3 Patterns and Trends of Energy Use in Developing Countries 165.4 Fuelwood and Energy Efficiency Case Study - Sri Lanka. 185.5 India: Energy in the Policy Context 245.6 Need for Policy Emphasis on End-Use Efficiency: Lessons from UK. 29
PART II THE HOUSEHOLD SECTOR 31
6 HOUSEHOLD FUEL USE AND POVERTY IMPACTS 326.1 Introduction 326.2 The Problems: Links Between Energy and Poverty at the Household Level 336.3 The Conceptual Framework 366.4 The Poverty Impacts of Fuel Scarcity and Inefficient Combustion 406.5 Conclusions and Findings 41
7 HOUSEHOLD ENERGY USE AND URBAN POOR IN INDIA 437.1 Introduction 437.2 Characteristics of Slum Dwellers 437.3 What Types of Fuel are being Used by the Urban Poor,
Including What Variation There is and Why? 447.4 Government Policies and Programmes Affecting Energy Use by the Urban Poor 467.5 Findings 49
8 IMPROVING ENERGY EFFICIENCY 508.1 Introduction 508.2 A: Improved Stoves in Urban Areas 50

viii
8.3 B: Fuel Switching - Moving Up the Energy Ladder? 598.4 The Roles of Different Institutions 638.5 Conclusions and Findings 668.6 A Guide to Key References and Contacts 67
PART III THE INDUSTRIAL SECTOR 70
9 DEVELOPMENT PERSPECTIVE AND ENERGY EFFICIENCY: Need for aBroader Perspective 719.1 Introduction 719.2 Energy Efficiency 719.3 Developing Countries and Associated Issues for Technological Change 719.4 Evidence from India 729.5 Additional Evidence 749.6 Socio-Economic Context 759.6 Conclusions and Findings 76
10 ENVIRONMENTAL IMPROVEMENTS IN SMALL SCALE INDUSTRIES: Benefitsthe Poor and the Industry 7710.1 Introduction 7710.2 Large Industries 7710.3 Energy-led Initiatives in Small Industries and Poverty Links 7810.4 Energy-led Initiatives and Economic Gains for Small Industries 8110.4 Conclusion and Findings 82
11 HIGH ENERGY USING SUB-SECTORS OF SMALL SCALE INDUSTRIES 8411.1 Introduction 8411.2 Initial Analysis Undertaken by this Study 8411.3 Energy Using Sector Identified by TERI 8511.4 Energy Using Sector Identified by DCSSI 8611.5 Findings 87
12 ASSESSMENT OF CLUSTER BASED ENVIRONMENTAL INITIATIVES IN INDIA 8812.1 Introduction 8812.2 Industrial Clusters 8812.3 Initiatives 8912.4 Findings: Implications for Energy-led Initiatives 99
13 CONTRIBUTION OF OUTPUTS 10013.1 Recommended Approaches to Energy Efficiency Initiatives in India 100
A: Domestic Sector 100B: Industrial Sector 100C: Commercial Sector 102
13.2 Influencing Policy 10313.3 Lessons for Participatory Environmental Initiatives 10313.4 Future Research Needs 10413.5 Follow up 104
REFERENCES 105APPENDIX A Preliminary Guidelines for Designing, Developing, Monitoring and
Evaluating Household Energy Interventions with a Poverty Focus 109APPENDIX B Background to Small and Medium Enterprises (SMES) in India 112APPENDIX C Methodology used to identify Energy Intensive Sub-Sectors 118
ix
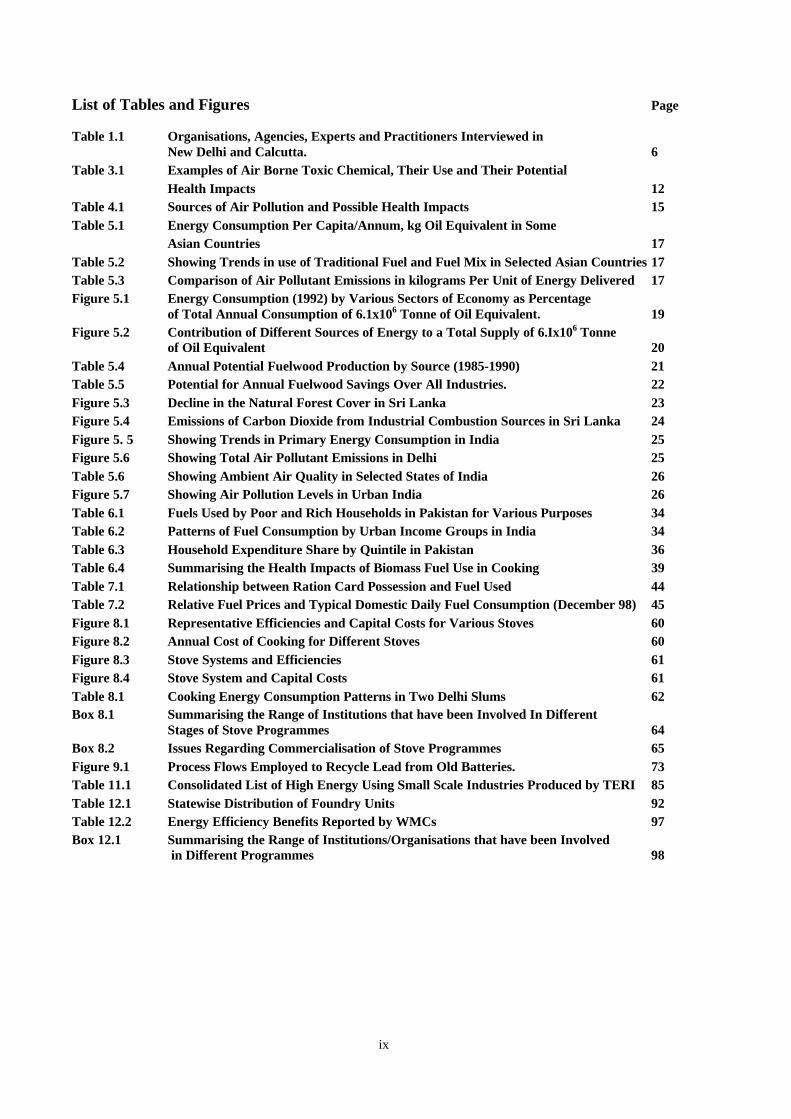
List of Tables and Figures Page
Table 1.1 Organisations, Agencies, Experts and Practitioners Interviewed inNew Delhi and Calcutta. 6
Table 3.1 Examples of Air Borne Toxic Chemical, Their Use and Their PotentialHealth Impacts 12
Table 4.1 Sources of Air Pollution and Possible Health Impacts 15Table 5.1 Energy Consumption Per Capita/Annum, kg Oil Equivalent in Some
Asian Countries 17Table 5.2 Showing Trends in use of Traditional Fuel and Fuel Mix in Selected Asian Countries 17Table 5.3 Comparison of Air Pollutant Emissions in kilograms Per Unit of Energy Delivered 17Figure 5.1 Energy Consumption (1992) by Various Sectors of Economy as Percentage
of Total Annual Consumption of 6.1x10⁶ Tonne of Oil Equivalent. 19Figure 5.2 Contribution of Different Sources of Energy to a Total Supply of 6.Ix106 Tonne
of Oil Equivalent 20Table 5.4 Annual Potential Fuelwood Production by Source (1985-1990) 21Table 5.5 Potential for Annual Fuelwood Savings Over All Industries. 22Figure 5.3 Decline in the Natural Forest Cover in Sri Lanka 23Figure 5.4 Emissions of Carbon Dioxide from Industrial Combustion Sources in Sri Lanka 24Figure 5. 5 Showing Trends in Primary Energy Consumption in India 25Figure 5.6 Showing Total Air Pollutant Emissions in Delhi 25Table 5.6 Showing Ambient Air Quality in Selected States of India 26Figure 5.7 Showing Air Pollution Levels in Urban India 26Table 6.1 Fuels Used by Poor and Rich Households in Pakistan for Various Purposes 34Table 6.2 Patterns of Fuel Consumption by Urban Income Groups in India 34Table 6.3 Household Expenditure Share by Quintile in Pakistan 36Table 6.4 Summarising the Health Impacts of Biomass Fuel Use in Cooking 39Table 7.1 Relationship between Ration Card Possession and Fuel Used 44Table 7.2 Relative Fuel Prices and Typical Domestic Daily Fuel Consumption (December 98) 45Figure 8.1 Representative Efficiencies and Capital Costs for Various Stoves 60Figure 8.2 Annual Cost of Cooking for Different Stoves 60Figure 8.3 Stove Systems and Efficiencies 61Figure 8.4 Stove System and Capital Costs 61Table 8.1 Cooking Energy Consumption Patterns in Two Delhi Slums 62Box 8.1 Summarising the Range of Institutions that have been Involved In Different
Stages of Stove Programmes 64Box 8.2 Issues Regarding Commercialisation of Stove Programmes 65Figure 9.1 Process Flows Employed to Recycle Lead from Old Batteries. 73Table 11.1 Consolidated List of High Energy Using Small Scale Industries Produced by TERI 85Table 12.1 Statewise Distribution of Foundry Units 92Table 12.2 Energy Efficiency Benefits Reported by WMCs 97Box 12.1 Summarising the Range of Institutions/Organisations that have been Involved
in Different Programmes 98

PART I
SETTING THE CONTEXT

1
1. INTRODUCTION
1.1 Project Purpose
1.1.1 This is the final report of the project titled: Energy Efficiency and Poverty Alleviation. Theproject is funded by the Energy Sub-sector, Department For International Development, UK. It seeksto identify activities and sectors where improved energy efficiency could have direct environmentaland socio-economic gains for the poor. The overall aim is to change policy making in the energysector.
1.2 Background
1.2.1 The 1997 UK Government White Paper on International Development commits theDepartment for International Development (DFID) to the ‘elimination of poverty and encouragementof economic growth which benefits the poor’ and to promoting ‘sustainable livelihoods”. Alldepartments within DFID are trying to establish what this means for their policy. The aim of thisstudy, undertaken for the Energy Sub-sector, is to establish if enhanced energy efficiency in certainsectors and activities could generate benefits for the poor. If so, what are these activities and sub-sectors, what are their poverty links and where should assistance be targeted.
1.2.2 At the core of this analysis is the evidence that the growing number of poor in urban and peri-urban areas suffer a disproportionately high impact of pollution.(Hardoy & Satterthwaite: 1992;Bradley et al: 1992). There is evidence that this intra-urban differentiation in pollution impact is dueto the spatial juxtaposition of industrial and low income housing. Additionally, low income workers insmall industrial units are subject to high levels of workplace pollution due to energy and processinefficiencies (Kothari: 1983: Kogi: 1985; Thomas: 1991; Dasgupta: 1997). The impact of airpollution on health and consequently on earning capacity is well documented (Hardoy &Satterthwaite: 1989; Bradley et al: 1992; Pryer: 1993; Surjadi:1995). Moreover, in some Asiancountries (Bangkok- Lohwongwatana: 1990; Hong Kong- Lin: 1994; Delhi- Dasgupta: 1998;) themore stringent environmental enforcement in recent years is threatening small polluting units withclosure, jeopardising the livelihood of low income workers.
1.2.3 Analysis of energy statistics show that (i) energy use increases as development progresses; and(ii) limited examples of accurate measurements indicate gross inefficiencies in industry and in use inthe domestic sector. Research (TERI: 1998; Smith: forthcoming) shows that high levels of indoorpollution is associated with inefficient domestic fuels and stoves. The impact of indoor pollution isbiased in that it affects women, children and old people more than the men in the households.
1.2.4 Establishing the link between enhanced energy efficiency and poverty is central to this project.Here poverty is seen as a multi-dimensional problem where one of the determinants of well-being isthe physical environment. The quality of this environment depends on the presence of pollutants andpathogens in air, water and soil. Among the range of factors affecting the environment, combustion isone of the potential sources of air pollution. Inefficient energy use combined with poor work practicecan be deleterious. It is therefore argued that, targeting assistance to enhance efficiency of fuel use inthose sectors and activities which directly affect the urban poor, could improve the physicalenvironment and generate benefits for the poor in terms of improved health and greater earning
2
capacity. Additionally, enhanced efficiency implies higher returns to industry from inputs; lowerlevels of pollution; reduced threat of closure and greater security of livelihood for the workers.
1.3 Objectives of the Report
1.3.1 The objectives are to
♦ contextualise the research problem with reference to poverty, air pollution and energy use;♦ based on secondary data search and in-country research, identify those activities and sub-sectors in
industry, commerce and domestic sectors, where interventions could generate direct benefits forthe urban poor;
♦ identify energy intensive activities within these sub-sectors, as one of the main objectives of theEnergy Sub-sector, DFID, is to target energy intensive activities;
♦ assess the scope, benefits and constraints for targeting assistance; and♦ make recommendations based on these findings.
1.4 Methodology
1.4.1 The study first undertook a desk review to explore the links between energy use, environmentand poverty at city, sectoral and household levels. The city level review showed that there wasconsiderable intra-urban differentiation in pollution impact in most cities of developing economies.This differentiation is attributed to the fact that industries and low income housing seek out low costland. There is little evidence to report on this kind of disparity in the rural areas. Hence, the focus onurban industries.
1.4.2 An review of energy use and poverty links in industry, commerce and households in Asian andAfrican countries was undertaken. Given the time constraints and the expertise of the study team,India was selected for in-depth case study. A comparative analysis of India and China would havebeen useful. Most official information in China is published in Chinese. However, attempts have beenmade to draw on whatever information was accessible.
1.4.3 The next activity was to obtain national aggregated data for energy use in industry, commerceand for household use as cooking fuel, in India. These areas of energy use were then reviewed toidentify any links that exist between energy efficiency and poverty. Stronger energy use-pollution-poverty linkages were noted in industrial and domestic sectors. The scope for efficiency improvementswas noted in the commercial sector, but it was difficult to establish energy-poverty linkages, given thedatabase. The DFID-funded programme, ‘Development of Commercial Energy Efficient Cooking’(R6848), in Africa was then examined to assess the impact on low income groups. The programme’starget group was stoves producers and target sectors were hospitals, schools and other largegovernment institutions. The programme appears to have had some success in the dissemination ofimproved commercial stoves, it had little or no impact on the poor. Hardly any new jobs had beencreated and beneficiaries of improved stoves were medium sized organisations. Whether the gainsmade through reduced fuel use were being ploughed back to benefit the poor is difficult to say.
1.4.4 Based on the data available for India, industrial and domestic sectors were taken up for detailedanalysis. This examination threw up potential industrial sub-sectors and issues in domestic fuel usewhich were further investigated, while in the UK and then in India. The initial review of energy issues

3
relating to large scale industries showed little justification for assistance as they possessed thefinancial and technical resources to enhance efficiencies. Thus, the study focused on small scaleindustries. The initial review of domestic sector programmes led the study to focus on issues ofimproved stoves in urban areas. There are three factors:
1.4.5 (i) the review of improved stove programmes in developing countries showed that considerableknowledge and expertise existed with regards to stove programmes in rural areas. There was verylimited information on urban stove programmes; (ii) the review of Rural Energy Security (DFIDprojects: ZF0021 and R6297) showed that most rural households collect fuelwood for free so there islittle incentive to invest in stoves. On the other hand, in “urban areas where people buy fuel there is aclear incentive to invest in fuel saving technology” (pp. 13). This implied that urban household couldmake financial gains from enhanced efficiency leading to reduced fuel use; and (iii) most stoveprogrammes have their origins in ‘woodfuel gap theory’ which predicted fuelwood crises. Theobjectives of this study reflects the shift to poverty issues within the ‘livelihoods approaches’. It wasthus, considered appropriate to focus on the sector where enhanced efficiency could have measurablepoverty impacts.
1.4.6 In New Delhi and Calcutta, India, wide ranging discussions were undertaken with differentorganisations, experts and practitioners to obtain views on the research problem, on the provisionalfindings of this study and to assess recent developments and initiatives to enhance energy efficiency inindustrial and domestic sectors and in environmental management. A list of organisations and personsinterviewed is provided at the end of this chapter.
1.5 Plan of Report:
1.5.1 This report is organised in three parts.
1.5.2 Part I contextualises the research problem. The research problem has two components - povertyand energy use. Poverty is first defined and the various approaches to poverty are discussed. The moreholistic integrated development approach which recognises the inter-connectivities of environment-poverty relations is used by this study as its analytical framework. Chapter 3 examines the sources andnature of environmental problems affecting the urban poor, with particular emphasis on air pollution.The spatial framework developed by Hardoy and Satterthwaite (1989) to analyse the environmentalproblems at city, neighbourhood, workplace and household levels is used by this study to draw out thepoverty-environment links at different levels. Chapter 4 draws on epidemiological research to showthe widespread nature of respiratory diseases attributed to environmental pollution, and to highlightthe economic impacts on households and workers of ill health.
1.5.3 Chapter 5 examines the trends, patterns and policies affecting energy use. The objectives hereare to relate the study to the wider energy debate and to show that despite the generally upward trendin the use of fossil fuels there are wide variations in fuel mix and pattern of fuel use in Asia. Thechapter then looks at India in more detail. It shows that end-use energy efficiency issues are neglectedat the policy level as energy policies focus on supply management and environmental policy appearsconcerned with waste abatement and end-of-pipe measures.
1.5.4 Part II focuses on energy use and its implications for poor urban households. It explores thelinks between poverty and energy at the household level. Chapter 6 describes the pattern of energy

4
supply and use in developing countries, with particular reference to India. It then examines thehousehold energy-poverty links within the integrated development approach to poverty. Chapter 7looks at the case of India. It discusses the characteristics of slum dweller and the types of fuels used -the reasons and pattern of variation. It concludes with a discussion of government policies andprogrammes affecting energy use by the urban poor. Chapter 8 examines the two management optionsfor improving energy efficiency in the domestic sector- improving stoves and assisting people tomove up the energy ladder. Each section draws out the policy implications for developing countries asa whole and India in particular. Appendix A gives preliminary guidelines for designing, developing,monitoring and evaluating energy interventions with a poverty focus.
1.5.5 Part III concentrates on industrial sector activities. This section highlights the policyimplications for developing energy efficiency programmes; identifies and then examines energyintensive industrial activities which could be targeted for intervention. Chapter 9 shows that, in thecontext of developing countries, there is a need for a broader perspective within which energyefficiency measures have to be located. Drawing on evidence from Asia and Africa, it argues thatfocusing only on combustion related pollution will not produce any discernible environmentalbenefits. However, an energy-led initiative encompassing the issues discussed could improve ambientand work place pollution. Chapter 10 shows that environmental gains in energy intensive sub-sectorsof small scale units, employing large number of low income workers and which form clusters inproximity to low income housing, could have considerable impact on poor workers and on theneighbourhood. It shows why benefits could flow to the urban poor from energy-led initiatives insmall scale industries and proposes target groups. Chapter 11 identifies high energy using sub-sectorsof small scale industries.
1.5.6 Some of the sub-sectors identified in Chapter 11 have already been targeted for enhancingenergy efficiency. Chapter 12 assesses these initiatives taken by other lending agencies (e.g. SwissAgencies for Development and Co-operation), energy research organisations, semi-autonomousgovernment agencies and government agencies to enhance energy efficiency. Other initiatives, one ofwhich is funded by the World Bank, targeting energy and process inefficiencies in small scaleindustries are also discussed . The chapter concludes with a discussion of the implications for anenergy-led initiative.
1.5.7 Chapter 13 sets out the recommendations made by this study
1.6 Definition:
1.6.1 Small scale industries: A small scale unit is defined as one with a maximum of Rs. 6 million(£85K) in plant and machinery. While there is no minimum limit to it, the upper ceiling is relaxed forexporting firms and ancillary units. This limit is slated to increase to Rs. 30 million following recentpolicy changes. The absence of a lower limit to investment in this sector combined with productprotection, subsidised raw material and cheap credit means easy entry and wide variations in size ofunits. Units employing fewer than 5 persons are referred to as tiny units or micro-enterprises.

5
1.7 The Study Team
1.7.1 The study team is constituted of the following persons from Natural Resources Institute,University of Greenwich.
Dr. Nandini Dasgupta - Project Manager.Reader: Employment, Environment and Development.Mr. Alec Hollingdale - Chemical EngineerDr. Abdul Tariq - Energy EngineerMs Man Kwan Chan - Social DevelopmentMs Claire Coote- Socio-economist.
6
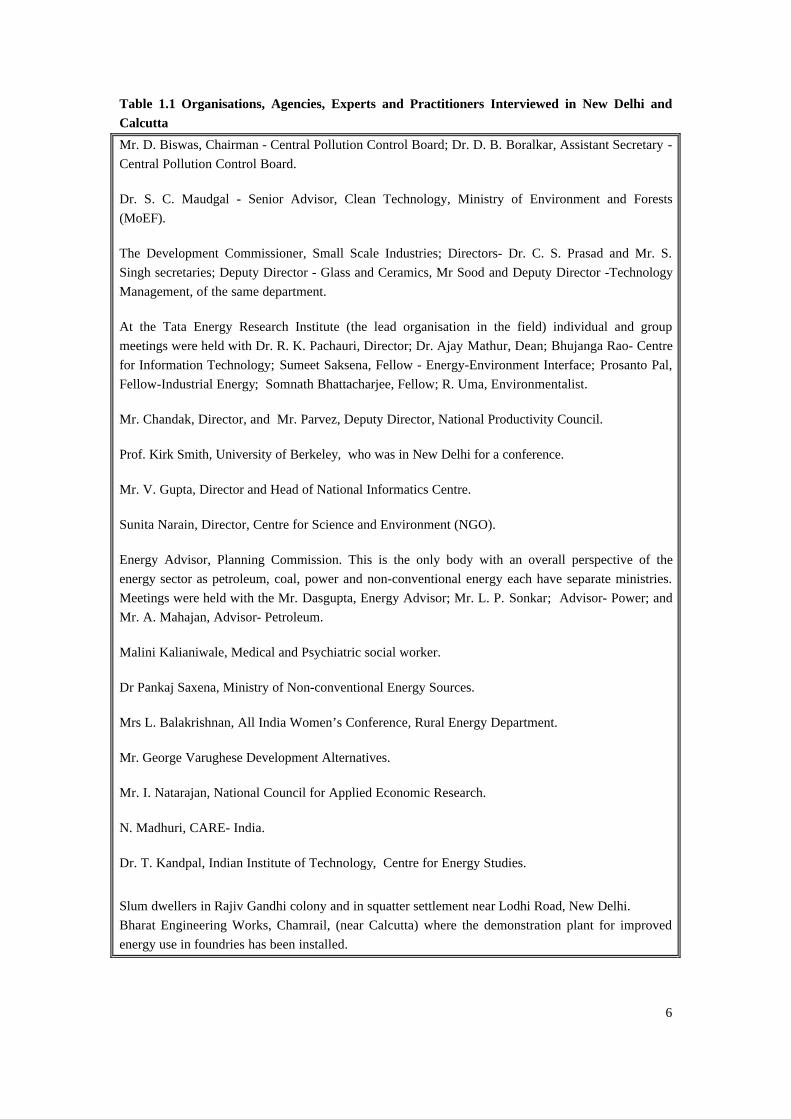
Table 1.1 Organisations, Agencies, Experts and Practitioners Interviewed in New Delhi andCalcutta
Mr. D. Biswas, Chairman - Central Pollution Control Board; Dr. D. B. Boralkar, Assistant Secretary -Central Pollution Control Board.
Dr. S. C. Maudgal - Senior Advisor, Clean Technology, Ministry of Environment and Forests(MoEF).
The Development Commissioner, Small Scale Industries; Directors- Dr. C. S. Prasad and Mr. S.Singh secretaries; Deputy Director - Glass and Ceramics, Mr Sood and Deputy Director -TechnologyManagement, of the same department.
At the Tata Energy Research Institute (the lead organisation in the field) individual and groupmeetings were held with Dr. R. K. Pachauri, Director; Dr. Ajay Mathur, Dean; Bhujanga Rao- Centrefor Information Technology; Sumeet Saksena, Fellow - Energy-Environment Interface; Prosanto Pal,Fellow-Industrial Energy; Somnath Bhattacharjee, Fellow; R. Uma, Environmentalist.
Mr. Chandak, Director, and Mr. Parvez, Deputy Director, National Productivity Council.
Prof. Kirk Smith, University of Berkeley, who was in New Delhi for a conference.
Mr. V. Gupta, Director and Head of National Informatics Centre.
Sunita Narain, Director, Centre for Science and Environment (NGO).
Energy Advisor, Planning Commission. This is the only body with an overall perspective of theenergy sector as petroleum, coal, power and non-conventional energy each have separate ministries.Meetings were held with the Mr. Dasgupta, Energy Advisor; Mr. L. P. Sonkar; Advisor- Power; andMr. A. Mahajan, Advisor- Petroleum.
Malini Kalianiwale, Medical and Psychiatric social worker.
Dr Pankaj Saxena, Ministry of Non-conventional Energy Sources.
Mrs L. Balakrishnan, All India Women’s Conference, Rural Energy Department.
Mr. George Varughese Development Alternatives.
Mr. I. Natarajan, National Council for Applied Economic Research.
N. Madhuri, CARE- India.
Dr. T. Kandpal, Indian Institute of Technology, Centre for Energy Studies.
Slum dwellers in Rajiv Gandhi colony and in squatter settlement near Lodhi Road, New Delhi.Bharat Engineering Works, Chamrail, (near Calcutta) where the demonstration plant for improvedenergy use in foundries has been installed.

7
2. DEFINING POVERTY
2.1 Definition
2.1.1 In this project poverty is conceptualised as a multi-dimensional problem with an array ofinterlinked determinants (income generation, environment, housing, health, education, etc.). Forpractical reasons it accepts the official definition of the ‘poor’ in India which is based on the incomederived poverty line. The rationale for these decisions is discussed below.
2.2 Approaches to Poverty
There are many approaches to defining and measuring poverty. The main approaches are:conventional economic definitions; a social development perspective which expands the definition toinclude perceptions of vulnerability and entitlements; and thirdly, the integrated developmentapproach which draws on the first two approaches and conceptualises poverty as a multi-dimensionalproblem. The third, more holistic approach recognises the inter-connectivities of environment-povertyrelations, is used by this study as its analytical framework. All three approaches are discussed below.
2.2.1 Economic definition
2.2.2 The conventional economic definitions use income, consumption or a range of other socialindicators to classify poor groups against a common index of material welfare. Though few wouldargue that human welfare can be adequately described by income alone, in practice income and/orconsumption are the most frequently used proxy for welfare.
2.2.3 The justification is that (in market based economies) income is highly correlated with othercauses of poverty and is a predicator of future problems of deprivation. The underlying economicconcept is the idea of ‘merit goods’, which society agrees to ensure that all members achieve. Theresulting policy emphasis is on efficient allocation of economic resources for increasing productivity(Wratten: 1995). This is less problematic in the North than in the developing countries where povertyis endemic and society lacks the capacity to provide merit goods for all.
2.2.4 The World Bank and most other government institutions use an absolute definition of poverty(in terms of income and poverty lines), where needs are considered to be fixed at a level whichprovides for subsistence, basic housing and expenditure on essential services. As many aspects ofwell-being cannot be captured adequately by economic indicators, supplementary social indicators areused, such as: life expectancy, infant mortality, nutrition, literacy, access to health care and drinkingwater. To overcome the problems of using single indicators, composite poverty indices have beendeveloped which combine several weighted variables, e.g. Human Development Index. Despite theshortcomings discussed above, standardised definitions are useful in that they provide a uniform scaleagainst which comparisons can be made.
2.2.5 A social development perspective
2.2.6 An alternative approach developed by anthropologists and social planners allows for localvariations in the meaning of poverty and expands the definition to encompass perceptions of non-material deprivation and social differentiation. Poverty of an individual or a household is a multi-dimensional concept involving in principle, every aspect of direct consumption as well as non-
8
consumption activities and services (Sen: 1987). Fundamental to this approach are the two concepts ofvulnerability and entitlements. The former refers to defencelessness, insecurity and exposure to risks,shocks and stress. Entitlement refers to the complex ways in which individuals or householdscommand resources (Sen: 1981). Together, the two concepts allow an understanding of howhousehold resources are used under different conditions of exposure, shock and stress arising fromenvironmental, economic and social situations.
2.2.7 The underlying argument is that causes of poverty lie in the social and political structures, andin the physical and economic environments in which people live (Moser: 1995). It acknowledges theorganisational and institutional context within which individuals exist and rejects the notion that theyare ‘free-floating’ in the market (Norton: 1993). The policy concern is attainment of social objectivescompatible with the ideal of the just, equitable and prosperous society (Moser: 1995).
2.2.8 This approach allows a greater understanding of causes of poverty and of the complexrelationships between vulnerability and entitlements which determine what poverty means to the poor.It permits different types of poverty to be distinguished by drawing on the life experiences of the poorthrough participatory analysis. However, as the definition of poverty differs with individuals it makescomparative analysis problematic.
2.2.9 The integrated development approach
2.2.10 Wratten (1995) argues that neither of the above approaches is sufficient alone. Integrating theunderstanding of the two approaches (discussed above) provides a better perception of poverty andgenerates better tools for defining and monitoring poverty. The holistic approach recognises thecomplex nature of environment-poverty links and provides a useful analytical framework. It is withinthis context that this study is defined.
2.2.11 This approach accepts that causes of poverty lie in social and political structures and inphysical and economic environments in which people live. Poverty is conceptualised as a multi-dimensional problem where structurally rooted determinants (environment, income generation,housing, health, education etc..) are interlinked. Addressing any one of the causes impacts on others.From the perspective of the poor the combined effects of the determinants are encapsulated in theconcepts of vulnerability and entitlements and are central to their well-being. Vulnerability is affectedby the ability to earn, the exposure to, and the ability to deal with, shock and stress arising fromenvironmental, economic and social situations. This implies that ameliorating any one factor ofvulnerability, while it does not remove the causes of poverty, could contribute to an improvement ofwell-being. The implication for this study is that energy efficiency gains must translate intoenvironmental improvements for the poor, for them to perceive any benefits. It is important torecognise in this case that improved energy efficiency is a means to achieving one of thedevelopmental goals i.e., environmental gains which will benefit the poor.
2.2.12 The focus of this study is therefore, on energy efficiency and the potential for improving theenvironmental situation of the urban poor. Research (discussed in detail below) has established thatthere is considerable intra-urban variation in urban environmental and health risks, with greaterexposure and risks for the poor. The risks and exposures relate to air and water pollution (inconjunction with inadequate basic facilities) and degradation of resources, and the inability of the poorto alter the situation. The policy intent here is to reduce air pollution at community (workplace and

9
ambient) and household levels through enhanced fuel use efficiency and improved work-placepractices.
2.2.13 While the social development perspective allows a better understanding of poverty, its bottom-up approach has limitations for comparative analysis. The methodological implications of integrateddevelopment approach for measurement are that quantitative and qualitative assessments arecomplementary (Wratten: ibid.). The quantitative poverty indicators are required to estimate thedistribution and depth of deprivation within cities and countries. On the other hand, qualitativeanalysis through participatory appraisals provide insight into social structures and processes whichaffect different groups. This study will draw on qualitative and quantitative tools as consideredappropriate.
2.3 Who are the poor?
2.3.1 Most official definitions of poverty are based on an absolute definition of poverty. Absolutepoverty is defined as the inability to secure basic minimum needs for subsistence, housing andexpenditure on essential services such as water, sanitation, health, education and transport. Thisinability is measured in terms of income and described as the ‘poverty line’. Thus, according to mostofficial definitions, those whose incomes are below the ‘poverty line’, are defined as the poor. Indiaalso uses the poverty line to defines its ‘poor’.
2.3.2 Studies have shown that poverty measurement based on income leads to gross under-estimationof urban poverty. In many countries a considerable proportion of the urban population who are ‘abovethe poverty line’ lack the income or assets to ensure their needs are met. Swaminathan (1995) notedthat very large proportion of the urban population in Mumbai whose incomes are above the ‘povertyline’ are no better off than the officially defined poor.
2.3.3 The Central Statistical Organisation, India, has recognised the difficulties of assessing theincome of low-income households since the early 1980’s. It uses per capita monthly expenditure tocategorise the population into fractiles based on consumption levels. It is officially accepted that thosefractile groups below the ‘poverty line’ are the poor. Using expenditure rather than income overcomessome methodological difficulties, but does not resolve the issue of under-estimation as it uses thepoverty line as a cut-off point. The government of India’s sets the urban poverty line at Rs. 1,975 permonth (Economic Survey 1997).
2.3.4 Composite indices like the Human Development Index which aggregates income, literacy andlife expectancy into a single measure on a scale of zero to one is an improvement. However, it doesnot capture all aspects of poverty, nor the poor’ perspective of it. On the other hand, usingparticipatory analysis to define poverty and the poor is time consuming and by nature a highlylocalised exercise.
2.3.5 Keeping in mind the limitation of using single indicator index, this study relies on the officialdefinition of poor in India.
10
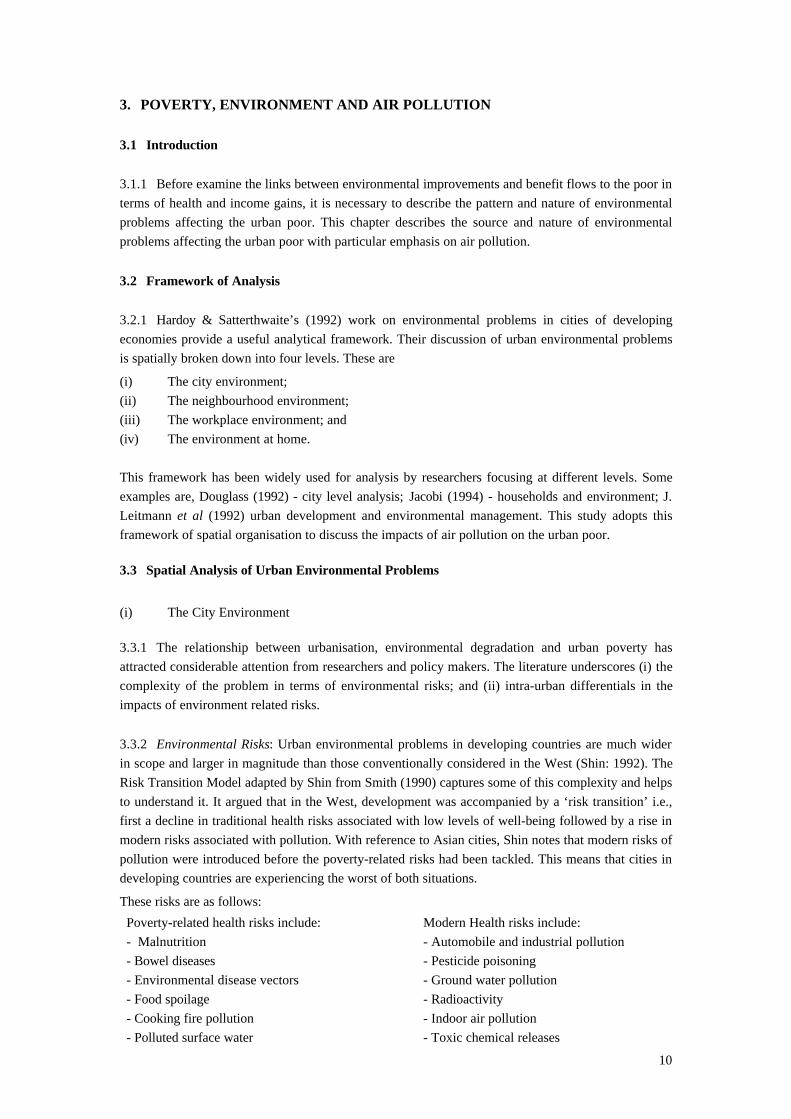
Poverty-related health risks include:- Malnutrition- Bowel diseases- Environmental disease vectors- Food spoilage- Cooking fire pollution- Polluted surface water
3. POVERTY, ENVIRONMENT AND AIR POLLUTION
3.1 Introduction
3.1.1 Before examine the links between environmental improvements and benefit flows to the poor interms of health and income gains, it is necessary to describe the pattern and nature of environmentalproblems affecting the urban poor. This chapter describes the source and nature of environmentalproblems affecting the urban poor with particular emphasis on air pollution.
3.2 Framework of Analysis
3.2.1 Hardoy & Satterthwaite’s (1992) work on environmental problems in cities of developingeconomies provide a useful analytical framework. Their discussion of urban environmental problemsis spatially broken down into four levels. These are
(i) The city environment;(ii) The neighbourhood environment;(iii) The workplace environment; and(iv) The environment at home.
This framework has been widely used for analysis by researchers focusing at different levels. Someexamples are, Douglass (1992) - city level analysis; Jacobi (1994) - households and environment; J.Leitmann et al (1992) urban development and environmental management. This study adopts thisframework of spatial organisation to discuss the impacts of air pollution on the urban poor.
3.3 Spatial Analysis of Urban Environmental Problems
(i) The City Environment
3.3.1 The relationship between urbanisation, environmental degradation and urban poverty hasattracted considerable attention from researchers and policy makers. The literature underscores (i) thecomplexity of the problem in terms of environmental risks; and (ii) intra-urban differentials in theimpacts of environment related risks.
3.3.2 Environmental Risks: Urban environmental problems in developing countries are much widerin scope and larger in magnitude than those conventionally considered in the West (Shin: 1992). TheRisk Transition Model adapted by Shin from Smith (1990) captures some of this complexity and helpsto understand it. It argued that in the West, development was accompanied by a ‘risk transition’ i.e.,first a decline in traditional health risks associated with low levels of well-being followed by a rise inmodern risks associated with pollution. With reference to Asian cities, Shin notes that modern risks ofpollution were introduced before the poverty-related risks had been tackled. This means that cities indeveloping countries are experiencing the worst of both situations.
These risks are as follows:
Modern Health risks include:- Automobile and industrial pollution- Pesticide poisoning- Ground water pollution- Radioactivity- Indoor air pollution- Toxic chemical releases

11
It is pertinent to add that though policy and research focus on major cities, secondary cities suffersimilar problems.
3.3.3 Intra-urban differences: Harvey (1975) noted that urban settlements develop in order to groupenterprises in a cost-effective spatial configuration. Opportunities for work attract people to urbancentres. Cheap housing and industrial activities tend to be located on lower cost land in urban areas.Hardoy, Craincross and Satterthwaite (1992) have shown that this spatial juxtaposition of industrialand low income housing, in conjunction with absence of planning and environmental control, createspecial environmental and health risks for the poor. In other words, in addition to facing povertyrelated environmental risks, the externalities of urban production are also borne disproportionately bythe poor (Wratten: 1995).
3.3.4 According to Hardoy et al (ibid.) 600 million urban residents of the developing countries livein life and/or health threatening homes and neighbourhoods. Some of the risks are diseases associatedwith contaminated water and food, and with overcrowding, poor drainage, poor hygiene. Moreimportantly for this study, respiratory infections related to poor ventilation, indoor and outdoor smokefrom cooking fires; to ambient pollution from industry and traffic; to work place air pollution frominefficient use of resources and poor work practices.
3.3.5 (ii) Neighbourhood Environment
3.3.6 Risk in neighbourhood environment has three principal sources: the site; no collection ofhousehold garbage; and inadequate site infrastructure. Low income housing and squatter settlementstend to locate on land for which there is a relatively low demand. It therefore tends to be prone tonatural disasters like flooding, subsidence, landslides, etc. In other instances it is located near land-fillsites or garbage dumps or in and around industrial areas with high levels of air pollution. Localisedproblems of high levels of air pollution occur more widely, in and around particular type of industrywith high levels of polluting emissions (Dasgupta: 1997). Studies have shown the high levels of leadoxide, suspended particulate matter and other emissions of inefficient combustion in theneighbourhood of lead smelting industries (ibid.), iron foundries (GHK/ODA: 1994) and other metalprocessing units.
3.3.7 Burning of unsorted household garbage (as there is no collection) often contributes to ambientpollution (Surjadi: 1993). Low income workers like street traders are constantly exposed to pollutionfrom vehicular traffic. Also exposed are the squatter settlements under bridges and other availableinfrastructure. However, this study does not examine the effects of vehicular pollution.
3.3.8 (iii) The Workplace Environment
3.3.9 Environmental hazards in workplace are a major problem in cities of developing countries. Thenature of the problem varies with the type and scale of industry. Public sector units and largeindustries with unionised labour are comparatively better off. It is the medium and small industrieswith a weak, disorganised labour force that some of worst working conditions are found. Anyobjections to poor working conditions would probably be at the cost of the workers’ jobs. Moreover,lack of implementation of environmental laws and of health and safety standards, leaves the workershighly exposed to risks of injury, disablement or even death. Once a worker is injured or sick it couldmean loss of livelihood as no provisions are made by employers for compensation or sick pay. A

12
longer term threat to their livelihood opportunities comes from the closure of these units as they areunable to meet the environmental standards.
3.3.10 Pryer (1993) reports from a cross-sectional household survey in Khulna, Bangladesh, that24% of households lost labour days due to illness or accident at work in the month prior to the survey.Pryer also notes that medical expenses were higher than the income lost due to incapacitation fromwage work.
3.3.11 Small and medium industries, officially encouraged because of their employment generationpotential, are involved in manufacturing and processing wide range of materials and chemicals.Experience (Scott: Zimbabwe and Bangladesh: Bartone: Nairobi; Dasgupta: India). shows that inthese small and medium units, even though some of them are high energy users, combustion is not themain source of pollution. High levels of pollution is more attributable to poor work practices andattitude to pollution. This is discussed in detail in the chapter titled ‘Development Perspective andEnergy Efficiency’.
Table 3.1 Examples of Air Borne Toxic Chemicals, Their Use and Their Potential HealthImpacts.Asbestos Roofing insulation, air
conditioning conduits; plastics,fibre; paper
Carcinogenic to workers andeven to family members
Beryllium Ceramic parts; householdappliances
Fatal lung disease: lung andheart toxicity
Lead Pipes, batteries, paints; printingplastic; smelting;
Intoxicant; neurotoxin affectsblood system.
Sulphur dioxide emissions for coal/oilcombustion.
Irritation to eyes and respiratorysystem.
Source: Hardoy and Satterthwaite (1992).
3.3.12 (iv) Environment At Home
3.3.13 The environment at home is conditioned by the presence of pathogens in air and water, lackof drinking water and the presence of air borne pollutants and its rapid transmission because of overcrowding.
3.3.14 Air pollution at home: Where open fires or relatively inefficient stoves are used indoors forcooking and/or heating, smoke or fumes from coal wood or other biomass fuels can cause orcontribute to serious respiratory problems (Hardoy: 1992). According to WHO (1992) chronic effectsinclude inflammation of the respiratory tract which in turn reduces resistance to acute respiratoryinfections, while these infections in turn enhance susceptibility to the inflammatory effects of smokeand fumes. Turner et al (1990) showed the high risk to women who spend two to four hours at thestove using biomass fuels, as they are exposed to carcinogens in the emissions. Children may also beat risk as they remain with their mother. This exposure combined with malnutrition can retardgrowth. Kirk Smith noted that in his recent study (yet to be published) on indoor air pollution inIndia, he had estimated that there were 500,000 in-door pollution related premature deaths.
3.3.15 In Indian cities where kerosene, coal, wood and other biomass are used as domestic fuels, airpollution from domestic stoves is significant (CSE: 1997). Douglass (1992) notes that in Seoul oil and

13
anthracite briquettes used for domestic cooking and heating contribute to high levels of air pollution.In China raw coal is still used by millions in small inefficient stove even though China has hadgreater success than India in disseminating improved stoves (Smith -interview).

14
4. ENVIRONMENT AND HEALTH IMPACTS
4.1 Air Pollution and Respiratory Diseases
4.1.1 A considerable part of epidemiological research is centred on the association betweenrespiratory disease and the environment. This section draws briefly on this research to show thewidespread nature of the problem and to highlight the economic impacts on households of ill health.
4.1.2 In the context of intra-urban disparity, Songsore and McGranahan (1993) note thatunderstanding the relationships between health, environment and urban development is crucial todeveloping environmental health programmes and for improved environmental management. Inmodelling the relationships between environment, health and wealth they argue that morbiditydifferentials (in Accra) are functions of synergistic interaction between environmental risk factors andsocio-economic circumstances. The defence mechanism which ensure protection from environmentalhealth risks is conditioned by household/individual’s access to clean water, sanitation, garbageremoval; access to medical services; adequate nutrition and shelter; and hygiene practice. The poorthus experience greater exposure and have lower ability to protect themselves.
4.1.3 The authors note that it is often difficult to establish the relationship between morbidity ratesand explanatory factors. For example, in Accra, the prevalence of childhood acute respiratoryinfection at 12% was roughly comparable with diarrhoea prevalence, but the association betweenincidence of respiratory problems and explanatory factors were less strong than for diarrhoea. In thecase of respiratory disease it is more difficult to remove ‘statistical noise’. Despite these difficulties,research continues to suggest associations between air pollution and respiratory problems.
4.1.4 A review (Bradley et al: 1992) of environmental health impacts in Third World cities proposedfive environmental factors associated with respiratory disease:
* indoor density* indoor pollution, especially the cooking stove* air pollution in the community* air pollution due to industry* air pollution due to transportation.
4.1.5 They note that acute respiratory infections (e.g., pneumonia) are a major cause of infant andchild death in urban areas although their extent and risk factors associated with them remain poorlyunderstood.
4.1.6 In a study of respiratory disease and environmental factors in households in Jakarta, Surjadi(1995) found that 42.2% of the disease were related to respiratory infections. 33.5% of mothers withrespiratory diseases were from low-income households against 18% from high income households.The study suggests that there is an association between the occurrence of maternal respiratory diseasesand firewood utilisation. Smith’s study (forthcoming) notes that continuous exposure to indoorpollution increase the risk to tuberculosis by two and a half times.
4.1.7. An exercise was undertaken by TERI to demonstrate the effects of indoor pollution on therespiratory system of women. They used two filters to show the difference between clean and pollutedenvironment. On seeing the filters one women asked “Is this the way my lungs look?” It appears that

15
while they are aware that smoke can be harmful, they do not fully appreciate the gravity of theproblem of spending long hours cooking over inefficient stoves in poorly ventilated rooms
4.2 Health and Income
4.2.1 In examining the impact of ill-health on household income and nutrition Pryer (1993) notesthat women and children are severally affected when the male breadwinner suffer incapacitating ill-health. The forgone income and additional medical expenses often lead to greater indebtedness.
4.2.2 In summary, it can be said that respiratory disease attributed to air pollution is widely prevalentamong the poor. Though research continues to suggest strong associations with explanatory variablesit has been very difficult to establish direct links. However, it can be said the respiratory diseasesreduce the ability to withstand other infections and leads to generally poor health. Loss of workingdays due to ill health has direct economic implications in terms of income lost and medical expensesincurred.
Table 4.1 Sources of Air Pollution and Possible Health Impacts.
Pollutant Reason Health impacts SourceCarbon Monoxide Incomplete combustion
of oil, coal and naturalgas and other organicmatter.
Reduces the capacity of theblood to carry oxygen, and inprolonged high concentrationcan cause death.Contributes to headaches andfatigue and aggravates heartand respiratory diseases
Factories andhomes withinefficient heatingand cookingappliances.
Vehicle exhausts
Hydrocarbons Incomplete combustionof fuel by motor vehiclesand evaporation ofindustrial solvents
Injure respiratory system andsome cause cancer.
Motor vehicles andindustry
Oxides of nitrogen High temperature fuelcombustion
Aggravate respiratory andheart diseased; irritate lungswhen dissolved to becomeacid rain.
Motor vehicles,power plants andindustries.
Oxides of sulphur Burning of coal and oilcontaining sulphur
Aggravate respiratory andheart diseased; irritate lungswhen dissolved to becomeacid rain.Irritate eyes and respiratorytract.
Homes, factoriesand power plants.
Suspendedparticulates
Smoke, dust, soot andliquid and other solidparticles suspended inthe air.
Depending on their size andcomposition these can causecancer, aggravate respiratoryand heart diseases.Cause irritation to throat andchest.
Homes, factories,power plants andmotor vehicles.
Source: Hardoy and Satterthwaite (1989) The Squatter Citizen.
16
5. ENERGY USE: TRENDS, PATTERNS AND POLICIES
5.1 Introduction
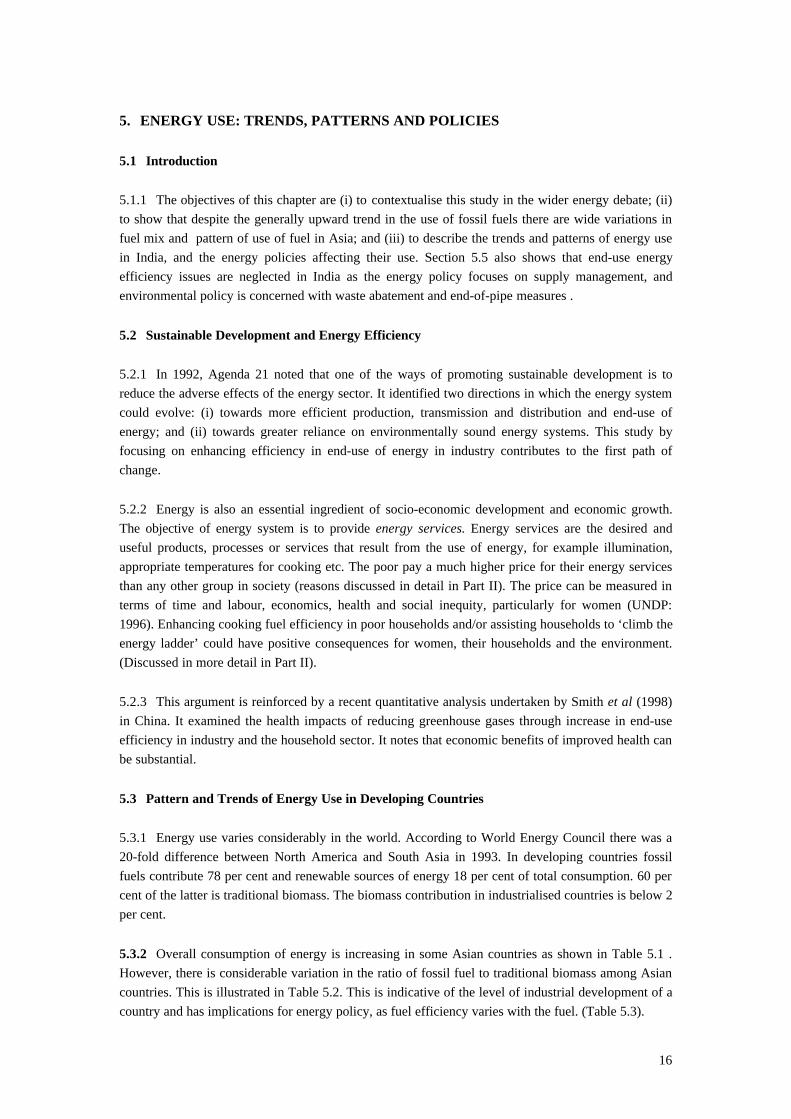
5.1.1 The objectives of this chapter are (i) to contextualise this study in the wider energy debate; (ii)to show that despite the generally upward trend in the use of fossil fuels there are wide variations infuel mix and pattern of use of fuel in Asia; and (iii) to describe the trends and patterns of energy usein India, and the energy policies affecting their use. Section 5.5 also shows that end-use energyefficiency issues are neglected in India as the energy policy focuses on supply management, andenvironmental policy is concerned with waste abatement and end-of-pipe measures .
5.2 Sustainable Development and Energy Efficiency
5.2.1 In 1992, Agenda 21 noted that one of the ways of promoting sustainable development is toreduce the adverse effects of the energy sector. It identified two directions in which the energy systemcould evolve: (i) towards more efficient production, transmission and distribution and end-use ofenergy; and (ii) towards greater reliance on environmentally sound energy systems. This study byfocusing on enhancing efficiency in end-use of energy in industry contributes to the first path ofchange.
5.2.2 Energy is also an essential ingredient of socio-economic development and economic growth.The objective of energy system is to provide energy services. Energy services are the desired anduseful products, processes or services that result from the use of energy, for example illumination,appropriate temperatures for cooking etc. The poor pay a much higher price for their energy servicesthan any other group in society (reasons discussed in detail in Part II). The price can be measured interms of time and labour, economics, health and social inequity, particularly for women (UNDP:1996). Enhancing cooking fuel efficiency in poor households and/or assisting households to ‘climb theenergy ladder’ could have positive consequences for women, their households and the environment.(Discussed in more detail in Part II).
5.2.3 This argument is reinforced by a recent quantitative analysis undertaken by Smith et al (1998)in China. It examined the health impacts of reducing greenhouse gases through increase in end-useefficiency in industry and the household sector. It notes that economic benefits of improved health canbe substantial.
5.3 Pattern and Trends of Energy Use in Developing Countries
5.3.1 Energy use varies considerably in the world. According to World Energy Council there was a20-fold difference between North America and South Asia in 1993. In developing countries fossilfuels contribute 78 per cent and renewable sources of energy 18 per cent of total consumption. 60 percent of the latter is traditional biomass. The biomass contribution in industrialised countries is below 2per cent.
5.3.2 Overall consumption of energy is increasing in some Asian countries as shown in Table 5.1 .However, there is considerable variation in the ratio of fossil fuel to traditional biomass among Asiancountries. This is illustrated in Table 5.2. This is indicative of the level of industrial development of acountry and has implications for energy policy, as fuel efficiency varies with the fuel. (Table 5.3).

17
Table 5.1 Energy Consumption per Capita/Annum, kg oil Equivalent in Selected AsianCountries
Country 1973 1983 1993SourceWorld Bank
1993Source IEA
1996 Trend
China 299 435 632 635 UPIndonesia 87 177 330 366 440 UPIndia 114 157 243 244 293 UPNepal 10 11 22 24 24 -Singapore 1864 2780 5563 9184 9770 UPNote: The International Energy Agency (IEA) estimates for 1993 generally exceed World Bankestimates for the same year. However, there is considerable difference in estimates for Singapore.
Table 5.2 Showing the Trend in use of Traditional Fuel and Fuel Mixin Selected Asian Countries.
Country Traditional Fuels
Petajoules1993
% change1973-93
% of total (all fuels)Consumption in 1993
Bangladesh 277 27 47China 2018 54 6India 2824 58 23Indonesia 1,465 54 36Myanmar 193 48 73Nepal 206 88 92Pakistan 296 101 21Singapore 0 0 0Sri Lanka 89 45 53Source: World Resources 1996-97.
Table 5.3 Comparison of Air Pollutant Emissions in kilograms Per Unit of Energy Delivered.Use and ScaleFuel Efficiency
Amount equivalentto 1 million MJdelivered Particulates
SulphurOxides
NitrogenOxides
Hydro-Carbons
CarbonMonoxide
Industrial (>20 KW)Wood (70%) tonnes 89 500 53 400 400 450Bituminous (80%) tonnes 43 2,800 820 320 22 46Residual oil (80%) litres 33,000 90 1,300 240 4 20Distillate oil (90%) litres 31,000 8 1,100 83 4 19Natural gas (90%) m3 28,000 7 neg. 99 2 8
Source: UNDP (1996)Note: The document did not provide the basis for the data, but due to the magnitude of the efficiencyvalues quoted it is likely that the data are based on net calorific value.

18
5.3.3 In India and China there has been a growing reliance on fossil fuel for industrial use and forpower generation. In Sri Lanka, traditional biomass (see Table 5.2) is still the most importantindustrial fuel. The level of industrial development is relatively low (though it scores well on HumanDevelopment Index) and agro-based industries dominate its industrial structure. It was consideredpertinent to look at a case study which highlights the opportunities for, and constraints to, enhancingenergy efficiency where fuelwood is the dominant industrial fuel.
5.4 Fuelwood and Energy Efficiency Case Study - Sri Lanka
5.4.1 Biomass is the principal domestic and industrial fuel in Sri Lanka and both household andindustrial utilisation of fuelwood in Sri Lanka is very high for South East Asia. Estimated industrialconsumption of fuelwood is 2x10⁶ tonne annually out of a total of 9.5 x 10⁶ tonne (Leach, 1987).
5.4.2 The analysis is built upon the results of a technical study of the atmospheric emissions andthermal efficiencies of typical process plant used in major industries. It reported on 9 fuelwood-firedair heaters used in desiccated coconut and tea industries; and 5 steam boilers fired with fuelwood,coconut shells and sugarcane bagasse (Tariq and Purvis, 1996). These measurements established thefollowing average values for plant performance: emissions of nitrogen oxides (NO and NO2) of 47gNO2/GJ of biomass fuel fired; and thermal efficiency of plant (based on Gross Calorific Value) of50%.
5.4.3 Environmental Legislation In Sri Lanka
5.4.3.1 The major item of legislation relating to industrial pollution is the National EnvironmentalAct, No 47 of 1980 (Government of Sri Lanka, 1980 and 1988). The Act, strengthened and amendedin 1988, established the Central Environmental Authority (CEA). The primary functions of the CEAare the formation, regulation, monitoring and co-ordination of the environmental policy of Sri Lanka.The 1988 amendment prohibits the discharge, disposal or emission of waste without the priorapproval of the CEA. The CEA gives this approval through the issuing of licences.
5.4.3.2 The legislation, in principal, is sufficient to control industrial pollution. However, there areseveral practical constraints that limit effectiveness. These largely relate to the institutional andtechnical capability to fully licence and regulate industry. Other constraints also need to be addressed.In many cases established standards are lacking or inadequate, and where standards exist datacollection is unreliable - often the instrumentation available is limited or not available at all. Thereappear to be few incentives for industry to adhere to the standards since there is no effectiveenforcement mechanism in practice. Authorities in Sri Lanka estimate that 5000 companies requirelicences, but only a quarter of these have been granted. The majority of companies operate without alicence.
5.4.3.3 Although the National Environmental Act is the major item of legislation concerningindustrial pollution, Government environmental priorities are outlined in the National EnvironmentalAction Plan 1992 - 1996 (Government of Sri Lanka, 1991). This is an ambitious programme toaddress a whole range of environmental concerns. The plan covers aspects of forestry, bio-diversity,coastal resources, land and water resources and pollution - urban and industrial.
5.4.3.4 Most discussions of industrial pollution concern water quality, waste abatement andindustrial development in environmentally sensitive areas. In general, these are the areas of highvisual impact laying claim to public concern. The Action Plan gives far less attention to the more

19
ubiquitous environmental impacts of air pollution from industrial combustion processes but there areproposed emissions to air standards for new or modified steam generators.
5.4.4 Energy Use In Sri Lanka
5.4.4.1 Energy Consumption: Figure 5.1 shows energy consumption, by sector, of the economy on anoil equivalent basis. Total energy consumption was approximately 6.1 million tonne oil equivalent(toe) in 1992. The consumption of fuel oil (light oil and residual oil) for industrial purposes was242.5x103 tonne
The household sector is the most important consumer of energy, accounting for 61.6% of totalconsumption, followed by the industrial sector (18.4%) and transportation (14.6%). Total energy useincreased by 27% over the previous decade due to: population growth, economic growth, increases in livingstandards and increased industrial production. Energy use has grown in similar proportions across all sectorsof the economy.
Industry18.4%
Agriculture 0.7%
Commercial4.7%
Transport14.6%
Household61.6%
Figure: 5.1 Energy Consumption (1992) by Various Sectors of Economy asPercentages of Total Annual Consumption of 6.1x10⁶ tonne of oil equivalent (toe)
20
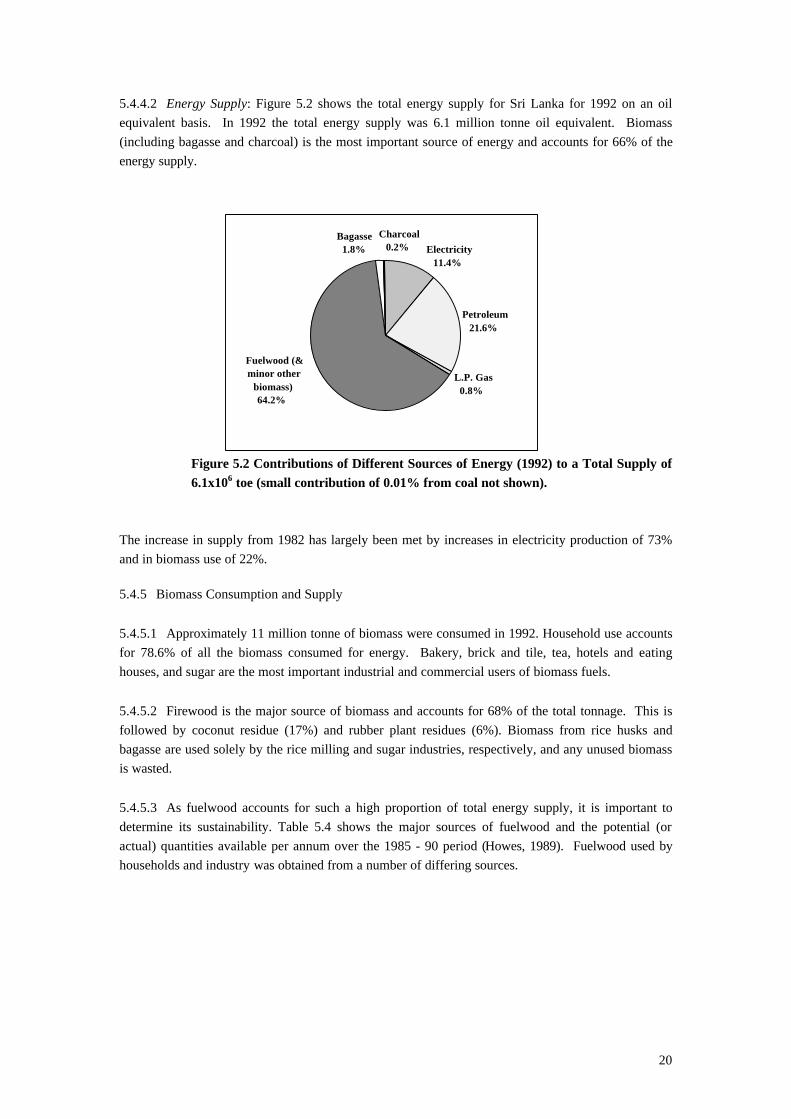
5.4.4.2 Energy Supply: Figure 5.2 shows the total energy supply for Sri Lanka for 1992 on an oilequivalent basis. In 1992 the total energy supply was 6.1 million tonne oil equivalent. Biomass(including bagasse and charcoal) is the most important source of energy and accounts for 66% of theenergy supply.
L.P. Gas0.8%
Petroleum21.6%
Electricity11.4%
Bagasse1.8%
Fuelwood (& minor other
biomass)64.2%
Charcoal0.2%
Figure 5.2 Contributions of Different Sources of Energy (1992) to a Total Supply of6.1x106 toe (small contribution of 0.01% from coal not shown).
The increase in supply from 1982 has largely been met by increases in electricity production of 73%and in biomass use of 22%.
5.4.5 Biomass Consumption and Supply
5.4.5.1 Approximately 11 million tonne of biomass were consumed in 1992. Household use accountsfor 78.6% of all the biomass consumed for energy. Bakery, brick and tile, tea, hotels and eatinghouses, and sugar are the most important industrial and commercial users of biomass fuels.
5.4.5.2 Firewood is the major source of biomass and accounts for 68% of the total tonnage. This isfollowed by coconut residue (17%) and rubber plant residues (6%). Biomass from rice husks andbagasse are used solely by the rice milling and sugar industries, respectively, and any unused biomassis wasted.
5.4.5.3 As fuelwood accounts for such a high proportion of total energy supply, it is important todetermine its sustainability. Table 5.4 shows the major sources of fuelwood and the potential (oractual) quantities available per annum over the 1985 - 90 period (Howes, 1989). Fuelwood used byhouseholds and industry was obtained from a number of differing sources.

21
Table 5.4 Annual Potential Fuelwood Production by Source 1985-1990 (Howes, 1989).Category Fuel Source '000 tonne %Commercial Rubber 2012.1 12.2
Coconut 204.4 1.2Forest 7434.0 45.0Sub-total 9650.5 58.6
Other Fuelwood Home Garden 898.2 5.4Sparsely used Cropland 820.1 5.0Cinnamon 154.0 0.9Shade Trees 151.0 0.9Other 105.0 0.6Sub-total 2128.3 12.8
Other Fuel Home Garden 1270.4 7.7Coconut 2106.6 12.7Palmyrah 330.6 2.0Tea 920.3 5.6Other 131.1 0.8Sub-total 4759.0 28.8TOTAL 16537.8 100.0
5.4.5.4 Commercial wood is the most important source of fuelwood, accounting for 58.4%. Of this,wood from forests is the most significant component accounting for 45% of the total annualproduction. 7.434 million tonne of fuelwood from natural forests was estimated to have been obtainedfrom clear felling of 42000 hectares of dry-zone forests around the Annuradhapura region (Howes,1989). Most of the fuelwood used by the industrial sector is from the "commercial" category.
5.4.5.5 Rubber wood is the most important source of fuelwood used in the industrial sector (49%)followed by natural forest wood (36%). Rubber wood is a particularly important source of fuelwoodfor the rubber (88%), bakery (63%), tea (69%) and hotels/eating houses (64%) sectors. The naturalforest is an important source of fuelwood for the pottery (59%), coconut (88%) and tobacco (74%)industries.
5.4.5.6 Costs of Production: In percentage terms, fuelwood costs are the most important for the brickand tile industries (28% and 27% respectively). For the desiccated coconut and tea industries,fuelwood costs account for 4% of total costs, the major costs being for raw materials - coconut and tearespectively. Fuelwood costs, though, are an important component of the processing costs. A largevariation was reported by factory managers in both the use and cost of fuelwood. In the rice and sugarindustries, the fuel used is generated as a residue from processing the raw material, i.e. rice husk andsugar cane fibre (Bagasse) respectively. The costs of biomass use, therefore, are negligible.
5.4.6 Benefits Of Increased Energy Efficiency Of Industrial Biomass Fuels
Three sets of benefits accrue:
(a) Operational Costs
The results of the plant performance evaluation study carried out in Sri Lanka provided an average thermalefficiency of 50%. The reasons for this low efficiency were identified as (Tariq and Purvis, 1996):
♦ lack of training and understanding of good combustion practice by the supervisors andoperators of the systems;
♦ poor maintenance of combustion plant;

22
♦ use of plant beyond its design capacity;
♦ inadequate drying of fuel;
♦ operation of plant at high excess air levels.
5.4.6.1 Most of these items are remedied by the adoption of operator training and good housekeepingmeasures. There is considerable potential for increasing the thermal efficiency of fuelwoodcombustion systems from the current average of 50% to 70% or more. A gain in efficiency of 20%(from base of 50%) leads to a national fuelwood saving of 40% in the industrial sector.
5.4.6.2 Potential for reductions in annual fuelwood consumption for important industries werecalculated assuming an increase in plant thermal efficiency from 50% to 70% and by including theaverage price of fuelwood, the annual monetary value of savings may be estimated. This is shown inTable 5.5.
Table 5.5. Potential for Annual Fuelwood Savings Over All Industries.
Fuelwood savings at 40%reduction in use, '000 tonne
Fuelwood costRs/tonne
Value of potential fuelwoodsavings, million Rs
676 755 509.9Average cost of fuelwood Rs 490/m³ (Table 8)1 m³ fuelwood = 0.65 tonne
The three important requirements for increasing the efficiency of fuelwood use are:♦ reducing the moisture content of fuelwood by adequate storage;♦ training of factory operators;♦ instrumentation for assessing excess air levels.
5.4.6.3 In the case of the moisture content of fuelwood, storage of fuelwood of 55% moisture contentfor 6-7 weeks in well-ventilated simple structures under ambient conditions would result in fuelsavings of approximately 27%. The capital invested in the buffer store (6-7 weeks supply) would berepaid in approximately 22 weeks through the savings. In most factories, the potential for use of heatin the flue gases for drying of fuelwood exists ( Joseph et al, 1995). A study (World Bank, 1986)calculates a 2.7 year repayment period for heated stores in the tea industry. A major factor in lowefficiencies of the fuelwood-fired appliances was lack of training of the factory personnel. A financialappraisal (Joseph et al, 1995) of the establishment and operation of a nucleus fuel advisory serviceover a five year period shows an internal rate of return (IRR) of 156%. The analysis is based on theassumption that 10% of fuelwood, used in the desiccated coconut and tea industries, is saved. Thebenefits of such an advisory service would not be restricted to the two industries used in the financialanalysis.
5.4.6.4 In addition to the reductions in the use of fuelwood through better efficiencies, furtherreductions are possible by the substitution of fuelwood with residues such as sawdust and rice husks.The beneficial use of these residues for the provision of process heat, therefore, has many advantages.
(b) Forest Resources
5.4.6.5 It is estimated that clear-felling of 42000 hectares of natural forest in Sri Lanka yielded7.434x106 tonne/annum of fuelwood (Howes, 1989). These figures led to a fuelwood yield of 177
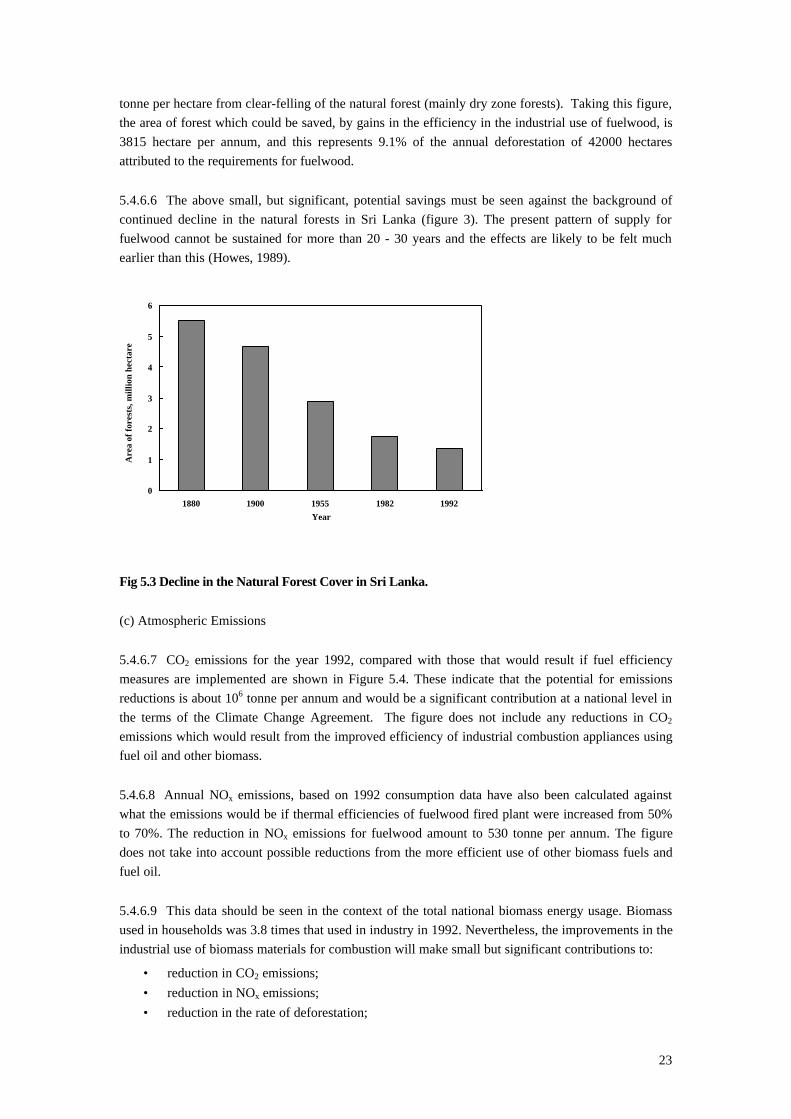
23
tonne per hectare from clear-felling of the natural forest (mainly dry zone forests). Taking this figure,the area of forest which could be saved, by gains in the efficiency in the industrial use of fuelwood, is3815 hectare per annum, and this represents 9.1% of the annual deforestation of 42000 hectaresattributed to the requirements for fuelwood.
5.4.6.6 The above small, but significant, potential savings must be seen against the background ofcontinued decline in the natural forests in Sri Lanka (figure 3). The present pattern of supply forfuelwood cannot be sustained for more than 20 - 30 years and the effects are likely to be felt muchearlier than this (Howes, 1989).
0
1
2
3
4
5
6
1880 1900 1955 1982 1992Year
Are
a of
fore
sts,
mill
ion
hect
are
Fig 5.3 Decline in the Natural Forest Cover in Sri Lanka.
(c) Atmospheric Emissions
5.4.6.7 CO2 emissions for the year 1992, compared with those that would result if fuel efficiencymeasures are implemented are shown in Figure 5.4. These indicate that the potential for emissionsreductions is about 106 tonne per annum and would be a significant contribution at a national level inthe terms of the Climate Change Agreement. The figure does not include any reductions in CO2
emissions which would result from the improved efficiency of industrial combustion appliances usingfuel oil and other biomass.
5.4.6.8 Annual NOx emissions, based on 1992 consumption data have also been calculated againstwhat the emissions would be if thermal efficiencies of fuelwood fired plant were increased from 50%to 70%. The reduction in NOx emissions for fuelwood amount to 530 tonne per annum. The figuredoes not take into account possible reductions from the more efficient use of other biomass fuels andfuel oil.
5.4.6.9 This data should be seen in the context of the total national biomass energy usage. Biomassused in households was 3.8 times that used in industry in 1992. Nevertheless, the improvements in theindustrial use of biomass materials for combustion will make small but significant contributions to:
• reduction in CO2 emissions;• reduction in NOx emissions;• reduction in the rate of deforestation;

24
• reduction in deforestation will contribute towards the security of indigenous fuel supplies;and
• photosynthetic removal of CO2 from the atmosphere.
Major benefits will accrue from efficiency improvements in the use of household fuelwood. However, this isless easily accomplished than in the case of industrial practice.
0.0
0.5
1.0
1.5
2.0
2.5
3.0
3.5
4.0
4.5
Fuel oil Other biomass Fuelwood Total
Current emissions Emissions with efficiency gains
Mill
ion
tonn
e C
O2 /
annu
m
Figure 5.4 Emissions of Carbon Dioxide from Industrial Combustion Sources in Sri Lanka.
5.5 India: Energy in the Policy Context.
5.5.1 There are three points to be made that are pertinent to this study. One, the increasing relianceon fossil fuel as industrialisation is seen as the vehicle for development; two, energy policy in Indiaessentially focuses on supply management; and three, the environmental policy is concerned withwaste abatement rather than increasing resource use efficiency. Consequently, issues relating toenhancing energy efficiency of industrial fuel use receive little attention. This section discusses eachof these in turn.
5.5.2 Energy Consumption in India
5.5.2.1 A major thrust in India’s development planning has been the emphasis on industrialdevelopment. Technology and capital intensive, large scale modern industrial sector was to lead thetransition from agriculture dominated economy to an industrialised economy. Energy was seen ascrucial to this shift and huge public sector investment went into construction of super thermal powerstations and mega-hydroelectric power projects. In acknowledgement of the limited employmentgeneration capacity of the capital-intensive sector, industrial policy encouraged the small and mediumsized industries. Subsidies, cheap credit and land is often made available. The overall impact isincrease in industrial production in units ranging from large scale, modern units to small-scalefactories operating at the margins of technological change. Pertinent to this study is the rapid increasein industrial fuel consumption in industries of all sizes.
5.5.2.2 Since 1951 there has been a growing dependence on energy production from fossil fuels. Thisis illustrated in Fig 5.5. Within fossil fuels there has been a movement away from crude petroleum to

25
coal and to some degree, natural gas (Reidhead et al: 1996). India’s oil production has declinedfollowing the ageing of its oil fields. The production of coal has maintained an annual rate ofapproximately 4.5%. The quality of Indian coal is low (Grade E) and has a very high ash content, i.e.,large emissions of fly ash. Biomass remains an important source of energy as poverty persists andeconomic disparity increases. It is the main household fuel in rural India.
Fig 5.5 Showing Trends in Primary Energy Consumption in India
5.5.2.3 In 1996 India’s per capita per annum energy consumption was 293 kg oil equivalent growingat approximately 4.5% since 1987. In the period between 1985 and 1991 per capita electricityconsumption expanded by 50% (TERI: 1996). Although the share of biomass in the total energy mixhas fallen from 40% in 1984 to 30% in 1993, the net consumption of biomass has grown by 15% since1984.
5.5.2.4 The impact on the environment of increase in fossil fuel use in India is well documented.However, it is pertinent to note some of its salient features. The dominant source of urban pollution inurban India is vehicular pollution. A study by the Central Pollution Control Board shows that in Delhiindustries (large and small) contribute 29% to the total air pollutant emissions (see fig 5.5).
Fig 5.6 Showing Total Air Pollutant Emissions in Delhi
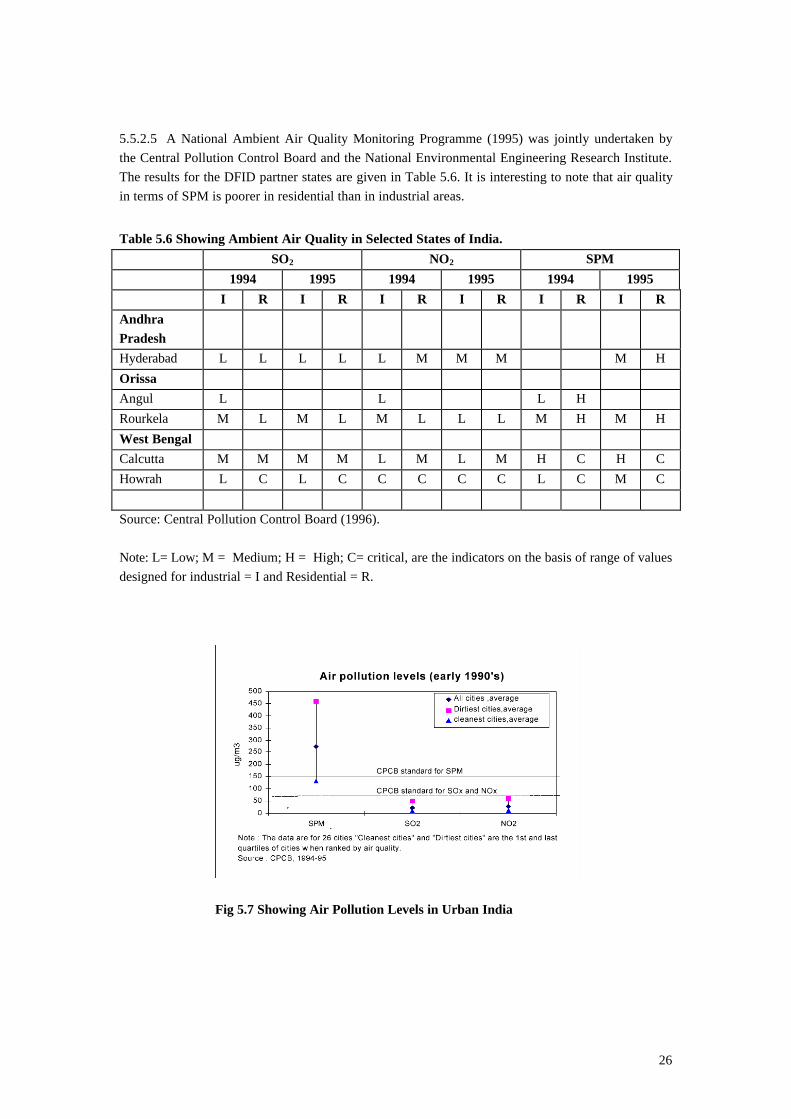
26
5.5.2.5 A National Ambient Air Quality Monitoring Programme (1995) was jointly undertaken bythe Central Pollution Control Board and the National Environmental Engineering Research Institute.The results for the DFID partner states are given in Table 5.6. It is interesting to note that air qualityin terms of SPM is poorer in residential than in industrial areas.
Table 5.6 Showing Ambient Air Quality in Selected States of India.SO2 NO2 SPM
1994 1995 1994 1995 1994 1995I R I R I R I R I R I R
AndhraPradeshHyderabad L L L L L M M M M H
OrissaAngul L L L HRourkela M L M L M L L L M H M H
West BengalCalcutta M M M M L M L M H C H CHowrah L C L C C C C C L C M C
Source: Central Pollution Control Board (1996).
Note: L= Low; M = Medium; H = High; C= critical, are the indicators on the basis of range of valuesdesigned for industrial = I and Residential = R.
Fig 5.7 Showing Air Pollution Levels in Urban India

27
5.5.3 India’s Energy Policy:
5.5.3.1 There are three points to be made that are relevant to this study. (i) The over-emphasis onsupply management; (ii) tensions arising from different policies within the energy sector; and (iii)impact of subsidies.
5.5.3.2 Supply management: As in most developing countries the paradigm driving energy policy inIndia is that energy production has to be increased to industrialise, and to improve the livingstandards of their population. This is addressed by expanding the supply base. The emphasis was/is onthermal and hydro-electric power generation. However, recent years have seen major initiatives inrenewable energy development. According to the World Watch Institute (1998) India has beenrecognised as a new “wind superpower’ ranking fourth in the world in respect of wind power installedcapacity. It has the second largest capacity to manufacture photovoltaic crystalline modules.According to Naidu (1998) India’s programme of renewable energy development is reported as thesecond most extensive in the developing countries, next only to China. Despite these developments thefocus is still on supply management.
5.5.3.3 Reddy (1998) notes that little progress has been achieved in India with regard to demand sidemanagement and end-use efficiency improvements. He argues that decision makers are still largelyunfamiliar with the view that energy services, rather than consumption, should be the real objective ofenergy planning and programmes. Furthermore, that energy services can often be advanced equallywell by demand side management and end-use efficiency improvements as by increases in supply. Mr.Sonkar, Joint Advisor - Power Sector, in the Planning Commission, agreed that little has been done atthe policy level to address the question of demand management. He admitted that it was a politicallysensitive issue.
5.5.3.4 International Energy Initiative, the NGO based in Bangalore, had made attempts to informdecision makers in the energy sector in Karnataka. They concluded that it is far more difficult to sell aparadigm shift than concrete projects. In their second foray they targeted a wider audience, whichincluded politicians, other NGOs and quasi government organisations. The impact has beenheightened awareness of demand side management, though little has been achieved in terms of policy.The policy emphasis at state and national levels show a pre-occupation with energy production andconsumption.
5.5.3.5 Tensions within the energy sector: There is no single ministry at the central government levelto oversee the energy sector. There are separate ministries for Power, for Petroleum and Natural Gas,for Coal and for Non-Conventional Energy Sources. The only body with an overview is the PlanningCommission. It was therefore decided by this study team to meet the Energy Advisor in the PlanningCommission. At a joint meeting with the Advisor’s deputies in charge of power and petroleum and ofcoal, it emerged that while the power sector was moving ahead with de-regulation and privatisation,other sectors were slowing down the process. For example, the de-regulation of different types of coalis proceeding at different paces. This has implications for initiatives to increase efficiency of fuel use.
5.5.3.6 Cross subsidies: There is a complex system of cross subsidies. Petroleum has been freed upfrom the Administrative Price Mechanism and is linked to the international price. However, it isheavily taxed and the earnings are used to subsidise other items like kerosene and diesel. Kerosene issubsidised as a ‘poor man’s fuel’. The present level of subsidy is 50% and kerosene is available atgovernment distribution shops for Rs 2-3 per litre. Over a period of time this subsidy will eventually

28
be reduced to 15%. This will have considerable impact on poor and low income households who haveshifted to kerosene as a cooking fuel.
5.5.3.7 Additional problems of comparatively cheaper diesel and kerosene are that diesel is used toadulterate petrol and kerosene is used to adulterate diesel. Both these have implications for vehicularrelated air pollution.
5.5.4 Environmental Policy in India
5.5.4.1 India was a participant of the United Nations Conference on Human Environment in 1972which requested all attendees to adopt comprehensive legislation addressing environmental and healthand safety issues. The Water (Prevention and Control of Pollution) Act was passed in 1974. The Actalso established the Pollution Control Boards at central government and state government levels. TheAir (Prevention and Control of Pollution) Act was passed in 1981 to provide for the prevention,control and abatement of air pollution. Following the Act, The Central Board set the national ambientair standards. In addition, the state boards were given the power to legally restrain polluters fromexceeding specified standards. Subsequent to the Bhopal accident The Environment Protection Actwas passed in 1986. The Act gave even greater powers to the environmental agencies and the Ministryof Environment and Forestry was designated as the lead agency for administration and enforcement.
5.5.4.2 Despite these powers, enforcement of standards have been weak, apathetic and ad-hoc.However, increasing environmental activism since the early 1990s and the spurt of legal actionagainst deviant behaviour by individuals and NGOs have forced the environmental agencies to bemore active. The response of the judiciary has been to allow limited time (often unrealistic) to maketechnological changes and/or to install pollution abatement equipment or face closure. The emphasishas been on end-of-pipe measures, for example, installing cyclones, bag filters, increasing thechimney stack height etc., instead of using cleaner technology and improving work practices.Furthermore, the central effluent treatment plant is seen as a panacea to the problems of industrialeffluents. A case study of Delhi (Dasgupta 1998) highlighted the ad-hoc nature of the present strategy.It was observed that factories, if located in any one of the 28 industrial estates, had to contribute to theconstruction of a central effluent treatment plant, irrespective of the fact that they produced noeffluents.
5.5.4.3 Pushing end-of-pipe measures is reinforcing a perception that industry has little to gain fromimproved environmental management. The UNEP’s project to demonstrate the benefits of wastemanagement to small and medium industries underscores this point (DESIRE 1996). Additionally, thesanction based approach adopted in India, limits the scope for developing network for informationexchange or for developing public-private partnerships. Despite these difficulties efforts are beingmade by some agencies to tackle the problem in the small industries sector (discussed in Part III).Thailand has since late 1980s shifted towards a compliance-based approach, embodying the ‘carrotand stick’ principle (Kritiporn 1990) and has had greater success in assisting small industries to cleanup.
5.5.4.4 To sum up, in India the issues related to end-use fuel efficiency receive much less attentionthan they deserve. Though the need for demand side management has been voiced by many, littlechange can be observed at the policy level. The experience of developed countries shows thatenvironmental legislation and strict monitoring for pollution abatement do not create sufficientconditions for improving energy efficiency. Dedicated programmes for enhancing energy efficiencyare required.

29
5.6 Need for Policy Emphasis on End-Use Efficiency: Lessons from UK
5.6.1 The experience in UK has some useful lessons for end-use energy management. It highlightsthe importance of
♦ information dissemination and awareness raising;♦ energy efficiency specific initiatives and advice in the initial stages; and♦ energy policy initiatives receiving the support of environmental agencies. This section briefly describes some of programme elements.
5.6.2 Best Practice Programme: In the UK, new government programmes for energy efficiency wereintroduced in the mid-1970s. These evolved into the Best Practice programme run by the Departmentof Energy. It later came under the responsibility of the Department of Trade and Industry and iscurrently under the Department of Environment. The Energy Technology Support Unit (ETSU) hasmanaged it on their behalf in industry and the Building Research Energy Conservation Support Unit(BRECSU) in buildings-related areas. Projects receive financial support, energy savings andperformance are monitored by independent experts, and results are published along with a range ofsupporting activities, including events, seminars, etc., to insure that the material is brought to theattention of appropriate decision makers.
5.6.2.1 The programme has four elements:
(i) Energy Conservation Guides, which survey energy use across a particular sector of industry on anunattributable basis. This information enables managers to compare energy use in their own sitewith other companies in the same business an identify areas where savings can be made.
(ii) Good Practice, which highlights energy efficient techniques already in use via Case StudyBrochures and Good Practice Guides. The guides give detailed information and advice on how toimplement proven energy saving measures.
(iii) New Practice, which supports 'first of a kind' projects where technology or the application is new.An independent consultant monitors projects. Leaflets and detailed reports on the results arepublished and distributed.
(iv) Future Practice, which supports joint ventures developing the energy efficient measures oftomorrow. Leaflets and reports on the research are freely available.
5.6.2.2 In order to promote this programme regional energy efficiency centres were also set-up. Alsoas the potential for industrial savings were recognised specialist commercial organisations entered themarket and took over much of the promotion and execution of the programme.
5.6.3 Environmental Programmes: As time has gone by there have been new energy savinginitiatives with increasing environmental support for such work. In 1992, the Department ofEnvironment, Transport and Regions created the Energy Savings Trust. This was set up with a briefto reduce carbon emissions by 10 M tonne/year. There has also been legislation in this area with thepassing of the Home Energy Conservation Act in 1995 so that now local authorities haveresponsibilities for energy performance of all housing in their areas. This has resulted in many local

30
centres for advice particularly on domestic energy saving. There are also NGO organisations that areactive, including the National Energy Foundation and the Association for the Conservation of Energy.
5.6.3.1 The overall picture has been that awareness in the industrial scene was created to the extentthat there was a high level of commercial activity that took this forward under business energymanagement schemes. This has resulted in the creation of so-called energy service companies, ESCOsand a relatively lower level of government funding. By contrast, in the domestic area, whilst thesupport mechanisms from government encourage commercial involvement there is an expectation thatgovernment support in this sector needs to increase. However there is an active debate on the level andmanner of investment that is necessary to achieve the impact that is sought. This has been highlightedby the need to meet Kyoto targets and it is recognised that this will require a strategy across the wholeeconomy.
5.6.4 EC and Other Programmes: In parallel to this UK activity there have been an increasingnumber of EC based schemes that support energy efficiency. In the industrial sector one notableexample has been the THERMIE programme which supports demonstration projects for rationale useof energy. In addition there are other active EC organisations, most notably the extensive OPETNetwork (Organisations for Promotion of Energy Technologies). The UK participates and benefits inthese activities through its membership in the EU. The UK also is involved in an informationdissemination scheme, CADDETT, which is run through the International Energy Agency. This isnow available on the Internet and, increasingly, information for all promotion mechanisms will nowbe made accessible in this manner.
5.6.5 Relevance of UK Programmes to Developing Countries: Any attempts at transposing theexperience of the UK or other developed countries to developing countries will need to be done withdue regard to the current situations and capabilities in those countries. The developmental processesfor transfer in different industrial sectors and domestic sectors may not be amenable to the sameapproach. In India, the very large scale of small to medium scale enterprises organisations is uniqueand will present a particular challenge. There will need to be assessment in partnership withparticipating professional workers in these countries.

31
PART II
THE HOUSEHOLD SECTOR

32
6. HOUSEHOLD FUEL USE AND POVERTY IMPACTS
6.1 Introduction
6.1.1 Part II focuses on the links between energy use in the domestic sector and poverty. These links areexamined within the analytical framework of the integrated development approach. Efforts to design andintroduce improved cooking stoves for rural and urban use are long-standing. There have been a largenumber of stove programmes in many different countries in Asia and Africa, which go back severaldecades. While these programs have included the promotion of improved stoves using a range ofdifferent fuels, the focus has tended to be on biomass fuels and in particular wood stoves. Theexperiences of these programmes have also been relatively well documented, and considerable effortshave been made to analyse reasons for success or failure of different projects. Lessons learnt have beenbrought together in a number of practical guidelines, which provide guidance on approaches to appraisal,design, testing, evaluation and dissemination of stoves. There is a wealth of knowledge anddocumentation on stove programmes on which Part II has been able to draw.
6.1.2 In addition to the review of the extensive literature, a case study which included one week of in-country fact finding was conducted on the domestic energy sector in urban areas in India, with a focus onDelhi and Calcutta. This was seen as a valuable part of the research, since it permitted the exploration ofa particular situation in more depth. It also enabled collection of up-to-date information and analyses onthe urban domestic energy situation and current initiatives in India from literature not available in theUK. Findings from the case study indicated that the situation in Delhi was in some ways typical of thebig metropolises and other mega-cities with respect to domestic energy characteristics because a highproportion of commercial fuels (kerosene, LPG) are used. Saxena et al (1996) estimates that commercialenergy accounts for 53% of energy use by lower income groups in urban India. In Delhi slums, thisfigure varied between 56% and 67% (TERI: 1993). A number of useful lessons can be drawn from thecase study findings that are of general relevance to domestic energy policy for the urban poor. It has beenpossible to draw up a number of preliminary recommendations for future (DFID) urban domestic sectorinitiatives in India.
6.1.3 This chapter explores links between energy and poverty at the household level. It first describesthe pattern and trends in energy use and supply. It examines energy-poverty links within the integrateddevelopment approach and then assesses how improvements in energy efficiency can benefit poorhouseholds.
6.1.4 Chapter 7 looks at India in more detail. It analyses the characteristic of the poor households in theslums; notes the types of fuel use and the shift up the energy ladder; and concludes with a critique ofgovernment policies affecting energy use by the urban poor.
6.1.5 Chapter 8 looks at the problems associated with energy use in poor urban households, and therange of options for addressing these problems. Improved energy efficiency measures constitute one setof options. Although there is considerable variation in types of fuel used, and despite the general shifttowards petroleum-based fuels, many poor households still rely heavily on biomass fuels as a source ofenergy for cooking, heating and light. Given this situation, two key strategies for improving energyefficiency are (i) the introduction of improved biomass stoves, and (ii) the encouragement of a switch tomore heat-efficient fuels (moving up the “energy ladder”). These two options are therefore addressed insome detail, with a review of the advantages, disadvantages, and key lessons learnt from past experiences

33
of fuel-switching and urban stove programmes.
6.1.6 For a short study of this nature, it was difficult to provide more than a cursory overview of theknowledge base, and the risk of duplicating existing work was also recognised. With these constraints inmind, this chapter has been structured to provide a clear “guide” of the key documents and institutionswith expertise in the area, rather than to go into detail on any one issue. Two essential sections aretherefore section 8.6 giving “Key References and Contacts” and Appendix A which providesGuidelines for Designing, Developing, Monitoring and Evaluating Household Energy Interventions.
6.2 The Problems: Links between Energy and Poverty at the Household Level
6.2.1 The urban poor and household energy use: setting the scene
6.2.1.1 The household sector accounts for a large proportion of energy consumption in developingcountries, compared to industrialised countries, with the domestic sector accounting for over 75% of totalenergy consumption in some African countries (Gopalan: 1990). Domestic consumption accounts for39% of total consumption in India. Most of the energy consumed is used for cooking, followed by spaceheating/cooling and lighting. Table 6.1 gives a break-down of household fuel use and shows the variationin fuel use with economic groups in Pakistan.
6.2.1.2 On the supply side, household fuel sources in many developing countries are still characterisedby the dominance of biomass fuels (wood, crop residues and animal droppings, often referred to as non-commercial fuel). While middle and higher income groups in urban areas and affluent households inrural areas are more likely to use more efficient, non-traditional fuels such as kerosene and liquidpetroleum gas (LPG) for cooking, and electricity for lighting, the majority of the rural population andlower income groups in urban areas still rely heavily on biomass fuels. A study in Zimbabwe consideredthat wood was likely to remain the fuel choice of the poorest urban sector as they obtain wood throughcollecting rather than purchase. Urban poor people will only switch to other fuels when the opportunitycosts of collection becomes too high, when deforestation is much further advanced or when their incomelevels rise (Campbell and Mangono: 1994). In India this has already started to occur. A survey conductedby the National Council of Applied Economic Research (NCAER: 1985) to compare fuel use by differentincome groups in urban areas showed that in 1977/78 66% of fuel consumption in the lowest incomegroup was from biomass fuels, compared to just over 15% in the highest income group. By 1992 thesituation had changed with non-commercial energy meeting just over 47% of fuel consumption by thelowest income group and 2.5% in the highest income group (TERI: 1993).

34
Table 6.1 Fuels Used by Poor and Rich Households (HH) in Pakistan for Various Purposes.
Fuels and Uses % of Poor HH % of Rich HHCookingGas (Natural Gas/LPG) 3.1 36.4Electricity 0.0 2.3Kerosene 6.7 18.7Charcoal and CoalBiomass Fuels 91.4 60.9Cooking inside the house 34.3 27.8Inside with no chimney 87.9 74.6
Space HeatingGas (Natural Gas/LPG) 0.1 3.8Electricity 0.1 4.4Kerosene 0.7 0.5Biomass Fuels 27.4 19.6
Water HeatingGas (Natural Gas/LPG) 2.3 22.4Electricity 0.0 1.6Kerosene 1.4 5.6Biomass Fuels 23.0 25.9
LightingElectricity 57.4 80.9Kerosene 81.2 55.51. Biomass is wood, dung, wheat, straw, coconut shell, cotton sticks, rice hull, corn husk, bagasse,tobacco husk and other biomass.
2. Poor households are households in the lowest quintile of the distribution of householdexpenditure (1st quintile). Rich households are households in the highest quintile of thedistribution of household expenditure (5th quintile).
Source: (Pakistan LSMS, 1991) in Energy After Rio: Prospects and Challenges, UNDP (1995)
Table 6.2 Pattern of Fuel Consumption by Urban Income Groups in India1977/78 1992
Income group Commercial(%)
Non-commercial
(%)
Commercial(%)
Non-commercial
(%)Up to Rs. 3,000/ month 33.9 66.1 52.8 47.2Rs. 3,000-Rs. 6,000/month 55.0 45.1 92.5 7.5More than Rs. 6,000/month 72.2 27.8 97.5 2.5Source: NCAER: 1985; TERI: 1993
6.2.1.3 There are however, a number of important differences in fuel use between the urban poor andtheir rural counterparts. In the first place, whereas crop and animal residues are important fuel sources inrural areas, fuelwood is the predominant biomass fuel used by urban households. For example, fuelwood
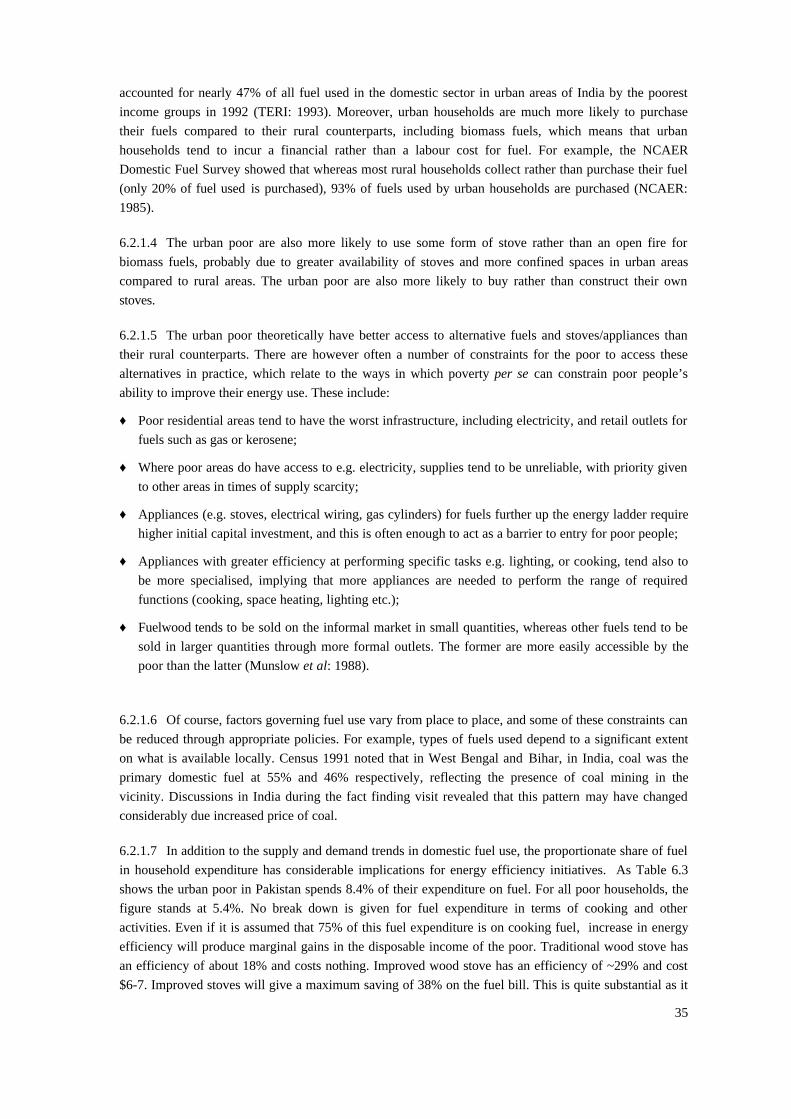
35
accounted for nearly 47% of all fuel used in the domestic sector in urban areas of India by the poorestincome groups in 1992 (TERI: 1993). Moreover, urban households are much more likely to purchasetheir fuels compared to their rural counterparts, including biomass fuels, which means that urbanhouseholds tend to incur a financial rather than a labour cost for fuel. For example, the NCAERDomestic Fuel Survey showed that whereas most rural households collect rather than purchase their fuel(only 20% of fuel used is purchased), 93% of fuels used by urban households are purchased (NCAER:1985).
6.2.1.4 The urban poor are also more likely to use some form of stove rather than an open fire forbiomass fuels, probably due to greater availability of stoves and more confined spaces in urban areascompared to rural areas. The urban poor are also more likely to buy rather than construct their ownstoves.
6.2.1.5 The urban poor theoretically have better access to alternative fuels and stoves/appliances thantheir rural counterparts. There are however often a number of constraints for the poor to access thesealternatives in practice, which relate to the ways in which poverty per se can constrain poor people’sability to improve their energy use. These include:
♦ Poor residential areas tend to have the worst infrastructure, including electricity, and retail outlets forfuels such as gas or kerosene;
♦ Where poor areas do have access to e.g. electricity, supplies tend to be unreliable, with priority givento other areas in times of supply scarcity;
♦ Appliances (e.g. stoves, electrical wiring, gas cylinders) for fuels further up the energy ladder requirehigher initial capital investment, and this is often enough to act as a barrier to entry for poor people;
♦ Appliances with greater efficiency at performing specific tasks e.g. lighting, or cooking, tend also tobe more specialised, implying that more appliances are needed to perform the range of requiredfunctions (cooking, space heating, lighting etc.);
♦ Fuelwood tends to be sold on the informal market in small quantities, whereas other fuels tend to besold in larger quantities through more formal outlets. The former are more easily accessible by thepoor than the latter (Munslow et al: 1988).
6.2.1.6 Of course, factors governing fuel use vary from place to place, and some of these constraints canbe reduced through appropriate policies. For example, types of fuels used depend to a significant extenton what is available locally. Census 1991 noted that in West Bengal and Bihar, in India, coal was theprimary domestic fuel at 55% and 46% respectively, reflecting the presence of coal mining in thevicinity. Discussions in India during the fact finding visit revealed that this pattern may have changedconsiderably due increased price of coal.
6.2.1.7 In addition to the supply and demand trends in domestic fuel use, the proportionate share of fuelin household expenditure has considerable implications for energy efficiency initiatives. As Table 6.3shows the urban poor in Pakistan spends 8.4% of their expenditure on fuel. For all poor households, thefigure stands at 5.4%. No break down is given for fuel expenditure in terms of cooking and otheractivities. Even if it is assumed that 75% of this fuel expenditure is on cooking fuel, increase in energyefficiency will produce marginal gains in the disposable income of the poor. Traditional wood stove hasan efficiency of about 18% and costs nothing. Improved wood stove has an efficiency of ~29% and cost$6-7. Improved stoves will give a maximum saving of 38% on the fuel bill. This is quite substantial as it
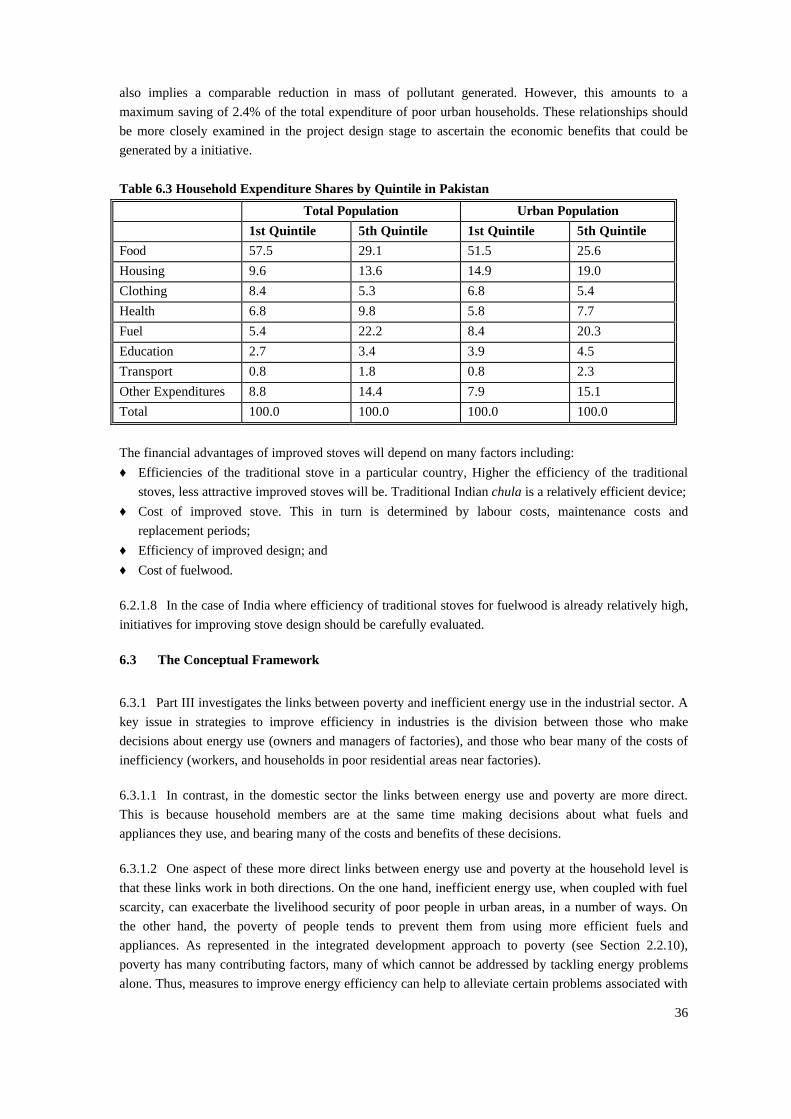
36
also implies a comparable reduction in mass of pollutant generated. However, this amounts to amaximum saving of 2.4% of the total expenditure of poor urban households. These relationships shouldbe more closely examined in the project design stage to ascertain the economic benefits that could begenerated by a initiative.
Table 6.3 Household Expenditure Shares by Quintile in Pakistan
Total Population Urban Population1st Quintile 5th Quintile 1st Quintile 5th Quintile
Food 57.5 29.1 51.5 25.6Housing 9.6 13.6 14.9 19.0Clothing 8.4 5.3 6.8 5.4Health 6.8 9.8 5.8 7.7Fuel 5.4 22.2 8.4 20.3Education 2.7 3.4 3.9 4.5Transport 0.8 1.8 0.8 2.3Other Expenditures 8.8 14.4 7.9 15.1Total 100.0 100.0 100.0 100.0
The financial advantages of improved stoves will depend on many factors including:♦ Efficiencies of the traditional stove in a particular country, Higher the efficiency of the traditional
stoves, less attractive improved stoves will be. Traditional Indian chula is a relatively efficient device;♦ Cost of improved stove. This in turn is determined by labour costs, maintenance costs and
replacement periods;♦ Efficiency of improved design; and♦ Cost of fuelwood.
6.2.1.8 In the case of India where efficiency of traditional stoves for fuelwood is already relatively high,initiatives for improving stove design should be carefully evaluated.
6.3 The Conceptual Framework
6.3.1 Part III investigates the links between poverty and inefficient energy use in the industrial sector. Akey issue in strategies to improve efficiency in industries is the division between those who makedecisions about energy use (owners and managers of factories), and those who bear many of the costs ofinefficiency (workers, and households in poor residential areas near factories).
6.3.1.1 In contrast, in the domestic sector the links between energy use and poverty are more direct.This is because household members are at the same time making decisions about what fuels andappliances they use, and bearing many of the costs and benefits of these decisions.
6.3.1.2 One aspect of these more direct links between energy use and poverty at the household level isthat these links work in both directions. On the one hand, inefficient energy use, when coupled with fuelscarcity, can exacerbate the livelihood security of poor people in urban areas, in a number of ways. Onthe other hand, the poverty of people tends to prevent them from using more efficient fuels andappliances. As represented in the integrated development approach to poverty (see Section 2.2.10),poverty has many contributing factors, many of which cannot be addressed by tackling energy problemsalone. Thus, measures to improve energy efficiency can help to alleviate certain problems associated with

37
its use, but such measures, however well designed and targeted, will not have a significant impact onreducing poverty unless they are part of a wider, integrated programme aimed at tackling thedeterminants of poverty.
6.3.1.3 Moreover, in order to realise the potential poverty impacts of measures to improve energyefficiency, it is essential to recognise that improved energy efficiency is not a developmental aim in itself,but rather a means of achieving a range of different developmental objectives. These include improvednutritional status, reduced risk of respiratory and skin diseases, increased income, reduced costs of living,reduced drudgery due to less time spent on collecting fuelwood, increased chances of education. In orderfor improved energy efficiency initiatives to have a poverty impact, they need to consciously target thedevelopmental objectives of poor people. Furthermore, it needs to be explicitly recognised that there arecircumstances where efficiency measures will not be an appropriate tool to apply, and that energyefficiency measures will have different developmental or poverty impacts in different situations. If energyefficiency measures are to have a real impact on poverty, the developmental objectives of the targetgroups of poor people need to be clearly defined from the outset., The “success” of interventions needs tobe based on the extent to which they meet these developmental objectives. The evaluation of energyefficiency interventions, such as improved stove programmes, have in the past tended to focus onimprovements in technical efficiency and mass adoption rates. It is important to recognise that neither ofthese measures per se, are indicators of success in terms of poverty impact.
6.3.1.4 The measures of poverty impact could be (i) the savings in the fuel bill following the use ofimproved stoves; (ii) proportion of low income group to total number of new adoptees; (iii) proportion ofstoves in use among the poor after measuring the drop-out rate; and (iv) the extent to which the expectedbenefits, as defined by the target group, are met.
6.3.1.5 It is therefore important to broaden the scope of the discussion, from looking at links betweenenergy efficiency and poverty per se, to investigating the range of developmental problems that energyefficiency initiatives aim to address. A review of development programmes aimed at improvinghousehold energy efficiency reveals a range of developmental objectives. These can be divided into thosethat aim to alleviate problems associated with fuel scarcity on the one hand, and those that wish toreduce health impacts of pollution from inefficient combustion on the other. The reason for separatingthese two categories of impacts is that each category has a different range of potential managementoptions associated with it, as presented in Chapter 8. We will investigate each of these categories in turn.
6.3.2 Poverty impacts of fuel scarcity
6.3.2.1 The are a range of poverty impacts associated with fuel scarcity and/or high costs of obtainingfuel. These are reviewed briefly below.
1. Financial costs
6.3.2.2 Poor people tend to spend a larger proportion of their incomes on fuel than do wealthierhouseholds, which reflects the tendency for poorer people to spend relatively more on meeting “basicneeds”. In India, for example, results from the National Sample Survey (38th Round) 1983-84 showedthat in urban areas, whereas the wealthiest of six expenditure groups spent only 4% of their disposableincome on fuel and lighting, the lowest expenditure group spent 12% of their income on meeting thesame needs (Gopalan: 1990). In Pakistan the pattern seems the reverse (Table 6.3). Another reason whyis that they tend to pay higher costs per unit energy, both because they use less efficient fuels, andbecause their limited cash resources at any one time means that they tend to be restricted to buying small

38
amounts of fuel frequently, which usually incurs higher per unit costs. The financial costs of fuel arefurther exacerbated where increasing fuel scarcity or other factors are leading to high rates of inflation infuel prices. Overall expenditure on energy tends to increase, however, as incomes rise (TERI: 1993).
2. Labour costs
6.3.2.3 Large amounts of time and energy spent on collecting biomass fuels is often seen as a keyproblem that can be addressed by improved domestic energy efficiency. In most cultures these costs tendto be borne disproportionately by women and children. However, in urban areas fuel costs are generallyfinancial rather than labour costs, so this is less of a critical issue in terms of the parameters of this study.
3. Health costs
6.3.2.4 Fuel scarcity can lead to a number of household coping strategies which may threaten hygieneand nutritional standards in the home, which can lead to deterioration in the health of householdmembers. In terms of nutritional status, household responses to fuel scarcity may include any of: reducedcooking times, re-heating of leftovers, switching to quicker cooking but less nutritious foods, and/orswitching to more expensive pre-prepared/cooked foods. Any of these strategies may lead to adeterioration of the nutritional status of some or all household members. In societies like India, studieshave shown that women and female children are most likely to bear the costs of such coping strategies.Fuel scarcity may also lead to a fall in levels of hygiene due to drinking water not being boiled, orwashing water not being heated, which can both increase health risks.
4. Security costs
6.3.2.5 There a number of reports which show that the risk of rape or other assault is considered animportant cost by women and children who have to travel far to secluded woodlots etc. to collect theirfuelwood (see e.g. Lugemwa: 1992, in Boiling Point Issue 27). However, again, this issue may be lessrelevant for urban households, since they tend to buy rather than collect their fuel or collect wood frommore public places
6.3.3 Health problems associated with inefficient combustion of fuels
6.3.3.1 Inefficient combustion leads to a larger range and concentration of pollutants in smoke, whichcan cause a range of serious health problems. Moreover, women, children and old people tend to sufferthe most from these health problems, since they spend the most time indoors, and near the fire or stove.The significance of health impacts due to pollution from domestic stoves and fires is underpinned byevidence from some studies that health risks from indoor air pollution are much higher than those fromoutdoor pollution (see e.g. Smith: 1991). A recent study has shown a link between pollution from indoor-cooking by the poor and some health problems (Sharma et al , 1998). The range of possible healthimpacts of pollutants from inefficient combustion of biomass fuels are summarised in Table 6.4 below.However, it is pertinent to note that in certain countries a majority of woodfuel user cook outdoors. Forexample, these figures stands at 66% in Pakistan and 67% in India. Those cooking indoors are likely tobe concentrated in colder regions.

39
Table 6.4 Summarising the Health Effects of Biomass Fuel Use in Cooking Processes Potential Health Hazards PRODUCTION Processing/preparing dung cakes Charcoal production
Faecal/oral/enteric infections; skin infections CO/smoke poisoning; burns/trauma; cataract
COLLECTION Gathering/carrying fuelwood
Trauma; reduced infant/child care Bites from venomous reptiles/insects Allergic reactions; fungus infections Severe fatigue; muscular pain/back pain/arthritis
COMBUSTION Effects of smoke Effects of toxic gases (CO) Effects of chronic smoke inhalation Effects of heat Ergonomic effects of crouching over stove Effects of location of stove (on floor)
Conjunctivitis. Blepharo conjunctivitis; Upper respiratory irritation/inflammation Acute respiratory infection (ARD) Acute poisoning Chronic Obstructive Pulmonary disease (COPD) Chronic bronchitis Cor Pulmonale Adverse reproductive outcomes Cancer (lung) Burns; cataract Arthritis Burns in infants/toddlers
Source: Based on data given in World Health Organisation: Indoor Air Pollution from Biomass Fuel(1992), quoted in UNDP: 1996.
6.3.3.2 More solid data is needed on the effect of this type of pollution on poverty and health. With a'value' attached to it, pollution from cooking can be ranked and judged against other causes of illnesssuch as poor diet, poor housing, poor sanitation and poor education. Without such a ranking there isgreat risk that scarce resources will be allocated to inappropriate developmental effort.
6.3.3.3 The rationale for health benefits of improved stoves is that (i) pollution from traditional stoves isbad for health; and (ii) improved stoves use less fuel and produce lower emissions and therefore arebetter for health.
6.3.3.4 The following considerations need to be addressed for this rationale to be valid and justifiable:
♦ The main pollutants, detrimental to health, from fuelwood-stoves are, smoke and soot, carbonmonoxide, polyaromatic hydrocarbons - PAH - (these mainly exist as adsorbed compounds on sootparticles).

40
♦ PAH are a class of compounds, many members of which are known potent carcinogens in smallconcentration. There is no evidence that improved stoves reduce these compounds to levels at whichthe hazard posed by these compounds is significantly reduced. Data to define minimum exposurelimits is essential before judgements can made if improved stoves really do reduce health risks posedby these compounds. Another issue is whether the PAH compounds produced in traditional andimproved stoves are the same. Not all PAH compounds are carcinogenic and not all PAH compoundsare equally potent. As the combustion parameters in traditional and improved stoves are different, thetypes and concentrations of PAH compounds produced in two types of stoves are likely to be different.
♦ Carbon monoxide is a toxin and reduces ability of the blood to carry oxygen. Some of the improvedstoves rely on close matching of the stove to the pot design for proper operation. A mismatch resultsin the situation where inadequate amount of air is supplied to the fire. This results in more carbonmonoxide being produced compared to the traditional stoves (Energy After Rio: Prospects andChallenges, UNDP ,1995).
♦ As shown before, the maximum fuel saving which can be expected is of the order of 38%. What is theimpact of this reduction on health?
♦ In assessing the impact of enhanced efficiency, consideration has to be given to whether cooking isconducted indoors or outdoors. For people cooking outdoors, pollution is relatively freely dispersedand diluted. It will be more problematic to relate enhanced efficiency and health benefits.
6.4 The Poverty Impacts of Fuel Scarcity and Inefficient Combustion
6.4.1.1 As mentioned above, there are a different range of management options for tackling the povertyimpacts of fuel scarcity on the one hand, and inefficient combustion on the other. For both of these,improving energy efficiency represents only one of a range of management options.
6.4.2 Options for Addressing Fuel Scarcity
6.4.2.1 This section draws largely on an overview of urban energy options presented in Munslow et al:1998.
1. Supply enhancement
6.4.2.2 This is an obvious option to consider in order to tackle problems associated with fuel scarcity,and this has often been the focus of energy policies in the past, including that of the Indian government.In terms of fuelwood, Munslow et al consider there to be five main options for enhancing urban supply.These are: expansion of peri-urban plantations, improved management of natural woodlands,encouragement of planting of wood for fuel on farms, and improved utilisation of wood waste productsfrom other production activities. While there are constraints to this approach, it is important to recogniseit as an alternative or complementary approach to improving energy efficiency as a means of tacklingpoverty impacts of fuel scarcity.
2. Improving marketing and transport
6.4.2.3 Improving the efficiency of marketing and transport (distribution) of fuels may help to tacklesome of the problems associated with fuel scarcity, by reducing the end cost of fuels to poor householdsand improving reliability of supply. In relation to fuelwood distribution, Munslow et al argue thatfuelwood distribution chains are often long, and their efficiency could be improved to the benefit of end

41
users. In India, fuelwood purchased by urban households tend to be distributed via centralised urbanfuelwood depots (Gopalan: 1988), which may mean that there is less opportunity for reducing costs.However, improved marketing and transport is an area that could be further investigated for wood andother fuels in India during the next phase of the study. 3. Fuel Switching (moving up the energy ladder)
6.4.2.4 This option, which involves improving energy efficiency, is addressed in Section 8.5.
4. Improving efficiency of fuel use through more efficient stoves
6.4.2.5 This option is also addressed in more detail below in Section 8.4.
5 Changes in household practices
6.4.2.6 There are a number of improvements that could be made to household practices relating to fueluse, that would also lead to more efficient use of energy sources. These include: changes in fuelpreparation methods, e.g. people living in dry areas sometimes sprinkle water onto dry firewood toreduce its rate of burning; improved fire management practices, e.g., use of windbreaks, shielding thefire, using the same fire for a range of purposes at the same time, adjusting distance between the pot andstove/fire etc.; changes in food preparation techniques, e.g. pre-soaking of beans, cutting food intosmaller pieces; and changes in cooking practices, e.g. use of better lids, placing stones on lids to addmore pressure (Nelson: 1996).
6.4.3 Options for addressing the health impacts of pollution due to inefficient combustion
1. Diverting the smoke
6.4.3.1 An alternative to reducing pollutants is to divert the pollution away from where it causes mostdamage. Methods for reducing smoke levels where it matters include cooking outdoors, use of(improved) chimneys, use of stove hoods, and improving ventilation of dwelling areas (Boiling PointIssue 34).
2. Improving burn efficiency of stoves
6.4.3.2 This option is addressed under Section 8.2 on Improved Stoves.
6.5 Conclusions and Findings
6.5.1 Improving energy efficiency can be an effective way of tackling problems associated with bothinefficient combustion and scarce fuel supply, but it is important to recognise that there are alternativeapproaches that may be more appropriate in some circumstances. Due to the focus of this study, the restof Part II concentrates on those management options which involve improving energy efficiency, namelyimproved stoves and switching to more efficient fuels. Chapter 7 first provides a more detailed picture ofenergy use, trends and policies in India.

42
6.5.2 Based on the discussions above the findings of this chapter are:
1. Benefits of enhanced energy efficiency at the household level could be in terms of increaseddisposable income and improved health following reduction in pollution. Therefore,measures of poverty impact could be savings in fuel bills; proportion of uptake by poorhouseholds; proportion in use after measuring drop-out rate; and range of expectedbenefits generated, as defined by the target group.
2. Enhanced efficiency leading to reduced fuel needs will reduce the mass of pollutantsgenerated. This will have health impact only if cooking is undertaken indoors.
3. There has to be careful evaluation at project design stage of levels of economic benefits thatcould accrue in terms of disposable income from enhanced energy efficiency.
4. It is important to define minimum exposure limits before judgement can be made ifimproved stoves do really do reduce health risks posed by PAH class of compounds.
5. In cases where efficiency of traditional stoves for fuelwood is already relatively high,initiatives for improving stove design should be carefully evaluated.

43
7. HOUSEHOLD ENERGY USE AND URBAN POOR IN INDIA
7.1 Introduction
7.1.1 This chapter first describes the characteristics of households in the slums. Based on secondaryreview and on in-country fact finding mission, it then defines the trends and patterns in urbanhousehold fuel use. It concludes with a discussion of government initiatives affecting energy use of theurban poor.
7.2 Characteristics of Slum Dwellers
7.2.1 Up to 50% of the urban population are estimated to live in sub-standard, slum areas. These aredefined as any structure, group of structures or area unfit for human habitation due to deficiencies inthe nature of the accommodation and/or the environment. While this covers a huge number of people(the urban population is expected to reach 300m by 2,000) not all slum dwellers are the poorestpeople. Such is the shortage of housing in the big cities that government employees such as policemenare forced to live in slum housing (Times of India, 18.7.98) and ownership of refrigerators andtelevisions by slum dwellers are common. However, there is considerable heterogeneity in householdincomes.
7.2.2 Differentiation of slum types also exist, with the poorest families generally living in the leastsupported slums. Government-recognised slums are provided with services such latrines, water,community centres and housing loans. The non-recognised areas, generally more recently settled, arenot provided with services and tend to be ignored. These are known as Jhuggi jhopri (JJ) clusters(groups of 10 or more temporary physical structures used for living or other purposes and made ofstraw, mud, loose bricks, tin, wood, corrugated sheets etc. without adequate foundations). They tend tobe the poorest areas, due to their poor socio-economic conditions combined with maximum sizeincrease. These areas are overcrowded, with poor or no sanitation and in the larger camps there are noopen spaces between long rows of dwellings. Many people may live in one room which are poorlyventilated, often with only a door and many household and business activities spill out into the narrowlanes. There is a mix of caste, class (though predominantly lower social and economic), place oforigin and education among slum dwellers. In addition to low incomes and lack of access to supportservices life is made harder through the prevalence of drugs, alcohol and prostitution and exposure todiseases such as TB and cholera.
7.2.3 Most of the family units are nuclear. Some men have permanent jobs while others depend oncasual work, as cleaners, on building sites but generally in the informal sector. A few women work,depending on circumstances and their place of origin, some as domestic servants, some onconstruction sites and others in small-scale production and vending. The position and status of womenis “complicated and confused” depending on their exposure, interaction and autonomy (NCAER,1988). Women from southern India are often more educated and freer to work outside the home andearn an income. Household incomes are estimated to vary between Rs. 500 and Rs. 3,000 per month(R. Uma, personal communication). A labourer receives Rs. 50-60/day (= Rs.1,100-1,600/month). Thegovernment’s poverty income criteria for urban areas is Rs. 1,975 per month (Economic Survey 1997)so few families are living much above the poverty line.
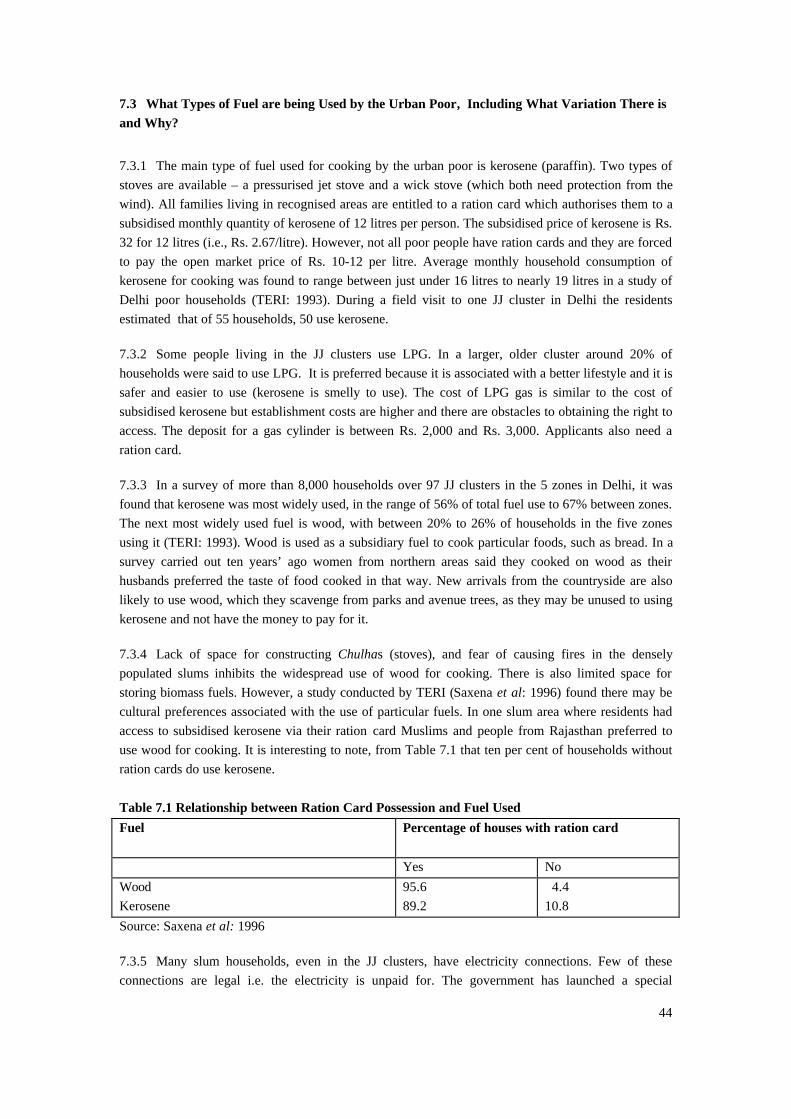
44
7.3 What Types of Fuel are being Used by the Urban Poor, Including What Variation There isand Why?
7.3.1 The main type of fuel used for cooking by the urban poor is kerosene (paraffin). Two types ofstoves are available – a pressurised jet stove and a wick stove (which both need protection from thewind). All families living in recognised areas are entitled to a ration card which authorises them to asubsidised monthly quantity of kerosene of 12 litres per person. The subsidised price of kerosene is Rs.32 for 12 litres (i.e., Rs. 2.67/litre). However, not all poor people have ration cards and they are forcedto pay the open market price of Rs. 10-12 per litre. Average monthly household consumption ofkerosene for cooking was found to range between just under 16 litres to nearly 19 litres in a study ofDelhi poor households (TERI: 1993). During a field visit to one JJ cluster in Delhi the residentsestimated that of 55 households, 50 use kerosene.
7.3.2 Some people living in the JJ clusters use LPG. In a larger, older cluster around 20% ofhouseholds were said to use LPG. It is preferred because it is associated with a better lifestyle and it issafer and easier to use (kerosene is smelly to use). The cost of LPG gas is similar to the cost ofsubsidised kerosene but establishment costs are higher and there are obstacles to obtaining the right toaccess. The deposit for a gas cylinder is between Rs. 2,000 and Rs. 3,000. Applicants also need aration card.
7.3.3 In a survey of more than 8,000 households over 97 JJ clusters in the 5 zones in Delhi, it wasfound that kerosene was most widely used, in the range of 56% of total fuel use to 67% between zones.The next most widely used fuel is wood, with between 20% to 26% of households in the five zonesusing it (TERI: 1993). Wood is used as a subsidiary fuel to cook particular foods, such as bread. In asurvey carried out ten years’ ago women from northern areas said they cooked on wood as theirhusbands preferred the taste of food cooked in that way. New arrivals from the countryside are alsolikely to use wood, which they scavenge from parks and avenue trees, as they may be unused to usingkerosene and not have the money to pay for it.
7.3.4 Lack of space for constructing Chulhas (stoves), and fear of causing fires in the denselypopulated slums inhibits the widespread use of wood for cooking. There is also limited space forstoring biomass fuels. However, a study conducted by TERI (Saxena et al: 1996) found there may becultural preferences associated with the use of particular fuels. In one slum area where residents hadaccess to subsidised kerosene via their ration card Muslims and people from Rajasthan preferred touse wood for cooking. It is interesting to note, from Table 7.1 that ten per cent of households withoutration cards do use kerosene. Table 7.1 Relationship between Ration Card Possession and Fuel Used Fuel Percentage of houses with ration card
Yes No Wood Kerosene
95.6 89.2
4.4 10.8
Source: Saxena et al: 1996
7.3.5 Many slum households, even in the JJ clusters, have electricity connections. Few of theseconnections are legal i.e. the electricity is unpaid for. The government has launched a special

45
campaign in Delhi to grant electrical connections to the residents of JJ clusters for a nominal rate ofRs. 10. Electricity is used mainly for lighting, heating and cooling air (fans), and entertainment(television, audio systems).
7.3.6 Detailed information on changes in the cost of fuel over time was not obtained. Anecdotalevidence indicates that the price of fuelwood in the cities has become increasingly expensive and areport by TERI (1993) indicated that the price of wood increased by nearly 400% between 1983 and1985. However, a study of average urban woodfuel prices between 1989 and 1997 shows an increasefrom Rs. 1/kg to Rs. 1.93/kg over the nine-year period – a rise lower than the rise in wholesale priceindex (Agarwal: 1998).
7.3.7 Studies have shown that household energy consumption is positively correlated with incomeand that increasing urbanisation and growing energy demand are closely linked. In 1977/78, firewoodmet more than half of the gross needs of urban homes. During the period 1982/83 to 1987/88, therewas a steady shift from non-commercial to commercial sources of energy in urban homes. In Delhi,the share of kerosene and LPG increased, from 34.9% to 44.5% while fuelwood fell from 42% to 27%(TERI: 1993).
7.3.8 As noted in chapter 5, the government is under pressure to reduce subsidies on fuels, includingkerosene, over the next few years. The reduction in the subsidy on kerosene, from 50% to 15% couldhave a dramatic impact on energy consumption and household welfare. Table 7.2 below gives indicative prices for the three main domestic fuels. It is important to note thatin some instances it can be cheaper to use LPG than wood. Information on the useful energy, whichtakes into account the efficiency of the cooking device, delivered by firewood, kerosene and LPG,would further highlight the differences in cost. Table 7.2 Relative Fuel Prices and Typical Domestic Daily Fuel Consumption (December 1998) Unit cost Amount used
(per household) Householdcost/day
Start-up cost
Wood Rs. 1 - 2/kg 2-3 kg/day Rs. 2 – 6/day Some woodscavenged – nofinancial cost
Kerosene - subsidised
Rs. 2.7/litre 1 – 1.6 litre/day Rs 2.7 – Rs.4.3/day
Stove
- open market Rs. 10 – 12/litre 1 – 1.6 litre/day Rs. 10-20/day Stove LPG Rs. 140/refill
1 refill lasts 20-40days
Rs. 3.5-7/day Hobs andCylinder Rs. 2-3,000
Small gascylinders said tobe available Rs. 50-60/refill
Last 7-8 days.
Rs. 6.25-7.5 Not known
Source: Field notes: December 1998.

46
7.4 Government Policies and Programmes Affecting Energy Use by the Urban Poor
7.4.1 There are three main policies areas which have affected energy use by the poor. These are (i)the national government’s policy on subsidy; (ii) the National Programme for Improved Chulhas(NPIC); and (iii) lack of an integrated management policy for domestic fuel use by urban poor. Eachof these are discussed below.
7.4.2 Subsidy on kerosene: The main programme benefiting the urban poor has been thesubsidisation of kerosene and its availability through the Public Distribution Service. However, peoplecomplain of cheating by ration shop dealers. They allege that most of the time kerosene is notavailable at ration shops, forcing people to buy it on the open market, where the price is much higherTable 7.2). A shortage of kerosene may force people to use other fuels such as firewood, which isexpensive to buy, or dung cakes (TERI: 1993). LPG is also subsidised.
7.4.3 The National Programme of Improved Chulha: It has received considerable support from thegovernment, has been targeted at rural, rather than, urban areas. The improved Chulha programmewas introduced on a demonstration scale in 1981/82, and developed into a national programme in1984, by the Department for Non-conventional Energy Sources (now a Ministry- MNES) in responseto concerns about deforestation and shortages of fuelwood.
"Major efforts under the NPIC were made in improving the thermal efficiency of thecookstoves so as to reduce fuel consumption.... The environmental concerns were onlysecondary. However, the models propagated under NPIC were kitchen friendly - they reducedthe indoor pollution load”. Source: Environmental hazards of chimney-less stoves, S. K. Sharma, Director, EnergyResearch Centre, Chandigarh.
7.4.4 Seventeen regional energy support organisations, Technical Back-up Units (TBUs), have beenestablished and considerable input has gone into developing improved biomass stoves (some 30-40improved stoves, metal and ceramic which use twigs, dung, crop residues have been developed)although the main model disseminated is a mud-clad, pottery lined, fixed stove with a chimney. Therehas been considerable testing of improved stoves under laboratory conditions (where efficiencies of20-30% have been obtained but no systematic method has been evolved for testing in domesticconditions). TBUs monitor performance under household conditions for a year.
7.4.5 The National Programme of Improved Chulhas covers (a) Research & Development; and (b)funds state governments to implement the programme via nodal agencies. Different states receivedifferent amounts for their improved Chulha programme from the MNES, depending on population,area, and state target. Some states already support improved Chulha programmes from their ownfunds. The federal government wants to end its financial input into the programme. By the end of 9thor 10th Plan, state governments will have to support their own programmes as support from theMNES is likely to be phased out.
7.4.6 The dissemination programme includes three types of training:♦ training to self-employed (mainly women) workers (SEW) on stove construction (10 days);

47
♦ entrepreneurship training is also given whereby entrepreneurs (blacksmiths, potters) are trainedto manufacture metal stoves and stove components; and
♦ users' training programme - 1/2 day training in villages by communityworkers/NGOs/Government agents for users on how to use, carry out day-to-day maintenance.Some courses use video programmes.
7.4.7 The average cost of an improved Chulha is Rs. 80-100. The government gives a 50% subsidyon the cost of stove to new adoptees (replacement stoves have to be paid for entirely by users). Theaverage life of mud Chulhas is 2-3 years and metal Chulhas is 7-8 years although mud Chulhas canlast longer if properly and regularly maintained.
7.4.8 There is considerable debate as to whether the improved stove has had much impact onfuelwood consumption. It has been estimated that 90% of the population use stoves but only 10% useimproved stoves. The main problems, identified by Dr P Saxena, of MNES, relate to:♦ Communication and limited uptake.♦ Coverage very small - 25% of rural/semi-urban households reached (only 25 lakhs (250,000) of
stoves installed each year).♦ Urban households are not included in the programme.♦ Monitoring & Evaluation shows that only 17-18% of adoptees are still using improved stoves.
7.4.9 There has been a shift in emphasis of the rationale for the programme since it was establishedwith greater emphasis now on health issues, reduction in cooking and fuel collection times. Reducingwood cutting and environmental degradation tends to be viewed more as a secondary benefit. Thebenefits of using improved stoves are considered as follows:♦ Cleaner environment; with unimproved stoves kitchen is black with soot and very smoky.♦ Less exposure to CO, TSPs, flue gases (which linger for three-and-a-half hours after cooking).
Women and girls often remain in this atmosphere for considerable periods.♦ Reduced cooking time - 15 -20 minutes saved per meal (2 hour cooking time)♦ Less fuel - time saved enables girl children to spend more time on education.
7.4.9.1 Another important benefit for the government is the employment created by the programme.Self-employed people, mainly women, earn an income from installing stoves (Rs. 20-25 per stove x 3fitted per day) after receiving training from the nodal agency. This strategy is in contrast to thatadopted by China. Here, Rural Technology Enterprises were assigned to manufacture componentswhere adhering to technical specifications were important to ensure improvements. The assemblingwas left to the household level. Employment generation was not one of the objectives of theprogramme (Smith: interview - December 1998.)
7.4.10 Managing urban fuel demand: Five sets of issues emerge which needs to be addressed and/ortaken into account. These are:

48
I Very little attention appears to have been paid to energy needs of urban poor, either by government orthe NGOs. A study carried out in the early 1990s (TERI: 1993) points out:
“One of the important critical inputs to development which has been overlooked in almost all theurban planning exercises is energy. Though some estimates talk of energy demand, nowhere ismention made of the energy demand of slum areas. These are responsible for a large share of theenergy demand in these cities”. II Energy is also not an issue which many NGOs working in urban areas have addressed in theface of so many other pressing problems. Studies and needs’ assessment exercises have shown thatslum dwellers’ priorities lie with housing, tenure, health and education, and access to water andelectricity. Energy tends to have a low priority. III The NGO, Development Alternatives was involved in a pilot dissemination programme formetal stoves. It decided to stop participating after a government subsidy to reduce the price of stoves,was withdrawn and the stove price increased dramatically, killing any village interest in it. On the other hand, several organisations with experience of stove dissemination believe it is an errorto subsidise the product because it makes people value it less, or buy it for the wrong reason or use.One observer recommended that public money be used solely for supporting the service providers,providing training etc. rather than to reduce the price of the product (G. Varughese, personalcommunications). IV One NGO, CARE-India, is about to start a DFID-funded participatory development project inslum areas in Delhi. Although energy was not a topic they were going to include, the director of theprogramme expressed a willingness to include it in an initial needs’ assessment exercise if NRIprovided the main questions. V Energy may not be the most pressing issue for poor urban households but it is obviously anarea which government needs to take account of. Due to division of sectoral responsibilities betweendifferent organisations, a lack of linkages between the plan of the Delhi Energy DevelopmentAuthority (DEDA) and the overall urban development planning body- The Delhi DevelopmentAuthority, has been noted (TERI: 1993).
“In the Master Plan for Delhi, a framework for guiding development of comprehensive urbanplanning for the Union Territory of Delhi, or in schemes for urban slums, no mention ismade on what is being done about the energy needs of the urban poor in Delhi… If the energy demands of vast numbers of poor people in the urban areas are not takenaccount of in planning it is possible, even though their individual demands are low, that therewill not be enough supplies to meet their needs...
7.4.10.1 The problems faced by the urban poor have not been given due attention. The energyconsumption in urban poor households is between 1,256 and 2,053 kJ/capita of ‘useful energy’ perday. This is much lower than the minimum requirement of 2,847 kJ/capita worked out by theAdvisory Board on Energy in 1985.” Proper institutional linkages, a specific plan of activities and

49
emphasis on integrated energy planning are required to solve energy problems of slum dwellers(TERI: 1993).
7.5 Findings
Based on the discussions in this chapter the following points can be made. These are:
1. It appears that in the large cities of India the majority of urban poor have shifted tokerosene as the main cooking fuel. This is largely the impact of the high subsidy (50%)on the fuel.
2. Information on smaller and secondary cities is very patchy and limited. It is not clearwhether this shift has also occurred in these urban areas.
3. The shift to kerosene has moved cooking indoors and increased environmental risks ofsmoke related diseases among women, children and old people.
4. There are many lessons to be learnt from the NPIC experience.
5. Limited attention has been paid to the energy needs of the urban poor. Domestic energyneeds should be incorporated into integrated urban planning.

50
8. IMPROVING ENERGY EFFICIENCY
8.1 Introduction
8.1.1 This chapter is devoted to examining in detail the two main management options for improvingenergy efficiency in households (A) Improved stoves; and (B) Fuel switching- moving up the energyladder. These are analysed in sections 8.2 and 8.3 respectively. Each section looks at type of benefitsthat could be generated, various target groups and the conditions of success. They first provide anoverview and then focus more specifically on India.
8.2 A: Improved Stoves in Urban Areas
8.2.1 There is a substantial history of improved stove initiatives in many countries in the developingworld. Although it has not been possible to carry out a comprehensive review of programmes indifferent countries, it is clear that improved stove programmes have been widespread. For example, anoverview of cookstove programmes in East and Central Africa (Wickramagamage: 1992) coversprogrammes in Botswana, Ethiopia, Kenya, Malawi, Mozambique, Rwanda, Sudan, Tanzania,Uganda, Zambia and Zimbabwe; and members of the Asia Regional Cookstove Programme(ARECOP) include Sri Lanka, Pakistan, India, Nepal, Bhutan, Bangladesh, Myanmar, Thailand,Vietnam, China, Philippines and Indonesia (Boiling Point Issue No. 33). There is already a largebody of literature that has identified reasons for success and failure of stove programmes, andguidelines have been written on how to develop and manage programmes. The journal of theIntermediate Technology Development Group’s Stove and Household Energy Programme, BoilingPoint, is published quarterly and focuses specifically on improved stove programmes.
8.2.1.1 Given the considerable extent of existing knowledge and literature on improved stoveprogrammes, it was decided that this section of the report would focus on the following:
♦ Summarising the potential benefits of improved stove programmes in urban areas;♦ Identifying target groups amongst the urban poor where improved stove programmes are most
likely to have positive impacts on poverty;♦ Identifying key conditions for success of stove programmes; and♦ Identifying limitations to stove programmes in terms of their ability to benefit poor people.
8.2.1.2 The lessons learnt from stove programmes to date are also summarised into a practicalformat in Appendix A Guidelines for Designing, Developing, Monitoring and Evaluating HouseholdEnergy Interventions, and key references on the different aspects of stove programmes are included inthe Section on Key References and Contacts (Section 8.6).
8.2.2 Benefits of Improved Stoves for the Urban Poor
8.2.2.1 Experience to date shows that the urban poor are in general more likely to benefit fromimproved stoves than the rural poor, for a number of reasons:
♦ The urban poor are more likely to be spending money (rather than time) on acquiring fuel (seeSection 6.3.2). Thus, the benefits of reduced demand for fuel, due to increased efficiency, of stovesare directly reflected in reduced financial expenditure, whereas in many rural areas fuel is still

51
largely a “free” resource. While a reduction in labour time required to collect fuel is also a benefit,this is often outweighed by the financial cost of buying a stove.
♦ The urban poor are also more likely to be spending money on buying stoves, rather thanconstructing their own. Thus, if the cost of improved stoves are comparable to the cost of stovescurrently being used, the financial cost of the improved stove is less likely to be seen as a barrierby the urban poor compared to their rural counterparts.
♦ The urban poor are also more likely to be using stoves of some sort in the first place, rather thanan open fire. The benefits of improved stoves depend very much on the starting point, andimproving on an existing stove is less likely to lead to trade-offs than the introduction of a stove inplace of an open fire. As indicated below (Section 8.2.7.3), open fires often serve a wide range offunctions, often including social and cultural functions, that a stove is unlikely to be able toperform.
♦ The urban poor are more likely to have better access to credit than their rural counterparts, so maybe in a better position to spread initial capital costs of buying a new stove.
♦ Production, dissemination and marketing of improved stoves are likely to be easier in urban areasdue to the existence of more specialised skills, greater population density, and bettercommunications and marketing infrastructure.
♦ Urban dwellers may be more likely to adopt new ideas and practices than their rural counterparts. ♦ In India, while there has been a long history of improved stove programmes, they have largely
focused on promoting stoves for use in rural rather than urban areas. Nevertheless, there may besome potential for the urban poor to benefit from improved stoves:
♦ 90% of the population already use stoves;
♦ slum areas mostly have nuclear family structures, urban poor more educated than their ruralcounterparts, traditional values tend to have absorbed urban/ “modern” values (R. Uma; MaliniKalianiwale, personal communications). These characteristics are likely to make urban poor moreconducive to changes in practices than their rural counterparts;
♦ in urban areas more fuels are purchased, even dung cakes (P. Saxena, personal communication).
8.2.2.2 Opportunities may exist in small cities and peri-urban areas where wood is still thepredominant fuel but is becoming scarcer and/or increasing in price. A needs’ assessment (seeAppendix A) would need to be undertaken to ascertain whether the potential savings of fuelwoodand/or whether there are other benefits, such as improved health, that would justify an investmentprogramme.
8.2.3 Types of benefits 1. Reduced financial costs
8.2.3.1 If the household is buying fuel, improved efficiency of burning means that less fuel needs tobe used e.g. per meal cooked, so day-to-day fuel costs can be reduced. A number of economic/financialevaluations of stove programmes indicate that such potential savings can be realised. For example, asurvey of a sample of users of the two-pot Anagi stove in Sri Lanka showed that fuel savings was the

52
main reason for urban users to buy the Anagi, and that these savings were seen as the key advantageof the stove (Watts: 1994). Appropriate Technology International (ATI) estimates that householdsusing the Diambar stove in Senegal are saving US$103 per year on energy costs by burning lesscharcoal (Talking Points: 1994).
2. Reduced labour load
8.2.3.2 To the extent that urban households are collecting (rather than buying) fuel, improvedefficiency may mean reduced amounts of labour spent on fuel collection. Improved stoves are alsooften designed to reduce cooking times, and this can be a real benefit to women. For example,responses to the survey of users of the Anagi stove (see above) in Sri Lanka showed that speed ofcooking was the third most important advantage. 3. Improved health
8.2.3.3 Improved stoves can have health benefits to users from improved nutritional status, improvedhygiene, and reduced risks of health problems associated with smoke pollution. A follow-up ofwomen’s groups who had installed improved cookstoves in Uganda revealed that those using the stovewere able to prepare 4 meals a day due to reduced fuelwood requirements, compared to those using athree-stone fire who were only able to prepare one meal a day (Lugemwa: 1992). While links betweenintroduction of improved stoves and health benefits are difficult to measure directly due to theinfluence of many external factors, some studies clearly indicate that improved stoves do lead toreduced smoke exposure. A survey in Nepal, for example, showed that improved cookstoves reducedexposure to total suspended particulates by about 67 percent and carbon monoxide concentrations by75 percent (Karakezi et al: 1994).
5. Reduced risk of accidents
8.2.3.4 If an improved stove is replacing an open fire, the risk of accidents (children getting burnt,risk of setting the house on fire) can be significantly reduced.
6. Benefits to producers
8.2.3.5 The wider use of improved stoves can also have impacts on poverty through improving theincomes of poor producers, if efforts are made to train and involve small-scale producers in stoveprogrammes. For example, both the Kenyan programme for the promotion of the Kenya Ceramic Jiko(Masakhwe: 1991) and the Anagi programme in Sri Lanka (Watts: 1994) relied substantially onsmall-scale traditional potters/artisans to scale up production when it became clear that there wasdemand for the improves stoves, and provided training and other assistance to them.
7. Indirect benefits for the rural poor
8.2.3.6 While consumption of fuelwood and charcoal by urban households is by no means the onlycause of depletion in wood resources, it can have a very substantial impact on rural areas surroundingcities and towns. Urban demand for fuelwood and charcoal can have negative impact on poor ruralhouseholds in the surrounding areas, both in terms of direct competition for fuel resources where theseare scarce, and in terms of commercialisation of the resources, which often leads to rural householdshaving to pay for their fuel where in the past they were able to collect fuel for free. If adopted by a

53
substantial proportion of urban households, improved efficiency stoves can therefore benefit poor ruralhouseholds living in surrounding areas.
8.2.4 The Indian experience
8.2.4.1 Conflicting views on the success of the improved Chulha programme are apparent,depending on whether one talks to the staff of the ministry concerned (MNES), the NGO whichimplements part of the improved stove programme or the research institute which has evaluated it,although all agree that improvements could be made and that the programme could be moresuccessful if particular issues were addressed. These are discussed in more detail below.
8.2.4.2 As has been shown elsewhere the issue of introducing improved stoves is quite complex.Designing an improved biomass stove is relatively straightforward from an engineering perspectivebut ensuring its sustainable uptake is much more difficult, with numerous angles of financing,training, awareness raising and targeting to consider. Traditionally women are used to making theirown stoves, from three stones and some mud and dung, which involves little or no investment. Todivert scarce household resources into an improved Chulha may not seem advantageous if fuel is stillrelatively abundant, and better cooking conditions may not seem very important to the male head ofhousehold.
8.2.4.3 Benefits, achievements and limitations of India’s initiatives
Benefits♦ Uptake – the number of improved Chulhas increased from 0.8m in 1985 to over 12m by 1992.
Some 2m stoves are installed every year but annual mortality is high (estimated at 20%) and thereis, thus, little increase in stock.
♦ Reduced fuel consumption – under laboratory conditions improved Chulhas use 1/3 of the fuel
required to cook the same quantity of food on a traditional stove. Under household conditions thereis a wide variation in efficiency as stove performance is very sensitive to design parameters and itis estimated that overall there is only a 40% gain in efficiency (Natarajan: 1995). Energy efficiencynot a major issue for poor people - food, health, water, employment, education etc. more importantthan fuel. However, the All India Women’s’ Conference (AIWC) has found considerable fuelsaving can be realised with proper installation and maintenance. With improved Chulha 15minutes’ cooking time can be saved each meal (2 hours’ cooking time).
♦ Reduced exposure to pollutants – following an evaluation of the NPIC, it was suggested to the
MNES that they stress that the improved stoves are smoke free rather than fuel saving (Natarajan,op.cit.). Better combustion plus the use of a chimney significantly reduces smoke emissions.
♦ Cleaner indoor environment – Women perceive of smoke as a health problem. A benefit ofimproved stove includes healthier eyes. They also note of savings of money/time and less drudgeryin collecting sufficient wood. However, men are not directly affected by stoves and cooking fueland often fail realise it is a problem for women and children. Better combustion also means lesstime cleaning sooty utensils.
54
♦ Cost/subsidy – There is considerable discussion over whether improved stoves should besubsidised. Mrs Balakrishnan of the AIWC felt strongly that Chulha subsidy programme shouldcontinue, particularly when electricity, kerosene and LPG are subsidised although she believed thatwomen should pay something towards stove (L. Balakrishnan, personal communication). Theevaluation of the NPIC considered, however, that due to the limited stake that each household hadin the stove they did not value it (the total cost of an improved Chulha is Rs. 90-125, of which thegovernment contributes Rs. 40) or opted for the Chulha only because it gave them access tosubsidised components which were often found to be used for other purposes e.g. chimney pipes(the most expensive part being a 3" diameter cement sanitary pipe) used in a latrine, in irrigationchannels or sold (Natarajan, 1995).
♦ Installation - Selected women in the chosen village are trained in Chulha construction. These
trainers/stove builders are self-employed workers (SEW) who receive a 10-day training coursefrom a master craftsman. The SEW learn the vital measurements by using hand spans ( TheAIWC teach the SEW songs in which the measurements are included in the words to help thewomen remember them. The AIWC has trained more than 3,000 women). Each SEW receives Rs.30 for each stove constructed (Rs. 15 after stove construction and Rs. 15 after 6 months to a year).She is supposed to provide support and assistance for one year. If a pottery liner is used threestoves can be built in a day. However, stoves are often badly constructed with the SEW little ideaabout how it should be done. The training element needs more emphasis and opportunities forcommercialisation should be explored. A simplified construction method - using one mould –would also help.
♦ Maintenance – the Chulha needs regular maintenance to keep it functioning properly; the channel
subsides and needs to be rebound with mud, and the chimney cleaned every 2-3 weeks. Regularcleaning extends the life of the chimney. Cleaning the chimney is supposed to be a man's job butnot many people like to do it.
♦ Education/awareness raising – stove programmes are supposed to include training for the users butthe quality and content of the training programmes is often poor and many issues may not beexplained. For example, women think they should be able to see flame around the pot whencooking to know stove is working; they think the stove isn't working efficiently if there's no flame.However, for improved Chulha to work efficiently there should be no gap between vessel andChulha. It is also alleged that many people are unaware of the benefits of Chulhas.
“In some cases, the decision makers being men, do not appreciate the benefits of improvedChulhas, because, they have never experienced any problems with the existing Chulhas, forthe simple reason that they have never cooked or worked in the kitchen!” (Kumar, 1995, pp.13).
Achievements ♦ Design/suitability of model – some 65 improved Chulha models have been developed including a
stove for reducing milk. The AIWC programme assists women select most appropriate model.They give a demonstration, and ask about types of food cooked and how frequently; whether theycook outside or in and the types of fuel used before suggesting which model(s) may be appropriate.
55
However, it has been suggested (Kumar, op.cit.) that there is a lack of different types and sizes ofChulha to suit different economic groups.
“The present model is too expensive for the poor, but is too inelegant, though
inexpensive, to find a place in the beautiful kitchen of those who are better off. The modelis too big for a small family, but too small for a large one… we should try to develop andpropagate different sizes and types of Chulhas to suit different sizes of families and fordifferent economic strata of the society. Monolithic models which require little skill ininstallation, and cast iron and stainless steel-clad fixed Chulhas which rhyme with thedécor of the modern kitchen need to be developed.”
Limitations ♦ Target fulfilment – the way in which the NPIC operates contributes to its problems. Firstly, the
MNES has an annual national dissemination target. This is broken down into state, district andvillage quotas. Village development workers have many targets from many developmentprogrammes of various departments. They may not consider the Chulha is a good project or mayconcentrate on other programmes. Two months before end of year he gets a reminder of Chulhatarget and has to rush around ensuring quota is met. He will not necessarily target stoves topoorest, just to whoever will take one. However, in spite of the limitations of a number-basedtarget the government thinks that without targets nothing will get done. Secondly, in some casesthe government target is quickly exhausted and no funds are left to provide Chulhas to additionalpeople who may wish to have one. Because the main Chulha components are bulk purchased theyare cheap. It is expensive to purchase individual components such as chimneys or they may not beavailable which discourages Self Employed Women from disseminating their own stoves.
♦ In certain improved models it is crucial that technical specifications are adhered to. Artisan-based
production often makes that difficult. Way forward ♦ Most people interviewed felt that the improved Chulha programme should be continued but with
improvements. Lessons learned should be incorporated. The dissemination steps are known (needsidentification, technology specification, pilot marketing); a process that takes 7-8 years. More usecould be made of NGOs and other genuinely interested organisations rather than relying on target-driven government departments. Women should be more involved in design, dissemination anduptake. People do buy things if they want them. Demonstration is important. Ten to 15 villagescould be adopted in each state and demonstration stoves installed in each. If people see they workthey will want one. Previously, assistance programmes from various ministries tended to operate inparallel. Now more effort is made to liase between programmes. Greater targeting is necessary e.g.target women with small fuel-using businesses such as snack producers. An idli1 maker who hadan improved Chulha installed through the AIWC found that she gained considerable benefits fromit. She saved money on fuel; per utensils needed less cleaning as soot doesn't form and her profitmargin improved. A secondary benefit was that her children didn’t get sick from smoke-relateddiseases.
1 Idli is a rice-based snack.

56
8.2.5 Target groups
8.2.5.1 The purpose of this section is to highlight those groups who are most likely to benefit fromimproved stoves. This does not imply that other groups should not be targeted. However, experiencehas indicated that stove programmes are more likely to succeed if they start off with well-targetedgroups where success is most likely, even if they eventually move on to a wider range of groups.
8.2.5.2 In the context of the focus of this study (i.e. the urban poor), experience has shown that thefollowing groups are most likely to benefit:
♦ Poor urban households who are already using and buying stoves.
♦ Poor urban households who are spending a large proportion of their incomes on fuel.
♦ Poor urban households who usually cook indoors (pollution caused by stoves is much less of aproblem for users if cooking outside);
♦ Where alternative fuel sources are not viable options: e.g.♦ the fuel itself is too expensive♦ the fuel is difficult to get hold of (e.g. only sold in bulk, or only through formal outlets)♦ alternatives sources are unreliable e.g. electricity, mains gas♦ appliances required to use alternative sources of energy (e.g. kerosene stoves or lanterns, coal
burners, solar cookers) are too expensive and/or are difficult to get hold of.
♦ Where cooking is the most important function of the stove/fire, and other functions are consideredmuch less important.
♦ Groups who themselves identify aspects of stove use as a key problem(s) e.g. complaints aboutsmoke, high prices of fuel.
♦ Where there are institutions and mechanisms already in place to scale up the stove programme,including existence of producers (e.g. existence of a traditional stove industry, or potters withrelevant skills), distribution outlets, NGOs interested and able to assist in promotion and training.
8.2.5.3 Proposed target groups in India might include:
♦ Urban areas where there is more reliance on biomass fuels (not in the mega cities: Delhi, Calcutta,Bombay and Madras), e.g. smaller towns/cities, outskirts of larger cities (dung cakes);
♦ Climatic areas where there is longer monsoon season and colder weather (people more likely tocook inside when it is cold and/or raining) i.e. where indoor air pollution is more likely to be aproblem;[but need too consider space heating requirement in colder areas – improved stoves aretoo efficient.
♦ NGOs might focus on slum areas where there are poorer facilities (e.g. subsidised kerosene/rationcards, electricity connection) but this may be controversial - these areas have poorer facilitiesbecause the government doesn’t want them to exist (M. Kalianiwale, personal communication).
8.2.6 Conditions for success
8.2.6.1 While different situations demand different conditions, the following are some generallessons learnt from stove programmes to date:

57
♦ Potential users of improved stoves need to be integrally involved in identification of problems to beaddressed, evaluation of options, and design, testing and evaluating of stoves;
♦ Considerable investments need to be made in the appraisal and design stage, and in developing along term stove production, maintenance and marketing strategy;
♦ Provision of credit to those interested in buying the stoves, so that they can spread the initialinvestment cost over a period of time;
♦ Adequate provision for training, both in terms of training users in the benefits, use andmaintenance of improved stoves, and in terms of training people involved in the production andrepair of the stoves.
♦ Adaptability of stoves. Many poor households use a range of fuels for a range of purposes. In orderto be acceptable to users, new stove designs need to be flexible in this way;
♦ Recognition that a stove that is successful in one place and with particular groups of people maynot be successful elsewhere.
♦ Understanding the range of stakeholders, their interests in stoves, and the constraints they face.These include potential users, traditional makers of stoves or similar artisans e.g. potters, existingretailers of stoves in both the formal and informal sector, government departments involved inhousehold energy programmes, and NGOs and community groups working with poor urbanhouseholds.
♦ Based on such an understanding, successful stove programmes have tended to build on existinginstitutions, skills and structures, exploiting existing capabilities of different groups.
8.2.7 Limitations of improved stoves for the urban poor
8.2.7.1 Many stove programmes have been heavily criticised in the past. This has been partly theresult of over-ambitious goals (see Sections 8.2.7.5 and 8.2.7.6, below), and many of the criticismsand problems apply much more to rural areas than they do to urban areas, where many of theconstraints are not significant. Moreover, many lessons have already been learnt from mistakes ofearlier programmes. However, given that there are other options for addressing the problemsassociated with fuel scarcity and smoke pollution (see Section 6.3.2), it is important to recognise thelimitations of improved stoves for poor urban households.
1. Financial costs.
8.2.7.2 Use of a new stove may incur additional investment (capital) costs, since it may be moreexpensive than currently used stoves, and would certainly cost more than an open fire. This initialcapital outlay required can be a serious constraint to purchasing an improved stove for poorhouseholds, even though this constraint is reduced if people are already using commercial stoves(which is the case for a substantial proportion of urban households in India), and/or if measures aretaken to spread the initial cost through credit or similar arrangements.
2. Loss of or reduced benefits from other functions of the traditional stove or fire.
8.2.7.3 Improving stove efficiency generally involves constraining the flame to intensify the heat

58
output so as to increase cooking efficiency. However, this involves trade-offs with other functions thatthe traditional stove or fire performs. Again, for those households who are already using some form ofstove, the range of functions, and therefore potential trade-offs, are likely to be less. For those using anopen fire, the trade-offs are likely to be high. As indicated in the table below, the open fire can have awide range of functions.
Multiple functions of open fires: • Flame ê lighting ê ritual significance ê entertainment
• Heat ê cooking ê space heating ê drying food, fuel and house materials ê control of pests in thatched roof
• Smoke ê preserving and flavouring food ê control of mosquitoes and other insect pests of humans and livestock ê preservation of house structure (wood, thatch) (Adapted from Smith: 1989)
8.2.7.4 Improved efficiency in the cooking function can therefore lead to interference with theperformance of other functions. e.g.
♦ smoke removal may reduce risk of eye and respiratory diseases, but may increase risk of mosquitoborne diseases such as a malaria in areas where such diseases are important.;
♦ by increasing a stove’s cooking efficiency, its space heating and lighting functions are likely to bereduced.
8.2.7.5 Because of the range of potential benefits, improved stoves were popular as a singletechnology to solve multiple problems. However, there appears to have been a tendency to imputeindirect gains from certain direct impacts, based on assumptions that are not always true.
8.2.7.6 For example, stove programmes in the 1970s often included as a key aim the reduction ofdeforestation, in order to preserve the fuelwood resource for the future. The assumption was thatincreased population growth and economic development led to increased domestic fuelwoodconsumption, which in turn led to increasing rates of deforestation. Introduction of energy efficientstoves were thus seen as a solution to this “energy crisis”, by decreasing rates of deforestation.However, the initial assumption was flawed in that there are often much more important contributorsto deforestation, e.g. land clearance for agriculture, ranching, or commercial logging.
8.2.7.7 Another claimed benefit of improved stoves is the “emancipation of women”, which issupposed to occur by freeing up women’s time from collecting fuel and cooking, and thereforeallowing them to engage in more productive and investment activities which would give them achance for a better life. Similarly, improvements in women’s health as a result of reduced risks fromsmoke pollutants are seen to improve women’s chances in engaging in “emancipatory” activities. In

59
practice, however, such benefits are unlikely to occur unless other factors are put into place to makethem happen. In a society such as India, for example, there are a number of cultural values that woulddiscourage many women from pursuing further education, setting up a new economic enterprise, etc.,that are likely to limit opportunities for women to use their spare time to carry out such“emancipatory” activities.
8.2.7.8 Key limitations of improved stoves for the urban poor in India:
♦ In Delhi, Calcutta, Bombay and Madras many poor urban households are using kerosene ratherthan biomass fuels because the former is cheaper. Kerosene is already a pretty efficient fuel (higherup the “energy ladder”), and there is little room for improving energy efficiency of kerosene stovemodels currently being used. The number of households that could benefit from improved biomass(especially wood) stoves therefore likely to be limited in the largest cities.
♦ A large number of households who do use biomass stoves cook outside for a significant proportionof the year. Therefore, while improved efficiency stoves may have benefits in terms of savings infuel costs, direct benefits to the users from reduced pollution are likely to be small.
♦ The urban poor prioritise many other needs or development objectives over and aboveimprovements in energy for cooking and heating, e.g. urban poor prioritise connections to watersupply and electricity (for lighting, television etc.) (interview with Malini Kalianiwale, 14.12.98;field visits), food, employment, education, access to health facilities (interview with Natarajan,15.12.98).
• Even for those households who do currently use biomass fuels, they may be unwilling to invest inan improved biomass stove due to quite frequent changes in the relative costs of alternatives fuelsover the last couple of decades (partly due to government policies), and therefore uncertainty overwhat will be the cheapest fuel in the future. One study showed that 56% of wood users also own akerosene stove, and 44% of kerosene users also own a wood-burning stove (Saksena et al., inBiomass Energy Systems).
8.3 B: Fuel Switching – Moving Up the Energy Ladder?
8.3.1 The option of switching to more efficient fuels – moving up the “energy ladder” – should beconsidered as a complementary strategy to improving stoves. As explained above (Section 6.2.1.2 to.5), there are however a number of constraints that the poor face in accessing these more efficientfuels. In many developing countries, these constraints are probably difficult to remove in the short-term, but should be considered as part of a longer-term strategy for domestic energy policy.Nevertheless, Munslow et al (1998) suggest that the key constraints to access for the poor areunreliability of supply, and high initial capital costs of acquiring appliances for using new energysources. There are likely to be ways of tackling both these constraints in the short term if policies andprogrammes prioritised the interests of the poor.
8.3.2 The urban poor are often characterised by relying on a range of fuels for any given function.Where sources of fuels such as electricity, coal or LPG are erratic, the urban poor may rely onfuelwood or charcoal as a fall-back energy source. This suggests that strategies to encourage fuel-switching would better suit the needs of the poor if they aimed to maximise fuel options available tothe poor, providing them with a choice, rather than encouragement of more efficient fuels at theexpense of more traditional fuels.

60
Stoves listed are: (TD), (TA), (TW), (TC)—traditional stoves using dried animal dung, agricultural residues,wood, and charcoal, respectively; (IW), (IC)—improved wood and charcoal stoves; (KW), (KP)—kerosene wickand kerosene pressure stoves; (LPG)—LPG or natural gas stoves; and (EL)—electric resistance stove.Efficiencies and capital costs are for the stove alone and do not include up-stream capital costs for producing anddelivering fuel. The range of performance both in the laboratory and in the field is much larger than thatsuggested by this figure and is affected by such factors as the size of the stove and pot, the climate (wind), thequality of the fuel used, the care with which the stove is operated, the type of cooking done, and many otherfactors. The type of material that the pot is made of is also a significant factor.
Figure 8.1. Representative Efficiencies and Capital Costs for Various Stoves Source: Energy After Rio: Prospects and Challenges, UNDP (1995)
Data points show the cost as estimated from the nominal values. The blue-band suggests the wide variation incosts using any particular stove depending on local stove and fuel costs, diet, and a host of other factors.
Figure 8.2. Annual Cost of Cooking for Different Stoves Source: Energy After Rio: Prospects and Challenges, UNDP (1995)

61
Stove efficiencies are nominal values for the stove alone; system efficiencies include the energy loss inproducing, converting, and delivering fuel to the consumer. (See caption for Figure 8.1 for the identification ofalternative stoves). Note, particularly low system efficiencies for charcoal (TC and IC) and electric (EL) stovesdue to the large energy losses in converting wood to charcoal, and fuel to electricity. Source: (OTA, 1992b).
Figure 8.3. Stove and System Efficiencies Source: Energy After Rio: Prospects and Challenges, UNDP (1995)
When system costs are included, electric stoves can be seen to be particularly expensive. There is a wide rangeof costs around these nominal values. See the caption for Figure 8.1 for identification of alternative stoves.
Figure 8.4. Stove and System Capital CostsSource: Energy After Rio: Prospects and Challenges, UNDP (1995)

62
8.3.3 When considering the wider environmental benefits, system efficiencies and costs areimportant. This is shown in Figures 8.3 and 8.4. System efficiencies include stove efficiencies andefficiencies of producing energy carriers (e.g. efficiency of production, transport and transmission ofcharcoal, electricity, and petroleum products). System costs include upstream costs for producingenergy carriers (charcoal, electricity, LPG etc.).
8.3.4 Moving up the energy ladder in India: the case of kerosene
8.3.4.1 Government policies over the last couple of decades have had a substantial influence onpatterns of energy consumption amongst the urban poor in India. Experiences with subsidisation ofcoal and kerosene supplies for the urban poor have some important lessons for consideration of fuel-switching policies in other countries. While other factors such as changes in availability of fuelwoodand costs of mining/distributing coal have undoubtedly had a major influence, subsidisation ofkerosene have led to changes in their cost relative to alternative fuels and this in turn has encouragedthe urban poor in some major cities to switch from biomass fuels to coal and, more recently, kerosene.Common constraints to fuel-switching (see Section 6.2.1.5) appear not to have been a problem: thecost of coal and kerosene-burning stoves appears not to have restricted poor households from usingeither of these fuels. A kerosene stove can be purchased from around Rs. 80 (around £1.20) andkerosene is relatively flexible in that it can be used both for cooking and lighting. LPG stoves costbetween Rs. 200 and Rs. 2,000 (£3 to £29).
Table 8.1 Cooking Energy Consumption Patterns in Two Delhi Slums
Fuelcategory
Slumlocation
(air quality)
Number ofmeals cookedper day
Daily timespentcooking(hours)
Burn rate(kg/hours)
Fuel use(kg/capita/
day)
Usefulenergyconsumption(kcal/capita/day)
Wood High
Low
1.4
2.0
1.70
2.20
1.42
1.33
0.40
0.60
222
336
Kerosene High
Low
1.9
2.4
2.20
2.10
0.16
0.16
0.06
0.08
263
321
Source: Saxena et al: 1996.
8.3.4.2 In particular, the recent shift towards kerosene usage, which includes a large proportion ofthe urban poor in Delhi and Calcutta, is at one level an impressive achievement in that the shift frombiomass fuels to kerosene involves a substantial move up the “energy ladder” i.e. much higher stoveand system efficiencies (see Figure 8.2). The higher efficiency of kerosene as a fuel, other things beingequal, entails lower per unit energy costs and reduced outside pollution levels.
8.3.4.3 However, the experience in India indicates that in practice there have been significant costsinvolved for urban households who have switched from biomass fuels to kerosene. In a study by TERIand medical researchers (Sharma et al: 1998) which compared wood and kerosene users in two largeslums in Delhi, it was shown that the incidence of respiratory diseases in infants was in fact slightly

63
higher in kerosene users. This was due to two factors:
1. Kerosene stoves are much more likely to be used indoors than outdoors compared to wood stoves(only 32.5% of wood users cooked indoors compared to 69.1 % of kerosene users). This is becausewhereas a breeze helps to keep a wood stove/fire alight, the pressurised jet system characteristic ofmany of the kerosene stoves used cannot cope with a breeze. Also, young children of keroseneusers are kept indoors where they can be kept an eye on while children of wood users could eitherbe outside with their mother or be put inside. Therefore, even if the actual emissions from woodstoves are more toxic, levels of exposure and health risk to users (women and children) can beless than for kerosene users because the environment (outdoors) is much better ventilated, andwomen and children are likely to spend less time near the stove if it is outside.
2. With current subsidies, the switch to kerosene from fuelwood may have involved a reduction infuel costs for users, and therefore an increase in purchasing power. The study suggests that thisincrease in purchasing power has allowed households to cook more meals per day because oflower per unit energy costs and/or increased expenditure on food. While a greater number ofcooked meals has potential benefits in terms of improved nutritional status of the household, italso means exposure for longer periods of time for women and infants to pollutants from thestove, and therefore potential increase in incidence of respiratory, eye diseases etc. Table 8.1shows that per capita useful energy consumption was higher in the kerosene-using households.
8.4 The Roles of Different Institutions
8.4.1 Due to time constraints, it has not been possible to carry out a comprehensive review of theadvantages and disadvantages of involving different types of institutions in different stoveprogrammes. Moreover, while some generalisations can probably be made in terms of the comparativeadvantages of certain types of institutions e.g. NGOs in performing specific roles such as provision oftraining on stove production and use, enormous differences in the institutional context betweendifferent countries questions the usefulness of trying to draw too many generic conclusions. Differentcountries have different types of institutions, and the same types of institutions may play quitedifferent roles e.g. governments may have very different priorities, and there is a lot of variationbetween countries in terms of the areas of activity, capacity and independence of the NGO sector.
8.4.2 Nevertheless, one key lesson from experience to date has been that those programmes whichhave been successful tend to have been effective at linking in to a wide range of existing institutions atdifferent points in the programme “chain”, building on mechanisms and capabilities that alreadyexist. This suggests the importance of developing a good knowledge of the range of potentialstakeholders/institutions and their activities, understanding their opportunities and constraints, anddeveloping partnerships with appropriate stakeholders based on this understanding.
8.4.3 In order to assist in the process of identifying potential stakeholders, the research team hasattempted to summarise the range of institutions that have been involved in the different stages ofstove programmes (see Box 8.1 below). This table has been compiled based on reviews of a widerange of stove programmes in different developing countries that have been published in past issues ofBoiling Point.

64
Box: 8.1 Summarising the Range of Institutions that have been Involved in Different Stagesof Stove Programmes R&D: Donors (e.g. ESMAP/WB in Ghana) Implementing agencies (government department, NGO)
Local research institutions (e.g. UST, Kumasi involved in lab testing ofprototypes)
Market researchers/consultants Production: Local potters (e.g. KCJ) Women’s groups (e.g. Kenya rural stove programme)
Large commercial manufacturing companies (e.g. Alfa producingAhibenso, Ghana) Rural Energy Companies, China
Selected local individuals who receive training (e.g. ApTT in Karnataka) Promotion: NGOs (e.g. KCJ – KENGO etc.)
Government extension networks (e.g. Home Economics Officers (HEOs inKenya)
Media/publicity consultants (e.g. Ghana coalpot) Different promotion methods involving different institutions, e.g. radio,TV, newspapers, public transport systems, schools, demonstrations in fairs(Melas in India) etc. Community groups e.g. women’s groups
Distribution: Government extension networks (e.g. Home Economics Officers in Kenya)
Commercial retail outlets - small shops / supermarkets / market places (e.g.KCJ)
Sold directly by artisans / producers (e.g. KCJ) NGOs (e.g. Development Alternatives, India)
Traditional community structures (e.g. village councils, ApTT project inIndia)
Training: Government services (e.g. HEOs in Kenya, Technical Back-up Service Units in India) NGOs (e.g. KENGO in Kenya)
Trained local individuals - training on stove construction, installation,maintenance (e.g. ApTT project, India)
After-sales service: NGOs (e.g. Development Alternatives, India) Commercial producers M&E: Women’s groups (e.g. Ghana coalpot)
Local research institutions (e.g. National Council of Applied EconomicResearch, India) Donors
Funding: International donors (e.g. WB, GTZ, ITDG) NGOs
Commercialisation of production and distribution – profit-making / self-sustaining
National governments (China, India) Quality control: China- Rural Technical Enterprises.
India -Technical Backup units.

65
8.4.4 One of the key current debates in stove programmes is about the advantages and disadvantagesof commercialisation of different aspects of the programmes. Key points that have emerged from areview of Boiling Point articles are summarised in Box 8.2 below.
Box: 8.2 Issues Regarding Commercialisation of Stove Programmes
• Factors conducive to commercialisation / semi-commercialisation / public sectormanagement
Stove programmes in urban areas likely to be more conducive to commercialisation thanrural areas Small, portable stoves more conducive to commercialisation than larger “built-in” stoves Well-developed and sophisticated local potter/artisan sector conducive to effectivecommercialisation of production Relative benefits of commercialisation of distribution may depend on strength of localgovernment and NGO institutions / networks
• Aspects / components of stove programme conducive to commercialisation Production, distribution; possibly promotion, training and after-sales service
• What types of commercial institutions should be involved? Producers:
Those who are willing to take risks and initiatives, as well as simplymeeting orders Those with existing skills that can be easily adapted to make improvedstoves / parts Formal vs. informal sector producers: it may be easier to control quality informal sector, but encouragement of informal sector production can meandirect benefits to small-scale artisans (greater poverty impact?).
Distribution:
Retailers / outlets that are frequented by the urban poor should be targeted,e.g. market stalls selling kitchenware.
• What support needs to be provided to commercial institutions? Training on stove construction and maintenance (producers), and properuse and benefits (distributors). Quality control.
• Implications of commercialisation for targeting the urban poor There are concerns that commercialisation makes it more difficult to reach the poor dueto higher prices (no subsidies) and private sellers not reaching the poor. However, inpractice many stove programme. using non-commercial distribution systems e.g. govt.extension networks also tend not to reach the poor. Also, it may be possible tospecifically target those informal outlets/sellers which the poor do frequent.
• Funding implications of commercialisation The advantage of commercialisation is often seen as distributing more stoves for lessmoney from funding agencies, and greater sustainability after end of project. However, inpractice, while commercialisation may lead to reduced need for donor support in the longrun, in order to make it work there are considerable donor investments that need to bemade initially (e.g. market research, advertising, production set-up). Moreover, there arecertain aspects of stove programmes that are difficult to commercialise and might needto be covered in the long term by non-commercial bodies e.g. training, M&E, qualitycontrol.

66
8.4.5 Institutions involved in stove programmes in India
8.4.5.1 The principle organisation involved in the National Programme for Improved Chulhas(NPIC) is the Ministry for Non-Conventional Energy Sources (MNES). It forms part of thegovernment’s twenty point and minimum needs programme. The MNES allocates funds to stategovernments and is responsible for R&D, carried out by 17 technical back-up units. The NIPC isimplemented through state nodal departments and nodal agencies: autonomous bodies, housingcorporations, government departments, programmes, state agro industries corporations and one NGO,the All India Women’s Conference to meet an annual distribution target. The state implementingagencies provide support at the district, block and village levels.
8.5 Conclusions and Findings
1. Energy is an issue, though not a priority, for poor people in urban areas. Most of the fuelused is purchased and because people have to purchase in small quantities or cannot affordthe large deposit required for a gas cylinder they may pay more per unit of energyconsumed than much richer families and use a larger proportion of their, limited, income onfuel.
2. However, it became apparent during the field visit to India that there may be limited
opportunities for improving efficiency of energy use, other than assisting households to moveup the energy ladder, in the big cities. In towns, small cities and peri-urban areas there maybe more interest in investing in an improved wood-burning Chulha, though possibly from animproved health perspective than from potential energy savings.
3. Woodfuel users are the poorest in urban areas often transient/new arrivals. Additionally,
they cook outdoors. They are difficult to target. Many will probably eventually switch tokerosene (due to opportunity cost of woodfuel collection; peer pressure, safety aspects). Thisimplies a need to examine opportunity for supporting improved Chulha programme inappropriate areas.
4. Kerosene users need to be targeted through health programmes and to increase their
awareness of dangers of using kerosene in a poorly ventilated rooms. 5. There is need to put energy on the urban planning agenda. At present it has no place in
urban management in India.

67
8.6 A Guide to Key References and Contacts
6.1 Introduction
Nelson V. (1996) Rural Energy Security: A Literature Review. A report for the DFID ForestryResearch Programme, Fuel-efficient technology: Incentives and Constraints to Household AdoptionProject. Natural Resources Institute.
6.2 The Problems: Links between Energy and Poverty at the Household Level
Reddy A.K.N., Williams R.H. and Johansson T.B. (Year?) Energy After Rio: Prospects andChallenges. UNDP in collaboration with International Energy Initiative and Energy 21, StockholmEnvironment Institute.
Section 2.1: Energy and Social Issues.
6..2.1 The urban poor and household energy use: setting the scene Gopalan S. (1990) Energy for Cooking and the Poor. In: Journal of Rural Development, Vol. 9 (1),pp. 153-172. (This article provides a general overview of factors that lead the poor bear the brunt ofincreasing prices of biomass fuels, and restrict their opportunities to shift to more energy efficientfuels. It has a special focus on India).
6.3 The conceptual framework
6.3.2 Poverty impacts of fuel scarcity ITDG (1992) Women, Woodfuel, Work & Welfare. Boiling Point, ITDG, Rugby, UK. No. 27, April1992
6.3.2.4 Health costs
ITDG (1992) Women, Woodfuel, Work & Welfare. Boiling Point, ITDG, Rugby, UK. No. 27, April1992
Fuel Shortages and Women’s Health (pp. 2-4)
6.3.3 Health problems associated with inefficient combustion of fuels ITDG (1994) Smoke Removal. Boiling Point, ITDG, Rugby, UK. No. 34, September 1994.
Introduction (pp. 1-2) Smoke in the Kitchen (pp. 3-4)
Smith, K. (1991) Biomass cookstoves in global perspective: energy, health, and global warming,Paper prepared for the Informal consultation of epidemological, social, and technical aspects ofindoor pollution from biomass fuel, WHO, Geneva
6.4 Options for Addressing the Poverty Impacts of Fuel Scarcity and Inefficient Combustion
6.4.1 Options for Addressing Fuel Scarcity
Munslow B., Katerere Y., Ferf A. & O’Keefe P. (1988) Part Three: Urban Areas. In: The FuelwoodTrap: A Study of the SADCC Region. Earthscan Publications Limited, London, UK.
11.4.1.4 Changes in Household Practices

68
Nelson V. (1996) Rural Energy Security: A Literature Review. A report for the DFID ForestryResearch Programme, Fuel-efficient technology: Incentives and Constraints to Household AdoptionProject. Natural Resources Institute.
Chapter 4: Household coping strategies for fuelwood scarcity (pp. 18-23)
6.4.2.5 Options for addressing the health impacts of pollution due to Inefficient combustion
6.4.4 Conclusions
8.2 Improving Energy Efficiency (A): Improved Stoves in Urban Areas
Boiling Point: Stoves and Household Energy Programme, Intermediate Technology DevelopmentGroup. This is a quarterly journal which focuses specifically on improved stove programmes indeveloping countries, with a practical and interdisciplinary perspective.
Household Energy Developments in Asia. Boiling Point, Issue No. 34, May 1994
Household Energy Developments in Southern and East Africa. Boiling Point, Issue No. 29, Dec. 1992
Asia Regional Cookstove Programme (ARECOP): Jalan Kaliurang KM 7, PO Box `9 Bulaksumur,Yogyakarata, INDONESIA. This is a network whose aims are to increase communication, exchangeof expertise and provide support to local stove initiatives in countries in the Asia region.
KENGO. P.O. Box 48197, Nairobi, KENYA. This is an NGO who was centrally involved in theKenya stove programme which included the Kenya Ceramic Jiko, and is now recognised as a regionalcentre of expertise on stove programmes.
Energy Sector Management Assistance Programme (ESMAP), UNDP/World Bank. ESMAP aims toprovide technical assistance and institutional support to energy sector institutions in developingcountries. Nearly 50% of ESMAP's resources have been used to fund household energy initiatives.
8.2.1 Introduction
8.2.2 Benefits of Improved Stoves for the Urban Poor
8.2.4 Types of benefits to the poor
8.2.6 Target groups
8.2.7 Conditions for success
8.2.8 Limitations of improved stoves for the urban poor
8.3 Improving Energy Efficiency (B): Fuel-switching – Moving up the Energy Ladder?
8.4 The Roles of Different Institutions
Appendix A: Preliminary Guidelines for Designing, Developing, Monitoring and EvaluatingHousehold Energy Interventions
German Appropriate Technology Exchange (1980) Helping People in Poor Countries Develop Fuel-Saving Cookstoves. Produced by Aprovecho, Eugene, Oregon, U.S.A. (This is a manual on how todevelop improved stove programmes, with a good overview of the various stages involved fromappraisal to promotion and dissemination. It provides a good balance between social and managementissues on the one hand, and practical and technical issues on the other hand.)

69
1 Identify the Problems
2 Identify potential solutions
3 Hold consultations with target groups (poor urban households) to refine definition ofproblems
3.4 Develop an understanding of social issues that influence or are influenced by stove use
German Appropriate Technology Exchange (1980) Helping People in Poor Countries Develop Fuel-Saving Cookstoves. Produced by Aprovecho, Eugene, Oregon, U.S.A.
Chapter II: Finding Information: Socio-cultural Checklist (pp. 31-2)
3.4 Develop an understanding of technical issues relating to stove use
German Appropriate Technology Exchange (1980) Helping People in Poor Countries Develop Fuel-Saving Cookstoves. Produced by Aprovecho, Eugene, Oregon, U.S.A.
Chapter II: Finding Information: Technical Checklist (pp. 33-4)
4 Design and field test a range of prototype stoves in collaboration with target groups
German Appropriate Technology Exchange (1980) Helping People in Poor Countries Develop Fuel-Saving Cookstoves. Produced by Aprovecho, Eugene, Oregon, U.S.A.
Chapter III: Developing Stoves with Local People: the role of the development worker
5 Evaluate prototypes, and draw up profiles for most successful prototypes (advantages,disadvantages, who it is most likely to benefit, under what conditions, constraints to adoption)
6 Identify methods for promotion, dissemination, production, marketing, training andmaintenance
German Appropriate Technology Exchange (1980) Helping People in Poor Countries Develop Fuel-Saving Cookstoves. Produced by Aprovecho, Eugene, Oregon, U.S.A.
Chapter IV: Promotion and Dissemination
Sales and Subsidies: Boiling Point Issue No. 30, April 1993. Practical Tips for a Marketing Strategy (pp. 31-32)

70
PART III
THE INDUSTRIAL SECTOR

71
9. DEVELOPMENT PERSPECTIVE AND ENERGY EFFICIENCY: Need for aBroader Perspective.
9.1 Introduction
9.1.1 Part III concentrates on examining the links between industrial sector activities, energyefficiency and poverty. It highlights the policy implications for developing energy efficiencyprogrammes, identifies and examines energy intensive industrial activities which could be targeted forintervention.
9.1.2 This chapter shows that, in the context of developing countries, there is a need for a broaderperspective within which energy efficiency measures have to be located. Drawing on evidence fromAsia and Africa, it argues that focusing only on combustion related pollution will not produce anydiscernible environmental benefits. However, an energy-led initiative encompassing the issuesdiscussed could improve ambient and work place pollution.
9.2 Energy Efficiency
9.2.1 Energy efficiency as a concept has a range of interpretations. At a strictly technical level,energy efficiency is a measure of useful energy output compared to energy input. This is conversion ofelectricity to other forms of energy, say to electric light, it would be the energy value of theillumination compared to the energy input to the lighting device. For fuel usage, energy efficiencywould be the energy output as heat and/or power compared to the energy input as defined by the fuelmass and gross or net calorific value.
9.2.2 Measures to increase energy efficiency of process operations have been recognised as beneficialboth in terms of cost savings and to reduce the demand for energy resources. This monitoring andimproving energy efficiency for the whole range of energy using operations has attracted muchattention. In developed countries, this activity was initially promoted strongly by governmentincentives and support mechanisms, but it is now much more market driven activity. However, asdiscussed in the previous chapter, as the resource issue has taken more importance, the relevance ofenergy efficiency for conservation of energy and as a means to address target obligations for CO2
emission reductions has increased.
9.3 Developing Countries and Associated Issues for Technological Change
9.3.1 Research and experience in developing countries have shown that there is considerable overlapof issues when dealing with industrial pollution. The approach to the problem is conditioned by thesize of industrial units. There is general agreement that in large industries issues of energy efficiencycan be separated and dealt with. The large firms have the financial and technical ability to do so. Insmall and medium sized units the problem is more complex. In these units inefficient energy use isone of several reasons for air pollution. Other equally important contributory factors are absence ofwaste management, poor work practices and housekeeping, inefficient resource use, disregard and/orlack of health and safety standards and low environmental awareness.

72
9.3.2 To achieve discernible environmental improvements a broad perspective is called for.Experience shows that whether the objective is to reduce pollution through improved wastemanagement or enhanced efficiency in energy and/or resource use, the approach to the problem has toacknowledge the inter-connectivity of the various factors contributing to pollution.
9.3.3 Section 9.4 sets out a detailed case study from India and section 9.5 provides additionalempirical evidence from Asia and Africa, on which these inference are based.
9.4 Evidence from India
9.4.1 Lead Smelting Units in Calcutta: This case study (Dasgupta: 1997) details the process flows inan industry with the aim to highlight the inefficiency of resource and energy use, poor work practicesand absence of waste management practices which together contribute to air pollution. The evidencepresented here is based on an in-depth analysis of the attempts made by a cluster of units, threatenedwith closure, and by the environmental agency to reduce pollution so as to comply with theenvironmental standards, within one year (August 1994-August 1995).
9.4.2 Lead smelting is a wide spread activity in India employing thousands of low income workers.Size of units range from employing 10 to 50 workers. Most of these units, initially located outside theurban areas, have now been swallowed up by urban expansion of low income households. The rawmaterials used by these units are lead plates from old batteries, coal and charcoal..
9.4.3 Furnace: A simple brick structure with four firing pits i.e., four doors to the same furnace withno separating walls. There is one chimney stack for all four firing pits. This means that opening anyone door affects the efficiency of all the others. All pits are not always loaded before starting thefurnace. Loading often takes place while the furnace is on.
9.4.4 Process: The plastic shell is cracked open and the lead plate removed. The plates are thenmixed with coal and charcoal and smelted in the furnace. The lead which separates from the slag iscollected and made into ingots. The slag is stored until a substantial amount has built up. It is re-smelted several times for further extraction. (See Fig. 9.1)
9.4.5 Pollution:
∗ high level of noise pollution when the batteries are broken up;∗ sulphuric acid is released when batteries are broken up. This flows into drains and surrounding
areas contaminating land and water;∗ sulphur dioxide and carbon monoxide are released during the smelting process;∗ lead oxide forms a major part of the suspended particles released and the fine dust is easily
carried by the wind;∗ inefficient use of furnace results in excessive smoke and pressure in the chimney stack, forcing
some of the smoke back into the workplace; and∗ seepage from the slag stored for re-smelting contaminates land and water.
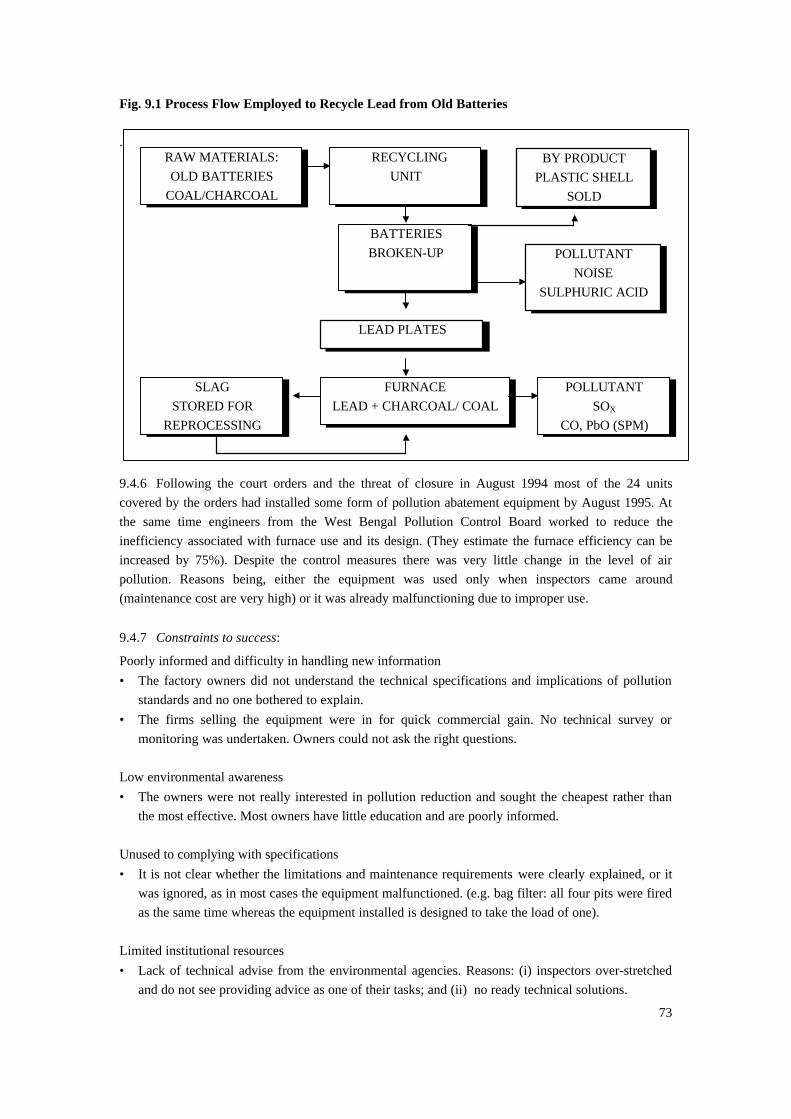
73
Fig. 9.1 Process Flow Employed to Recycle Lead from Old Batteries
.
9.4.6 Following the court orders and the threat of closure in August 1994 most of the 24 unitscovered by the orders had installed some form of pollution abatement equipment by August 1995. Atthe same time engineers from the West Bengal Pollution Control Board worked to reduce theinefficiency associated with furnace use and its design. (They estimate the furnace efficiency can beincreased by 75%). Despite the control measures there was very little change in the level of airpollution. Reasons being, either the equipment was used only when inspectors came around(maintenance cost are very high) or it was already malfunctioning due to improper use.
9.4.7 Constraints to success:
Poorly informed and difficulty in handling new information• The factory owners did not understand the technical specifications and implications of pollution
standards and no one bothered to explain.• The firms selling the equipment were in for quick commercial gain. No technical survey or
monitoring was undertaken. Owners could not ask the right questions. Low environmental awareness• The owners were not really interested in pollution reduction and sought the cheapest rather than
the most effective. Most owners have little education and are poorly informed. Unused to complying with specifications• It is not clear whether the limitations and maintenance requirements were clearly explained, or it
was ignored, as in most cases the equipment malfunctioned. (e.g. bag filter: all four pits were firedas the same time whereas the equipment installed is designed to take the load of one).
Limited institutional resources• Lack of technical advise from the environmental agencies. Reasons: (i) inspectors over-stretched
and do not see providing advice as one of their tasks; and (ii) no ready technical solutions.
BY PRODUCTPLASTIC SHELL
SOLD
LEAD PLATES
POLLUTANTNOISE
SULPHURIC ACID
RECYCLINGUNIT
BATTERIESBROKEN-UP
SLAGSTORED FOR
REPROCESSING
FURNACELEAD + CHARCOAL/ COAL
POLLUTANTSOX
CO, PbO (SPM)
RAW MATERIALS:OLD BATTERIES
COAL/CHARCOAL
74
• Regular monitoring too expensive.
Most owners are very bitter about their experience as considerable investment has brought no benefitseither in terms of environment or profits.
This case study demonstrates that there is considerable scope for increasing the thermal efficiency offuel use in these units. However, to have any impact on the overall pollution situation, it would beessential to improve work practices, advance environmental awareness and introduce wastemanagement techniques.
9.5 Additional evidence:
9.5.1 Much of the research on environmental improvements in small scale industries focus onmanagement of effluents rather than on emissions. This is perhaps because the source and the impactsare more easily identified and hence easier to deal with. However, some of the findings of thesestudies/experiences with respect to introducing cleaner technology and improving waste managementare also valid for emission control through enhanced efficiency. These findings relate to constraints toimplementation arising from inherent characteristics of small industries. Some of these inferences aresummarised below.
9.5.2 Hong Kong: Most small factories (<20 workers) are located in multi-storey buildings whereinstallation of pollution control equipment is difficult. Arrangements were made to collect waste freeof charge and treat waste centrally. 8000 units registered. All agreed to store their chemicals on siteand arrange proper disposal. Factors contributing to success are: extensive consultation with tradeassociations, awareness raising and information dissemination; and combination of “carrot” (freecollection/ treatment) with “stick”(heavy penalties for non-compliance), (Lei & Young 1993).
9.5.3 India: Chandak (1994) notes that pollution reduction programmes for paper and pulp, textiledying and printing and pesticide formulation were easier to implement in large scale industries thanin small units. The author attributes it to barriers inherent to enterprise size, i.e., organisational,technological and economic, among others.
9.5.4 Evidence from Bangkok (Lohwongwatana et al 1990), Cairo (Hamza (1991), Hong Kong (Chiu& Tsang 1990; Mexico (Mendoza (1991) India (Tikko: 1992) shows that lack of space is an importantconstraint to technological change and to improved waste management.
9.5.5 In some instances the size of the unit itself can be a constraint to technological change. In Asia,rice processing is one of the largest sectors in peri-urban and rural area. It recycles the waste product(husk) as a fuel. However, studies have indicated that the thermal efficiency, from a combustion pointof view, is grossly inefficient. A study by the EC-ASEAN Cogen Programme (AIT, 1994) forIndonesia, Malaysia, Philippines and Thailand was undertaken to establish the scope of enhancing theefficiency of fuel. It concluded that overall product capacity was dominated by small scale operation,where the average rice mill output was only 560 tonnes per year. Similar pictures for rice processinghave been described for Sri Lanka (Hollingdale & Coote, 1991) and for Bangladesh (Tariq 1998).Also this same pattern for the rice processing sector is evident from the Indian statistics reviewed forthis report. Though several technological options have been developed, the constraints to uptake havenot been identified.
75
9.5.6 Lin (1994) with reference to Hong Kong stresses the importance of developing “win-win”technologies that eliminate pollution control costs while also reduces manufacturing costs. TheUNIDO (1996) project DESIRE (Demonstration in Small Industries for Reducing Waste), in India,also stresses the need to highlight the gains, in terms of increased efficiency, higher material recoveryand lower waste generation, from technological change. Segments of the industry also realise itsimportance. In Surat, Gujarat, a voluntary organisation ‘Waste Minimisation Group-Surat’ has beenset up by technical experts from various chemical industries. Some of their objectives are: to increaseenvironmental awareness; to create awareness of source reduction of costs and of pollution byoptimum utilisation; to create awareness of cost reduction that can be achieved by efficient utilisationof water and energy (UNIDO: 1996).
9.5.7 Scott (1998) in a review of Environmental Impact of Small Scale Industries in the Third Worldnoted that while they do not have significant environmental impact from a national point of view, theycan have severe detrimental effects locally. Following an in-depth analyses of brick making and goldmining industries in Zimbabwe and textile dying in Bangladesh, he notes that “policy, organisationaland technological approaches are possible means to improve the environmental performance of small-scale industries”. Furthermore, identification of constraints and incentives to adoption of mitigationmeasures or development of cleaner technology requires the investigation of both socio-economic andregulatory context in which small producers operate.
9.6 The Socio-Economic Context
9.6.1 The social and economic roles played by the small industries in developing countries help toexplain why several over-lapping issues have to be tackled to achieve pollution reduction throughtechnological change.
9.6.2 At the macro-economic level developing countries are characterised by structural dualism (longterm co-existence of modern and traditional; of a rich elite and mass of illiterate poor), persistent longterm unemployment and poverty. Most developing countries in Asia have a modern industrial sector,with reasonably well developed factor and product markets, capital stock, professional managementand ability to change. The Centre for Science and Environment in India (1985) noted that this sectorhas the means to acquire the technology and the expertise necessary to improve environmentalmanagement. This part of the industrial sector is similar to that found in other countries and hascharacteristics that fall outside any particular national socio-economic context. Issues of how farproducers externalise their costs of pollution will fall within the framework of national environmentallegislation.
9.6.3 As a matter of national development policy most developing countries encourage the smallscale sector because of its employment generation capacity. This is done through subsidies, creditfacilities and product protection. With its low barriers to entry, it is expected to generate livelihood forthose with limited resources, knowledge and skills. Thus, the preponderance of the small-scale sectorof industry is a more identifiable attribute of the developing countries.
9.6.4 It is the lower levels of resources (human and financial) associated with this sector that modifythe relations between capital, labour and technology and differentiate it from large scalemanufacturing. It makes environmental management in small industries operationally more complex.
76
9.6.5 Some inherent characteristic of small scale industries which impinge on technological changeare:
(a) The choice of technology is adapted to availability of capital, space, raw material and skill-local and in the family (Sethuraman: 1992).
(b) Available knowledge and information base is low. This is reflected in poor work practices andin the disregard for health and safety aspects. Additionally, the low exposure to informationmeans limited ability to handle new information as demonstrated in the case of lead smeltingunits.
(c) Possibilities that managerial and technical abilities among owners and managers are likely tobe low (Sethuraman: 1992).
(d) Limited resources means predominance of short term profit maximisation over long termgains. This would make it difficult to sell the standard ‘business’ argument that greaterefficiency and higher material recovery leads to improved profits in the long run.
(e) Smaller units have a lower capital-output ratio compared to a competitive large unit(Sandesara: 1992). This often leads to lower investible capital in the long run.
9.7 Conclusion
9.7.1 The evidence provided in this chapter highlights the difficulties of achieving environmentalimprovements in small industries. The background and the compostion of this sector calls for acomprehensive approach to problem. The findings of this chapter are summarised below.
Findings
1 The need for a broader perspective implies that focusing only on combustion relatedpollution will not produce any discernible environmental benefits. However, an energy-ledinitiative encompassing the issues discussed above could improve ambient and work-placepollution.
2 Pollution control and energy efficiency in small industries cannot be expected to followfrom simply superimposing models that have been used for large industries. These operationsare still essentially rooted in a socio-economic culture that has largely been displaced in thedeveloped countries.
3. It is important to develop ‘win-win’ strategies that eliminate pollution control costs andalso reduces manufacturing costs. It is crucial to inform industry of economic gains that could bemade in terms of increased efficiency, higher material recovery and lower waste generationfrom technological upgradation and process improvements. It would help counter their negativeperceptions and attract their attention.

77
10. ENVIRONMENTAL IMPROVEMENTS IN SMALL SCALE INDUSTRIES:Benefits the Poor and the Industry.
10.1 Introduction
10.1.1 One of the objectives of this study is to identify those energy intensive industrial activitieswhere enhanced energy efficiency would lead to environmental improvements, which in turn wouldgenerate direct socio-economic gains for the poor and the industry. Based on extensive literaturereview, wide-ranging discussions with research organisations, practitioners and policy makers inIndia, it is argued that (i) environmental gains in energy intensive sub-sectors of small scale units,employing large number of low income workers and which form clusters in proximity to low incomehousing, could have considerable impact on poor workers and on the neighbourhood; (ii) theenvironmental gains will enable compliance and remove threat to livelihood opportunities fromclosure of industries; and (iii) the efficiencies achieved would increase returns for the owner in termsof savings in input, reduced waste generation and lower costs of pollution control. However, tomaximise the impact of any energy-led initiative a broader approach encompassing other issues likegood house-keeping, good work practices and overall waste management, needs to be developed
10.1.2 The next chapter identifies energy intensive sub-sectors of small scale industries. This chapterfocuses on setting out the bases for the above argument. It first shows why the emphasis is on smallrather than large scale industries before discussing why benefits could flow to the urban poor (section10.3) and to industry (section 10.4) from energy-led initiatives in small scale industries.
10.2 Large Industries
10.2.1.1 There are three sets of reasons for not focusing on large scale industries. One, the directimpacts on poor groups, of environmental improvements in the limited number of large scaleindustries, is difficult to establish. Two, the work-place health and safety standards are adhered, theworkers are well-paid and protected by strong unions; and three, large manufacturers have thefinancial ability and the in-house technical expertise to enhance efficiency in fuel and resource useand to comply with environmental standards.
10.2.1.2 Large industries and poverty impact: The dispersed pattern of their location and the scale ofoperation means that the impacts of any improvements would be realised over a large geographicalarea covering various income groups. This means that all economic groups would gain from suchimprovements. Hence, the direct impact on poor groups is difficult to identify and assess.
10.2.1.3 Workers in large industries: In sharp contrast to the conditions which exist in the small andmedium sector units, the workers employed in large industries are relatively better off. They benefitfrom higher wages, pension schemes, insurance against injury and the protection of strong unions.They are often provided with subsidised housing, particularly in the public sector. Work place healthand safety standards are generally high. The term ‘labour aristocracy’ is sometimes used to describeworkers in large scale modern manufacturing units.
10.2.1.4 Higher compliance: Large manufacturers have the financial resources and technologicalexpertise to comply. Higher efficiencies could be achieved through a mix of market and non-market

78
inducements. However, Dr. Maudgal, Senior Advisor- Clean Technology, Ministry of Environmentand Forests, noted that the government first needed to correct market distortion by removing subsidieson power, main raw materials and water. Hence assistance to this sector cannot be justified.
10.2.1.5 Additionally, though there are laggards in the industry, large manufacturers have generallytended to comply because (i) large firms are highly ‘visible’ and pollutants can be traced back to theirsource. In the state of Gujarat, the State Pollution Control Board is developing a GeographicalInformation System to monitor effluent discharge; (ii) large firms producing brand names do not wishto attract negative publicity; (iii) the government owns (part of) a substantial number of large scalefirms. This provides potential leverage to impose environmental compliance; and (iv) there is anincreasing realisation that there can be economic gains through waste minimisation and increasedefficiency of fuel and resource use.
10.3 Energy-led Initiatives in Small Industries and Poverty Links
10.3.1 Energy-led initiatives leading to environmental improvements could generate benefits for thepoor and the industry. This section examines the poverty impacts while Section 10.4 looks at thebenefits that could accrue to industry.
10.3.2 Environmental improvements can generate benefits for the poor because:
(i) In Indian cities, the intra-urban spatial differences in pollution impact is deepened by theclustering tendency among small and medium industries;
(ii) Small scale industries, which employ thousands of low income workers, are being threatened withclosure for non-compliance but lack the means to deal with the problem. Enabling industry to complywould remove this threat to livelihood opportunities; and
(iii) These workers are exposed to high levels of work place pollution.
10.3.3 Intra-urban differences in pollution impacts and clusters of small industries
10.3.3.1 As noted in Chapter 3, urban growth tends to group enterprises in cost effective spatialconfiguration. Cheap housing and industrial activities tend to be located on lower cost land in urbanarea. There is evidence that this spatial juxtaposition of industrial and low income housing createspecial environmental and health risks for the poor. Additionally, in certain locations the externalitiesof urban production are disproportionately borne by the poor.
10.3.3.2 In Indian cities this spatial configuration, and hence the differentiation, is intensified by thetendency of small and medium industries to form clusters. Industrial clustering as a process andindustrial clustersH as spatial entities have existed in India for centuries as efficient business andproduction systems contributing to the development of small and medium enterprises. These clustershave been defined as local agglomeration of industrial units manufacturing or providing similar typeof goods or services with well established linkages with service providing units. The original reasonsfor natural clustering ranges from proximity to market, availability of raw material and specific skills.
H Industrial clusters are discussed in detail in Chapter 12 in the context of environmental initiatives.
79
There are induced clusters, for example the automobile component industry at Gurgaon, whichdeveloped following the setting up of public sector car manufacturing unit. These are usually locatedin planned industrial zone and are not considered in this study.
10.3.3.3 Some natural clusters were initially located outside the cities and have been subsequentlyswallowed by mixed land-use and/or low income housing expansion. Some have always existed insidecities. Some examples are, the foundries at Howrah which developed at the turn of the nineteenthcentury to supply the jute mills and then Indian Railway; the cluster of traditional glass industry inFerozabad; the footwear industry in Agra where 5000 units thrive; the lock making clusters at Kanpurand Howrah; electric fan production in Calcutta; hosiery knitting clusters in Tripur and Calcutta. Sizeof clusters vary from about 20 units to several thousands. UNIDO (1998) has identified 138 cluster,each containing more than 100 units. It estimates that there are 350 modern SME clusters in urbanareas and 2000 artisan based rural clusters. Thus, industrial clustering is an important spatialphenomena.
10.3.3.4 Of relevance to this study is the fact that most of these natural clusters are characterised byold technology which has not been improved for generation, inefficient use of fuel and raw material,lack of scientific control of production processes, unreliable product quality, high waste generation, nohousekeeping, poor work practices and high work place and ambient pollution. Since the early 1990sa school of thought has argued that small enterprises are technically less efficient than largerenterprises and therefore likely to produce more pollution per unit of production. This is largelyaccepted in India today, where the general understanding is that while labour and capital productivityin small industries may sometimes be comparable to large industries, its material productivity isusually lower, resulting in more pollution per unit. Bhalla (1995) estimated that while SSIs contributeto around 50% of industrial production, their share of industrial pollution amounts to 65%.
10.3.3.5 From field experience all practitioners and researchers agree that high levels of air pollutionare associated with some of these clusters, exacerbating the intra-urban differentiation of pollutionimpact on the poor. Hence, the workers involved and the surrounding neighbourhood of poor residentscould directly benefit from reduction in air pollution which is detrimental to health.
10.3.3.6 It is important to note, that though there is a consensus that poor live close to pollutedneighbourhoods and therefore suffer disproportionately, no socio-economic - environmental researchhas been conducted to establish the affect/associations of cluster based pollution on urban poor.
10.3.3.7 (A methodology to address this gap in research has been developed by this study team indiscussions with TERI. This is described at the end of this chapter. A better understanding of thelinks would allow environmental proposals to incorporate wider social issues to benefit the poor and atthe same time, to guard against the dis-benefits of technological change).
10.3.4 Small scale units: threat of closure jeopardises livelihood opportunities
10.3.4.1 Section 5.5.4 noted the more stringent environmental enforcement in recent years. Smalland medium industries have been at the centre of these developments and are threatened with closure.This makes it imperative for these industries to improve their energy and environment performance.This is fundamental to ensuring their survival and to maintaining the livelihood opportunities of alarge segment of the urban poor. TERI notes that there are many energy intensive sub-sectors where

80
the energy cost forms a substantial proportion of the total production cost, yet these units arecharacterised by low energy efficiency. Thus there is considerable scope for energy-led initiatives.
10.3.4.2 However the problem arises because unlike the large scale sector small industries lack thefinancial and technical expertise to deal with the problem. A World Bank report (1991) concludedthat pollution problems are more acute among SSI. Some of the reasons for low financial andtechnical ability are:
♦ Given the structural dualism and the limited employment generation capacity of large industries,the small scale sector in India is expected to generate employment for those with limited skills andresources• . It is encouraged through subsidies, credit facilities and product protection.
♦ Small industries are predominantly family run businesses. ♦ This brings to the sector lower levels skills, literacy and resources. Consequently the available
knowledge and information base is limited. Business decisions are more influenced by the family’scontacts and perceptions. Reaction to, and interpretation of, new information is greatly influencedby the owner’s socio-economic background.
♦ According to Sethuraman (1992) the choice of technology is not a technical decision. Technology
is adapted to availability of capital, space, raw materials and skills available in the family orlocally. This contrasts with the behaviour of large enterprises which choose optimal combinationof resources in view of the technology used.
♦ The technology used is often the cheapest and very rarely upgraded. A survey of 130 small firms
(Dasgupta 1998) in Delhi showed that investment was made to expand production using the sametechnology. There were no instances of technology up-gradation.
♦ The dominant short-term profit maximisation behaviour leads to lower income in the long run.
This often lead to limited investible surplus. ♦ Small industries pay little or no attention to work-place health and safety conditions, to house-
keeping or good work practices.
10.3.4.3 Thus the small industries, which contribute substantially to industrial pollution are nowthreatened with closure because they are unable to understand and/or meet the environmentalstandards. More important for this study is that they employ 48% of the industrial workforce in themanufacturing sector. The estimated employment provided by this sector is 16.72 million (DCSSI:1998). The position of the workers in small industries is extremely precarious and vulnerable. Thewage market is poorly developed and wage rate is often arbitrarily determined by the owner. There isno written job contract. This means, they can be fired any time without compensation jeopardising thelivelihood strategy of the entire household.
10.3.4.4 An analysis (Dasgupta 1998) of the closure of 1328 small and medium industries in Delhiestimated that 125,000 workers had been made unemployed. None, except the workers in aGovernment of India enterprise, received any compensation. Workers interviewed noted that most
• This does not include the small electronic and information technology sub-sectors.
81
were the main bread-winners in the household. Loss of main source of income had severely weakenedthe livelihood strategies of their households and put extra pressure on other earners and the women.
10.3.5 SSI workers are exposed to high work place pollution.
10.3.5.1 Even though small enterprise growth is central to India’s developmental strategy, little or noattention has been given to the appalling working conditions found in these enterprises. This isextremely well documented by researchers. In addition to poor wages and insecurity of job tenure,inefficiencies in production processes, poor fuel and material recovery, high levels of waste generation(emissions and effluents), the absence of good house-keeping and dumping of waste means workersare exposed to high work place pollution. Consequently employees suffer poor health which oftenlimits their ability to work. Workers interviewed in glass, lead and acid processing factories inCalcutta claimed that they had to take a year out from work every three years (GHK/ODA: 1994).
10.4 Energy-led Initiatives and Economic Gains for Small Industries.
10.4.1 It has been shown (pp 75) that there is limited awareness of gains that could accrue toindustry from increased efficiency, technological upgradation and process improvements. Benefits ofincreased efficiency are two fold: one, higher return per unit of input; and two, reduced wastegeneration and therefore lower pollution load.
10.4.2 Higher returns: The Sri Lanka case study demonstrated the potential for annual fuelwoodsavings for industry (Table 5.5). Increase in thermal efficiency from 50% to 70% could generatepotential fuelwood savings of Sri Lankan Rs. 509.9m. The experience of Waste Minimisation Circlesin India (discussed in detail in Chapter 12) shows considerable savings. Table 12.2 shows that minorchanges to technology, fuel switching (replacing coal with waste product - bagasse, in paper and pulpindustry), and to work practices (covering kerosene tank to reduce evaporation and loss) can lead tosubstantial savings on fuel and other input costs. In the metallurgy industry (discussed in section12.3.3.5) the shift from batch furnace to continuous production furnace generates 20% fuel savings,ensures uniform product quality and reduces work place pollution.
10.4.3 Increased return and lower bills do not however, mean an increase in the wages for theworkers. The wage rate change will be determined by shifts introduced in the labour market folowingtechnological changes. It could create a demand for more skilled workers. This could either be met byretraining workers already employed or by replacing them with skilled workers. In the first instancethe workers would be better off, but in the second, the displaced workers could slip further down inthe labour market.
10.4.3.1 Lower pollution load: Improved efficiency of fuel would mean proportionate decrease in fuelusage. This would lead to overall reduction in waste generated. The demonstration unit set up byTERI in Chamrail (Howrah) replaced a traditional front-loading furnace with a divided blast cupolawith heat recovery system (see section 12.3.4). This has resulted in 20% fuel savings for the unit and aproportionate reduction in emissions. This could have implications for subsequent end-of-pipemeasures.
10.4.3.2 It is pertinent to note that, in India, the present subsidies on fuel and some industrial rawmaterials are a dis-incentive to enhancing efficiency. However, over a period of time, in keeping withthe economic reforms, all subsidies will be reduced. This will make it important for industry to

82
address the problems of inefficient fuel and resource use. Another component of economic reforms isthe de-regulation of the power sector. Privatisation is expected to increase revenue collection and thetariff to reflect the true cost of electricity generation and use. This will have major implications forsmall industries who at present either avoid paying their bills or ignore the cost.
10.5 Conclusions
10.5.1 The analysis in this chapter shows the need to target small polluting industries. The survivalof a large segment of urban poor depends on how effectively the small industries are able to tackletheir environmental problems. Reducing pollution at the cluster level will also benefit the workers andthe local population in terms of improved environment. Industry can make considerable gains fromincreased efficiency of resource use. However, it is important to demonstrate these benefits.
Findings
1. Reducing intra-urban differentiation in pollution impact can benefit the poor communitiesaffected. In India this differentiation is deepened by the clustering tendency of smallindustries. This provides a clearly identifiable spatial unit for poverty-environmentinitiatives.
2. The people who participate in the manufacturing sector are not the ‘poorest of the poor’ but
the workers in the small scale sector constitute an extremely vulnerable segment of thesociety. Insecurity of job tenure, appalling working conditions and threat of closure and lossof livelihood make them an important target group.
1 Communities of low income housing with low levels of empowerment but subject to high
levels of industrial pollution form an equally important target group. 2 Both these groups can benefit from initiatives which aim to increase efficiencies and to
reduce overall pollution. 3 Benefits of improved environment are lower environmental health risks and lower incidence
of respiratory related illness. This often translates into ability to work for longer periodsand reduced medical expenditure.
4 Enabling small industries to meet their environmental responsibilities will contribute to
their growth and to the income generation opportunities for the poor. 5 Increased efficiency can generate gains for industry in terms of reduced input bills and
lower pollution load. 6 Expected increase in price of fuel, electricity and raw materials as economic reforms
progress, have significant implications for small industries. It is important to enable themto anticipate and to address the problems.
Note:Methodology for cluster analysis to examine environment-poverty links discussed in 10.3.2.6

83
These are likely to be the following elements of activity necessary to apply a modelling approachdrawing on GIS techniques and to enable a study of the environmental impact of combustion andairborne pollutants upon the local environment in the neighbourhood of a cluster.
♦ Access to existing, or generating of new, measurement of air quality standards for surroundingareas, through data obtained from fixed monitoring sites at selected locations and for specifiedpollutants and levels of accuracy.
♦ Use of a GIS approach to provide spatial distribution of emitting sources and other aspects of thelocality, augmented with satellite imagery as necessary to update basic mapping information -with appropriate level of ‘ground truthing’ validation.
♦ Identification of cluster characteristics e.g., number of units, size, etc., of production units whichwill be the emission sources for the cluster analysis. Necessary measurement of production andoutputs, and selected combustion exhaust or pollutant emissions from representative sources, inorder to define specific or ‘surrogate’ emission equivalent from industries.
♦ Modelling of pollutant dispersal, including use of local climatic characteristics, to provide meansof surveying impact of these clusters through use of area source models to show distribution andextent of emission pollution from the clusters.
♦ Derive socio-economic and demographic data around the cluster through existing statistics/dataplus use of survey analysis as required.
Whilst, in the first instance, the above activities might be initiated for a focus on emissions resultingfrom energy use, it is likely that the approach will have wider applicability for pollution modellingand resource loss prevention. It would be logical to anticipate this wider applicability relative toairborne pollutants and resource waste minimisation from the outset of the work.
84
11. HIGH ENERGY USING SUB-SECTORS OF SMALL SCALE INDUSTRIES
11.1 Introduction
11.1.1 One of the principle exercises of this study was to identify energy intensive industrialactivities. Having established that environmental gains generated by pollution reduction in smallindustries could benefit the poor, the task in this chapter is to identify energy intensive sub-sectors ofsmall industries which could be targeted for assistance.
11.1.2 This chapter is organised to first describe the analysis undertaken by this study to identifyenergy intensive sub-sectors. It then describe the methodologies used by other organisations in Indiato do the same. This chapter concludes with a list of energy intensive sub-sectors of small industries.
11.2 Initial Analysis Undertaken by this Study.
11.2.1 The aim of this exercise was to develop a methodology to identify high energy usingcategories in the small scale sector. Attempts to obtain any meaningful data proved futile. The lastcomprehensive census had been conducted in mid 1989. It was hoped that more up to dateinformation pertaining to this sector could be obtained during the country visit to India. However, theCentral Statistical Organisation, which is a part of the Ministry of Planning and ProgrammeImplementation, was able to provide extensive data, in electronic form for large scale industries. Thiswas the Annual Survey of Industries 1993-94, issued in April 1997. It was decided to use this data todevelop and test the methodology, which could then be applied to data on small scale industries.
11.2.2 Industrial data in India, comes in three tiers with different levels of aggregation. The basis ofthe data is an industrial code classification by National Informatic Centre (NIC) that has 2, 3, and 4digit designation which represent decreasing levels of aggregation. This code classification applies tolarge, medium and small industries. Hence the methodology developed using data on large scale unitscould be applied to data on small scale industries.
11.2.3 For large scale industries, there are 19 2-digit categories, 199 3-digit categories and 393 4-digit categories. 199 3-digit categories were used as the data on 4-digit categories were not madeavailable. A list of parameters was established and through a process of de-selection 18 categorieswere identified as high energy using. (The detailed methodology is presented in Appendix C). Theapplicability of this methodology and the validity and relevance of the results were to be tested inIndia.
11.2.4 In India, the methodology was discussed at two different fora: first at the group meeting atTERI (see Table 1.1 for names of participants), and secondly, at meetings with the Commissioner andofficials of Development Commission- Small Scale Industries. TERI noted that while the methodologydeveloped was rigorous, the last comprehensive census on small scale industries was published in19811. It confirmed that since then major changes have taken place in this sector due to policychanges and economic reforms. Any results based entirely on these data would give spurious results.DCSSI confirmed that the recent data were patchy and incomplete. Several small surveys and studieshave been conducted in the absence of a census. However, a large sample survey was being conductedby the National Informatic Centre which would bring the information up to date. Interview with the

85
Head of the National Informatic Centre revealed that only production and employment data werebeing compiled as the sole objective was to establish the contribution of this sector to the nationalGDP. He also added that the 1988 census was now too dated to be meaningful.
11.3 Energy Using Sectors Identified by TERI
11.3.1 Under a programme funded by the Swiss Agency for Development and Co-operation targetingthe small scale sector, TERI has selected high energy using sub-sectors. It first shortlisted 41 4-digitcategories as high energy users. No strict procedures were followed. This shortlisting was done on thebasis of existing knowledge and field information. It is argued that the importance of any industrysub-sector from an energy view point is a function of both its energy intensity and the total number ofunits within that particular sub-sector. Hence, the energy consumption and the value of production ofthese 41 code categories were obtained (Table 11.1). This was cross-checked and corrected by unitbased energy audits. Casting and forging units received the highest ranking, followed by manufactureof edible oils and fats and manufacture of glass. These three sub-sectors together account for morethan 70% of the total energy use within the 41 sub-sectors shortlisted. To arrive at a national picture,a district-wise break-down of units under each of these 41 categories were obtained from NIC wing ofthe DCSSI. Clusters of units under each category were identified.
The list of high energy using sub-sectors and their geographical location generated by TERI could bean useful starting point for any future programme on energy efficiency enhancement.
Table 11.1. Consolidated List of High Energy Using Small Scale Industries Produced by TERI.
4-digitNICCode
Name of Industry sub-sector Total no.of units
Total energyconsumption (000’
Rs)
Total production(000’ Rs)
2021 Artificially dehydrated fruits 55 2618 498202023 Manufacture of fruit juice concentrate 217 5576 2106012026 Canned fruit and vegetables 41 980 660292100 Manufacture of hydrogenated oil 166 13954 4535542110 Manufacture of other edible oils and fat 16400 313443 200159982200 Industrial alcohol and blended spirit 39 7950 2893182311 Spinning and weaving of cotton textiles 641 26250 15520972320 Dyeing and bleaching of cotton textiles 64 12366 1929822420 Spinning, weaving and finishing of wool
& silk138 119 12116
2520 Dyeing/printing and bleaching of jutetextiles
2 72 4914
2674 Manufacture of artificial leather 2 159 33242749 Manufacture of industrial goods 143 1208 671092801 Manufacture of pulp (machine made) 5 559 61202802 Manufacture of paper (machine made) 283 9132 2140592903 Manufacture of industrial leather 207 6357 5461952909 Manufacture of other leathers 35 549 177363002 Manufacture of tyre and tube for cycles. 54 13208 2944003101 Manufacture of heavy inorganic chemical 940 138768 3659312

86
4-digitNICCode
Name of Industry sub-sector Total no.of units
Total energyconsumption (000’
Rs)
Total production(000’ Rs)
3106 Manufacture of basic organic chemicals 133 14358 4387913141 Manufacture of Toilet Soap 111 1853 1973353169 Manufacture of fibreglass material 76 1061 614903181 Manufacture of explosives 20 447 395663201 Manufacture of firebricks 122 27953 1236813204 Manufacture of clay tiles 1015 149739 7189803220 Manufacture of earthenware 306 3379 643853231 Manufacture of chinaware 550 83069 2608583232 Manufacture of sanitary ware 111 16253 815533233 Manufacture of insulators 84 6195 472603311 Manufacture of castings and forged iron 5547 768421 126471283316 Manufacture of Tools 111 2169 1184393317 Manufacture of misc. foundry and forged
products289 8965 325258
3341 Manufacture of brass and rollings 90 2377 1787843380 Processing of metal scraps 356 71093 23082503391 Melting and refining of other metal 120 3094 3084183433 Manufacture of locks 565 4724 2685283451 Manufacture of cutlery 273 1618 627313718 Manufacture of parts and accessories of
locomotives92 1688 99213
3728 Manufacture of parts and accessories ofwagons
276 8630 342246
3746 Manufacture of automobile parts 367 12934 7968533761 Manufacture of bicycles and frames 82 847 709733762 Manufacture of cycle rickshaws 92 115 27964
11.4 High Energy Using Sectors Identified by DCSSI
11.4.1 The government agencies for small scale industries have been forced to be pro-active by thethreat of closure to small polluting units. DCSSI commissioned several studies for sub-sectors itconsidered high energy users. Five studies were assigned to identify:
Energy Efficiency Gaps And Potential For Energy Conservation InSmall Scale Bakery UnitsSmall Scale Steel Re-rolling UnitsSmall Scale Plastic Processing UnitsSmall Scale Glass Production.Small Scale Ceramic Tableware Units.
11.4.2 These studies were conducted by Dalal Consultants and Engineers Ltd. New Delhi. Thoughthis team was shown copies of the reports no photocopies were allowed. These documents areconsidered confidential as they will be used to inform the next 5-year plan. This indicates thatimproving energy efficiency in small industries will be an important component of future SSI policy.

87
11.5 Findings
1. Energy intensive sub-sectors of small industries identified in India are:
Foundries producing castings and forgingGlass industryManufacture of edible oils and fatsSmall Scale Bakery UnitsSmall Scale Steel Re-rolling UnitsSmall Scale Plastic Processing UnitsSmall Scale Glass Production.Small Scale Ceramic Tableware Units.
2. Information on the geographical location of sub-sectors clusters is also available.
88
12. ASSESSMENT OF CLUSTER BASED ENVIRONMENTAL INITIATIVES ININDIA
12.1 Introduction
12.1.1 This chapter analyses the environmental initiatives taken by various Indian organisations inthe small scale industrial sector, some of which are funded by international lending agencies. Not allfocus on energy intensive industries. However, it is important to use the experiences of these projectswith respect to introducing cleaner technology and improving waste management to inform energy-led initiatives. The aim of this analysis is to draw out the implications for such an initiative.
12.1.2 There are two common factors in all these programmes. Extensive discussions withenvironmental agencies, officers from the Development Commissioner - Small Scale Industries,National Productivity Council, TERI and other practitioners showed that there are some scatteredattempts to deal with the problem of poor waste management and inefficient resource use in smallscale industries. Common to all these initiatives is an implicit consensus on the importance todistance these programmes from environment agencies or anything environmental, even though theprimary objective is to improve environmental management. The heavy handed approach of theenvironmental agencies and the subsequent court orders, which pushed end-of-pipe measures, havegenerated negative perceptions of environmental management at the factory level and a mis-trust ofthese agencies.
12.1.3 Another common factor in all these initiatives is a cluster-based approach. There are twoarguments for this. One, the demonstration effect of benefits that could accrue to the sub-sectorthrough improvements in resource use and waste management is higher; and two, it is more costeffective than targeting dispersed individual units.
12.1.4 This chapter briefly describes the nature, type and characteristics of clusters of smallindustrial units. It then discusses the initiatives taken by the following organisations:
1. The State Bank of India.2. Small Industries Development Bank Of India.3. Development Commission- Small Scale Industries.4. Tata Energy Research Institute.5. National Productivity Council.
This chapter concludes with a summary of implications for this study.
12.2 Industrial Clusters
12.2.1 Neither the central nor the state governments have had any special policy to promote clustersof small and medium enterprises. The industrial policy with regard to this sector has tended to targetindividual units within selected sectors for policy initiatives. With the increase in pressure on industryto reduce pollution, environmental agencies (government, semi-government and private-sector) haverecognised the potential of spatial clustering in rapid information dissemination and therefore inincreasing the demonstration effect of environmental initiatives. Several programmes have beenstudied by this team. All have adopted the ‘cluster approach’ to increase the demonstration effect. Thefundamental logic is ‘that 95% are imitators, only 5% are risks takers’. The benefits that can accrue to

89
the industry has to be demonstrated to the majority. This is particularly important as environmentalenforcement over the last few years has pushed end-of-pipe measures with industry seeing no benefits.
12.2.2 Development Commissioner- Small Scale Industries, recognised the importance of identifyingthese clusters and commissioned a study in 1997. It was funded by the UNIDO. The study titled‘Restructuring and Modernisation of Small and Medium Enterprise Clusters in India’ provides areview of these clusters. It proposes two typologies, one, based on stages of development and thesecond, based on relationships of units within a cluster. These provide useful descriptive information.Relevant for this study is the relationships that exist between units within a cluster. These intra-clusterlinkages would influence the design of any intervention programme.
12.2.3 There are two main types of linkages - horizontal and vertical. While both linkages arepresent in all clusters, one set of linkages tend to dominate. Clusters where horizontal links dominateare characterised by units which process the raw material to produce and market the finishedproducts. 55% of the 138 clusters identified by UNIDO belong to this category. Certain products allowall stages of production to be carried out by one unit, for example, sports goods industry in Jallandharand the manufacture of agricultural pumpsets in Coimbatore. Competition between firms within suchclusters would be high.
12.2.4 In sub-sector where the production process requires specialised input and/or process atdifferent stages, then the various stages tend to be carried out in different units. This leads to a highdegree of inter-dependence among these firms. Examples of such clusters are found in the glassindustry, metal processing and textile processing. It is important to add that entrepreneurs often start anew unit, rather than expand the existing unit. This is to escape the labour laws and to enjoy thesubsidies provided to the small scale sector. UNIDO noted that in 17 out of 138 vertical links weredominant.
12.3 Initiatives
12.3.1 State Bank of India (SBI)- ‘Project Uptech’.
12.3.1.1 The SBI is a nationalised bank. All nationalised banks are expected to provide cheap creditto small scale industries. The initial policy was to encourage the growth of new units. There was littlecredit forthcoming for technological upgradation as the success of the lending policy was judged onnumber of new units started. This policy has come under severe criticism for a long time. The banksinvestment in technological upgradation marks a shift in its policy.
12.3.1.2 In 1988-89 the bank started the programme called SBI-Project Uptech. The aim was toupgrade the management process, product quality, technology and marketing within the framework ofwhat was attainable by the units. The criteria for selection of clusters were: (i) scope for improvement;and (ii) a substantial number of units in those clusters should have been funded by the bank. A surveywas carried out to assess the current status of the industry and the scope for improvements.
12.3.1.3 40-50 units were selected for upgradation from six different types of clusters. The sub-sectors of clusters selected were agro-pump set industry in Coimbatore, diesel engine manufacture inKolhapur, Huller rice mills in Palghat, foundries in Agra, glass units in Firozabad and automobilecomponent manufacture in Pune. A task force of 4-5 bank officers was deputised along withexternally identified technical consultants who were to help the entrepreneurs modernise their units.

90
Six such projects were carried out. For the first three projects the bank paid for the externalconsultants, subsequently the units were charged a fee.
12.3.1.4 No information is available on further uptake by other units. As seen in other initiativesdiscussed below, a top-down technical approach appears to have a low rate of uptake. Themethodology used has very little scope and/or opportunity for shop-floor interaction with the owner.The main decision makers are the technical experts.
12.3.2 Small Industries Development Bank of India (SIDBI)
12.3.2.1 SIDBI came into being as a subsidiary of the Industrial Development Bank of India (IDBI)in 1991. An initiative with wide ranging objectives was taken under its Promotion and DevelopmentPolicy. Among others, it covered creation of awareness of new products; process, technology andskills upgradation; and provision of unit specific modernisation package. It targeted 20 small industryclusters for technology upgradation. The product groups include: locks, textile processing, bicycle,scientific instruments, salt and salt based chemicals, powerlooms, machine tools, rubber products, seafood products, glassware, gems and jewellery, brass and bell metal, leather and leather products,foundries and hand tools.
12.3.2.2 The methodology adopted was similar to that used by SBI where technical experts werebrought in to identify and solve problems. The bank’s modernisation programmes had mixed results.Expectedly so. However, it blames the failure on “unprofessional working of some selectedimplementing institutions”.
12.3.3 Development Commission- Small Scale Industries
12.3.3.1 Of late the DCSSI has been quite active in pollution reduction in small industries. It hasselected to focus on those sub-sectors which are highly polluting and have been threatened withclosure, and those which are high fuel users. As noted in chapter 11 it has already undertaken detailedstudies of five energy intensive sub-sectors. Unfortunately these documents were not made available.At present, there are two programmes. These have been running for several years, but has not hadmuch success either in terms of uptake or of environmental improvements. The programmes targetglass and metallurgy industries.
12.3.3.2 Glass Industry in Ferozabad: Mr. Sood Deputy Director - Glass and Ceramic discussed theprogramme in detail. A cluster of units in Ferozabad was selected as they were threatened withclosure. Additionally, they are high energy users. The programme was part funded by the CzechRepublic which also sold the improved furnace technology. Three types of furnaces are used in theglass industry- Tank furnace, Pot furnace and Muffle furnace. Heat is also used for screen printing onglass, for grinding and for cutting bangles. There are 1200 such units in the cluster.
12.3.3.3 There are 20 large units which have continuous tank furnaces which employ regenerativeheat recovery systems. Some are oil fired, with a majority of them fired indirectly by coal through aseparate gasification system. The gasification plants are prone to stoppages, halting all meltingactivities. There are 75 units using the pot furnace. The design is inherently inefficient and very littleeffort has been made to improve the basic design. Typical pot furnaces operating in UK and CzechRepublic are equipped with recuperative systems. None of the Firozabad pot furnaces employ heatrecovery systems and all of them use a central fixed bed of coal to effect melting. Muffle furnaces are
91
used for making bangles. They are open in the front, as a process requirement, and thus operate at avery low efficiency level of 3 per cent. This programme aimed to improve the tank and pot furnacetechnologies.
12.3.3.4 Since the number of tank furnace users is comparatively small, they were individuallytargeted to improve the gasification plant. For the pot furnace, the methodology used was to go in withthe improved technology and set up a demonstration centre for improved pot furnace. DCSSI thenundertook training and information dissemination. Mr. Sood noted that even after several years ofinformation dissemination, the rate of uptake remain very low. Other than subsidised coal, which actsas a dis-incentive, he saw major problems in the project design. Some of the lessons learnt are:
♦ undertake unit level study first to assess the needs and constraints as perceived by the owners; ♦ once project infra-structure is set up, identify smaller projects within the cluster, based on the unit
level study; ♦ make efficiency gains in existing technology if possible, then adapt and change; ♦ demonstrate the benefits at unit level and build confidence in the initiative; ♦ technology change should come at the end of the programme; ♦ indigenous technology should be first investigated before importing technology which is difficult
to adapt to conditions in small units; ♦ address issues of house-keeping and process modification in the earlier stages of the programme; ♦ technology change should not be seen as a one time change; ♦ a project should establish the scope for continuous absorption of technology ; and ♦ a project will be successful only if the initiative to change comes from the owners.
12.3.3.5 Metallurgy industry: Mr. Singh, Deputy Director - Technology Management, agreed thatproject design had to be re-assessed to improve uptake. Mr. Singh identified some sub-sector specificconstraints to uptake. The methodology used by DCSSI in the metallurgy industry is the same as forthe glass industry. The main objective of this programme was help units change from batch furnace tocontinuous production furnace. The change itself generates 20% fuel saving on average and reduceswork place pollution considerably.
The constraints to uptake were financial and market based. Financial: The cost of a batch furnace isRs 100,000 - Rs 200,000. The cost of a continuous production furnace is Rs. 10,000,000. Market size:For the continuous production furnace to be cost effective, a certain minimum level of production hasto be maintained. The size of the market supplied by each individual unit is too small to support theminimum production required.
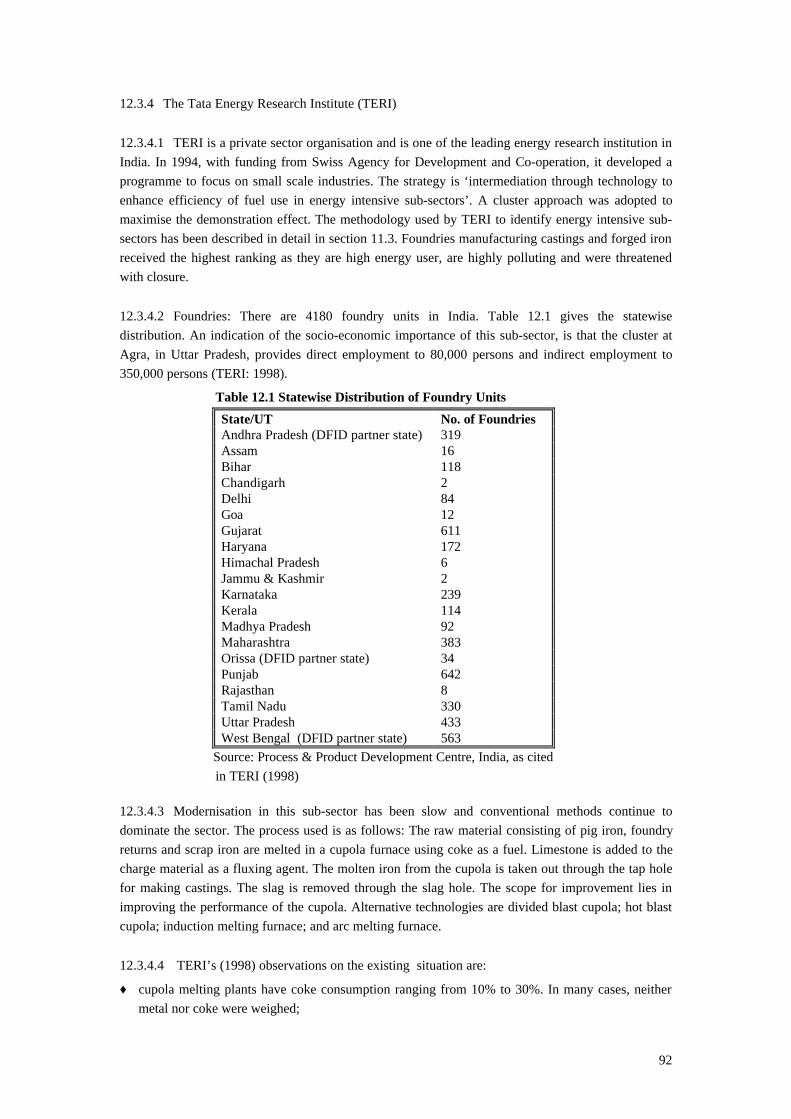
92
12.3.4 The Tata Energy Research Institute (TERI)
12.3.4.1 TERI is a private sector organisation and is one of the leading energy research institution inIndia. In 1994, with funding from Swiss Agency for Development and Co-operation, it developed aprogramme to focus on small scale industries. The strategy is ‘intermediation through technology toenhance efficiency of fuel use in energy intensive sub-sectors’. A cluster approach was adopted tomaximise the demonstration effect. The methodology used by TERI to identify energy intensive sub-sectors has been described in detail in section 11.3. Foundries manufacturing castings and forged ironreceived the highest ranking as they are high energy user, are highly polluting and were threatenedwith closure.
12.3.4.2 Foundries: There are 4180 foundry units in India. Table 12.1 gives the statewisedistribution. An indication of the socio-economic importance of this sub-sector, is that the cluster atAgra, in Uttar Pradesh, provides direct employment to 80,000 persons and indirect employment to350,000 persons (TERI: 1998).
Table 12.1 Statewise Distribution of Foundry Units
State/UT No. of FoundriesAndhra Pradesh (DFID partner state) 319Assam 16Bihar 118Chandigarh 2Delhi 84Goa 12Gujarat 611Haryana 172Himachal Pradesh 6Jammu & Kashmir 2Karnataka 239Kerala 114Madhya Pradesh 92Maharashtra 383Orissa (DFID partner state) 34Punjab 642Rajasthan 8Tamil Nadu 330Uttar Pradesh 433West Bengal (DFID partner state) 563
Source: Process & Product Development Centre, India, as citedin TERI (1998)
12.3.4.3 Modernisation in this sub-sector has been slow and conventional methods continue todominate the sector. The process used is as follows: The raw material consisting of pig iron, foundryreturns and scrap iron are melted in a cupola furnace using coke as a fuel. Limestone is added to thecharge material as a fluxing agent. The molten iron from the cupola is taken out through the tap holefor making castings. The slag is removed through the slag hole. The scope for improvement lies inimproving the performance of the cupola. Alternative technologies are divided blast cupola; hot blastcupola; induction melting furnace; and arc melting furnace.
12.3.4.4 TERI’s (1998) observations on the existing situation are:
♦ cupola melting plants have coke consumption ranging from 10% to 30%. In many cases, neithermetal nor coke were weighed;

93
♦ low awareness of proper operating practices - this accounted for main differences in operatingefficiency of various units;
♦ cupolas are operated by mistries1 who do not have the necessary theoretical or technicalbackground to control cupola operations;
♦ the size of most cupolas did not suit their melt capacity. This results in low performance - lowblast rates and pressure;
♦ the quality of foundry coke is poor, with high ash content (30%-35%) resulting in low metaltemperature and high pollution;
♦ there is a absence of quality consciousness in most of the units;♦ very few units keep proper production records regarding metal charge, castings and rejects;♦ those units using the modified double-blast cupola show considerable improvements - a fuel saving
of 20% to 25%; and♦ one unit operating with hot blast cupola has the lowest coke consumption in the Agra cluster.
12.3.4.5 On the basis of these observations, Mr J. R. Smith of Cast Development, UK, made thefollowing recommendations:
Short term low cost measures- Improve awareness of the benefits of proper cupola operations.- Install simple shop-floor control systems for metal quality and fuel consumption
Short and medium term low cost measures- Provide technical assistance for foundry persons on (i) measurement of cupola operating conditions; and (ii) consultancy advice on necessary improvements.
Medium term moderate cost measuresModification of existing cupolas to the improved design of divided-blast cupola as recommended bythe Process and Product Development Centre. This can result in 20% to 25% fuel saving.
Medium and long term high cost measures- Installation of fully instrumented cupola system with divided blast and other modifications formechanised charging system.- Development of suitable heat recovery system compatible with the technology requirements for hotblast operations.- Dissemination of improved technology by conducting demonstration projects.
12.3.4.6 TERI decided to focus on the foundry cluster at Howrah, (near Calcutta) in West Bengalbecause Agra, with its high media attention had already attracted sufficient assistance. Ademonstration unit has been set up by TERI at the factory ‘Bharat Engineering Works’. A member ofthis study team visited the factory to assess (i) to what extent the recommendations had been taken up;and (ii) the demonstration effect.
12.3.4.7 TERI approached the industry through its two main associations - The Howrah FoundryAssociation and the Indian Foundry Association. It also obtained advice from the professionalorganisation called Association of Indian Foundry-men, Calcutta. The owner of the factory selected
1 Mistries is a generic term used to describe any person who has acquired on-the-job knowledge andskills in an blue-collar profession.

94
for the demonstration unit is also the President of the Indian Foundry Association. The criteria usedfor selecting the site for the demonstration unit were (i) sufficient space to build the new unit whilethe old furnace continued to be operated; (ii) the unit was financially viable and able to make theinvestment.
12.3.4.8 According to Mr. Dugar, the factory owner, the aim was to develop an energy efficientsystem, and TERI had succeeded in doing so. The furnace installed is a fully instrumented dividedblast cupola with heat recovery system and other modifications for top-loading. Additionally, aventuri scrubber with de-watering cyclone to remove sulphur from emissions had been installed withinstrumentation for monitoring. Five workers involved in running the new furnace were trained. Noother changes have been affected.
12.3.4.9 This has led to a 20% savings in fuel and reduced emissions. It has lowered the processingtime and the output quality is higher and more uniform. There has been a marginal improvement inwork place pollution as poor practices continue. The old conventional furnace is also operated.
12.3.4.10 Assessment:
1. It appears that the phased approach recommended by the consultant was not adopted. TERI optedfor the long term high cost measure. Further enquiries revealed that there has been no uptake ofthe improved technology. According to Mr. Dugar the measures involved are too costly and cannotbe afforded by the average sized units in Howrah. The owner was reluctant to discuss the actualcost incurred.
2. The unit selected is not only financially strong, it is one of the largest units. It has a turnover of
6000 tonnes annually. This is much bigger than the average unit with a production turnover of1000 tonnes. This implies that when designing the size of the demonstration unit and whenchoosing the level of technological improvements it is crucial to take into account the average sizeof units in a cluster and their affordability.
3. The visit to the factory revealed that though it claims to be part of the Howrah cluster, it was
located about 5 miles outside this cluster. This geographical distance is a drag on the other ownerswho would like to observe the benefits. This reduces the demonstration effect. It appears thatchoice of site for the demonstration unit is very important.
4. The owner notes that raising awareness of work place practices and of health and safety
procedures could be a part of the package. 5. A phased approach, starting with low cost measures could be more appropriate in that it would
mean greater participation and involvement by owners and workers from the early stages. Thiswould implicitly be an awareness raising exercise. Additionally, this would also allowimprovements in existing furnaces and reduction in emissions even before new energy systems areinstalled.

95
12.3.5 National Productivity Council (NPC)
12.3.5.1 The NPC is a semi-autonomous agency of the Government of India. It generates 70% to80% of its revenue through commissioned research and consultancy. The rest is provided by theGovernment of India.
12.3.5.2 The project Waste Minimisation Circles (WMC) was developed, and is run by, theNational Productivity Council. It falls under the MoEF’s Pollution Prevention Programme which isfunded by a loan from the World Bank. Officers interviewed are directly involved with design andimplementation of the project. These include Mr. S. P. Chandak, Director and Mr. M. J. Parvez,Senior Deputy Director, Environmental Division. The WMC concept is for small groups of people ofsimilar but independent production operations in particular localities to get together in a self helpmode so as to evolve solutions to common problems. The emphasis is on better productivity,particularly through avoiding waste of raw materials and utilities, including energy. The veryexistance of WMCs implies that there is percieved mutual benefit in some associated activities.Common external threat to their continuity such as have come with strong environmental enforcementseem to have encouraged this process. Once started they, it shows greater benefits from interchange ofideas and shared experience. NPC has been producing a newsletter called ‘Waste Minimisation CircleNews’. It is a bi-monthly publication where the participants of WMCs are invited to write and also todisseminate information on constraints, solutions and benefits identified. These newsletters have beenacquired.
12.3.5.3 The approach to the problem and the methodology developed by NPC is very different fromthe technology-led approaches used in other initiatives. The process is more participatory, moves atthe pace set by the participants, gives a sense of ownership to the entrepreneurs of the solutionsdeveloped and appears to have had greater success, in terms of uptake, than some of the otherprogrammes.
12.3.5.4 Objectives and guiding principles of the programme:
♦ The hidden objective is environmental improvement and pollution abatement. The marketingobjective is - help entrepreneurs enhance returns from their inputs. This is essential to counter theexisting perception within industry and the associated mis-trust. Thus, the fundamental task is tosell the idea that industry can increase return to its inputs.
♦ Encourage self-help. This is important, as there is a strong culture of dependency in this sector.This is largely due to the fact that this sector has been protected and subsidised.
♦ Maximise the demonstration effect of improvements achieved.♦ Flexibility is crucial to the success of this initiative. The participants to be provided with the scope
to influence and shape the process and pace of change. Participating in developing a methodologyof change gives the entrepreneurs a sense of ownership over the solutions.
♦ ‘Brainstorming’ at each stage among circle members should by a key activity.♦ One basic requirement of the programme is the application of systematic procedures developed by
the NIC programme officers. These include (i) a review of process flows. This is a descriptiveanalyses of inputs, processes used and the outputs; (ii) These analyses are quantified to see therelationships between inputs and outputs. The results are discussed to identify areas ofimprovement in terms of price, quality and quantity; and (iii) making changes and improvements.
♦ Training the programme officers, most of whom are technical advisors, to develop skills asfacilitators.

96
12.3.5.5 Under Phase I of the programme NPC helped establish 10 circles and these subsequentlyincreased to 15. The initiative was able to improve waste management and resource recovery in 6 ofthe first 10 circles. Phase II has a target of 100 circles.
12.3.5.6 Criteria used to select clusters are: pollution intensiveness of activities; cost of pollutionabatement; ease of pollution abatement; potential for waste minimisation; potential demonstrationeffect; financial health of the sub-sector; technical capacity present in the cluster; and public pressureon the cluster.
12.3.5.7 Methodology:
1. Choose a cluster from the list of clusters identified. The final choice depended on whether therewas a contact person in that particular cluster.
2. The local industrial association was then contacted through this person. Entrepreneurs were theninvited to talk of their problems. This was difficult, as most were hesitant of talk of their problemsin the presence of a competitor. The task of the programme officer at this stage is too facilitatediscussion between entrepreneurs and to encourage them to share their problem. Central to thisprocess is ‘trust building’ among entrepreneurs and between them and the programme officer(s).
3. Choice of units: Tiny units with less than 6 workers were not selected. Additionally, a minimumlevel of infra-structure within the unit was essential.
4. A maximum of 6 and a minimum of 3 entrepreneurs form the first group of participants. Informing this group care is taken to ensure that participants are compatible in terms of size ofunits, nature and type of processes used. This is to ensure commonality of problem and hencegreater scope for sharing knowledge.
5. A cost free review is then undertaken of entire process and production stream. At this stage theentrepreneur is encouraged to explain why he is using certain procedures and processes. Processsteps generating waste are identified. Out of these, one process step based on its greater impact onthe entire production process and quantum of waste generated is selected for conducting detailedassessment.
6. A detailed analysis of process step identified is carried out. It includes preparing process flowcharts, quantification of input-output streams to prepare a material and energy balance, assigningcosts to waste streams and reviewing of process to identify causes of waste. The latter is carriedout through brain-storming sessions which throws up the reasons as to why certain procedures arefollowed.
7. Generating waste minimisation opportunities. Introduce ideas/techniques of waste minimisation,like good house-keeping, process control, quality control of material inputs, of recycling of wasteand of better use of by-products. The fundamental principle is to “gather the low hanging fruitsfirst”.
8. Selecting workable waste management opportunities and carrying out a detailed feasibilityanalysis for the selected opportunities.
9. Selecting waste minimisation solutions. The identified options are subjected to techno-economicfeasibility and environmental acceptability analysis.
10. The input-output analysis is quantified to indicate improvements in fuel use efficiency and inmaterial recovery. Iterative changes are suggested to the existing technology. The demonstrationeffect of reduced fuel use and/or better material recovery is that, it is imitated by some of the othermembers of the cluster. “95% are imitators, only a small percentage are risk takers” (Director,NIC).
11. The initiatives to make technological changes, equipment modifications and finally productmodifications are left to the entrepreneur. Once the initiative is taken, appropriate technical
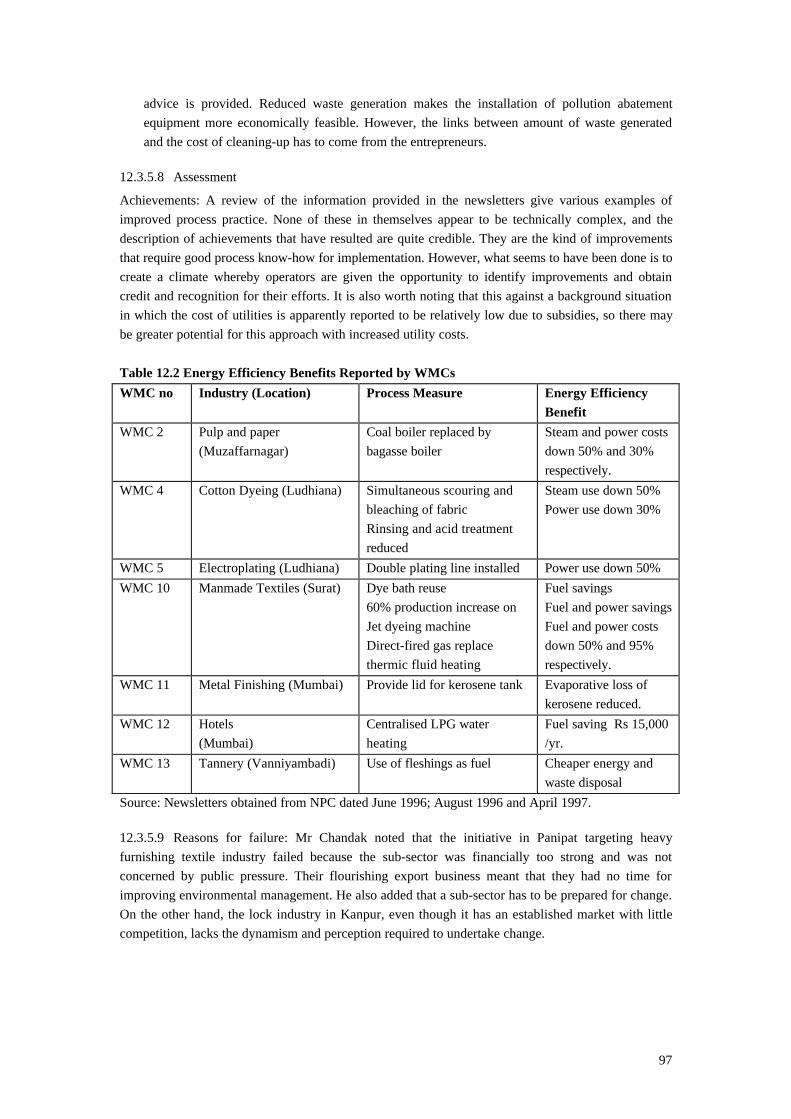
97
advice is provided. Reduced waste generation makes the installation of pollution abatementequipment more economically feasible. However, the links between amount of waste generatedand the cost of cleaning-up has to come from the entrepreneurs.
12.3.5.8 Assessment
Achievements: A review of the information provided in the newsletters give various examples ofimproved process practice. None of these in themselves appear to be technically complex, and thedescription of achievements that have resulted are quite credible. They are the kind of improvementsthat require good process know-how for implementation. However, what seems to have been done is tocreate a climate whereby operators are given the opportunity to identify improvements and obtaincredit and recognition for their efforts. It is also worth noting that this against a background situationin which the cost of utilities is apparently reported to be relatively low due to subsidies, so there maybe greater potential for this approach with increased utility costs.
Table 12.2 Energy Efficiency Benefits Reported by WMCsWMC no Industry (Location) Process Measure Energy Efficiency
BenefitWMC 2 Pulp and paper
(Muzaffarnagar)Coal boiler replaced bybagasse boiler
Steam and power costsdown 50% and 30%respectively.
WMC 4 Cotton Dyeing (Ludhiana) Simultaneous scouring andbleaching of fabricRinsing and acid treatmentreduced
Steam use down 50%Power use down 30%
WMC 5 Electroplating (Ludhiana) Double plating line installed Power use down 50%WMC 10 Manmade Textiles (Surat) Dye bath reuse
60% production increase onJet dyeing machineDirect-fired gas replacethermic fluid heating
Fuel savingsFuel and power savingsFuel and power costsdown 50% and 95%respectively.
WMC 11 Metal Finishing (Mumbai) Provide lid for kerosene tank Evaporative loss ofkerosene reduced.
WMC 12 Hotels(Mumbai)
Centralised LPG waterheating
Fuel saving Rs 15,000/yr.
WMC 13 Tannery (Vanniyambadi) Use of fleshings as fuel Cheaper energy andwaste disposal
Source: Newsletters obtained from NPC dated June 1996; August 1996 and April 1997.
12.3.5.9 Reasons for failure: Mr Chandak noted that the initiative in Panipat targeting heavyfurnishing textile industry failed because the sub-sector was financially too strong and was notconcerned by public pressure. Their flourishing export business meant that they had no time forimproving environmental management. He also added that a sub-sector has to be prepared for change.On the other hand, the lock industry in Kanpur, even though it has an established market with littlecompetition, lacks the dynamism and perception required to undertake change.

98
12.3.5.10 Institutional Development
12.3.5.11 NPC agreed that at present the initiatives are patchy with different levels of success. Onbeing asked what kind of institutional framework could support programmes like WMCs, Mr Parvezmade the following comments:
-The institutional framework should allow complete flexibility on the ground. Flexibility isfundamental to the success of WMC.- Try to use the specialised technical and research institutions which already exist. Decisions have tobe taken as to whether these are to be used as a source of information or as a nodal agency forimplementing in their sub-sector. Do they have the right ‘mind set’? If not, what needs to be done tochange them?-It is important to raise the awareness at the institutional level.- Official documentation for small industry has to be made more user-friendly, given the lowknowledge base.- Capability building to train technically qualified individuals as facilitators.- WMC is still in an experimental phase. It is important to learn from failures and success.
Box 12.1 Summarising the Range of Institutions/Organisations that have been Involvedin Different Programmes
Programme development: State Bank of IndiaSmall Industries Development BankDevelopment Commission-Small Scale IndustriesTata Energy Research InstituteNational Productivity Council
Programme implementation Tata Energy Research InstituteNational Productivity CouncilPrivate Sector ConsultantsDevelopment Commission-Small Scale Industries
Technology/expertise Process and Product Development CentreProduct based R&D technical agenciesTata Energy Research InstituteNational Productivity CouncilUK and Czech companies
Training Tata Energy Research InstituteNational Productivity Council
Funding Nationalised Banks in IndiaWorld BankSwiss Agencies for Development and Co-operation

99
12.4 Findings: Implications for energy-led initiatives
1. The need to target the small scale industrial sector for environmental improvements seemswidely accepted.
2. While all initiatives have used clusters as a spatial unit for their environmental programmes,
none have taken into account the poverty impact of environmental improvements. 3. The environmental programmes cannot be marketed directly. Rather, they have become the
hidden agenda. The key marketing strategy is to focus on benefits accruing to the industry. 4. There are high levels of inefficiency in fuel and resource use and therefore considerable
scope for improvement. 5. Co-operation within the sub-sector and a sense of ownership of solutions is fundamental to
success. 6. A participatory approach to the problem appears to have a higher success rate, in terms of
uptake than a top-down technology approach. 7. ‘Gather the low hanging fruits first’ seems an useful principle to follow as this would also
demonstrate to the owners at an early stage of the benefits that could accrue. 8. An holistic approach to the problem is crucial to achieve overall environmental
improvements. 9. The experience of these initiatives raises questions about how a demonstration unit should be
used. For example, at what stage of the programme would such a unit be appropriate? Whatshould be the size of the demonstration unit? Should it reflect the average size of units inthat cluster? Where should a demonstration unit be located?
10. For each cluster, in-depth analysis at unit level to assess constraints and opportunities for
change seems essential.

100
13. CONTRIBUTION OF OUTPUTS
13.1 Recommended Approaches to Energy Efficiency Initiatives in India.
A: Domestic Sector
1. Target kerosene users through health programmes to increase awareness of dangers of usingkerosene in a poorly ventilated room.
The majority of low income and poor households in the major cities of India have moved up the‘energy ladder’ to use kerosene. While this is encouraging, it has moved cooking indoors into poorlyventilated rooms. Some studies suggest that indoor pollution contributes substantially to prematuredeaths in India. It is likely that women, children and old people will be more affected.
2. Explore potential for low-cost design improvement of kerosene stoves using modern, butaffordable material, to ensure better combustion.
Pollution from kerosene is due to incomplete combustion of the fuel and due to design inefficiencies inexisting stoves.
Contract local energy research organisation with combustion engineering skills to undertake study.
3. Examine opportunities for supporting improved chulha programme in appropriate areas.
Woodfuel is used by the poorest in urban areas, who are often transient and/or new arrivals. Theywould be difficult to target. Many will probably switch to kerosene due to opportunity cost of woodfuelcollection, peer pressure, safety aspects, etc.
The pattern of domestic fuel use in smaller towns and cities is not clear. Probably opportunities forimproved chulha programme exits outside the major urban areas. Any such programme should takeon board lessons learnt form the National Programme of Improved Chulhas whose experience showsthat fuel saving is not a priority with the poor.
4. Assist to define minimum exposure limits so that judgement can be made if improved stovesdo really reduce the health risks posed by PAH class of compounds.
With increased use of kerosene this has become important. At present there are no set exposure limitswhich would allow one to assess the health impacts, with respect to these compounds.
B: Industrial Sector
1. Target inefficiencies in clusters of small scale industries to generate benefits for a largegroup of urban poor and for the industry.
Small scale industries in India have been encouraged to counterbalance the capital intensive, lowemployment generating large scale industries. It has provided livelihood to those with limited skills

101
and resources. The sector is resource poor in terms of financial strength and technical expertise. Theefficiencies of energy and resource use are low and waste generation high. Pollution per unit ofproduction is higher in small industries than in large factories.
Some sub-sectors of small industries are threatened with closure for non-compliance of environmentalstandards. This has jeopardised the livelihood of thousands of very vulnerable low income workers.These workers may also be exposed to high workplace pollution which affects their earning potentialdue to associated ill health.
A significant number of sub-sectors threatened with closure are high energy users where energy costforms a substantial proportion of the total production cost, yet these units are characterised by lowenergy efficiency. This implies scope for considerable gains for industry and for intervention. (A listof high energy using sub-sectors has been provided in Chapter 11).
The clustering tendency of small industries in India deepens the intra-urban differential in pollutionimpact. Reducing pollution levels at cluster level will reduce ambient pollution of adjoining lowincome neighbourhoods.
2. An energy led initiative where the core objective is to enhance energy efficiency but with thescope to address other related sources of air pollution so as to generate maximum benefits forthe poor.
The link between enhanced energy efficiency and poverty alleviation is through improvedenvironment in which the poor live and work. In small industries, combustion related pollution is oneof the contributory factors of air pollution. There are bounds to what environmental gains can beachieved by targeting only energy inefficiencies. To achieve an overall reduction in air pollutionwhich will mean improved environment for the poor, it is essential to address other sources ofpollution like process inefficiencies, poor housekeeping and lack of waste management.
3. Target the large number of vulnerable low income workers in small industries and thoseliving adjacent to highly polluting clusters of industries.
The workers in small industries, are not the poorest of the poor, but do constitute an extremelyvulnerable segment of the society. They fall outside the labour laws, experience insecurity of jobtenure; work under appalling conditions; and are now threatened with loss of livelihood. Moreover,because they are not the poorest groups, they fall outside the poverty programmes. The second targetgroup, comprised of low income residents with generally low levels of empowerment, make themequally important as a target group.
4. Any energy led initiative in small scale industries should incorporate the lessons learnt fromother on-going programmes.
The importance of assisting small industries to improve environmental management has beenrecognised. The efforts though patchy and limited in scope have important lessons for any futureinitiative. DFID’s energy led initiatives should take on board these lessons. These relate to projectdesign; selection of criteria for choosing target cluster; role and timing of technology change;assessing the relative importance of different sources of pollution; designing programme of activities;and implementation.

102
5. A participatory approach to enhancing efficiencies in energy and resource use has morescope of success.
The assessment of on-going programmes assisting small industries showed that a technology-led, topdown approach has had a lower rate of uptake even though a demonstration unit had been set up. Theparticipatory approach (discussed below) used by the National Productivity Council shows a successrate of 60%. In addition to higher uptake it encourages self-help and gives the entrepreneurs a senseof ownership over the solutions.
6. Assist in institutional awareness raising and capability building.
Large numbers of specialist research and technology design government agencies already exist. Theirpresent role in improving environmental management is limited and unclear. DFID could assist toincrease environmental awareness in these organisation and to augment and/or re-orient theircapability so that they can play a role in the changes taking place.
7. Assist in developing an appropriate institutional framework which can incorporate theflexibility of a participatory approach to environmental improvements.
With the exception of the DCSSI, the agencies and organisations who have taken the initiative tofacilitate change in small industries are not directly responsible for environmental change in thissector. There is no named body which can take a comprehensive approach to the problem andfacilitate change. The Pollution Control Boards are monitoring agencies. DFID could assist to build aframework, while it will formalise procedures and recognise commercial realities, must allowflexibility on the ground to allow the application of a participatory approach.
An organisation like DFID could act at either one or at two levels. One, at the cluster level to developa programme to target a selected cluster of energy intensive sub-sector. Keeping the ‘win-win’objectives in mind, the role could be to help design, develop and test methodologies/procedures forparticipatory environmental initiative in collaboration with national government and private sectoragencies. This would not only enable change at the cluster level, but also inform policy design andinstitutional building. At a higher level, DFID could assist national agencies to change and develop aninstitutional framework which will support private-public sector partnerships for environmentalmanagement in small industries. DFID is already involved at a sectoral level in Orissa, assistingchange in the power sector following its de-regulation.
C: Commercial Sector
1. Need for a systematic study and greater understanding to identify poverty links.
The data available in India and other Asian and African countries made it difficult to assess thepoverty impacts of enhanced energy efficiency in this sector. The on-going project in Africa showedthat the target group was large institutions like schools, hospitals and government institutions. Whilesubstantial (50%) reduction in fuel use had been achieved it was not clear whether these gains werebeing ploughed back to benefit the poor. For example, were schools providing better/more booksfollowing reduced fuel cost?
103
Additional difficulties arose from the nature of the sector itself. The dispersed location of hotels andeating houses make them logistically difficult to target. Easier to target are the large outlets. However,in this case it is less clear who the beneficiaries would be.
13.2 Influencing Policy
1. Put demand management of energy on the agenda.Demand management is a neglected policy area in India. Assist to develop a demand managementstrategy at the national level to rationalise and plan fuel use. In the industrial sector, subsidised rawmaterial and fuel is a dis-incentive to improving efficiency of use. Assistance could be provided todevelop a strategy which would replace subsidy by instruments (market and non-market) to encourageefficiency of fuel use. For the domestic sector, energy planning should ensure that all sections of thepopulation have access to adequate fuel. Scope for making LPG more accessible should also beconsidered.
2. Put energy on the agenda of urban development programmesUrban domestic fuel use is a neglected issue. DFID could assist in the establishment of energytaskforce, with national and state governments, NGOs, research organisations and slum improvementboards. Liase with other DFID-supported initiatives. Energy task force could inform DFID healthgroups of impacts of indoor pollution.
13.3 Lessons for Participatory Environmental Initiatives
The experience of projects targeting inefficiencies of energy and resource use have important lessonsfor a participatory approach to environmental problems. These are:1. The fundamental task would be to convince the industry that they can increase return to inputs
from increased efficiency.2. The team of facilitators should be engineers trained to act as facilitators.3. Identify a small group of willing factory owners in a selected cluster of units, representing a
chosen sub-sector.4. Take time to break the ice among the participants, as they could be competitors, and to build
confidence in the team of facilitators.5. Encourage self-help to counter the culture of dependency found in this sector.6. Create an ambience for discussion and exchange of ideas.7. Facilitate and brainstorm so that identification of problem comes from participants.8. Provide technical advise to solve problems they have identified.9. Do not underestimate the knowledge of the entrepreneurs.10. Move slowly by addressing efficiencies easily achieved: “gather low hanging fruits first”.11. Once the process of change has been initiated the participants should follow the methodology and
procedures set in the programme.12. Initiatives for technological change, process modification and product change should come from
the participants.

104
13.4 Future Research Needs
1. Study on poverty impact of reduction in subsidy on kerosene:At present the government subsidy on kerosene stands at 50%. Over next few years this subsidy isexpected to be reduced to 15%. This is likely to have considerable impact on the poor and low incomegroups who have shifted to the use of kerosene as a cooking fuel. The government has no plans toundertake such a study.
2. Study to assess impact of reduction of cluster based pollution on low income workersand residents.
There is a general agreement that the urban poor live close to highly polluted environment. There hasbeen no systematic study to assess the socio-economic-environment link. A better understanding ofthese links would allow environmental proposals to incorporate wider social issues at the projectdesign stage and to guard against the dis-benefits of technological change.
3. Systematic scoping study to assess the need for an improved stoves programme in India.
Given the limited up to date information on pattern and trend of domestic fuel use at the nationallevel, a scoping study is recommended before any initiative is undertaken.
13.5 Follow up
13.5.1 The research undertaken was limited in that it was not directly linked to any on-goingdevelopment project and has no committed funds for future follow-up.
13.5.2 Collaborators: The country visit to India showed that there are individuals and organisationswith high calibre of skills and experience in research implementation. It is recommended that anyfuture initiative support and build on this.
105
REFERENCES. Agarwal, A (1998) False predictions, Down to Earth, vol. 7, no.1, May 1998
Bartone. C. R. & Beneavides. L. (1997) Local Management of Hazardous Wastes from Small Scaleand Cottage Industries in Waste Management & Research, Vol. 15, pp. 3 - 21.
Bradley. D., Stephens. C., Harpham. T. & Cairncross. S. (1992) A review of Environmental HealthImpacts in Developing Country Cities. The World Bank. Washington. Campbell, B. M. and Mangono, J.J. (1994) Working towards a biomass energy strategy forZimbabwe, Department of biological Sciences, University of Zimbabwe and Department of EnergyResources and Development, Ministry of Transport and Energy, Harare
Centre for Science and Environment, India (1997) Death is in the Air. Down to Earth November 15.
Ceylon Electricity Board. (1991 and 1992). Sri Lanka Energy Balance and Energy Data (1991) Alsodraft report (1992), Alternative Energy Development Branch, Colombo.
Chandak. S. P. (1994) “DESIRE”, Demonstration in Small Industries for reducing waste. Industryand Energy, Vol. 17 No. 4 pp 41-45.
Chiu. H. & Tsang. K. L. (1990) Reduction of treatment costs by using communal treatment facilities.Waste Management & Research, Vol. 8, No. 2, pp 165-167.
Dasgupta. N. (1997) Greening Small Recycling Firms: the Case of Lead Smelting Units in Calcutta.Environment and Urbanisation Vol. 9 No. 2.
Dasgupta. N. (1998) Tall Blunders. Down to Earth, Vol.2. 15 September.
Douglass. M. (1992) The political Economy of Urban Poverty and Environmental Management InAsia: Access, Empowerment and community-based alternatives. Environment and Urbanisation Vol.4, No. 2.
Government of Sri Lanka. (1980, 1988, 1990 and 1993). National Environmental Act, Government ofSri Lanka (1980 and 1988); National Environmental (Protection and Quality) Regulations No 1 of1990; National Environmental (Procedure for Approval of Projects) Regulations No 1 of 1993.
Government of Sri Lanka. (1986). Forestry Master Plan, Ministry of Forestry, Irrigation andMahaweli Development, Colombo.
Government of Sri Lanka. (1991). National Environmental Action Plan (1992 - 1996), Ministry ofEnvironment and Parliamentary Affairs.
Hamza. A. (1991) Impacts of Industrial and Small Scale Manufacturing Wastes on UrbanEnvironments in Developing Countries. Reviews prepared for the UMP/UNCHS, Nairobi, September.
Hardoy. J & Satterthwaite. D. (1992) Environmental Problems in Third World Cities. IIED, London.
Hardoy. J., Craincross. S. & Satterthwaite. D. (eds.) (1990) The Poor Die Young. EarthscanPublications. London.
Hardoy. J.. & Satterthwaite. D. (1992) The Squatter Citizen. Earthscan. London.
Harvey. D. (1975) Social Justice and the City. Edward Arnold. London.
Honolulu. (as cited in Bartone. C. R. & Beneavides. L. (1997)).

106
Howes, M. (1989). ‘Identifying Biomass Fuel Shortages in Sri Lanka’, Biomass, 19, 247-279.
IBRD (1996) Rural Energy and Development: Improving Energy Supplies for Two Billion People.World Bank Publication.
Joseph, P. G., Purvis, M.R.I., Ratanayake, V.U., Simmons, R., Tariq, A. S., and Wilson, P. (1995).NOx Emissions and Efficiency of Biomass-Fired Equipment in Process Industries in Sri Lanka.Natural Resources Institute, Chatham, UK.
Karakezi. S. and Turyareeba. P. (1994) Smoke in the Kitchen. In: Boiling Point Issue No. 34,September 1994.
Kent. L. (1991) The relationship Between Small Enterprises and Environmental Degradation in theDeveloping World (with emphasis on Asia). Review prepared for USAID Washington, DC.
Kogi. K. (1985) Improving Working Conditions in Small Enterprises in Developing Asia.. Geneva,International Labour Organisation.
Kothari. S. (1983) There’s Blood on these Mathcsticks: Child Labour at Sivakasi. Economic andPolitical Weekly 18(27) pp 1191-1202
Kritiporn. P. et al (1990) The Greening of Thai Industry: Producing More and Polluting Less.Thailand Development Research Institute Foundation. Kumar, S. (1994) Bio-energy: its domestic application and implementation problems – improvedchulhas and biogas plants, National Workshop on Women and Renewable Sources of Energy for Domestic Sector, Trivandrum, India. Workshop organised by the All India Women’s Conference;sponsored by the Ministry of Non-Conventional Energy Sources.
Leach, G. (1987). ‘Household Energy in South East Asia’, Biomass, 12, 155-184.
Lei. P. C. K. & Yang. D. S. C. (193) The Implementation of Controls over the Management ofChemical Waste in Hong Kong. In Proceedings of the Pacific Basin Conference on Hazardous Waste,
Lin. C. M. (1994) Cleaner Production in Small and Medium Sized Industries. Industry andEnvironment, Vol. 17, No. 4, pp 68-70.
Lokwongwatana. B. et al (1990) Industrial Waste Treatment Facilities in Thailand. WasteManagement & Research Vol. 8, No. 2, pp 124-129
Lugemwa. A. (1992) The Effect of Fuel Efficient Stoves. Boiling Point Issue No. 27, April 1992
Masakhwe. K. (1991) Technology Transfer – the KCJ. In: Boiling Point Issue No. 26, December1991. .Mendoza. H. (1992) Case Study of Hazardous waste and Emission from Small-scale cottage Tanneriesin Urban Areas of Mexico. Case Study prepared for the UMP/UNCHS, Nairobi, October.
Moser. C. O. N. (1995) Urban Social Policy and Poverty Reduction. . Environment and UrbanisationVol. 7. No. 1.
Naidu. B. S. K. (1996) India’s Leadership in Renewable Energy Development for a SustainableFuture. ( edited version of paper submitted to Energy Policy Ellesmere, Vol. 24. No. 6. June).
107
Natarajan, I. (1995) Improved chulha programme – how to make it effective, Margin, July-September,1995
Norton. A. (1993) Social Development, Social Policy and Multi/bi-lateral aid Organisations: somenotes on the institutional context.. Mimeo, as quoted in Moser (1995).
Pryer. J. (1993) The Impact of Ill-health on household income and nutrition in Khulna, Bangladesh.Environment and Urbanisation Vol. 5 No. 2.
Reddy. A. K. N. (1997) IEI’s Approach in Karnataka’s Power Sector A case study of Analysis leadingto Advocacy and Action. http:www.///renewingindia.org/organisation/Kredl/pdf/advocacy.pdf
Reidhead. P., Gupta. S & Joshi. D (1996) State of India’s Environment (A Quantitative Analysis).UNDP- Bangkok.
Satterthwaite. D. (1993) The Impact on Health of Urban Environments. Environment andUrbanisation Vol. 5 No. 2. Saxena, S., Ravi Shankar, V., Prasad, R. K., Malhotra, P., Singh, P. B., Proasad, R., Srivastava, K.K., Saxena, M., Mirza, A., Singh, V. P., Patil, R. S., Joshi, V., Guha Sapir, D. (1996) Fuel usage inthe Delhi slums and exposure to air pollution, in Proceedings of the International Conference onBiomass Energy Systems. New Delhi: Tata Energy Research Institute; pp319-325
Scott. A. (1998) The Environmental Impact of Small Scale Industries in the Third World. ESRCGlobal Environmental Change Programme.
Sen. A. K. (1981) Poverty and Famines: An Essay on Entitlement and Deprivation. Clarendon Press.Oxford.
Sen. A. K. (1987) The Standard of Living. Cambridge University Press. Cambridge Sharma, S., Sethi, G. R., Rohtagi, A., Shankar, R., Bapna, J. S., Joshi, V., Sapir, D. G. (1998) Indoorair quality and accute lower respiratory infection in Indian urban slums, Environmental HealthPerspectives, vol. 106, no. 5, May 1998
Shin. E. (1992) Economic Evaluation of Urban Environmental Problems: with Emphasis On Asia.Urban Development Division, Infrastructure and Urban Development Department, The World Bank.Washington.
Smith. K. et al (1998) Secondary Benefits of Greenhouse Gas Control: Health Impacts in China. NewScientist September 6.
Songsore. J & McGrahanan. G (1993) Environment, Wealth and Health: towards an analysis of intra-urban differentials within Greater Accra Metropolitan Area, Ghana. Environment and UrbanisationVol. 5 No. 2.
Surjadi. C. (1993) Respiratory Diseases of Mothers And Children and Environmental Factors AmongHouseholds in Jakarta. Environment and Urbanisation Vol. 5 No. 2.
Talking Points (1994) Senegal Stove Success Story. Extracts from Talking Points, the journal ofAppropriate Technology International. In: Boiling Point, Issue No. 35, March 1995. Tariq, A. S. and Purvis, M.R.I. (1996). ‘NOx Emissions and Thermal Efficiencies of Small scaleBiomass Fuelled Combustion Plant with Reference to Process Industries in a Developing Country’,International Journal of Energy Research, 20, 41-55.
108
Tariq, A. S. and Purvis, M.R.I. (1997), 'Industrial Use of Biomass Energy in Sri Lanka' InternationalJournal of Energy Research, 21, 447-464. TERI, (1993) Study of the energy needs of slum areas in Delhi, study prepared for the Delhi energyDevelopment Agency, TATA Energy Research Institute, Delhi. Tikkoo. V. (1992) Case study on Hazardous Wastes from Small Scale Industries in Bombay, India.Paper prepared for the UMP/UNCHS, Nairobi, October.
Turner. R. K. et al (1990) Cities at Risk. BNA International, London.
UNDP (1996) Energy After Rio.
UNDP (1996) Study of Cleaner Production Techniques and Technologies covering cluster of smallscale industries in Selected Areas. Report prepared for the Government of India.
Watts. P. (1994) The Anagi – successful Sri Lankan stove. In Boiling Point, Issue No. 33, May 1994. Wickramagamage. P. (1992) Cookstoves in East and Central Africa. In Boiling Point, Issue No. 33,May 1994.
Wijayadasa, K.H.J. (1994). Towards Sustainable Growth - The Sri Lanka Experience, Publication ofthe Central Environmental Authority, Ministry of Environmental and Parliamentary Affairs,Colombo, Sri Lanka..
Wijesinghe, L.C.A. de S. (1988). ‘Biomass Fuel and Its Utilisation in Sri Lanka’, RERIC.International Energy Journal, 10, 67-80.
World Bank. (1982). Sri Lanka Issues and Options in the Energy Sector. World Bank/UNDP ReportNo 3794-CE.
World Bank. (1986). Sri Lanka Industrial Energy Conservation: Prefeasibility Studies for SelectedIndustries. World Bank/UNDP Report No 054/86.
World Health Organisation (1992) Our Planet, Our Health, Report of the Commission on Health andEnvironment. Geneva.
Wrattan. E. (1995) Conceptualising Urban Poverty. Environment and Urbanisation Vol. 7, No. 1.
109
APPENDIX A
Preliminary Guidelines for Designing, Developing, Monitoring and Evaluating HouseholdEnergy Interventions with a Poverty Focus
1. Identify the problems 1.1 Who are the target groups? Are they amongst the poorer groups in the target area?
(N.B. What level are we targeting? Poor residential neighbourhoods, poor households, or poor women?)
1.2 What are the social or developmental problems of these target groups that have been identified?(e.g. women and children have eye diseases from smoke exposure; women complaining about difficulties in preparing traditionalfoods due to rapidly increasing prices of fuelwood)
1.3 How were these problems identified? Were the target groups properly involved in defining theirown problems?
1.4 Which of these problems can be effectively addressed by improvements in energy management?
1.5 What existing policies, programmes and initiatives are in place which are addressing householdenergy problems? What are their objectives, what lessons can be learnt from them, and what problemshave they encountered?
2. Identify potential solutions 2.1 Are the problems associated with fuel scarcity, or are they associated with inefficient combustionper se?
2.2 If the key problems identified are associated with fuel scarcity, which of the followingmanagement strategies are currently being used in target countries/areas/groups to address theproblems? Which of the current strategies are most successful, and why? Are therealternative/additional management strategies that might be more appropriate? Options include:
• Supply enhancement (e.g. through more effective use of waste wood from commercial landclearing)
• Improving marketing and transport• Encouragement of switching to more efficient fuels (e.g. kerosene, solar
water heaters)
• Introduction of improved stoves• Encouraging changes to household energy management practices
(e.g. teaching/development of more efficient fire management practices)
2.3 If the key problems identified are associated with pollution from inefficient combustion, which ofthe following management strategies are currently being used in target countries/areas/groups toaddress the problems? Which of the current strategies are most successful, and why? Are therealternative/additional management strategies that might be more appropriate? Options include:
• Diverting the smoke (e.g. chimneys, improved building design to increase ventilation)
• Improving burn efficiency through improved stoves
2.4 How do the energy management strategies identified complement and integrate with otherplanned/existing development strategies in the target areas and for the target groups? Do the energymanagement strategies need to be modified to maximise complementarity?

110
IF IMPROVED STOVES ARE SEEN TO BE AN EFFECTIVE STRATEGY, ORCOMPONENT OF A STRATEGY, TO TACKLE THE IDENTIFIED DEVELOPMENTALPROBLEMS (SECTION 11.1.1), THEN……..
3. Refine definition of the problems, through consultations with organisations involved in existingstove programmes (e.g. improved stove users, NGOs, community groups, government programmes,researchers, stove retailers and producers), and with target users. 3.1 Identify the different functions of stoves that are relevant to the target group. These may be acombination of any of the following:
• Flame ê lighting ê ritual significance ê entertainment
• Heat ê cooking ê space heating ê drying food, fuel and house materials ê control of pests in thatched roof
• Smoke ê preserving and flavouring food ê control of mosquitoes and other insect pests of humans and livestock ê preservation of house structure (wood, thatch)
3.2 Elicit the relative importance of the various stove functions (e.g. ranking or scoring techniquescommonly used in PRA approaches could be useful)
3.3 Develop an understanding of social issues that influence or are influenced by stove use:• Location of stove/fireplace. Does this vary seasonally or for special occasions? Why?• Fuels. What types? How is it acquired? Which members of the household are responsible for
buying/collecting/processing it? What are fuel costs in time/money, and are they changing? Are thereseasonal variations? What are their likes and dislikes about currently used fuels?
• Cooking utensils. What utensils are used, where do they get hold of them, which are the cook’spreferred utensils and why?
• Foods. What are staples and speciality foods? What makes a meal delicious, and what makes a mealbad? Seasonal variations in foods eaten? Do foods eaten vary between households and between membersof a household? Why?
• Cooking practices. Who prepares and cooks different foods? How are foods prepared and cooked?Why are they cooked in this way? Do practices change seasonally, and/or in times of scarcity?
• Household structure. How many people eat at the household, and how often? Do household memberseat together?
• Cultural issues. Taboos and rituals relating to cooking and eating practices?• Perspectives. What are their views on any problems the have in relation to stove use, cooking practices
etc., what would they like to change, and how would they make those changes?
3.4 Develop an understanding of technical issues relating to stove use:• Fireplace/stove. What kinds of fireplace and stoves/ovens/kilns are used? What are their advantages
and disadvantages? Note dimensions of fireplaces and stoves.• Fire management. If open fire is used, how are fires built and managed, and why?• Fuels. What is used for kindling? What is used for fuel? Seasonal variations? Fuel
preparation/processing? Compare combustion characteristics of different fuels. What are localmeasurement units for fuel (price, weight, length)? Note dimensions, and variation.
• Cooking utensils. Variation in pot sizes? Are there standard sizes? Materials used (e.g. clay, metal), andthere relative advantages and disadvantages. Are lids used? Why? Note dimensions.
• Cooking practices. How long do different foods take to cook, at what heat and flame intensities?Distance between pot and flame, and does this vary for different foods/utensils?
• Available materials. What materials are available and affordable locally?• Local skills. Are there local potters, blacksmiths etc.? What materials and tools do they use, and what
are there skills?
3.5 Elicit perceptions of target groups and other stakeholders regarding key problems associated withstove use and areas for potential improvement
4. Design and field test a range of prototype stoves in collaboration with target groups
111
4.1 Design a selection of prototypes based on an understanding of the social and technical constraintsidentified. If stoves are already being used, look for simple but effective ways of improving on existing models. Materials andbuilding techniques should as far as possible be locally available, and as cheap as possible. Designs should be flexible, so thatdifferent users can adapt it to suit their needs, and as easy to use as possible.
4.2 Prepare models or drawings of each design, discuss their potential advantages and disadvantageswith the target group, and get their opinions on which designs should be tested on a pilot basis in theircommunities.
4.3 Field test the selected prototypes, and regularly monitor the trials based on the users’ own criteria.Do they like the new designs? Are they better or worse than what they are used to? In what way? What improvements could be made?
5. Evaluate prototypes, and draw up profiles for most successful prototypes. 5.1 Ask those members of the target group who took part in the trials to evaluate the different models.Ask them to rank the different models, and their reasons for the ranking order.
5.2 Based on their evaluation, draw up profiles for the preferred stoves. These profiles should include:
• Who the stove is suitable for (what climates, areas, cultures, income groups etc.)
• What are the advantages and disadvantages of the stove
• Constraints to adoption
• How to use the stove most effectively for different functions (e.g. different cooking techniques)
6. Identify methods for promotion, dissemination, production, marketing, training and maintenance 6.1 Production and maintenance. Who is currently producing and maintaining stoves? Who has thepotential to do so (materials, tools, skills, financial resources)? Can small-scale artisans be involved?Can members of the target group be involved e.g. can poor women be trained?
6.2 Promotion and dissemination.
• What are effective institutions for promotion and dissemination? E.g.Community groups, NGOs, community shops, places of worship, market places, health workers, schools,communities/individual involved in initial trials.
• What are effective media? E.g. face to face, drama, posters, radio, TV, festivals/feasts,demonstration centres etc.
6.3 Training. Who will train those who produce, maintain/service, and use the stoves? Training oftrainers?

112
Appendix B: Small and Medium Enterprises (SMEs) in India
Background
Second Five Year Plan - 1955The foundations of the policy for small scale industry were laid in the Second Five Year Plan. In 1956the government announced its second industrial policy which chose equity as the guiding principle forthe development of small industries. It noted that “small scale industries provide immediate largescale employment; offer a method of ensuing a more equitable distribution of national income andfacilitate an effective mobisation of resources of capital and skill which might otherwise remainunutilised” (GOI: 1955). Within a higly protected and closed national economy, the SMEs wereprovided with product protection (to prevent competition from larger units), subdised raw materialand cheap credit.
Policy statement: 1977In the 1970s, India’s swing to an even more socialist stance was reflected in this policy statement. Itargued for an expanded role for this sector and extended the list of products exclusively reserved forsmall industries. Some of the issues relevent of this study are• whatever can be produced by small and cottage industries must only be so produced;• the number of products reserved for SSI was increased from 180 to 504, with a further increase to
836 items in 1996;• special legislation was introduced to give adequate protection to the self-employed in cottage andhousehold industries.• each district would have a ‘District Industries Centre’ which would provide single-windowservices
In 1985, taking into account the inflation, the investment ceiling for SSI was raised to Rs. 350,000and to Rs. 450,000 for ancillary industries.
Economic reforms of the 1990sThe industrial policy of 1991 marked the shift from a highly regulated and controlled economy to amore liberal one. This was initially followed by a higher economic growth, higher productivity,increased job creation and rise in real wages of unskilled agricultural labour. A more recent countrystudy conducted by ILO (1996) observed that employment in the large scale industries is stagnating asproductivity gains had been achieved through ....
These changes have had varying implications for the SSI. While sub-sectors like electronic,information technology, automobile components manufacture are thriving. Other sub-sectors haveseen the demand for their goods disappear or face greater competition from other sectors Thefoundries which have been unable to adjust product and process have become uncompetitive. Thehosiery knitting units in Calcutta using traditional circular frame have lost their market to mechanisedunits in Coimbatore. The lock industry in Kanpur, inspite of increasing demand, is stagnating.

113
Contribution of this sector to the national economy:
There is general perception in India that the contribution of this sector is understimated. It is preciselyto this end that the National Informatic Centre is undertaking a survey to obtain the value ofproduction and employment in this sector.Some statistics according to DCSSSI (1998).* The total number of registered units stand ar 2,352,000.* The number of unregistired units are estimated to be 66,200.* The percentage share of production of SSI to total manufacturing sector is 40.23%.* The estimated employment provided by this sector is 16,720,000.* The percentage share of employment of SSI to total employment in manufacturing is 48.8%.* Household and non registered units together contribute 37%.
Range of products manufactured
This sector produces a wide range of products, from simple consumer goods to high-precision andsophisticated end-products. As ancillaries, it produces a variety of parts and components required bylarge enterprises. It recycling metals, acids and other chemcials to supply as intemediate goods toindustry (large and small) and other users. The sector has emerged as a major supplier of massconsumption goods like leather articles, plastic and rubber goods, paints and chemicals, fabrics andready-made garments, cosmetics, metal utensils, sheet metal components, soaps and detergents,processed food and vegetables, wooden and steel furniture etc. More sophisticated items includetelevision sets, electronic calculators, microwave components, air conditioning equipment, electricmotors, automobile parts, drugs and pharmaceutical.
Government's Promotional Policy and Support Network1
New policies/measures for small scale industries (SSI)
In order to help the sector integrate with the industry at large within liberalised economic framework,the government of India has announced new policy measures. In the present context, the followingare of particular interest as announced in the year 1991 :
a. The investment ceiling for the purpose of definition of a small unit has been raised to Rs. 6million (Rs. 7.5 million if the unit concerned undertakes to export 30 percent of its output orif it is an ancillary unit i.e. a firm supplying at least 50 percent of its output to large scaleindustries).
b. Other investors (including large scale enterprises and foreign investors) are now allowed 24per cent equity participation in a small scale unit.
c. The Act on Delayed Payments to Small and Ancillary Enterprises has been promulgated.Under this act, buying/mother units will be required to pay interest on delayed payments forsupplies bought from SSI units if the payments are delayed beyond the negotiated and agreedupon time period.
1 This section draws extensively on the document -UNIDO: 1997.

114
d. The Reserve Bank of India has announced a package of measures to ensure a better flow ofcredit to the SSI through measures such as expansion of 'single window' loan scheme. Banksare encouraged to open specialised SSI branches and to give greater priority to the sector intheir annual credit budgets.
e. Access to inputs has been improved by giving- SSI priority to allocation of iron and steelfrom public sector undertakings and by removing, obstacles to imports of a ran-e of rawmaterials and intermediate products.
f. The number of products which are reserved for SSI stands at 836 In 1994. This represents adecrease of only 7 items since the economic reform process has been initiated in 1991.
The Government of India during the pre-liberalisation period i.e. before 1991 had several incentivesand subsidies for promotion of SSI sector. These included providing term finance at concessionalrates of Interest, hi-her debt-equity ratio, capital investment subsidies to encourage investment in lessdeveloped areas, incentives for starting electronic industries etc.
The government promotional framework
The central and state governments in India have together set up an elaborate 3-tier structure forpromoting the small scale sector
1. At national level, in pursuance of the recommendations of International Perspective Planningteam (1953-54), several institutions have been set up. There is 'Central Small IndustriesOrganisation' (CSIO) which has been renamed as 'Small Industries DevelopmentOrganisation' (SIDO). During the last three and a half decades, this institution has emergedas the core promotional agency at the central level with a professional staff of more than13,000 in the year 1993. It consists of 28 Small Industries Service Institutes (SISIs), 30branch SISIs, 37 extension centres in specific products and 74 workshops as in the year 1993.However subsequently, some of these have been wound up due to their financial 'non-sustainability. These institutions provide technical and management consultancy, organisetraining programs, conduct techno-economic surveys, prepare project profiles and helpprepare unit specific project reports.
Besides, there are four regional testing laboratories with state of the art equipment and 19field testing stations which are meant to promote awareness on quality control andstandardisation, provide testing, facilities, provide pre-shipment inspection as required by the'Export Promotion Councils' and organise related training, programs. In addition, there aretwo 'Prototype Development and Training Centres' (PDTC) to develop new technologies andupgrade the existing, ones. There are a number of other technical institutions that areworking closely with SBDO, which are more specialised in the fields of Tool designing,Electronics and Measuring instruments, Prototype development and Handtools etc. Four'Central Tool Rooms' in Delhi, Calcutta, Bangalore and Ludhiana, have been set up underbilateral assistance programs.

115
Table A1-Administrative Structure for Governance of Small Scale Industries.
Industry Agency Administrative Dept./MinistryLarge/medium Industries Dept. of Industrial Policy and
Promotion and Dept. of IndustrialDevelopment, Ministry of Industry
Small Scale Industries Small Industries DevelopmentOrganisation
Dept. of Small Scale, Agro &Rural Industries, Ministry ofIndustry.
Powerlooms Textile Commissioner Ministry of Textiles.
Traditional IndustriesKhadi and Village Industries(KVI) Khadi and Village Industries
CommissionDept. of Small Scale, Agro &Rural Industries, Ministry ofIndustry.
Handlooms Development Commissioner(Handlooms)
Ministry of Textiles
Sericulture Central Silk Board Ministry of TextilesHandicrafts Development Commissioner
(Handicrafts)Ministry of Textiles
Coir Fibre Coir Board Dept. of Small Scale, Agro &Rural Industries, Ministry ofIndustry
In practice, the small scale industry sector serves as a residuary sector in the sense that allunits that fall within a prescribed investment limit and are not recognised in a particular sub-sector are included in the small scale industries sector.
'National Small Industries Corporation' (NSIC) is another important institution set up in1955 that supplies primarily imported machinery on easy finance terms, provides marketing,assistance, operates 'Prototype Development and Training Centres' (PDTC) in specific fieldssuch as machine tools, injection moulding, leather manufacturing equipment etc. NISIET(now called National Institute of Entrepreneurship and Business Development i.e.NIESBUD) was set up to train and promote personnel, industrial managers andentrepreneurs.
Other national level institutions that are supporting the small scale sector are 'NationalResearch Development Corporation' (NRDC), 'Bureau of Indian Standards' (BIS), 'NationalProductivity Council' (NPC), 'Consultancy Development Centre' (CDC) and 'Electronic,,.Test and Design Centres' (ETDC). The central financial institutions have also set up theEntrepreneurship Development Institute of India (EDH) at the national level to promoteentrepreneurship.
All the above mentioned institutions are largely meant for the modem small scale industry.In order to promote khadi and village industries, a separate high level commission has beenset up under the Ministry of Industry. Similarly for the handlooms, handicrafts, sericultureand other non-modem small units there are separate divisions to promote them.

116
2. At the state level, the governments have set up institutions as follows:
• Small Industry Development Corporations (SIDCS) to develop infrastructure in theform of industrial plots and industrial sheds.
• State Financial Corporations (SFCS) to provide long term credit facilities• State Exports Promotion Corporations to provide marketing assistance for exports
from the small scale sector.• Technical Consultancy Organisations (TCOS) that provide technical, financial and
marketing consultancy to the sector.• Centre for Entrepreneurship Development (CEDS) and Institute of Entrepreneurship
Development (IEDS) have been set up to promote entrepreneurship throughtraining.
3. At District level, in the year 1978, the central government launched a program ofestablishing District Industries Centres to provide under a single roof all the support services,clearances, licenses and certificates required by the small entrepreneurs. There are morethan 400 such centres, one each in a district.
Institutional Finance for Small Scale Industries:
The following agencies through their various schemes provide finance to small scale industries sectorunder the overall policies and guidelines evolved by Reserve Bank of India.
At the National Level:1. Small Industries Development Bank of India (Mainly through re-finance)2. National Bank for Agriculture & Rural Development3. National Small Industries Corporation4. Khadi & Village Industries Commission5. Nationalised Banks6. Development Commissioner, Small Scale Industries (DCSSI)
At the State Level:1. State Financial Corporations (SFCS)2. State Industrial Development Corporation (SIDCS) - Infrastructure/Finance3. State Co-operatives Banks4. Khadi & Village Industries Board
At Regional & District Level:1. Regional Rural Banks (RRBS)2. District Central Co-operative Banks3. Primary Co-operative Banks4. Branches of State level institutions & nationalised banks about 65,000 in number5. Khadi & Village Industries Commission6. District Industries Centre (DIC)

117
The non-government promotion structure
There are three national associations representing all type of industries, small and large. These are'Federation of Indian Chambers of Commerce and Industries' (FICCI), Confederation of IndianIndustries (CH) and 'Association of Chambers of Commerce and Industries' (ASSOCHAM). Theseassociations represent mainly the interests of large scale industries.
However, these associations have membership of small sector as well and represent mainly the policyrelated interests of SSI sector.
The exclusively small industry related associations are diversified geographically and sectorally andare supposed to have been linked with 'Federation of All India Small Scale Industries' (FASSI),'Federation of Small and Medium Industries' (FOSMI) and also Indian Council of Small Industries(ICSI). However these institutions are weak in character due to their working, for cross purposes andlack of dynamic perspective for small scale sector growth. They have virtually no linkages with thesmall industry in general and their local associations in specific. Another institution that is concernedwith the small and medium enterprises is 'World Assembly of Small and MediumEnterprises'(WASME). There are only a few of the local associations that are involved in providingspecific individual level services to the small industry. However, the associations are involved inlobbying with the government to provide one or the other facilities or benefits to the sector.
118
APPENDIX C: Methodology Used to Identify Energy Intensive Sub-sectors
Nature of Central Statistical Organisation (CSO) Survey Analysis
The following sampling design applies to the CSO data for industrial groups at the 3 digit level. Thestrata or industrial groups were divided into three categories for the purpose of sampling as follows:
Category 1: Those industry groups where the number of factories is 20 or less.Category 2: Those industry groups where the number of units, within each group is between 21 and60.Category 3: Those industry groups where the number of units, within each group is 61 or more.
All the factories in each group of category 1 were completely enumerated. A fixed sample of 20 unitsfrom each group belonging to category 2 was drawn while a sampling of one in three was adoptedfrom each group of category 3.
There were implications from this sampling design that were not fully appreciated until moreinformation was supplied from the CSO relating to data from the Industrial Census. The IndustrialCensus data covers all industries with over 100 employees and all of these are included in the CSOsurvey data before the above sampling design is applied. The actual numbers of units in eachindustrial category were provided separately and are at a 4 digit category level. The way thisinformation was dealt with and the implication of it are considered below. An extract of the tableproviding this information provided is shown in Table A4.4.
Methodology
The overall approach to analysis is determined by the objective of this research, i.e., to identify highenergy using and polluting industrial activities, employing a large number of low income workers insmall and medium sized units, so that interventions would generate more benefits for the employedpoor and the neighbourhood.
In relation to the CSO data, it was considered that categories to whom the following attributes appliedshould be drawn out:
• high fuel and electricity usage (therefore with potential for significant energy efficiency impactand possible environmental impact);
• large total numbers of employees (more people involved overall in consequential benefits of anyenergy efficiency improvement);
• predominance of smaller-scale units (likely to employ higher proportion of poorer paid workers);• high net value added per employee (likely to be more amenable to implementing energy efficiency
measures);• high productive capital investment per employees ( as evidence of investment capability)
Step 1:
Given that the data available are at three levels of aggregation, there were two options. These were (i)whether to move from the highest level of aggregation, through a process of selection, to the activitycarried out in the factories; or (ii) to start from the factory level (4-digit categories) and through aprocess of selection, move up to the two digit category. Given the aim of the study the first option was
119
considered more appropriate and therefore initial analysis was applied using the above criteria at thetwo digit category level. However when this approach was applied anomalous groups were evidentwhich appeared to meet these criteria but when looked at with more resolution, at the 3- digit level,the criteria did not apply. Following consultation with the CSO, the decision was made to focusanalysis at the 3-digit level.
Step 2:
Before proceeding with more in-depth analysis at the 3-digit level it was observed that certain of the 3digit categories representing large scale units and higher level technology were really outside thescope of this study, particularly in relation to poverty issues. Also some of these categories are alreadybeing targeted by other DFID programmes. As they were likely to dominate the type of criteria thatwere being considered i.e., fuel use, investment levels, added-value etc., a number of categories wereextracted prior to subsequent analysis. This reduced the total categories examined from 199 to 157.This step in the analysis will need to be re-examined at a later stage to try and define an objectivebasis for the cut-off that has been applied.
Step 3
In order to extrapolate representative data at the 3 -digit group level from the CSO survey for all theindustrial groups it was necessary to follow the procedure below:
(i) take the census data at 4-digit level and aggregate it according to the 3-digit categories
(ii) deduct the number of census returns calculated for the 3-digit category in (i) above from the CSOsurvey totals at the 3 digit category group level
(iii) multiply the number derived above at (ii) by 3
(iv) add the numbers derived at (i) and (iii) above. This then provides the total number of units for allIndia in each 3 digit industrial category.
The above method is the only approach that could be adopted in the absence of complete IndustrialCensus data of the same form as available in the CSO survey data. This approach is recognised tointroduce a level of distortion with a bias in average data weighted towards larger scale factories asthese are included to a greater degree than smaller factories.
Step 4 Ranking and Selection
To be able to proceed with the selection process at the 3-digit category level, the next activity was toestablish criteria to be used. This was then followed by a ranking of categories according to thesedifferent criterion. Finally it was necessary to decide an algorithm and make a selection based uponthese criteria. This process is described below.
The following parameters were calculated from the CSO survey data but based upon the total numberof units derived as described after incorporation of the Industrial Census data
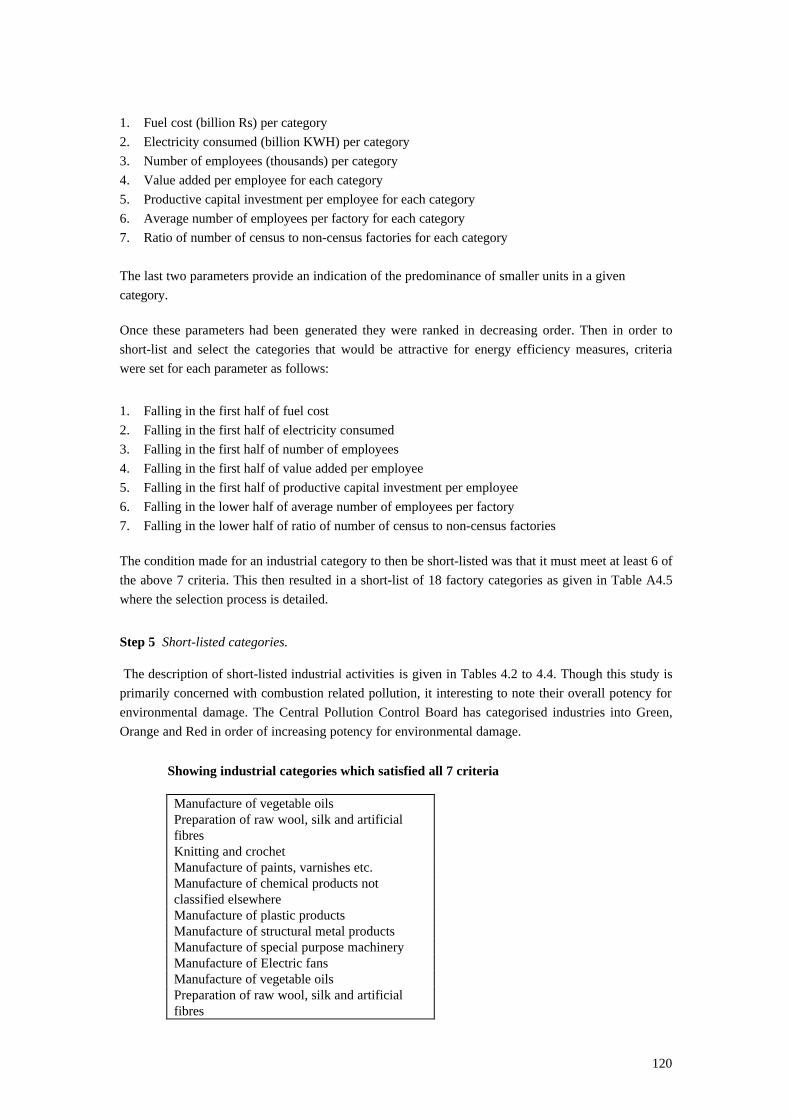
120
1. Fuel cost (billion Rs) per category2. Electricity consumed (billion KWH) per category3. Number of employees (thousands) per category4. Value added per employee for each category5. Productive capital investment per employee for each category6. Average number of employees per factory for each category7. Ratio of number of census to non-census factories for each category
The last two parameters provide an indication of the predominance of smaller units in a givencategory.
Once these parameters had been generated they were ranked in decreasing order. Then in order toshort-list and select the categories that would be attractive for energy efficiency measures, criteriawere set for each parameter as follows:
1. Falling in the first half of fuel cost2. Falling in the first half of electricity consumed3. Falling in the first half of number of employees4. Falling in the first half of value added per employee5. Falling in the first half of productive capital investment per employee6. Falling in the lower half of average number of employees per factory7. Falling in the lower half of ratio of number of census to non-census factories
The condition made for an industrial category to then be short-listed was that it must meet at least 6 ofthe above 7 criteria. This then resulted in a short-list of 18 factory categories as given in Table A4.5where the selection process is detailed.
Step 5 Short-listed categories.
The description of short-listed industrial activities is given in Tables 4.2 to 4.4. Though this study isprimarily concerned with combustion related pollution, it interesting to note their overall potency forenvironmental damage. The Central Pollution Control Board has categorised industries into Green,Orange and Red in order of increasing potency for environmental damage.
Showing industrial categories which satisfied all 7 criteria
Manufacture of vegetable oilsPreparation of raw wool, silk and artificialfibresKnitting and crochetManufacture of paints, varnishes etc.Manufacture of chemical products notclassified elsewhereManufacture of plastic productsManufacture of structural metal productsManufacture of special purpose machineryManufacture of Electric fansManufacture of vegetable oilsPreparation of raw wool, silk and artificialfibres

121
Manufacture of paints, varnishes etc.Manufacture of chemical products notclassified elsewhereManufacture of plastic productsManufacture of structural metal productsManufacture of special purpose machineryManufacture of Electric fans

Natural Resources InstituteCentral AvenueChatham MaritimeKent ME4 4TBUK
Tel: + 44 (0) 1634 883942Fax: + 44 (0) 1634 883607E-mail: [email protected]