Energy efficiency and jobs: UK issues and case studies · Energy efficiency and jobs: ......
48
Energy efficiency and jobs: UK issues and case studies A report by the Association for the Conservation of Energy to the September 2000
Transcript of Energy efficiency and jobs: UK issues and case studies · Energy efficiency and jobs: ......

Energy efficiency and jobs:UK issues and case studies
A report by the
Association for the Conservation
of Energy to the
September 2000

2
EN E R G Y EF F I C I E N C Y A N D JO B S : UK I S S U E S A N D C A S E S T U D I E S
A c k n o w l e d g e m e n t
This report is largely based on an EC SAVE funded research project:
National and Local Employment Impacts of Energy Efficiency Investment
Programmes XVII/4.1031/D/97-032. Thanks are due to all of the
partners in the 9 countries involved, and to the European Commission.
Copies of the SAVE reports can be obtained from the Association for
the Conservation of Energy. Tel 020 7359 8000. Email

EN E R G Y EF F I C I E N C Y A N D JO B S : UK I S S U E S A N D C A S E S T U D I E S
Ta b l e o f c o n t e n t s
3
E x e c u t i v e s u m m a r y 4
C h a p t e r 1 : H o w e n e r g y e f f i c i e n c y c r e a t e s j o b s 6L a b o u r i n t e n s i t y 6D i r e c t e m p l o y m e n t . 6I n d i r e c t e m p l o y m e n t 7E c o n o m i c g r o w t h 8T h e r e l e v a n c e o f f u e l p o v e r t y i n t h e U K 8B u s i n e s s a s u s u a l c a s e s 9
C h a p t e r 2 : W h y t h e U K n e e d s t h e j o b s e n e r g y e f f i c i e n c y c r e a t e s 1 0T h e u n e m p l o y m e n t r a t e 1 0R e g i o n a l d i s p a r i t i e s 1 0L o n g t e r m u n e m p l o y m e n t a n d s k i l l s d i s p a r i t i e s 1 1
C h a p t e r 3 : C a s e s t u d i e s 1 3T h e H o m e E n e r g y E f f i c i e n c y S c h e m e 1 3H e a t w i s e 1 6S t a n d a r d s o f P e r f o r m a n c e ( S o P I ) 2 2F r i d g e s a v e r s 2 5M a n w e b D e m a n d S i d e M a n a g e m e n t S c h e m e 2 7S h e t l a n d I n t e g r a t e d R e s o u r c e P l a n n i n g 3 1T h e 1 9 9 5 B u i l d i n g R e g u l a t i o n s 3 5S u m m a r y o f c a s e s t u d y f i n d i n g s 3 8
C h a p t e r 4 : C o n c l u s i o n 4 0R e f e r e n c e s 4 1
A p p e n d i x A : I n p u t - o u t p u t a n d m a c r o e c o n o m i c m o d e l l i n g . 4 3I n p u t - o u t p u t m o d e l l i n g 4 3M a c r o - e c o n o m i c m o d e l l i n g 4 5
A p p e n d i x B : T h e ‘ r e a l ’ r a t e o f u n e m p l o y m e n t 4 6
List of tables
Table 1. Direct and indirect jobs per £1 million expenditure (including private investment). 4
Table 2. HEES major installations and average costs 1991 - 1997. 13
Table 3. Permanent staff employed by Heatwise 18
Table 4. Labour in installation of energy efficiency measures under SoP 1. 23
Table 5. Jobs created in the Shetland IRP project. 34
Table 6. New houses completed in Britain 1996 to 1997. 36
Table 7. Estimates of additional labour requirements in 1996/7 37
Table 8. Summary data for the case studies. 39
Table 9. Alternative measures of unemployment, Great Britain, January 1997
(Beatty et al, 1997). 46
4
EN E R G Y EF F I C I E N C Y A N D JO B S : UK I S S U E S A N D C A S E S T U D I E S
E x e c u t i v e s u m m a r y
Improving energy efficiency in buildings is a
particularly effective way to stimulate
employment in the places where it is needed
most, and to employ people who have the
greatest trouble in finding jobs. In terms of
direct employment, energy efficiency in
buildings is a labour intensive sector, engaging
many small, geographically dispersed
installation companies. Furthermore, lower
fuel bills mean more money to spend on non-
energy items (and the labour intensity in
sectors stimulated by general consumption
exceeds that in the energy supply sector).
Thus indirect employment is stimulated by the
energy savings, for years after the work is
completed. Ultimately, energy efficiency
contributes to economic efficiency and growth,
which creates more wealth and employment
opportunities.
Despite economic growth in the l990s,
joblessness remains a very real problem for
several million people in the UK. This is a
tragedy for those who are
unable to find work, and a
major drain on public
finances. The problem is
concentrated in particular
locations, notably large cities
and former industrial areas.
Job losses in manufacturing
have left many people,
particularly men, ill equipped
to benefit from the new job
opportunities which are
arising as the economy grows.
Unemployment, poverty and poor housing are
all concentrated in Britain’s cities. Each of
these problems can reinforce the others, in a
cycle of decline. Energy efficiency
improvements are an essential aspect of
urban renovation, and offer a possible way to
improve people’s job prospects and living
environment in Britain’s cities.
Seven energy efficiency investment
programmes were studied to identify the jobs
created. Direct employment was calculated by
interviewing implementing agencies, using
published reports, and where necessary by
extrapolation from the amount spent in each
sector. The indirect employment was
calculated using an input-output modelling
approach. Further modelling using the same
data assessed the long term impacts on the
economy as a whole. The original case studies
and modelling work were contributions to a
European Commission SAVE funded research
programme, involving 9 countries (Wade et al.,
2000).
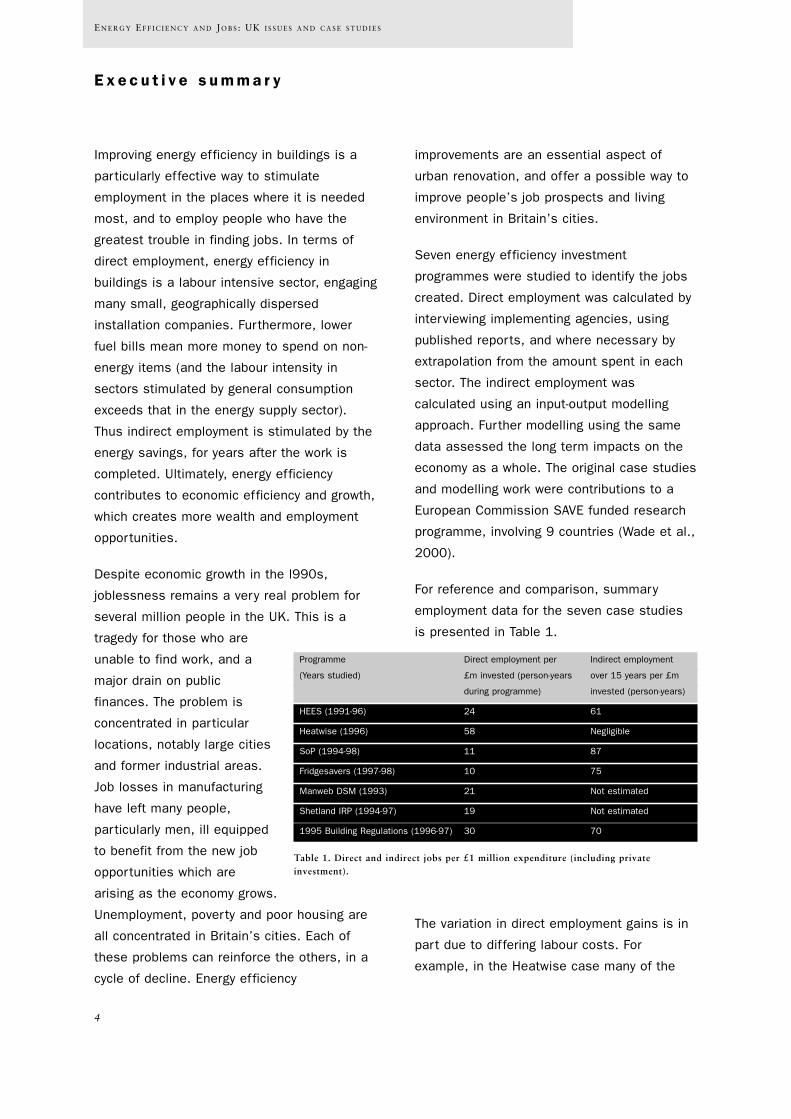
For reference and comparison, summary
employment data for the seven case studies
is presented in Table 1.
The variation in direct employment gains is in
part due to differing labour costs. For
example, in the Heatwise case many of the
Programme Direct employment per Indirect employment
(Years studied) £m invested (person-years over 15 years per £m
during programme) invested (person-years)
HEES (1991-96) 24 61
Heatwise (1996) 58 Negligible
SoP (1994-98) 11 87
Fridgesavers (1997-98) 10 75
Manweb DSM (1993) 21 Not estimated
Shetland IRP (1994-97) 19 Not estimated
1995 Building Regulations (1996-97) 30 70
Table 1. Direct and indirect jobs per £1 million expenditure (including privateinvestment).

5
EN E R G Y EF F I C I E N C Y A N D JO B S : UK I S S U E S A N D C A S E S T U D I E S
employees were in training, and received a
relatively low wage. Variation is also
introduced where data was unavailable,
particularly for the estimation of employment
in manufacturing. In the HEES and Heatwise
case studies, which were grant funded, one
could argue that government money could
have been used to create an equivalent
number of direct jobs in another sector. The
indirect employment reported in Table 1 arises
from the re-spending of money saved by
households that benefit from cost effective
energy efficiency improvements.
The core of the report is the discussion in the
case studies, relating to how businesses and
individuals responded to the new employment
opportunities arising from energy efficiency
programmes. The studies show the benefits of
energy efficiency investment in terms of
employment gains, increased training, and
opportunities for people who have been in
long-term unemployment. The case studies
also make an assessment of the cost-
effectiveness of the programmes in terms of
energy savings. This cost-effectiveness varied,
but was generally good. As discussed in the
studies, where household energy efficiency
improvements targeted the ‘fuel poor’, energy
savings were often a secondary consideration
to being able to heat one’s home adequately.
Therefore cost effectiveness in terms of
energy savings was reduced. Where training
and addressing long-term unemployment were
priorities the total cost prohibited cost-
effectiveness, if measured only in terms of
energy savings.
Energy efficiency programmes in the UK have
multiple aims, such as assisting low income
families afford to heat their homes, reducing
carbon dioxide emissions, and avoiding
investment in new supply capacity. In general
creating employment is not the aim, but this
study demonstrates that investing in energy
efficiency has created jobs and, where
schemes were designed to include quality
training, increased skill levels for the workers
involved. This is a very desirable side benefit,
particularly considering that many of the jobs
were created in manual occupations in areas
of high unemployment.

6
EN E R G Y EF F I C I E N C Y A N D JO B S : UK I S S U E S A N D C A S E S T U D I E S
C h a p t e r 1 : H o w e n e r g y e f f i c i e n c y c r e a t e s j o b s
This chapter examines the reasons why
investment in energy efficiency creates more
employment than investment in many other
sectors. It also introduces some of the issues
taken into account when assessing the
employment impacts of the energy efficiency
investments described in the case studies in
Chapter 3.
L a b o u r i n t e n s i t yInvestment in any part of the economy will
create a number of direct jobs, depending on
the labour intensity in the sector. All sectors
of the economy use a combination of labour,
capital and natural resources, but in different
proportions. Traditional energy supply is a
natural resource intensive sector, with a high
proportion of the total cost attributable to
fossil fuel inputs. Wind and nuclear power are
examples of capital intensive industries,
where specialised equipment is the major
investment cost. While service sector
industries are usually the most labour
intensive, the manufacture and installation of
energy efficiency measures in buildings is
relatively labour intensive, compared to energy
supply and to many capital intensive sectors
which benefit from public sector funding.
In making an assessment of the net effect of
energy efficiency investment on jobs it is
necessary to examine who pays for the
investment, and what they might otherwise
have done with the money. Where investments
are government funded, net jobs will be
created if labour intensity in the energy
efficiency sector is higher than in the
alternative sector (which might otherwise have
benefited from the investment). If consumers
pay, the direct impacts on employment depend
on the average labour intensity across the
spectrum of consumption sectors. In either
case one could argue that the net effect will
be unclear, and could be taken to be zero.
However, the jobs created may be in sectors
and locations which are more in need of
stimulus than those where employment is
displaced.
However, one must also take account of how
consumers spend money saved on fuel bills
as a result of improved energy efficiency.
Assuming the investment is cost-effective for
consumers, there will be a shift in their
expenditure away from energy and into general
consumption. This re-spending effect does
create net employment, because labour
intensity is higher for general consumption
than in energy supply. This is discussed under
‘indirect employment’ below.
D i r e c t e m p l o y m e n t .For energy efficiency investments the main
categories of direct employment are the
following:
1. Manufacture of equipment and materials.
Stimulating the demand for energy efficiency
products will maintain or create employment in
relevant manufacturing sectors. This
employment impact tends to be difficult to
quantify, as the additional demand created by
individual programmes has tended to be a
small percentage of manufacturers’ turnover.
2. Installation of measures. Most buildings
initiatives involve the installation of specific
measures, such as insulation, glazing and
heating systems. Additional work is involved in
deliveries, and subsequently in maintenance

7
EN E R G Y EF F I C I E N C Y A N D JO B S : UK I S S U E S A N D C A S E S T U D I E S
operations. In the case of new buildings, this
type of work may add to the cost and labour
input at the construction stage.
3. Management, administration and monitoring
of the investment programme. These jobs are
usually in government departments or
agencies, utilities, housing providers, private
companies, or a combination of these.
4. Depending on the type of initiative, there
may be additional work in auditing, efficiency
rating, marketing or advice provision.
Most jobs will be in the first 2 categories, i.e.
manual occupations. As discussed in Chapter
2, stimulating employment in manual
occupations is important in tackling
unemployment in the UK. Moreover, the work
is spread across the country, and may even
be concentrated in areas where incomes and
employment levels are below average. In
addition, training is required for new
employees. The skills developed through this,
and the ensuing work experience, will increase
the employability of the people concerned: a
useful effect where problems of long-term
unemployment are important. Therefore, even
if one argues that in some cases direct
employment gains may be negated by losses
elsewhere, the jobs will have attributes which
make them relatively desirable.
I n d i r e c t e m p l o y m e n tWhen an industry expands other businesses
will benefit from the wages spent by workers,
and demand for secondary goods and services
which support the industry. Many studies on
employment impacts consider this ‘multiplier
effect’. However many economists doubt that
this multiplier effect really operates at the
national level, arguing that money in
circulation in the economy is finite at any
given time, and jobs will simply be displaced
elsewhere. The figure used for the multiplier
effect has been revised downwards in recent
years, and even abandoned by the Treasury.
However the Department for Education and
Employment (DfEE) does consider that the
multiplier has a positive effect at the local
level (DfEE, 1996). The figure used by DfEE is
0.17, suggesting that for every 100 new jobs,
a further 17 will be created in the local
economy. This is an important consideration
given the localised nature of the
unemployment problem in the UK. However, in
the case studies presented in Chapter 3 we
have not considered this local multiplier
effect.
An important indirect employment impact,
which is specific to energy efficiency
investments, arises from the re-spending of
money saved on energy bills. Depending on
the cost-effectiveness of the investments, and
the payment method, there will be a change in
household budgets resulting from the initial
outlay, and subsequent savings on fuel bills. A
dedicated input-output modelling approach,
which considers linkages between economic
sectors and domestic consumption patterns in
the UK, was used to investigate this effect
(Jeeninga et al, 1999). The results for this
indirect ‘re-spending effect’ are reported in
each case study (where the modelling was
applied). Initial effects are smaller on an
annual basis than the direct employment
impacts, but continue for the lifetime of the
energy saving product, which may be 15 years
or more.

8
EN E R G Y EF F I C I E N C Y A N D JO B S : UK I S S U E S A N D C A S E S T U D I E S
Consideration must also be given to the
displacement of jobs which might have been
stimulated by alternative uses of public sector
funds. Where public sector funds were used to
finance the investments in a case study, this
effect is estimated by the input-output
modelling. The modelling approach is
discussed in more detail in Appendix A.
One should also consider negative impacts on
the energy supply sector. Energy supply is a
less labour intensive sector than energy
efficiency improvement, and therefore a shift
in spending from the former to the latter will
tend to create net employment. In the energy
supply sector, job losses as a result of energy
efficiency programmes are not a real concern.
Three factors explain this. Firstly, employment
in the energy supply sector is not very
responsive to the number of units sold, given
the fixed infrastructure involved, and the much
greater influence of technological change.
Secondly, company profits do not relate
proportionally to units sold, due to the price
control set by the regulator. Thirdly, energy
consumption has risen steadily in the UK
despite energy efficiency improvements, as
the economy has grown.
E c o n o m i c g r o w t hUltimately, what is needed to create and
maintain high levels of employment is strong
growth in the economy. Unfortunately,
economic growth has all too often been at the
expense of degradation of the natural
environment. However, better energy efficiency
can contribute to sustainable development by
stimulating economic growth while reducing
the environmental burdens imposed by energy
supply, distribution and use.
Empirical evidence suggests that OECD
countries with lower energy intensities
(consumption per unit of economic output)
enjoy higher rates of economic growth than
their competitors. There are, of course,
exceptions to the rule, as economic growth
depends on a wide range of factors, but it
stands to reason that an economy which
makes efficient use of resources will grow
more rapidly than one which is wasteful.
This assertion can be tested using
macroeconomic models. Capros et al. (1999)
investigated the effects of the energy
efficiency programmes discussed in Chapter
3, using a model of the European Union
economy, described in more detail in Appendix
A. The modelling results suggest a short term
boost to economic growth, and a positive
impact on employment in the economy as a
whole in the short and longer term.
T h e r e l e v a n c e o f f u e l
p o v e r t y i n t h e U KHouseholds are said to live in ‘fuel poverty’ if
they need to spend more than 10% of their
disposable income to heat their homes to an
adequate level. Many millions of households
are in this situation in the UK, and it is
thought to have contributed to over 49,000
excess winter deaths in the England, Wales
and Northern Ireland in 1998/99 (ONS,
2000). It is an important consideration when
examining the impacts of energy efficiency
programmes in the UK, as many initiatives aim
to assist the fuel poor through capital
investments their homes.
When calculating the energy savings resulting
from such a programme some adjustment to

9
EN E R G Y EF F I C I E N C Y A N D JO B S : UK I S S U E S A N D C A S E S T U D I E S
the potential savings needs to be made, to
reflect the fact that the homes are likely to
have been inadequately heated prior to the
improvements. Once the improvements have
been made, householders are likely to raise
the room temperature to a comfortable level,
rather than use less energy to achieve the
same, uncomfortably low temperatures.
Therefore it must be considered that 50 to
100% of the potential savings will be taken in
increased comfort rather than energy savings.
This effect is taken into consideration in the
studies presented in Chapter 3.
The causes, and geography, of fuel poverty
and unemployment overlap in the UK. By
creating employment opportunities in the
places where the fuel poor live one not only
begins to reduce their cost of living, but also
to tackle the underlying causes of poverty. As
discussed in Chapter 2, many jobless people
lack formal qualifications and skills, and do
not live in the regions where new job
opportunities are arising. The Heatwise case
study in Chapter 3 demonstrates that
installation of energy efficiency measures is a
viable area for skills development and training
for persons who have been in long-term
unemployment. Creating manual employment
in areas of fuel poverty has multiple benefits
for local residents.
B u s i n e s s a s u s u a l c a s e sFor each case study it was necessary to take
into account a business as usual case. For
every energy efficiency investment programme
there will be a proportion of free-riders. These
are individuals or households who would have
made the investments themselves, but
understandably make use of the available
incentives such as grants if they are eligible.
For the cases studied here this does not tend
to be an important issue since so many of the
programmes target the fuel poor. In order to
qualify for assistance households normally
have to be in receipt of specific social security
benefits. Therefore one can assume that few
are likely to have the capital necessary to
make the investments themselves.
Where the programmes investigated in the
case studies extend to all households and/or
the commercial and industrial sector,
adjustments are made to the energy saving
and employment estimates to reflect the
expected proportion of free-riders. In two of
the case studies the aim was to avoid
investment in new electricity supply capacity,
and therefore the savings are in terms of load
rather than energy, compared to the business
as usual scenario.

C h a p t e r 2 : W h y t h e U K n e e d s t h e j o b s e n e r g y e f f i c i e n c y
c r e a t e s
10
EN E R G Y EF F I C I E N C Y A N D JO B S : UK I S S U E S A N D C A S E S T U D I E S
In February 2000 the Financial Times reported
that there are now ‘as many jobs looking for
people as people looking for jobs’1 in the UK.
This conclusion is based on the number of
people claiming unemployment benefit
compared to the number of vacancies at Job
Centres (which is used to estimate the total
number of vacancies in the UK labour market).
Some employers are facing difficulties finding
staff to fill vacancies in sectors such as
information technology, product development
and customer support. However, joblessness
remains a very real problem for millions of
people in the UK. This chapter explores some
of the issues behind the figures, such as
‘hidden’ and long-term unemployment, regional
disparities in unemployment rates and the
skills mismatch between those looking for
work and the vacancies in expanding sectors
of the economy.
T h e u n e m p l o y m e n t r a t eUnemployment has fallen rapidly in the UK in
the late 1990s, with 1.16 million people of
working age claiming unemployment benefits
in February 2000. This is still a large number
of unemployed people, and yet it excludes
approximately 2 million others who would like
to work but are not eligible for unemployment
benefits. This has been called ‘hidden
unemployment’ (Beatty et al., 1997: See
Appendix B).
In 1998 the Treasury reported that:
‘Around 11.75%, or almost 4.25 million of
working age people in the UK are still without
work and wanting a job, despite the
unemployed component having fallen to around
1.9 million.’ (HM Treasury 1998, page 86).
Thus, in simple numerical terms, there is still
a pressing need to create more jobs in the
UK. Investing in energy efficiency can
contribute to this goal, by creating 10 to 30
direct person-years of employment per £1
million spent by consumers, utilities and/or
the government. In addition approximately 70
person-years of employment in other sectors
will be stimulated over 15 years per £1 million
spent, as consumers save energy and money,
and therefore spend less on energy supply
(which has low labour intensity) and more on
everything else.
R e g i o n a l d i s p a r i t i e sBetween 1981 and 1996 UK manufacturing
shed 1.4 million full time male jobs, with the
greatest losses in large cities (Turok and
Edge, 1999). In the 1980s manual
employment in the UK fell by 11.1%,
particularly in unskilled manual work.
Conurbations and cities lost 15 to 20% of
their manual jobs. While total employment has
been increasing gradually, this has tended to
involve predominantly part-time and female
workers, employed in rural areas and smaller
towns. The new jobs which have been created
in cities tend to be professional and
managerial positions.
Unemployment and economic inactivity among
men formerly employed in industry remains a
significant problem, despite economic growth
and employment growth in the economy as a
whole. In a recent study for the Joseph
Rowntree Foundation, Turok and Edge (1999)
reached the following conclusions:
‘National economic growth will not rectify the
situation on its own. It requires greater
emphasis in policy to be given to expanding1 ‘Brown’s jobless may be no more’. Financial Times February 17 2000.

labour demand in the cities and creating manual
employment’...’Historic evidence suggests that it
is unrealistic to expect people with limited
formal skills to secure the non-manual jobs
becoming available in cities...there is a particular
need to expand employment opportunities for
blue collar workers and greater effort and
resources should be devoted to this important
challenge by all levels of government’...’A
precondition for getting more than a few of
them back to work is to increase labour demand
through spatial targeting of economic
development towards areas where hidden
unemployment and worklessness is highest’
(page 52).... ‘A phased programme of physical
improvement to the fabric of old industrial cities
would provide opportunities for short term
employment and training as well as longer term
economic development’ (page 53).
The new interest in government circles in
restricting green field development and
regenerating Britain’s cities is to be
welcomed. However, the current pattern of job
growth in rural areas and small towns at the
expense of large cities makes this a
challenging task. Decentralisation of work and
population away from cities creates
environmental problems of its own, with
greater commuting distances, loss of green
field land and loss of economies of scale in
service provision. The potential for
environmentally beneficial centralised service
provision such as district heating is made
impractical where population densities fall
below certain levels.
In its 1997 Communication on Environment
and Employment, the European Commission
shares this view on the importance of urban
renovation:
‘Continuing and increasing efforts are to be
made in order to ensure that the European
financial instruments (Structural Funds,
Cohesion Fund, Community Initiatives)
promote economic growth, employment and
sustainability simultaneously...Member states
should strengthen the link between urban
development, environmental protection and job
creation by developing urban renovation plans
which focus on areas with particular potential
for environmental employment’ (European
Commission, 1997, page 18-19).
Improving energy efficiency in buildings would
make a valuable contribution to urban
renovation, and create local jobs which are
accessible to those who have lost jobs in
manufacturing. For example, in the case
studies in Chapter 3, the Home Energy
Efficiency Scheme created over 8,500 jobs
over 6 years, with 90% in installation or
manufacturing work.
L o n g t e r m u n e m p l o y m e n t
a n d s k i l l s d i s p a r i t i e sCampbell et al. (1998) examined historical
data on long-term unemployment in the UK
and concluded that there is no relationship
between overall jobs growth in an area and
changes in the rate of long-term
unemployment. This is to say that overall jobs
growth is neither a necessary nor a sufficient
condition to reduce the problem of
unemployment for those who have been
without a job for 6 months or more. Therefore
specific actions are needed to assist this
section of the population regardless of
whether employment is increasing in total.
The reasons for people experiencing difficulty
moving out of long-term unemployment are

complex and location specific. However, a
number of common themes can be identified.
These involve employers’ perceptions and a
discouraged attitude towards work among
some of the long-term unemployed. Until
recently there was also a situation whereby
loss of related benefits could make families
worse off in total if a low-paid job was taken.
However the most important reason is that
the long-term unemployed are
disproportionately represented by sectors of
the population which suffer discrimination
and/or lack skills which are in demand in the
labour market. The long-term unemployed are
disproportionately male, older, from manual or
manufacturing career backgrounds, from
ethnic minorities or disabled. Lone parent
women, persons with low levels of formal
qualifications, and persons in rented rather
than owner-occupied housing are also more
likely than others to among the long-term
unemployed.
In an assessment of the range of policy
options which have been used to address the
problem of long-term unemployment, Campbell
et al. (1998) identify two common features of
successful approaches. Firstly, training and
work experience must have a strong ‘market
orientation’, i.e. be as closely related as
possible to real work conditions, and to the
labour market situation participants will face
upon completing the programme. Secondly,
training must be in specific skills related to
jobs which are available. General training and
poorly focussed job creation schemes were
found to be of little help.
One approach which meets these criteria is
the use of ‘intermediate labour markets’,
whereby previously unemployed persons are
given employee status, paid at the going rate
in a socially useful, productive company. They
are simultaneously offered training and help
with job searching. The focus on socially
useful work is important in that the
businesses can offer services which might not
otherwise be made available. This minimises
the risk of displacing employment in
commercial enterprises. The Wise group in
Scotland have pioneered this approach. Their
work in providing insulation and other energy
efficiency services to low income families is
discussed in detail in the Heatwise case study
in Chapter 3.

T h e H o m e E n e r g y E f f i c i e n c y
S c h e m eThe Home Energy Efficiency Scheme (HEES)
was a government funded grant programme
overseen by the Department of the
Environment, Transport and the Regions
(DETR), targeting energy efficiency
improvements in the low-income domestic
sector. The scheme began in 1991, and
received £75 million of government funding in
1999/2000. This study focuses on the period
from 1991 to 1997. Over this period annual
funding and eligibility criteria changed several
times. The consequences of this instability in
terms of employment are investigated below.
In the period in question, HEES was
administered by the Energy Action Grants
Agency (EAGA) and monitored by National
Energy Action (NEA). Individual householders
applied for grants, and the work was carried
out by approved installers, who were co-
ordinated and paid by EAGA (when the
householder confirmed that the work had been
completed). Only one of the two main
measures, loft or cavity wall insulation, could
be chosen. Draught proofing, hot water
jackets, heating controls, efficient lighting and
energy advice were additional options, up to a
maximum grant per household of £315.
Householders, local authorities or others could
make additional contributions if necessary.
Data for the number of
installations for 1991 to
1996, and the average
cost per job are presented
in Table 2.
Over three quarters of the beneficiaries of the
scheme were in receipt of social security
benefits. NEA estimated that each household
could potentially save an average of £39 per
year on fuel bills. However the scheme
targeted the fuel poor who were likely to have
under-heated their homes prior to the
improvements. Therefore the actual energy
savings may have been as little as 20% of this
potential in some cases, as the householders
improved their level of comfort rather than
paying less for the same level of service. The
Buildings Research Establishment (BRE) found
that some fuel bills fell by only £9 per year in
1993. Later BRE research in 1996 suggested
that this was an underestimate. We have
therefore estimated an average annual energy
saving of just 500 kWh, with a value of
£14.75 per household per year. This is a
small saving, but not an indication that the
scheme was unsuccessful, since the aim was
relief of fuel poverty rather than energy
conservation per se.
Approximately 6% of the total cost of the
scheme went towards EAGA’s management
requirements, totalling £23.8 million over the
period 1991-1997. Installers applied for
registration under the scheme and could then
operate in their local area. There was usually
a maximum of 3 installers working in any one
area. This localised approach was beneficial in
terms of the regional
spread of employment
opportunities, and
benefited from
localised knowledge of
needs and
opportunities.
13
EN E R G Y EF F I C I E N C Y A N D JO B S : UK I S S U E S A N D C A S E S T U D I E S
C h a p t e r 3 : C a s e s t u d i e s
Energy efficiency Total installations Average cost
measure. 1991 to 1997 per measure
installed
Draught proofing 1,550,000 £119
Loft insulation 128,000 £219
Draught proofing plus
loft insulation 447,000
Table 2. HEES major installations and average costs1991 - 1997.

Data for this study were taken from NEA’s
monitoring reports (NEA 1992 - 1997) and a
National Audit Office report in 1998 (NAO,
1998). NEA staff were also interviewed for the
study. The reports focus on interviews with
installers, manufacturers and suppliers, and
provided a wealth of information on
employment issues (as employment creation
was a stated aim of HEES in its early years).
The NEA work particularly concentrates on the
effects of increased funding in 1995/6, which
stimulated the industry and employment,
followed by a budget cut in the following year.
This case study uses those results and figures
from the NAO report to extrapolate to the
employment impact over the 6 year period.
Effects of the budget increase in 1995/6
and subsequent cut
The annual budget for 1995/6 was increased
by £31 million from the previous year, to £100
million. In response to this increase, 90% of
approved installation firms took on new
permanent employees. These new employees
tended to have some experience in installation
work, and were not generally involved in
government job creation initiatives.
Approximately 750 new jobs were created in
installation firms in this year. Business
confidence was high, and many installers
began to expand their operations and diversify
in to new activities. In particular many firms
made efforts to move into cavity wall
insulation, which is a big step given the
training, licensing and specialised equipment
required.
In the following year the budget for HEES was
cut by £31 million, to its previous level. The
allocation per installer, rather than the number
of registered firms, was reduced. This had a
significant impact on the firms’ business,
given that HEES typically accounted for 50-
75% of their turnover. Competition became
more intense and profits more marginal,
though few companies actually went out of
business.
Installation firms continued in their efforts to
diversify their operations, and additional
sources of funding (such as the Standards of
Per formance scheme) maintained business for
many. The budget cut made diversification
more difficult due to staff reductions and
more restricted budgets for training and new
equipment. Increasingly installers were looking
for more skilled staff who could take on a
range of work, with a net loss of jobs overall.
NEA’s interviews with installers suggest that
contraction in the industry after the budget cut
was associated with a loss of 1,115 jobs in
installation firms. 82% of these were in
manual installation work, and the remainder in
surveying, management and administration.
For some employees work opportunities
became more transient, as quarterly budget
allocations were used up before the end of the
quarter, and temporary staff had to be laid off
and re-hired at intervals.
Other responses to the tighter market included
reductions in overtime and bonuses, shorter
working hours, reduced profit margins and, in
some cases, pay cuts. Some firms stepped up
their training in order to maintain efforts to
diversify, while more marginal companies had
to cut back on training. Nevertheless, over
time, the vast majority of installation firms
reported that HEES had allowed them to take
on and train more staff. Overall, 2000 people
14
EN E R G Y EF F I C I E N C Y A N D JO B S : UK I S S U E S A N D C A S E S T U D I E S
benefited from training as a result of HEES,
and the number of trained staff employed by
installers increased by 81% by 1996.
In the manufacturing sector, producers of
draught proofing materials were badly hit by
the budget cut, given the large percentage of
the market HEES represents. NEA interviews
with manufacturing companies suggested that
competition became very tight and profit
margins diminished. Some job losses and a
reduction in new product development were
reported, while many firms responded by
stepping up their sales and marketing
operations.
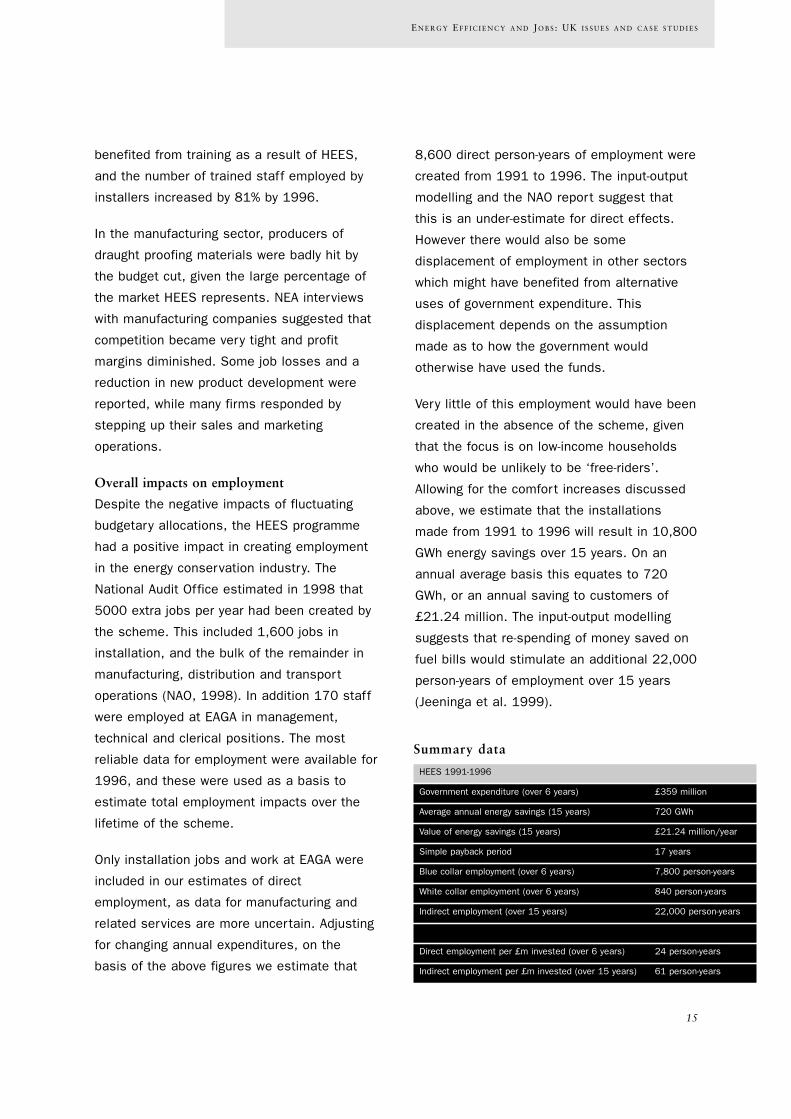
Overall impacts on employment
Despite the negative impacts of fluctuating
budgetary allocations, the HEES programme
had a positive impact in creating employment
in the energy conservation industry. The
National Audit Office estimated in 1998 that
5000 extra jobs per year had been created by
the scheme. This included 1,600 jobs in
installation, and the bulk of the remainder in
manufacturing, distribution and transport
operations (NAO, 1998). In addition 170 staff
were employed at EAGA in management,
technical and clerical positions. The most
reliable data for employment were available for
1996, and these were used as a basis to
estimate total employment impacts over the
lifetime of the scheme.
Only installation jobs and work at EAGA were
included in our estimates of direct
employment, as data for manufacturing and
related services are more uncertain. Adjusting
for changing annual expenditures, on the
basis of the above figures we estimate that
8,600 direct person-years of employment were
created from 1991 to 1996. The input-output
modelling and the NAO report suggest that
this is an under-estimate for direct effects.
However there would also be some
displacement of employment in other sectors
which might have benefited from alternative
uses of government expenditure. This
displacement depends on the assumption
made as to how the government would
otherwise have used the funds.
Very little of this employment would have been
created in the absence of the scheme, given
that the focus is on low-income households
who would be unlikely to be ‘free-riders’.
Allowing for the comfort increases discussed
above, we estimate that the installations
made from 1991 to 1996 will result in 10,800
GWh energy savings over 15 years. On an
annual average basis this equates to 720
GWh, or an annual saving to customers of
£21.24 million. The input-output modelling
suggests that re-spending of money saved on
fuel bills would stimulate an additional 22,000
person-years of employment over 15 years
(Jeeninga et al. 1999).
15
EN E R G Y EF F I C I E N C Y A N D JO B S : UK I S S U E S A N D C A S E S T U D I E S
Summary data
HEES 1991-1996
Government expenditure (over 6 years) £359 million
Average annual energy savings (15 years) 720 GWh
Value of energy savings (15 years) £21.24 million/year
Simple payback period 17 years
Blue collar employment (over 6 years) 7,800 person-years
White collar employment (over 6 years) 840 person-years
Indirect employment (over 15 years) 22,000 person-years
Direct employment per £m invested (over 6 years) 24 person-years
Indirect employment per £m invested (over 15 years) 61 person-years

H e a t w i s eHeatwise was a registered HEES installer, so
this case study serves as a more detailed
examination of the employment impacts of
one aspect of the HEES programme. However
it is atypical and is of particular interest, since
Heatwise operated as an ‘intermediate labour
market’ for people who had been in long-term
unemployment in Glasgow. The scheme has
been in operation since 1984, and this case
study focuses on activities in 1996.
Background
Heatwise started life as the Scottish
Neighbourhood Energy Action Glasgow Project,
a voluntary organisation established to tackle
the problem of cold, damp housing in
Glasgow’s housing estates. The project
secured funding from the then Glasgow
District Council (which owned about 160,000
homes) to hire key management staff and to
‘top up’ insulation grants so that tenants
would receive a free draught proofing and
insulation service, while at the same time,
work experience was provided for unemployed
people who were involved in installing these
measures. The project was initially developed
under the Manpower Services Commission’s
Community Programme, a temporary job
creation programme targeted at the long-term
unemployed. By the end of 1995, Heatwise
had draught proofed around 110,000 homes.
Heatwise expanded from its core activity of
home draught proofing and insulation, and in
1987 launched a Home Energy Advice Service,
advising householders on heating systems
operation, dealing with fuel debt, payment
methods, heat loss within the home and
appliance running costs.
In 1987, the Wise Group was created as a
holding company, with Heatwise as a wholly
owned subsidiary. In the same year, the
Heatwise model was adopted to create
Landwise, established to transform neglected
back courts into sustainable, functional
gardens and recreational areas. In 1991, two
new divisions of Landwise were established -
Treewise (to establish urban wooded areas in
some of Glasgow’s housing states) and Wise
Recycling (the sole collector of glass from
Glasgow’s bottle banks.) This case study
looks only at Heatwise (this being the only
part of the Wise Group that is geared towards
energy efficiency).
In the study period the majority of Heatwise’s
funding came from grants (approximately 80%
of the total), provided by the European Social
Fund, the local council, the Glasgow
Development Agency and from the Government
via their Home Energy Efficiency Scheme. 15%
of the income came from contracts (mostly for
the local council). Other financing came from
donations and from the local energy advice
centre.
A comparison between Heatwise’s funding in
1986 and 1996 shows that contract income
has doubled during this period, with the
organisation becoming less reliant on public
sector funding (although this still accounted
for the vast majority of the organisation’s
income). Surpluses, which were covenanted to
the holding company to support its wider
social objectives, averaged around £100,000
per annum over 1993-5.
16
EN E R G Y EF F I C I E N C Y A N D JO B S : UK I S S U E S A N D C A S E S T U D I E S

The Heatwise approach
All Wise Group companies shared common
goals, namely:
• To create an intermediate labour market, i.e.
to recruit and provide training and work
experience for unemployed people so they
can improve their own prospects by moving
into a job or further education;
• To provide good quality products and
services;
• To involve and work closely with their
customers (i.e. funding bodies, those
receiving products and services, trainee
workers, and employers or colleges that
recruit their people).
The Wise Group as a whole sought to achieve
its training and employment objectives by
providing a one-year programme for trainee
workers. It aimed to deal with the problem of
long-term unemployment by creating an
Intermediate Labour Market (ILM) that, with
the help of partnerships, combined training,
work experience and personal development.
The function of the ILM was to:
• Give the long-term unemployed a period of
employment in their own right;
• Keep them in contact with the habits of
work;
• Improve their skills to keep them closer to
the labour market;
• Prevent them from dropping into the
category of being unemployable (Wise Group,
1994).
In addition to the common goals of the Wise
Group, Heatwise had the specific objective of
making houses warm, and the organisation
aimed to make an economic and social impact
as well as an environmental impact. Most of
the organisation’s activities were directed
towards housing estates with minimum
standards in insulation levels and other
problems of poor housing. Thus, low-income
households could benefit from increased
comfort and/or reduced weekly fuel bills.
The Heatwise business policy was based on
three approaches in the fields of energy
saving, training and work experience:
• The traditional energy-saving approach via
installation of insulation measures;
• The service-oriented advice and auditing
approach via consulting and surveying;
• The promotion approach via spreading
information, education and exchange of
know-how.
The Group’s arrangement for transitional
workers was a weekly 3:1:1 ratio for work
experience, training and personal
development. The maximum duration of
employment at the Wise Group was 52 weeks.
Jobs were advertised, and each applicant
went through a recruitment interview. Personal
development was given a prominent place in
the Wise Group concept, and each transitional
worker had a supervisor who was responsible
for progress in this area (giving, for example,
help with interview techniques, application
forms and drawing up CV’s).
After an 8-week induction period, during which
trainees were paid an amount equal to their
benefits plus an additional £10, the workers
were paid £3.60 an hour for the remaining 44
weeks of their contract. During the year,
trainees received on and off-site training,
working towards nationally recognised
qualifications, and work experience which was
17
EN E R G Y EF F I C I E N C Y A N D JO B S : UK I S S U E S A N D C A S E S T U D I E S

geared to improving their future prospects in
the labour market. Heatwise trainee workers
had access to over 30 nationally accredited
training courses.
In 1996, 40% of trainees had been
unemployed for more than 2 years prior to
joining the scheme. 57% of trainees who left
the Wise Group succeeded in finding a job in
the mainstream labour market, or departed to
further education (this rose to 62% in 1997).
This is significantly higher than the results
under Training for Work (the main government
scheme for the long-term unemployed, prior to
‘New Deal’, which was launched in April
1998).
Achievements
• Draught proofing and loft insulation have
been the core business of Heatwise since
the organisation began. A total of 110,000
houses were insulated (with draught
proofing, loft insulation, pipes and tank
jackets) between 1983 and 1997.
Additional measures were carried out on
certain projects, such as external cladding
of 582 units. An external cladding team was
created, operating as a contractor to
Heatwise, with ten full-time trainees. Energy
efficiency measures were also carried out
as part of the HEES scheme.
• Energy advice and auditing is an increasingly
important area of Heatwise activity. Free
energy advice and an information package
are available.
• Promotion of energy saving awareness and
dissemination activities. Energy education
in schools is a relatively new activity for
Heatwise. In partnership with the then
Scottish Office Environmental Department,
Heatwise developed in-service training for
teachers and pupils. In addition, Heatwise
runs a ‘Young Technologist’ challenge for
primary schools each year. It is a science
and technology based challenge with a
strong emphasis on energy and the
environment.
• Introduction of home security measures. In
the early 1990s, Heatwise began to offer a
number of security measures along with the
energy efficiency measures. These are
targeted at vulnerable groups, with
measures including the fitting of deaf alerts
and specially coated handrails in a small
number of households with elderly and
physically disabled inhabitants. This new
element has broadened training
opportunities, for example in customer
advice.
In 1996, the following work was carried out:
• 186 dwellings externally clad
• 2,347 houses draught proofed
• 37 lofts insulated
• 2,893 new energy advice visits
Training and employment impacts
In 1996 the majority of jobs created in this
programme were in the installation and project
administration sectors, with a minority in the
manufacturing sector. Table 3 shows how the
permanent staff at Heatwise were split
18
EN E R G Y EF F I C I E N C Y A N D JO B S : UK I S S U E S A N D C A S E S T U D I E S
Category of employment Average wage Staff employed
Managers £22,200 10
Technicians £16,100 22
Other white collar/non manual £11,800 27
Skilled blue collar £12,500 20
Semi skilled blue collar £10,400 2
Unskilled £5,800 3
Table 3. Permanent staff employed by Heatwise

between employment categories. The trainees
themselves predominantly went on to be
skilled blue collar workers, involved in
installation and advice provision. A few went
on to white collar jobs in project
administration.
The number of permanent staff employed by
Heatwise averaged 84 people over the period
1995 to 1997. Around half of these had
previously been Heatwise trainees, and prior
to this had been unemployed. Over the same
period an average of 194 new trainees were
employed by Heatwise per year.
The majority of the trainees had been
unemployed long-term and were unskilled.
Around 60% of trainees gained a National
Vocational Qualification (NVQ) before they left
the scheme, although for around half of these
only the basic NVQ Level 1 was obtained
(McGregor et al, 1997). Exact figures on the
number of people trained since Heatwise
began are not recorded, but it is estimated to
be well in excess of 2000 people. It is
estimated that around half of these have gone
on to secure permanent employment.
Just under half of the trainees completed the
training and work experience. Over 40% of
those leaving did so to take up employment
opportunities. 10% left early due to feelings of
dissatisfaction. Two-thirds had found a job at
some point after leaving Heatwise. For the
Wise Group as a whole, 41% continued to be
employed full time 6 months after leaving
Heatwise, with 5% employed part-time. 4%
were in education or training, with 44%
unemployed. The remainder were unable to
work. (McGregor et al, 1997). The relatively
high proportion of those completing their 52
weeks can probably be attributed to the
financial benefits paid to trainees (relative to
other training programmes). Research showed
that only 14% of trainees were no better off
while being trained by Heatwise, with the
remainder being better off (26% by £50 or
more per week).
The highest proportion of those finding work
were those that stayed with the Wise Group
for longer than 12 weeks. Most encouragingly,
the Wise Group placed almost as high a
percentage of the formerly long-term
unemployed into employment as shorter-term
unemployed recruits.
Research has identified a range of positive
impacts on the quality of employment:
• The quality of jobs found improved with time
after completing the Wise Group
programme;
• Pay also improved for those changing jobs;
• Generally, take-home pay and income gains
compared to unemployment were
reasonable.
Two manufacturing companies which supply
materials to Heatwise were asked about the
employment effects of the scheme. They
reported that it was a very small part of their
turnover and the employment impacts were
negligible.
Due to comfort increases, energy savings
were considered too small in relation to the
cost of the programme to create significant
indirect employment through the re-spending
of money saved on energy bills.
19
EN E R G Y EF F I C I E N C Y A N D JO B S : UK I S S U E S A N D C A S E S T U D I E S

Economic impact on households and
neighbourhoods
Heatwise’s services were delivered mainly in
Glasgow’s large peripheral housing estates
where problems of unemployment and housing
decay are greatest. Research conducted in
1997 found that the vast majority of
householders receiving energy efficiency
measures from Heatwise relied on benefits for
their main source of income. Only 20% of
those in homes surveyed were in employment.
By improving the energy efficiency of homes,
Heatwise manages to increase the comfort
levels of the householders as well as reducing
fuel bills, and thus increases the
householders’ purchasing power. Of those who
had insulation installed, 68% reported savings
of up to £5 per week, with 12% reporting
savings of £5-£10 and 4% of £10 or over.
Where the whole house had been refurbished,
savings were higher, with 16% reporting
savings of £10 or over. The average amounted
to £7.10 per week for refurbished homes, and
£4.94 for houses which were insulated
(McGregor et al, 1997).
The work provided by Heatwise, in addition to
other local environmental improvements
provided by other sectors of the Wise Group,
can also increase household stability by
making the area more attractive to people who
might otherwise leave. 44% of those whose
dwellings had been insulated by Heatwise
reported that they were more prepared to stay
in their home as a consequence of the work
being carried out.
Results
A total of 278 person-years of employment
were directly generated in one year of
Heatwise’s operations. These were all in
installation or administration, with less than
0.1 person year being created in the
manufacturing sector. Input-output modelling
suggests that the net employment gain would
be positive but small for two reasons. Firstly,
the programme is grant funded and therefore
one should subtract the jobs which might have
been created in another sector using the
same funds. This will depend on the labour
intensity in the reference scenario. Secondly,
the energy savings are small and therefore
there is not a large re-spending effect.
However, it is the type, location and training
benefits afforded by the work which are of
interest here. Perhaps most significantly,
research has shown that around 50% of
trainees were still in employment 6 months
after leaving Heatwise. It is therefore possible
that the total employment creation from the
project is much larger, but it is impossible to
make any accurate estimate of the total
figure.
In addition, for the measures installed by the
company in 1996, it is estimated that a total
of 25 GWh of energy will be saved over 15
years. This takes account of the assumption
that energy savings in low-income households
will typically be 50% lower than the potential,
since increased comfort rather than cash
savings are likely to be the priority. In terms of
cost effectiveness the energy savings do not
appear attractive, as the payback period is
very long. However this is to be expected
since the programme has such a strong
training element, and targets the fuel poor.
20
EN E R G Y EF F I C I E N C Y A N D JO B S : UK I S S U E S A N D C A S E S T U D I E S

Heatwise’s approach to the problem of
unemployment and cold houses has been
extensively evaluated and it is generally
agreed that the organisation has been very
successful in achieving its two main objectives
of moving long-term unemployed people into
sustainable employment and improving the
energy efficiency of low-income households, to
both increase comfort levels and reduce fuel
bills.
Evidence for the success is found not only in
the statistics of jobs created and services
provided, but also in the continued and
growing support the organisation receives in
Glasgow and in the extension of the model to
other areas. In addition, the model has proved
to be replicable, with similar programmes
being set up in London.
The Wise Group is currently regarded as a
model for the creation of local ILMs in the UK.
Research conducted by the European Academy
of the Urban Environment (1997) identified the
following characteristics as important lessons
to be learned from the Wise experience:
• Networking and partnership building are the
most important elements in the Wise Group
approach, as no single funder could sustain
the entire costs.
• Diversification is an important strategy - this
not only offers new services to clients, but
the trainees also comes into contact with a
wider spectrum of transferable skills.
• The Heatwise model, like all parts of the
Wise Group, can be easily transferred to
other areas; franchising has taken place in,
for example, Newham, East London.
• The Wise model is based on the assumption
that payment at the rate for normal
industrial wages values the work of the
transitional workers and increases their
commitment to the training programme.
(86% of trainees are better off during their
training than they were prior to it).
21
EN E R G Y EF F I C I E N C Y A N D JO B S : UK I S S U E S A N D C A S E S T U D I E S
Summary data
Heatwise 1996
Expenditure £4.8 million
Average annual energy savings (15 years) 1.7 GWh
Value of annual energy savings (15 years) £82,000
Simple payback period >50 years
Blue collar employment (1 year) 194 person-years
White collar employment (1 year) 86 person-years
Average annual indirect employment (over 15 years) Negligible
Direct employment per £m invested 58 person-years

S t a n d a r d s o f P e r f o r m a n c e
( S o P I )After privatisation of the GB electricity industry
in 1990 the electricity regulator was given a
range of duties, including the promotion of
energy efficiency. From 1994 in England and
Wales, and 1995 in Scotland, the 14 Public
Electricity Suppliers (PESs) were given an
energy saving target to be achieved through
the installation of energy saving measures by
customers. The cost of financing these
activities was covered by an annual amount
equivalent to £1 per domestic or small
business electricity user. The scheme was
implemented by the Energy Saving Trust on
behalf of the PESs.
Under Standards of per formance (SoP) Phases
1 and 2 (1994-98 and 1998-2000) £150
million was raised from customers, and used
to subsidise a range of insulation, heating,
lighting and appliance initiatives which save
energy and money, primarily for low-income
households. The third phase of SoP from April
2000 to April 2002, extends the programme
to gas suppliers, and raises the contribution
to a nominal £1.20 per customer per fuel (gas
and electricity) annually. Over £100 million will
be invested by energy suppliers in energy
efficiency over the 2 years. This case study
focuses on the employment impacts of the
first phase of SoP, from 1994 to 1998.
The initial phases of SoP were restricted to
electricity consumers, as the gas regulator did
not consider that it was within her powers to
introduce such a levy. Therefore the energy
efficiency measures only extended to houses
heated by electricity, and to electrical
appliances. Only 8% of the UK homes were
therefore eligible for insulation measures, and
within this category priority was given to low
income families in receipt of certain social
security benefits. During SoP1 (1994-98) over
7 million measures were installed, such as
efficient lighting, cavity wall and loft
insulation, double glazing, heating upgrades
and efficient appliances such as fridges and
kettles. For the purposes of this study only the
following heating and insulation measures
were considered:
• Cavity wall, floor and loft insulation
• Draught proofing
• Tank and water pipe lagging
• Efficient boilers
• Heating controls
• Double glazing
One of the largest schemes under SoP1
involved the replacement of old inefficient
fridges. The employment impacts of the
Fridgesavers programme is studied in more
detail in the next case study.
Data on the labour required to fulfil the SoP
obligations were collected from 2 PESs and
from the manufacturers and installers
involved. The management, monitoring and
marketing work carried out by the EST was
also included. These data were then used to
estimate the national employment impacts for
the entire scheme, implemented by 14 PESs.
Local authorities and housing associations
also had to dedicate time managing the
scheme for their tenants. Approximately 81
person-years of employment was involved per
year in this sector. However this work was not
included in the employment estimates since
no additional financing was available for this
purpose and therefore time and financial
22
EN E R G Y EF F I C I E N C Y A N D JO B S : UK I S S U E S A N D C A S E S T U D I E S

resources were assumed to have been
diverted from other tasks.
Installation jobs
In social housing bulk contracts for a large
number of houses allow economies of scale
which reduce the labour input per installation.
The labour inputs per installation in social
housing and owner occupied premises, as
estimated by installers, are presented in
Table 4.
Measure Person days labour required
(installers’ estimates)
Owner occupied Social housing
Cavity wall insulation 0.75 0.44
Loft insulation 0.36 0.22
Draught proofing1 0.33 - 0.5 0.33 - 0.5
Tank and pipe lagging1 0.13 - 0.4 0.13 - 0.2
Heating systems 1 1
Heating controls 1 1
Double glazing 4 4
Floor insulation 1 1
Table 4. Labour in installation of energy efficiency measuresunder SoP 1.
1. The lower figure is for work carried out as a secondary measure
by installers contracted for insulation work in the same property.
These estimates, and records of total
installations completed under SoP1, were
used to estimate person-years of employment
in installation firms under the scheme. It is
estimated that the equivalent of 184 full time
jobs in installation firms were created for each
year of the scheme. These were predominantly
in semi-skilled or skilled manual work.
There was some evidence that installation
firms had taken on additional manual workers
to cope with the increased work load, and in
several cases these were known to be
previously unemployed persons. However there
was some criticism from smaller firms who felt
that they had actually lost business because
they were not in a position to compete for the
irregular, large contracts from PESs. Some
customers who would have had the work done
using a small local firm were lost to larger
competitors who could offer subsidised rates
under the SoP scheme. Nonetheless a large
number of firms across the country benefited
from the increased work, and the number of
‘free-riders’ (who would have had the work
done without the subsidies) is not likely to
have been large given that the scheme
predominantly assists households in receipt of
social security benefits, mostly living in social
housing.
Jobs in manufacturing
Manufacturers of insulation materials, heaters
and heating controls were asked about the
likely employment impacts of the increased
demand for their products stimulated by SoP.
The response was that, due to over-capacity in
the industries at the time, the impact would
be negligible. One manufacturer estimated
that a programme 20 times larger, in which all
materials were produced in the UK, would be
necessary for there to be a significant impact
on their labour requirement. While one could
argue that the additional demand could have
prevented some job losses in manufacturing
industry, it was considered appropriate to
conclude that there were no job gains in this
sector.
Employment in the PESs and EST
A further 205 jobs were supported each year
in white collar occupations related to
management, marketing, advice, monitoring
and consultancy roles in the PESs. This
23
EN E R G Y EF F I C I E N C Y A N D JO B S : UK I S S U E S A N D C A S E S T U D I E S

estimate was derived from interviews with two
representative PESs, and scaled up to a
national total. In addition the EST employed
the equivalent of 5 full time employees in work
related to the SoP scheme. Thus a total of
210 white collar jobs were estimated to have
been created for the duration of the scheme.
The business as usual case
Without the financial savings arising from the
energy efficiency measures the households
concerned would spend less on all forms of
consumption including energy. When energy
efficiency is improved in low income houses a
proportion of the potential energy savings is
lost as families can now afford to heat their
homes to a more comfortable temperature.
These adjustments are taken into account.
Since there was a requirement to design
schemes so as to minimise free-ridership,
added to the fact that over half the
expenditure targeted low income families, it is
likely that the energy savings and employment
generation under SoP are genuinely additional
to those which would have arisen in a
business as usual case.
Indirect employment effects
The levy on consumers reduces their
consumption expenditure by £1. However the
energy savings greatly outweigh this cost,
resulting in a stimulus to consumer
expenditure. For every £1 spent by the PESs
the EST estimates that lifetime energy bills
were reduced by around £4. The shift in
expenditure from energy, which is a relatively
low labour-intensity sector, to other sectors
stimulates employment in the economy. For an
initial outlay of £138 million (PES plus
householder expenditure) on measures it was
estimated that householders will make
cumulative savings through reduced fuel bills
of £400 million over 15 years (EST estimate,
discounted at 8% per annum). The
employment impact of the resulting net
increase in consumer expenditure was
estimated to be 12,000 additional person-
years over 15 years, or an average of 800
jobs per year (Jeeninga et al. 1999).
Furthermore, since the programme is not
funded by public sector grants, one does not
have to consider displacement of jobs which
might have been created by alternative uses
of the funds.
24
EN E R G Y EF F I C I E N C Y A N D JO B S : UK I S S U E S A N D C A S E S T U D I E S
Summary data
Standards of performance 1994 to 1998
Total PES expenditure over 4 years1 £96 million
Additional private expenditure over 4 years £42 million
Average annual energy savings (15 years)2 840 GWh
Value of annual energy savings (15 years)2 £42 million
Simple payback period 3.5 years
Blue collar employment (over 4 years) 736 person-years
White collar employment (over 4 years) 840 person-years
Average annual indirect employment (over 15 years) 12,000 person-years
Direct employment per £m invested (over 4 years) 11.4 person-years
Indirect employment per £m invested (over 15 years) 87 person-years
1 An additional £5 million has been invested by PESs in other energy efficiency
projects which do not count towards there SoP targets.
2 Data refers to discounted EST estimates which include all measures implemented
under SoP whereas the employment data relate only to the measures discussed in
the text.

F r i d g e s a v e r sFridgesavers was a scheme funded under the
Standards of Per formance (SoP) programme in
which new refrigerators were supplied to low-
income families at a charge of £25. This case
study is provided as a detailed investigation of
one aspect of the SoP programme, and
considers only the period August 1997 to
March 1998.
The refrigerators supplied were C-rated, which
means they are considerably more efficient
than those replaced, but not as efficient as A
or B rated appliances (which were available,
but were usually considerably more
expensive). The EST estimates that recipients
saved around £30 per year on their electricity
bills, and therefore recovered their personal
contribution in less than a year, and will save
more than £400 over the product’s lifetime.
There are additional health and financial
savings due to reduced food spoilage caused
by ineffective cooling in old refrigerators. The
old refrigerators were removed free of charge,
and disposed of safely to prevent release of
CFCs, re-sale or export to developing
countries.
To qualify for the replacements the recipient
had to be claiming social security benefits,
and have an existing refrigerator with an ice
box which was in poor condition. The
refrigerators supplied were manufactured by
Whirlpool or BEKO, and retailed for around
£120. The scheme was administered and
monitored by Lothian and Edinburgh
Environmental Partnership (LEEP) on behalf of
the EST and the PESs.
Data on employment were collected through
interviews with LEEP, BEKO and Whirlpool and
the delivery companies. Energy saving data
were supplied by LEEP, who calculated that
the old refrigerators consumed 645 kWh per
annum on average, compared to 184 kWh per
annum for their replacements. In total 50,000
refrigerators were replaced in the time frame
considered by this study.
Jobs in manufacturing
The manufacture of 50,000 refrigerators
requires approximately 40 person-years of
labour. The factories concerned, in Turkey and
Italy, reported that this was a small
percentage of their output, and did not cause
any direct increase in their workforce.
Nonetheless it represents additional demand
and should be recorded. There does not
appear to be any evidence that more efficient
refrigerators require greater labour input than
less efficient models.
Jobs in deliveries
The delivery jobs required a driving license,
but were otherwise unskilled and employed
mostly men. Work was carried out by three
companies: Expert Logistics, a private
company part of the Iceland group (which
undertook the bulk of the deliveries);
Shaftesbury Resources, which normally
delivers free second-hand furniture to low
income families in London; and LEEP was
responsible for deliveries in southern
Scotland.
Expert Logistics estimated that 15 person-
years of employment were generated in their
delivery operations, which accounted for 90%
of the total deliveries. LEEP and Shaftesbury
Resources created some work experience for
25
EN E R G Y EF F I C I E N C Y A N D JO B S : UK I S S U E S A N D C A S E S T U D I E S

previously unemployed persons, totalling
approximately 3 person-years.
Jobs in administration
Expert Logistics employed 4 people to manage
delivery operations. LEEP employed 6 people
specifically for the management of this
programme. In contrast with the delivery
operations, employees in administration were
predominantly women. In total 7 person-years
of employment were created in this category,
as not all posts were maintained for a full
year.
Expenditure and energy savings
The total cost of the scheme was £6.36m,
including £1.25m from householders. The
remainder was funded by a levy on all
domestic and small business electricity
consumers. The total energy saved over 11
years was estimated to be 230.5 GWh with a
value of £12.5m. This is net of a business as
usual case which assumes that some of the
recipients would have replaced their
refrigerators with new or second hand models
over the period.
Indirect employment
Jeeninga et al. (1999) estimated that the net
increase in consumer spending (re-spending of
the money saved on energy bill less the £1
levy on all households) would stimulate a
further 475 person-years of employment over
15 years. This equates to almost 32
additional jobs. As with the SoP programme
overall, one does not have to consider
displacement of jobs which might have been
created by alternative uses of government
funds.
26
EN E R G Y EF F I C I E N C Y A N D JO B S : UK I S S U E S A N D C A S E S T U D I E S
Summary data
Fridgesavers 1997-8
PES expenditure £5.1 million
Additional private expenditure £1.25 million
Average annual energy savings (11 years) 20.9 GWh
Value of annual energy savings (11 years) £1.14 million
Simple payback period 6 years
Blue collar employment 58 person-years
White collar employment 7 person-years
Average annual indirect employment (15 years) 475 person-years
Direct employment per £m invested 10.2 person-years
Indirect employment per £m invested (15 years) 75 person-years
M a n w e b D e m a n d s i d e
m a n a g e m e n t s c h e m eThe Manweb demand side management (DSM)
project was designed to evaluate the principles
and techniques necessary to introduce a major
DSM programme. It aimed to reduce peak
demand for electricity in Holyhead on Holy
Island, just off the West coast of the Island of
Anglesey in North Wales. At the time, Holyhead
was an economically depressed town,
comprising mostly low-income households
(3496 homes in all), small businesses and a
number of major industrial loads. The largest
single load on the island was a school,
followed by the port and 3 or 4 other industrial
sites. The project was an alternative to a major
investment programme in electricity distribution
that would otherwise have been required to
cope with increasing electricity demand in the
area.
The project was partly funded under the
European Commission’s SAVE programme, the
rest of the finance coming from Manweb itself.
Market research commenced in 1992, and
implementation of measures began in 1993
and lasted for approximately one year.
Measures included compact fluorescent lamps,
insulation, lighting refurbishment for industrial
and small business premises and audits
followed by individual energy saving
programmes for industrial organisations. The
measures were either free or heavily
subsidised.
The measurements in this study are made in
kilovolt-amperes (kVA) rather than kilowatt
hours (kWh) as the aim was peak load
reduction rather than energy savings. The
project achieved its aim of reducing the peak
demand by 808 kVA (of which 346 kVA was
load growth) and further investment in plant
was deemed unnecessary. The majority of
energy savings in the project were achieved in
the industrial sector (57%) followed by the
domestic (30%) and small business sectors
(13%).
Achievements
The scheme was closely monitored in terms of
energy savings from the start, as it was such
an innovative programme. Marketing was
carried out before implementation, based
mainly on experience in the USA, to discover
the best methods to achieve maximum
penetration. A survey of 600 domestic
customers was undertaken to establish base
data on penetration of energy efficiency
measures, the age and condition of the
appliance stock and an audit of lighting use
was carried out. Marketing was mainly by
direct mailings, but also through local radio, TV
and newspapers, and local schools. Post
project research was also carried out to see
the how much energy was being saved and
whether advice and installed measures were
still being used.
Measures implemented as part of the study
included, for the residential sector:
• the offer of two compact fluorescent lamps
(CFLs) for each household, installed in their
home, at a price of £0.75 each compared
with the normal retail price of £10.60;
• the offer, for electrically heated households,
of loft insulation and draught proofing at a
price of £30.90 compared with an average
price of £160;
• free hot-water tank insulation for households
using electric heating; and
27
EN E R G Y EF F I C I E N C Y A N D JO B S : UK I S S U E S A N D C A S E S T U D I E S

• rebates of up to £50 on energy efficient
appliances.
For the small business sector, measures
offered were:
• a free insulation jacket for each hot water
cylinder;
• two CFLs at £0.75 each; and
• a free lighting audit.
Customers in the larger industrial/commercial
sector were offered:
• a free energy audit;
• subsidies on energy saving measures; and
• subsidies on power-factor correction
equipment.
Both the subsidies in the industrial/
commercial sector were offered so as to
provide a 12-month payback on the
customer’s investment.
A 10% reduction in maximum daily demand
was achieved of which 30% was from the
residential sector, 13% from the small
business sector and 57% from the
industrial/commercial sector. The reduction
measured at the distribution transformers was
374 kVA, with a further 88 kVA achieved after
the end of the project with late
implementation by one industrial consumer.
Several new developments in the area led to
increased load growth during the time scale of
the project – these comprise:
• expansion of the port (256 kVA)
• new motive power at an industrial site (30
kVA)
• increase in ownership of domestic
appliances (40 kVA)
• expansion of the housing stock (20 kVA)
The net reduction from the implemented
measures is therefore the measured decrease
(374 kVA) plus the load growth (346 kVA).
Including the 88 kVA implemented after the
project, the total reduction was 808 kVA.
In the residential market the penetration of
the CFLs reached 79%, leading to savings of
88 kVA. Water cylinder insulation saved 47
kVA with a penetration rate of 84%. Draught
proofing and loft insulation were less well
taken up with penetration rates of 20% and
30% respectively. All the insulation measures
will, however, be sustained, whereas the
return of CFLs to higher prices means that
many of these will not be replaced (53% were
sustained according to Manweb). The uptake
of the subsidised energy efficient appliances
was estimated to be negligible.
The small business market was less ready to
take up measures on offer. CFLs reached only
24% penetration and water cylinders 17%. A
small number of businesses (6%) undertook
lighting refurbishment programmes resulting in
a saving of 92 kVA (compared to 4.8 and 7.4
kVA for water cylinders and CFLs respectively).
In the industrial sector there were fewer
potential consumers to involve, but those that
took up the offers saved significant amounts
of electricity, accounting for 57% of the total
saved by PowerSAVE. 60% of the peak
demand was saved by just 4 sites using power
factor correction. In total this sector saved
282 kVA from power factor correction, 125
kVA through lighting programmes and 55 kVA
from other measures.
28
EN E R G Y EF F I C I E N C Y A N D JO B S : UK I S S U E S A N D C A S E S T U D I E S

The average cost per kVA saved was as
follows:
• residential sector, £512;
• small businesses, £507;
• larger industrial consumers, £126.
This suggests efforts in similar schemes
should be concentrated on the larger industrial
customers in the future. The figure is
somewhat distorted by the high level of
subsidy of the CFLs. The power factor
corrections proved to be particularly effective,
and although no kWh savings result, it is still
useful to Manweb for reducing peak demand
and avoiding investment in new supply
capacity.
The programme was considered a success in
that it achieved its aim of avoiding investment
in further plant, by saving 10% in peak
demand. It did this within a smaller range of
measures than anticipated, as appliance
rebates and the small business sector proved
to be more difficult to involve than expected.
Employment impacts
The total employment impact was small, as
one might expect in a project with a total cost
of less than £250,000. The following work
was identified:
• A full time project manager was seconded
from Manweb to oversee the activities in
Holyhead, for one year;
• During the period of the project a dedicated
mobile unit and a Manweb shop were used
for sales and marketing. This employed 2
people for one year, involved in giving
advice and advising customers on how to
take up the measures that had been
offered;
• NEA (National Energy Action) was
responsible for draught proofing and
insulation of lofts in the domestic sector. A
total of 90 homes were draught-proofed
and 63 homes had loft insulation installed.
As NEA could not provide specific details
about who carried out the work or how long
it took, using average figures for such
work, a total of 67 person days work was
created - a little over 1/4 of a person year;
• A specialist lighting contractor worked
directly for Manweb providing lighting
installations and energy audits. At peak
times they utilised a team of four engineers
to carry out installation work;
• The Prince’s Trust is a national organisation
that offers young disadvantaged and
unemployed people an opportunity to gain
valuable work experience. The group was
used for distributing the light bulbs.
Although no paid jobs resulted from their
involvement, the group improved their
employability by being involved in the
project;
• Industrial customers were offered free
audits. The initial walk-around survey was
undertaken by Manweb staff and took an
average of 1 hour. If the customer was
interested in going further, experts were
brought in who carried out a 1/2 day
survey.
There will have been little or no manufacturing
employment generated by this level of
investment. No attempt was made to
investigate this further as the effect would
have been impossible to separate from overall
trends in manufacturing employment.
29
EN E R G Y EF F I C I E N C Y A N D JO B S : UK I S S U E S A N D C A S E S T U D I E S

In the business as usual case work would
have been created in strengthening the
distribution network. However the project only
delayed this work for up to 10 years, rather
than making it unnecessary altogether.
Summary data
Manweb DSM scheme 1993
Total expenditure £243,000
Total energy saved 808 kVA
New employment 5 person-years (approx.)
Direct employment per £m invested 20.6 person-years
30
EN E R G Y EF F I C I E N C Y A N D JO B S : UK I S S U E S A N D C A S E S T U D I E S

S h e t l a n d I n t e g r a t e d
R e s o u r c e P l a n n i n gIn common with the Manweb scheme, this
small, island based DSM initiative created a
small, but significant amount of new
employment.
The Scottish Hydro-Electric (HE) ‘Island
Incubator’ initiative was a joint project
between Shetland and Madeira, funded by the
EU’s SAVE programme. Its objective was to
test the theory that new ideas can be
developed on islands, where they have a rapid
impact, before trying them out on a larger
scale. In practice, the unique circumstances of
the Shetland Islands mean that some of the
measures which were cost-effective on the
islands may not be cost effective elsewhere.
The project examined complementary aspects
of supply and demand-side planning. A number
of scenarios were constructed to look at the
influence of different supply and demand
situations and new products and services that
could be offered.
Shetland differs from the rest of the UK in
that domestic sector demand accounts for
60% of total electricity consumption,
compared to 35% in the UK as a whole. Due
to the severely cold climate there is a
significant demand for space heating in all
sectors. Off-peak all-electric tariffs were
popular because the price of electricity in
Shetland was regulated in line with the
mainland, and the low capital cost of electric
heating installations made it an attractive
option compared to the local price of other
energy options (imported fuel oil, solid fuel
and bottled gas - there was no mains gas
supply). Demand for electricity was growing,
due to around 100 new homes being built
each year and buoyancy in the local economy.
Electricity generation costs in Shetland were
high because of the diseconomies of scale,
and distribution costs were also high because
of the extreme climate and one of the lowest
population densities in Europe. Given the
unified, regulated tariffs for electricity,
Shetland was not a profitable market for HE.
Growing annual demand led to a need for new
(uneconomic) investment in generating plant.
By containing this growth, such extra
investments could be deferred or avoided.
In the summer of 1993 it was agreed that
action needed to be taken by HE to manage
the growth in demand upon the Lerwick
(Shetland Islands) power station. In addition,
the shape of the daily load curve resulted in
high cost generation in terms of fuel and
maintenance, and this also needed to be
addressed. A number of initiatives were
introduced in 1994 aimed at managing
electricity consumption.
Achievements
1. The appointment of an energy manager at
Shetland Islands Council, part financed by
HE.
As part of the overall programme, HE part-
sponsored a new ‘Energy Manager’ post at the
Shetland Islands Council, for a period of three
years. The engineer appointed to this post
was responsible for energy management
throughout all Shetland Islands Council
properties. It was originally anticipated that
the sponsorship would be for one job, for
three years. In fact, two appointments were
31
EN E R G Y EF F I C I E N C Y A N D JO B S : UK I S S U E S A N D C A S E S T U D I E S

made - an energy manager and an energy
officer. 1/3 of the funding required was
supplied by Scottish Hydro-Electric, 1/3 by the
European Commission, and 1/3 by the
Council.
The bulk of work carried out between 1994
and 1997 was in education properties.
Measures included boiler lagging, boiler
controls, installation of thermostatic radiator
valves, draught-proofing, ceiling insulation and
installation of energy efficient lighting. Similar
works were undertaken in other council
properties.
The estimated energy savings resulting from
the energy unit’s activities over 3 years is:
1. 25 GWh per annum for 10 years.
2. The ‘SaveElectric’ programme: a domestic
sector scheme involving audits and
installations.
This initiative was designed as a
demonstration project, to show how electricity
bills could be reduced through investment in
energy efficiency. 403 selected HE customers,
all of whom were on electric storage heating
tariffs, were mailed with information on energy
efficiency measures. Consumption in these
households varied between 30,000 and
100,000 kWh per year.
Householders were invited to take part by
applying for a home energy audit. Shetland
Environmental Agency (SEA) conducted these
audits at a subsidised charge to the
householder of £20 per audit (compared to
the normal price of £80). (The fee was to
dissuade those householders who had no
serious interest in making improvements from
taking part in the programme.) In addition,
financial assistance of up to £300 (or 50% of
the total cost) was offered to implement the
recommendations. A 25% response rate was
achieved. A telephone survey undertaken on a
small sample of householders indicated this
could be further increased to 40% through
follow up telephone calls.
The National Home Energy Rating (NHER)
scheme was used for individual energy audits.
SEA is registered to undertake NHER surveys,
which are accepted throughout the UK. Energy
cost saving options were predicted based on
the NHER model and costs were based on the
charges of Shetland Heatwise, the main
contractor for other energy saving works.
The energy savings resulting from this aspect
of the scheme amount to 0.5 GWh per annum.
However, it was estimated that under a
business as usual case 20% of the initiatives
would have been taken anyway, and therefore
the estimate was reduced to 0.4 GWh per
annum for 15 years.
3. Installation of teleswitches (designed to
reduce peak load, but in fact also resulting
in reduced energy consumption).
Of the electricity consumed in Shetland, a
large proportion was used for space and water
heating in the domestic and commercial
sectors. Over the preceding 20 years, HE
offered various tariffs designed to promote
the use of electric storage heating. Electricity
is available at two rates; normal rate for 16
hours each day, and cheap rate for the
remaining 8 hours during the night. Scottish
32
EN E R G Y EF F I C I E N C Y A N D JO B S : UK I S S U E S A N D C A S E S T U D I E S

HE was required by UK industry regulation to
operate uniform electricity tariffs throughout
the north of Scotland. Under the monopoly
arrangements which were in place at the time,
Public Electricity Suppliers (PESs) were not
allowed to develop particular tariffs to suit the
special circumstances of a particular area.
Until recently, all HE customers in Shetland on
the older storage heating tariffs received an 8-
hour charge of cheap rate electricity between
approximately midnight and 8 am. The heaters
and domestic hot water tank were fully
charged at 8 am each morning and receive no
further charge until midnight. The popularity of
electric storage heating in Shetland had given
rise to a daily demand profile on the electricity
network which showed a pronounced peak
each night at approximately 1 am during the
winter heating season. This was as a result of
the aggregate demand of all the storage
heaters. By changing the switching
arrangements, the coincident aggregate peak
demand could be reduced and managed whilst
also improving the quality of service.
Of the 9,100 domestic customers in Shetland,
4,000 were on old storage heating tariffs (now
superseded and no longer available to new
customers). In early 1994, these customers
had their installations modified and a
teleswitch installed so that the times they
received low rate electricity for heating were
spread throughout the day. The on/off signals
are sent out by BBC Radio 4, on a frequency
dedicated to Shetland, with local control from
Lerwick Power Station. In the event of a
problem on the network or in the power
station, electric heating load could be
interrupted for short periods in order to shed
load and so avoid complete disconnection of
customers. By shedding load, the idea is to
give the power station time to start up an
extra generator to compensate for the
emergency, before re-switching the heating
load once full supply is reinstated.
The teleswitching scheme was purely intended
to reduce peak load, and was not aimed at
energy savings as such. As expected, the new
heating regime had a major impact upon the
load on the power station, with a much flatter
demand curve produced. However, the billing
analysis also indicates a reduction in energy
use of up to 15%, due to the heat being
supplied throughout the day in four periods,
resulting in heat always being available when
needed and a lower heat differential, resulting
in lower heat losses and lower heat inputs. In
addition, the new arrangement allowed
customers to change the heat input depending
on the weather conditions.
As a result, the average domestic customer
used 4,521 kWh each month between Jan and
June 1994, compared to 5,210 kWh the
previous year. It is estimated that the initiative
would save 28.9 MWh per year over a 15 year
lifetime. Moreover, it succeeded in reducing
peak load from 40 MW to 33 MW.
4. Compact fluorescent lightbulb (CFL)
promotion.
The benefits of CFLs in terms of reduced
electricity usage and lower electricity bills are
well established. Scottish Hydro-Electric
considered two methods of promoting CFLs;
either by spreading the cost of lamps over the
customers’ quarterly electricity bills, or by
33
EN E R G Y EF F I C I E N C Y A N D JO B S : UK I S S U E S A N D C A S E S T U D I E S

offering discount vouchers. The first was
considered the preferable option, but was
disallowed by the Office of Electricity
Regulation in the UK, and therefore the
second approach was used.
“£3-off” vouchers were distributed to all
franchise customers (over 10,000 homes) in
Shetland with quarterly bills, for use in the
Scottish Hydro-Electric shop in Lerwick. The
shop sold its full stock of 772 Mazda 20W
bulbs. However, the Mazda CFLs suffered from
poor reliability, and 45 were returned as faulty
(they were replaced by Philips CFLs as direct
replacements). CFLs consume 20% of the
power of equivalent incandescent light bulbs,
and they have a life that is 8 times longer. It
is estimated that the CFL initiative would save
38.6 MWh per year over the 10 year lifetime
of the bulbs.
Industrial energy audits, heat pumps and
district heating also featured, but insufficient
data were available to make any estimate of
energy savings or employment impacts for
these.
Employment impacts
The direct employment involved in the scheme
is summarised in Table 5. There are likely to
have been some additional employment
effects in manufacturing, and indirect
employment gains as a result of re-spending
of money saved on energy bills, but these
impacts were not estimated here.
34
EN E R G Y EF F I C I E N C Y A N D JO B S : UK I S S U E S A N D C A S E S T U D I E S
Initiative Administration Installation Total
(person-years) (person-years) (person-years)
Energy manager 6 2.5 8.5
SaveElectric 0.5 1.75 2.25
Teleswitches 0.25 2.6 2.85
CFLs 0.1 0 0.1
Total 6.85 6.85 13.7
Table 5. Jobs created in the Shetland IRP project.
Summary data
Shetland IRP 1994 - 1997
Total expenditure over 4 years £736,000
Average annual energy savings (15 years) 1 GWh
Value of annual energy savings (15 years) £50,000
Simple payback period 13 years
Blue collar employment 7 person-years
White collar employment 7 person-years
Direct employment per £m invested (over 2 years) 19 person-years

The first requirement for insulation in new
dwellings in UK building codes was introduced
in 1965. Since then they have been updated,
in 1974, 1981, 1990 and most recently in
1995. Part L of the regulations, relating to
“Conservation of Fuel and Power” is once
again under review in 1999/2000. The
Building Research Establishment produce
estimates of the additional costs and energy
savings stimulated by the 1995 regulations.
According to these the 1995 regulations
required an additional expenditure of £68
million per year on new buildings in 1996 and
1997. This case study explains the nature of
this investment and estimates the
employment impacts.
Changes in the regulations
Prior to 1995 Part L of the Building
Regulations merely stated that ‘reasonable
provision shall be made for the conservation
of fuel and power’. In 1995 this was expanded
to clarify the appropriate energy conservation
measures and the approved means of
assessing the energy efficiency of properties.
From 1995 government Standard Assessment
Procedure (SAP) ratings were required for all
new dwellings (and dwellings created as a
result of a change of use involving building
work). This rating applied to the building as a
whole, and ranged from zero to 100, with
higher figures indicating better energy
efficiency. Location, family size or temperature
preferences did not influence the rating.
Rating on a continuous scale allows buyers to
compare properties, and may encourage some
architects and builders to go beyond the
minimum requirements.
SAP ratings were provided by assessors
according to a government-approved
methodology, and cost approximately £30 per
dwelling. Compliance could be either by
minimum SAP rating, or by elemental minimum
standards. The main factors taken into
consideration were the insulation, the heating
system, ventilation characteristics and solar
gain (heat captured by windows or
conservatories). A minimum performance in
terms of thermal transmittance (U value) was
mandated for roofs, roof lights and doors. Hot
water vessels and pipe-work also had to reach
minimum standards of thermal per formance.
Improved roof and floor insulation was
required if the rating was to be less than 60
in a new building.
Costs and energy savings
The Building Research Establishment
estimated that compliance with the 1995
regulations increased the cost of a new
dwelling by 1 to 2%, or £450 to £650 (DOE,
1993), including £30 for the assessment
itself. This investment improved the energy
per formance by 25 to 35% compared to the
previous regulations. Thus for the purposes of
this study we assume an average additional
cost of £550, and a 30% reduction in energy
consumption. A breakdown of the sectors in
which employment was stimulated was
estimated using Office for National Statistics
data (ONS, 1998), DETR commissioned
research on the regulations (Davis Langdon
Consultancy, 1993) and interviews with
construction, manufacturing and assessment
companies.
Employment impacts
Davis Langdon Consultancy (1993) undertook
35
EN E R G Y EF F I C I E N C Y A N D JO B S : UK I S S U E S A N D C A S E S T U D I E S
T h e 1 9 9 5 B u i l d i n g R e g u l a t i o n s

detailed analysis of the various different
methods of complying with Part L of the 1995
Building Regulations, separating out the cost
of labour from the cost of materials. On
average, their estimates show that 40% of the
extra cost (excluding the cost of the SAP
rating) would be incurred by additional labour,
and 60% by additional materials. For an
average additional cost of £520 per dwelling
(i.e. £550 less £30 for the SAP rating), £220
was spent on labour and £300 on materials.
With construction and installation jobs costing
an average of £20,800 (gross) per annum,
this should result in 1 person-year of
employment created for every 95 dwellings
built. Construction companies were not able to
confirm this estimate, but it appears
reasonable.
In the manufacturing sector there was no
direct evidence of increased demand or labour
requirements after the introduction of the
regulations. Therefore an estimate was again
derived from the average expenditure.
According to the Davis Langdon estimates an
additional £300 per dwelling was spent on
materials, and this is estimated to generate 1
person-year of employment in manufacturing
per 200 new dwellings.
The one area where it is directly possible to
identify significant job creation is in the
provision of SAP
ratings. Before
the 1995
Regulations, only
a very small
number of new
dwellings had
SAP ratings
(estimated at <1%). These properties were
generally owned by Housing Associations, who
were keen to provide their tenants with
information on the running costs of their
dwellings, and a few private sector companies
who used the SAP ratings as a marketing tool
(e.g. Admiral Homes). The National House
Builders Council took on 7 staff as full-time
energy raters as a direct result of the 1995
Building Regulations (Stacey 1998, pers.
comm.). They estimate that 1 rater was
needed per 1,000 properties assessed each
year. Each received training in how to conduct
an energy rating and needed a background in
construction.
There will also have been some employment
generation in the field of software
development for carrying out the SAP ratings,
although it is very difficult to separate this
from other IT recruitment in the field.
Data for rates of new housing construction in
1996 and 1997, and compliance with the
1995 regulations, were used to estimate the
total employment impact over this period.
Compliance is based on the date of approval,
not of construction, so regulations take a few
years to reach 100% compliance. Table 6
presents construction and compliance data,
and Table 7 presents estimates of
employment impacts.
36
EN E R G Y EF F I C I E N C Y A N D JO B S : UK I S S U E S A N D C A S E S T U D I E S
1996 1997
Houses Compliant with Houses Houses Compliant with Houses
completed 1995 Reg’s (%) compliant completed 1995 Reg’s (%) compliant
Private sector 178,300 30 53,490 177,900 70 124,530
Public sector 800 20 160 300 60 180
Total 179,100 — 53,650 178,200 — 124,710
Table 6. New houses completed in Britain 1996 to 1997.

Person-years
Sector 1996 1997
SAP ratings 54 125
Construction 565 1,313
Manufacturing 268 624
Total 887 2,062
Table 7. Estimates of additional labour requirements in
1996/7
Total additional investment at £550 per
compliant dwelling amounted to just under
£100 million over the 2 years.
Thus, in 1997, we estimate that almost
125,000 new houses were built which complied
with the 1995 regulations, and this stimulated
over 2000 person-years of employment, with
94% of the jobs in manual sector occupations.
Energy savings and indirect employment
Energy savings are assumed to be 25 - 35%
based on the previous building regulations. We
have therefore taken an average of 30%.
Energy use in homes built between 1990 and
1995 averages at 71.5 GJ (0.02 GWh) per
annum (Shorrock, pers. comm., 1998). Space
and water heating account for 82% of energy
use in homes (DTI, 1997), and therefore
accounted for 58.6 GJ per annum in homes
built between 1990 and 1995, The 1995
Building Regulations will have resulted in a
30% saving, i.e.17.6 GJ per annum for each
dwelling.
Although many measures will in fact have
longer useful lifetimes, we have assumed an
average lifetime of 15 years, making the total
energy savings:
• 1996:
53,650 x 17.6 x 15 GJ
= 14.163 million GJ (3,933 GWh)
• 1997:
124,710 x 17.6 x 15 GJ
= 32.923 million GJ (9,143 GWh)
This has a total value of £320 million, or
£1,800 per dwelling over 15 years. Re-
spending of this money can be expected to
stimulate further indirect employment.
Jeeninga et al (1999) estimate that 7000
additional person-years of employment would
be stimulated, or 467 jobs for 15 years. Given
that this is private expenditure one does not
need to consider displacement of direct jobs
which might have arisen from alternative uses
of government funds.
37
EN E R G Y EF F I C I E N C Y A N D JO B S : UK I S S U E S A N D C A S E S T U D I E S
Summary data
Building regulations 1996-1997
Total expenditure (over 2 years) £98.8 million
Average annual energy savings (15 years) 872 GWh
Value of annual energy savings (15 years) £21.3 million
Simple payback period 5 years
Blue collar employment (over 2 years) 2768 person-years
White collar employment (over 2 years) 180 person-years
Average annual indirect employment (over 15 years) 7000 person-years
Direct employment per £m invested (over 2 years) 29.8 person-years
Indirect employment per £m invested (over 15 years) 70 person-years

S u m m a r y o f c a s e s t u d y
f i n d i n g sTable 8 summarises the cost, energy saving
and employment data for the 7 case studies,
for purposes of comparison. In terms of direct
employment per unit of expenditure, the
Heatwise scheme appears the most
successful. However, indirect employment
gains are negligible, and the programme is not
a cost-effective means of saving energy. The
strength of this type of scheme is that it can
provide training and operate as an
‘intermediate labour market’ for people who
have been in long-term unemployment.
Furthermore it assists low-income families to
be able to afford to heat their homes. The
Home Energy Efficiency Scheme also assists
low-income families, and is more cost
effective in terms of energy savings. These
two programmes create significant amounts of
direct employment, in places and skills groups
which suffer high unemployment. However one
must note that similar direct employment
gains might be possible with alternative uses
of government funds in labour intensive
sectors or job creation programmes.
The Standards of Per formance and
Fridgesavers schemes created a smaller
number of direct jobs than the other case
studies. In the case of SoP this in part
reflects difficulties in calculating employment
stimulated in the manufacturing sector, which
was excluded. In the case of Fridgesavers
some manufacturing employment is included,
but installation work (which accounts for a
high proportion of direct employment in many
case studies) is not necessary for
refrigerators. The investments are funded by a
levy on electricity consumers rather than from
public funds. Therefore the net employment
gain is likely to be greater than in the grant
funded schemes, where funds might otherwise
have created jobs elsewhere.
The Manweb and Shetlands demand side
management schemes were small, localised
programmes which created some employment
as a side effect of delaying the need for
investment in new electricity supply
infrastructure. In terms of total (direct plus
indirect) additional employment per unit of
expenditure, the 1995 Building Regulations
are the most effective of the programmes.
Furthermore the cost to the public sector is
negligible, cost effectiveness in terms of
energy savings is high, and over 90% of the
additional jobs are in manual occupations.
38
EN E R G Y EF F I C I E N C Y A N D JO B S : UK I S S U E S A N D C A S E S T U D I E S

39
EN E R G Y EF F I C I E N C Y A N D JO B S : UK I S S U E S A N D C A S E S T U D I E S
HEE
S 1
991-1
996
Hea
twis
e 1996
SoP
1994 -
1998
Frid
gesa
vers
1997-8
Man
web
DS
MS
hetla
nd IR
PB
uild
ing
regs
1995
Tota
l exp
endi
ture
£359 m
illio
n £4.8
mill
ion
£138 m
illio
n £6.3
5 m
illio
n£243,0
00
£736,0
00
£98.8
mill
ion
over
6 y
ears
over
4 y
ears
over
4 y
ears
over
2 y
ears
Aver
age
annu
al
720 G
Wh/
year
1.7
GW
h/ye
ar
840 G
Wh/
year
20.9
GW
h/ye
ar
N/A
1 G
Wh/
year
872 G
Wh/
year
ener
gy s
avin
gsov
er 1
5 y
ears
over
15 y
ears
over
15 y
ears
over
11 y
ears
over
15 y
ears
over
15 y
ears
Valu
e of
ene
rgy
savi
ngs
£21.2
4 m
illio
n/ye
ar
£82,0
00/y
ear
£42 m
illio
n/ye
ar
£1.1
4 m
illio
n/ye
ar
N/A
£50,0
00/y
ear
£21.3
mill
ion/
year
over
15 y
ears
over
15 y
ears
over
15 y
ears
over
11 y
ears
over
15 y
ears
over
15 y
ears
Sim
ple
payb
ack
perio
d17 y
ears
>50 y
ears
3.5
yea
rs6 y
ears
N/A
13 y
ears
5 y
ears
Blu
e co
llar
empl
oym
ent
7,8
00 p
erso
n-ye
ars
194 p
erso
n-ye
ars
736 p
erso
n-ye
ars
58 p
erso
n-ye
ars
Appr
ox.
5 p
erso
n-ye
ars
7 p
erso
n-ye
ars
2,7
68 p
erso
n-ye
ars
over
6 y
ears
over
4 y
ears
in t
otal
over
2 y
ears
Whi
te c
olla
r em
ploy
men
t 840 p
erso
n-ye
ars
86 p
erso
n-ye
ars
840 p
erso
n-ye
ars
7 p
erso
n-ye
ars
See
abo
ve7 p
erso
n-ye
ars
180 p
erso
n-ye
ars
over
6 y
ears
over
4 y
ears
over
15 y
ears
Indi
rect
em
ploy
men
t 22,0
00 p
erso
n-ye
ars
Neg
ligib
le12,0
00 p
erso
n-ye
ars
475 p
erso
n-ye
ars
Not
est
imat
edN
ot e
stim
ated
7,0
00 p
erso
n-ye
ars
over
15 y
ears
over
15 y
ears
over
15 y
ears
over
15 y
ears
Dire
ct e
mpl
oym
ent
24 p
erso
n-ye
ars
58 p
erso
n-ye
ars
11.4
per
son-
year
s10.2
per
son-
year
s20.6
per
son-
year
s19 p
erso
n-ye
ars
29.8
per
son-
year
s
per
£m
inve
sted
Indi
rect
em
ploy
men
t
61 p
erso
n-ye
ars
Neg
ligib
le87 p
erso
n-ye
ars
75 p
erso
n-ye
ars
Not
est
imat
edN
ot e
stim
ated
70 p
erso
n-ye
ars
per
£m
inve
sted
over
15 y
ears
over
15 y
ears
over
15 y
ears
over
15 y
ears
Tab
le 8
. Su
mm
ary
dat
a fo
r th
e ca
se s
tud
ies.

C h a p t e r 4 : C o n c l u s i o n
There are three main reasons why energy
efficiency has positive effects in terms of job
creation:
• Manufacturing and installing energy
efficiency measures is a labour intensive
sector compared to energy supply, and to
many sectors in which the government
chooses to invest public sector funds. This
effect accounts for direct employment gains of
10 to 30 person-years of employment per £1
million spent, and almost 60 person-years
where job creation and training are made a
priority.
• If the energy savings are cost effective, the
result is that consumers divert expenditure
from energy into the more labour intensive
general consumption sector. This effect
typically generates an additional 70 person-
years of employment in the wider economy per
£1 million spent, over the lifetime of the
energy saving investment.
• Work in manufacturing and installing energy
efficiency measures is accessible to people
who suffer the highest rates of unemployment
in the UK, given that it is manual labour, and
the work is dispersed across the country.
Indeed, where programmes aim to assist the
fuel poor the work is concentrated in areas
where unemployment tends to be highest.
These effects are demonstrated in the 7 case
studies presented here.
• In the Standards of Per formance and
Fridgesavers programmes, approximately 10
person-years of direct employment were
created per £1 million of total investment. The
Home Energy Efficiency Scheme and two small
demand side management schemes generated
approximately 20 person-years of additional
employment per £1 million invested. The 1995
Building Regulations generated 30 additional
person-years of employment per £1 million of
total investment. Heatwise created almost 60
person-years of employment per £1 million
invested, mainly for trainees who had
previously been in long-term unemployment.
However this is the one case in which it could
be argued that no net employment resulted,
since public sector funds could possibly have
been used to create a similar number of jobs
in other ways, and indirect job gains were
negligible. There were however substantial
lifestyle gains for programme beneficiaries.
• Indirect employment gains of approximately
70 person-years over 15 years were estimated
for four of the seven schemes, per £1 million
spent. This effect relates to the re-spending of
money saved by householders who benefit
from cost-effective energy savings. It does not
include the ‘multiplier effect’ whereby local
businesses benefit from the demand stimulus
created by re-spending of wages and demand
for secondary inputs and services. This effect
is not quantified, but can be expected to
contribute to re-vitalising the economies of
areas where energy efficiency investments
create jobs.
• In the Home Energy Efficiency Scheme,
Fridgesavers and Building Regulations case
studies approximately 90% of the employment
was in blue collar occupations. In the
remaining studies approximately 50 to 70% of
new jobs were in this category. The Building
Regulations applied to all new homes, and
40
EN E R G Y EF F I C I E N C Y A N D JO B S : UK I S S U E S A N D C A S E S T U D I E S
therefore additional work was spread across
the country. The small demand side
management schemes created jobs in remote
and/or depressed areas. The remaining case
studies mainly aimed to assist the fuel poor,
and therefore the work was concentrated in
areas of poorer housing, lower incomes and
higher rates of unemployment. The Home
Energy Efficiency Scheme and Heatwise, in
particular, created conditions whereby
employment benefited the people and places
most in need of the work.
Saving energy, cutting carbon dioxide
emissions and assisting people to keep warm
are quite rightly the main aims of energy
efficiency initiatives. Job creation and training
can be made part of the process, or will arise
as a beneficial side-effect.
References
Beatty C., Fothergill S., Gore T. and Herrington
A. (1997) The Real level of unemployment.
Centre for Regional Economic and Social
research, Sheffield Hallam University, March
1997.
Campbell M., Sanderson I. and Walton F. (1998)
Local responses to long-term unemployment.
YPS for Joseph Rowntree Foundation Work and
Opportunity Series No. 6.
Capros P., Paroussos L. and Stroublos N.
(1999) Energy saving investment and
employment. Analysis through the GEM-E3
model. A contribution to the SAVE Employment
Project XVII/4.1031/D/97-032.
Davis Langdon Consultancy (1993) Part L
Conservation of Fuel and Power, Primary and
Secondary Construction Costs.
DfEE (1996) The impact of redundancies on
local labour markets and the post redundancy
experience. Research Studies RS23, Department
for Education and Employment, HMSO,
London.
DOE (1993) Draft Compliance Cost
assessment; Proposed revisions to the
requirements of the building regulations for the
conservation of fuel and power. Department of
the Environment, 26 January 1993.
European Academy of the Urban Environment
(1997) Job Creation in the environmental sector;
Local employment initiatives in Europe.
European Academy of the Urban Environment,
Berlin.
European Commission (1997) Communication
from the Commission on Environment and
Employment (Building a Sustainable Europe).
COM(97)592 Final, Brussels 18 November
1997.
HM Treasury (1998) New ambitions for Britain:
Financial statement and budget report. HC 620,
London. The Stationery Office.
Jeening H, Weber C., Mäenpää I., Rivero Garcia
F, Wiltshire J., Wade J., and Scrase I. (1999)
Employment impacts of energy conservation
schemes in the residential sector. A contribution
to the SAVE Employment Project
XVII/4.1031/D/97-032.
McGregor A., Ferguson Z., Fitzpatrick I.,
McConnachie M and Richmond K. (1997)
Bridging the Jobs Gap; An evaluation of the
Wise Group and the intermediate labour
market. The Joseph Rowntree Foundation,
York.
NAO (1998) The Home Energy efficiency
Scheme, Report by the Comptroller and Auditor
general, National Audit Office. HMSO,
London.
41
EN E R G Y EF F I C I E N C Y A N D JO B S : UK I S S U E S A N D C A S E S T U D I E S

NEA (National Energy Action) (1992) HEES:
The First Fifteen Months, Newcastle-upon-Tyne,
UK.
NEA (1994) HEES: Barriers to Access,
Newcastle-upon-Tyne, UK.
NEA (1995) The Impact of Change, Newcastle-
upon-Tyne, UK.
NEA (1996) Opportunities Los: A report on the
Home Energy Efficiency Scheme 1995/6,
Newcastle-upon-Tyne.
NEA (1997) Cold comfort: A report on the
Home Energy Efficiency Scheme 1996/7,
Newcastle-upon-Tyne.
ONS (1998) Economic Trends No. 537 August
edition. Office for National Statistics. The
Stationery Office, London.
ONS (2000) Excess winter mortality by
standard region of usual residence, 1988/9 to
1998/99. Pers comm. David Dix, Mortality
Statistics Section, Office for National Statistics,
London.
Shorrock, L. (1998) pers. comm. Building
Research Establishment.
Stacey, J. (1998) pers.comm. National Home
Builders Council.
Wade J., Scrase I. and Wiltshire V. (2000)
National and Local Employment Impacts of
Energy Efficiency Investment Programmes:
Results and task reports A contribution to the
SAVE Employment Project XVII/4.1031/D/97-
032.
The Wise Group (1994) Intermediate Labour
Markets. Wise Group, Glasgow.
42
EN E R G Y EF F I C I E N C Y A N D JO B S : UK I S S U E S A N D C A S E S T U D I E S

I n p u t - o u t p u t m o d e l l i n gJeeninga et al. (1999) used the case study
data to investigate indirect employment
effects using a dedicated input-output (I/O)
model. A description of the methodology
follows.
I/O modelling allows one to trace the
economic impacts of investment decisions to
all the economic sectors affected. The models
are static, in that co-efficients relating
economic sectors are fixed in national
statistical tables, and no dynamic relationship
between demand, prices and quantities is
made. This contrasts with general equilibrium
modelling (which investigates macroeconomic
effects, described below), in which all these
variables are allowed to vary so that an
equilibrium situation can be achieved. Since
unemployment itself is a non-equilibrium
situation, static I/O modelling can have
certain advantages over macro-economic
modelling when considering employment
impacts.
In this study, conventional I/O modelling was
enhanced by also considering consumer
behaviour. Households are distinguished by
age, income, education level, number of adults
and number of children. Their consumption
patterns are then modelled for broad
expenditure categories such as food, clothes,
home, leisure, transport and health. These
expenditure categories are subdivided into 16
groups. It is also assumed that a proportion of
household income goes into savings. The
combination of national I/O tables and national
consumption functions allows estimation of the
indirect employment impacts of changes in
consumer expenditure which result from energy
efficiency programmes.
The impacts on employment resulting from
energy efficiency programmes in the consumer
sector can be divided into 4 categories:
1. Direct purchase effects. Employment is
created in the sector manufacturing the
energy efficiency device or measure, and in
installation. These impacts are quantified
directly in the case studies, where
information was available.
2. Indirect purchase effects. The manufacturer
will demand more goods from other sectors
such as raw materials or components, thus
stimulating further employment. This
information was not generally available and
is not quantified in this report.
3. Energy saving effect. Energy savings lead to
direct and indirect job losses in the energy
supply industries. Additionally, spending on
energy efficiency devices, and subsequent
reductions in energy bills, affect the
household budget and spending in all other
sectors, with consequent employment
impacts. This household budget effect
tends to create more employment than the
losses in the energy supply industry, due to
differing labour intensities in energy supply
and general consumer-spending sectors.
Where energy bill savings lead to increased
household expenditure some of this
spending will be on energy consuming
appliances: this rebound effect is taken
into account. Data from the I/O modelling
for employment resulting from the energy
saving effect are reported in this study.
43
EN E R G Y EF F I C I E N C Y A N D JO B S : UK I S S U E S A N D C A S E S T U D I E S
A p p e n d i x A : I n p u t - o u t p u t a n d m a c r o e c o n o m i c m o d e l l i n g .

4. Government budget effect. If programmes
are supported by government expenditure
this will affect their available budget and
spending in other sectors. Similarly,
programmes may affect the available public
sector budget due to changes in
unemployment benefit payments, and
sales-tax receipts on energy. This will
affect employment levels as labour
intensity varies across economic sectors.
These results are discussed in this study.
In order to calculate these effects a reference
scenario must be created. This is the same as
the policy intervention scenario in respect of
all assumptions concerning key variables such
as future energy prices, GDP growth and
changes in labour productivity. The
intervention scenarios are then investigated
using data from the case studies on initial
costs, maintenance costs, government outlay
and energy cost savings. A base year of 1995
was chosen, with costs and savings over the
lifetime of investments discounted to this
base year. Employment impacts are then
evaluated for years 2000 and 2010.
The payment method for energy savings
investments affects the employment impacts,
since different sectors will experience cash
injections or withdrawals as a result, and
labour intensity varies across these sectors.
Energy savings investment can be financed in
4 ways (or a combination of them). These are:
1. General consumption budget. Households
pay for the investment from their
disposable income. This will increase
economic activity (and employment) in the
sectors producing and installing the energy
saving device or materials, and reduce
economic activity across all other sectors
of consumer spending.
2. Loan financing. Assuming a bank loan is
taken, this will transfer economic activity
from the service sector to the domestic
sector. As the loan and interest are repaid
the transfer is reversed.
3. Subsidies. Provision of government
subsidies will reduce government spending
in other sectors, and increase spending in
the household sector. For modelling
purposes, an assumption has to be made
as to how the government would otherwise
use the money. Here, in general, it is
assumed it would be spent within the
government sector itself. This is a
conservative assumption in that the
government sector is very labour intensive,
so employment gains from investment
elsewhere will not be exaggerated.
4. Savings. Households can use savings, thus
withdrawing funds from the service sector
(banks) and injecting it into the household
sector. It is then assumed that the
household sector spending is reduced over
the period of rebuilding savings to their
former level, and because of the lost
interest payments on the withdrawn
savings.
The choice of methods of financing
programmes was found to have a very
significant effect on employment impacts. For
example the government sector is labour
intensive, so subsidies tend to transfer
economic activity to less labour intensive
sectors, causing a reduction in total
44
EN E R G Y EF F I C I E N C Y A N D JO B S : UK I S S U E S A N D C A S E S T U D I E S

employment. However, in almost all cases the
energy savings effect more than compensates
for any loss of employment, as money is
transferred out of the energy supply sector,
which has very low labour intensity.
M a c r o - e c o n o m i c m o d e l l i n gCapros et al (1999) used the case study data
to investigate the wider economic impact of
energy efficiency programmes. The case study
data were used as a starting point, but the
level of investment was scaled up in order
that macroeconomic effects would be
discernible in the model. A description of the
modelling and key findings for the UK are
presented below.
General equilibrium modelling was used to
compare theoretical situations where the EU
economy is enjoying general equilibrium
growth, with and without diversion of funds
into energy saving schemes. The GEM-E3
model allows dynamic economic (and
employment) effects to be investigated on an
EU-wide basis, unlike I/O modelling which
looks at impacts within one country and
affords a less dynamic, but more ‘real world’
perspective.
The model includes all EU member states, and
considers 18 production sectors and 13
household consumption categories.
Government expenditure is differentiated by
financing method and policy types, such as
carbon taxes. Trade relations between EU
member states, and between the EU and the
rest of the world, are also modelled
dynamically (e.g. terms of trade automatically
adjust to correct changes in national current
accounts).
It is assumed that energy efficiency schemes
result in an increase in expenditure on durable
goods (e.g. appliances, insulation materials)
but lower expenditure on energy. These
changes affect expenditure across all
consumption categories. Government funding
causes an increase in public sector borrowing,
and taxes have to be raised to repay the
deficit. (This contrasts with the I/O modelling
which assumes that any public funding is from
a re-allocation of existing funds, reducing
spending within the government sector and
boosting spending in the residential sector). It
is assumed that the government raises a
carbon tax at the exact level necessary to
repay the public borrowing over a period of 15
years.
For the UK study the total expenditure was
scaled up 8 times, to £3.2 billion, spent over
5 years. This was necessary as the model is
insensitive at the scale of the actual
expenditures. The sectors benefiting from the
expenditure, and the source of financing were
the same as those in the case studies. The
model predicted that during the investment
period 12,600 additional jobs would be
created in the UK, and in the long run
employment would remain higher than in a
business as usual case. Moreover the
investment programme has a positive short
term effect on GDP, and is neutral in terms of
economic growth in the long run. Empirical
evidence also suggests that countries with
lower energy intensity (energy consumption
per unit of GDP) enjoy higher rates of
economic growth than their competitors.
45
EN E R G Y EF F I C I E N C Y A N D JO B S : UK I S S U E S A N D C A S E S T U D I E S

A p p e n d i x B : T h e ‘ r e a l ’ r a t e o f u n e m p l o y m e n t
The official rate of unemployment in the UK in
February 2000 was 6%, representing 1.16
million people of working age who are claiming
unemployment benefits. In comparison with
other EU countries this is a relatively low rate.
However recent Research Council-funded
research on the ‘real level of unemployment’
(Beatty et al, 1997) suggests that in 1997
there were a further 2 million people who were
able and willing to work, but were excluded
from the unemployment figures. The rate of
‘hidden unemployment’ has changed little
since then. The authors define real
unemployment as those who might reasonably
be expected to have been in employment in a
fully employed economy’
The data were calculated for 1997, when the
official claimant count was 1.84 million. The
additional ‘hidden unemployed’ were
overwhelmingly those receiving long-term
sickness benefits. In 1981 574,000 people
received long-term sickness benefits,
compared to 1,809,000 in 1995. This
increase occurred at time when indicators of
general health in the population showed a
steady improvement. The authors of the report
conclude that many of these people should
actually be counted as unemployed rather than
unable to work. In the past, mechanisms
within the benefit system have made it in the
financial interest of many jobless people to
move from unemployment to sickness related
benefits, and some have been actively
encouraged to do so by the benefits agencies.
Striking similarities in the geography of
unemployment and long-term sickness in the
UK appear to confirm the suspicion that the
latter is a manifestation of the former. By
examining the rate of long-term sickness in an
area of full employment (the South east of
England in 1991) the authors were able to
estimate how many of those receiving long-
term sickness benefits in 1997 were actually
among the ‘hidden unemployed’. The results
are presented in Table 9, alongside three
other categories of ‘hidden unemployment’.
MALE FEMALE TOTAL
CLAIMANT COUNT 1,407,000 429,000 1,837,000
HIDDEN UNEMPLOYED
Extra LFS unemployed1 60,000 270,000 340,000
Government schemes2 260,000 150,000 400,000
Excess ‘early retired’3 80,000 30,000 100,000
Excess ‘permanently sick’ 820,000 450,000 1.260,000
‘REAL’ UNEMPLOYMENT 2,620,000 1,330,000 3,950,000
Table 9. Alternative measures of unemployment, Great Britain,
January 1997 (Beatty et al, 1997).
1 Based on the quarterly Labour Force Survey, in which a sample
of people are asked whether they are jobless and actively seeking
work.
2 Persons on government employment schemes typically receive
£10 per week in addition to normal benefits, and tend to
consider themselves unemployed.
3 Persons for whom early retirement is a premature, enforced state
due to the lack of job opportunities.
Under these calculations the ‘real’ rate of
unemployment was 14.2% in 1997, compared
to the official rate of 7.1%. HM Treasury
(1998) has acknowledged the scale of this
unrecorded joblessness (see page 10).
These figures show that, despite appearances,
unemployment remains a very real problem for
millions of people in Britain. While this can be
a tragedy for the unemployed, paradoxically it
may help to explain the ‘economic miracle’ of
the late 1990s in Britain. When unemployment
falls below the ‘non-inflationary rate’ (about
46
EN E R G Y EF F I C I E N C Y A N D JO B S : UK I S S U E S A N D C A S E S T U D I E S

8% in the UK) economic growth is expected to
lead to wage pressure and cause inflation.
Part of the reason for the recent steady
economic growth without inflation may be that
the real rate of unemployment has been
considerably above this non-inflationary rate.
47
EN E R G Y EF F I C I E N C Y A N D JO B S : UK I S S U E S A N D C A S E S T U D I E S

Published by:
Energy Saving Trust
21 Dartmouth Street
London SW1H 9BP
Tel: 020 7222 0101
Fax: 020 7654 2444
Web site: http://www.est.org.uk