
Energy Economics and Policy Spring 2012 Instructors: Chu Xiaodong, Zhang Wen Email :...
33
Energy Economics and Policy Spring 2012 Instructors: Chu Xiaodong , Zhang Wen Email : [email protected] , [email protected] Office Tel.: 81696127
-
Upload
gervais-newman -
Category
Documents
-
view
227 -
download
0
Transcript of Energy Economics and Policy Spring 2012 Instructors: Chu Xiaodong, Zhang Wen Email :...

Energy Economics and Policy
Spring 2012Instructors: Chu Xiaodong , Zhang Wen
Email : [email protected], [email protected] Tel.: 81696127

Energy Demand
• Energy is crucial to the improvement of social and economic welfare
• One contributing factor of the great economic achievements over the last century is the replacement of manpower with mechanical and/or electrical power

Energy Demand
• Nowadays global energy demand is met primarily by fossil fuels
• The composition of energy demand is not constant, which is shaped by many factors such as availability, price, technology, economic structure and environmental considerations

Energy Demand
World total final consumption from 1971 to 2009 by fuel (Mtoe)
1973 and 2009 fuel shares of total final consumption

Energy Demand
World electricity generation from 1971 to 2009 by fuel (TWh)
1973 and 2009 fuel shares of electricity generation

Energy Accounting
• Energy balance tables are used to track the total energy required for consumption by sector and fuel type– Raw energy commodities must usually be converted to
some other form prior to being consumed by end-users• For example, raw crude oil is generally converted into products
such as gasoline• Wet natural gas is typically processed into natural gas liquids
• The energy conversion industries convert primary energy inputs to products for final consumption

Energy Accounting
Energy balance tables

Energy Accounting
• From energy balance tables– Total primary energy requirement (TPER) is greater than
total final consumption (TFC)– The difference between TPER and TFC stems from
conversion and distribution losses

Energy-Capital Relationship
• The demand for energy is a derived demand– Energy is an input to provide a set of energy services such
as producing steam, driving certain industrial processes, and providing transportation services
• The relationship between energy use and capital stock can be expressed as
where E denotes energy use, K denotes the capital stock, u denotes capacity utilization of capital, and ε denotes the energy efficiency of capital
Ku
E

Example 2.1: Motor Fuel Consumption
• Consider the case of motor fuel consumption– Capital stock K is expressed as the number of motor
vehicles– Capital utilization u is expressed as miles per vehicle– Efficiency ε is expressed as miles per gallon
vehiclesgallonmiles
vehiclemiles gallons

Example 2.1: Motor Fuel Consumption
• The service derived from vehicle ownership and the consumption of gallons of fuel is miles
• It is possible to rearrange the equation and obtain the amount of fuel consumption required to achieve a given level of transportation service
vehiclesvehicle
gallons
gallon
miles miles

Example 2.1: Motor Fuel Consumption
• Energy use is positively related to capital utilization that denotes the service rendered by capital equipment, such as miles driven per vehicle
• However as efficiency increases, the energy required per unit of service declines
• Efficiency gains can offset increased utilization and growing vehicle stocks thereby mitigating increased fuel consumption

*Writing Skill
• The paragraph of “According to the US Federal Highway and Traffic Safety Administration…” (on page 92 of [Evans & Hunt, 2009]) is a good example of deducing results from facts
Energy Demand in Long Run
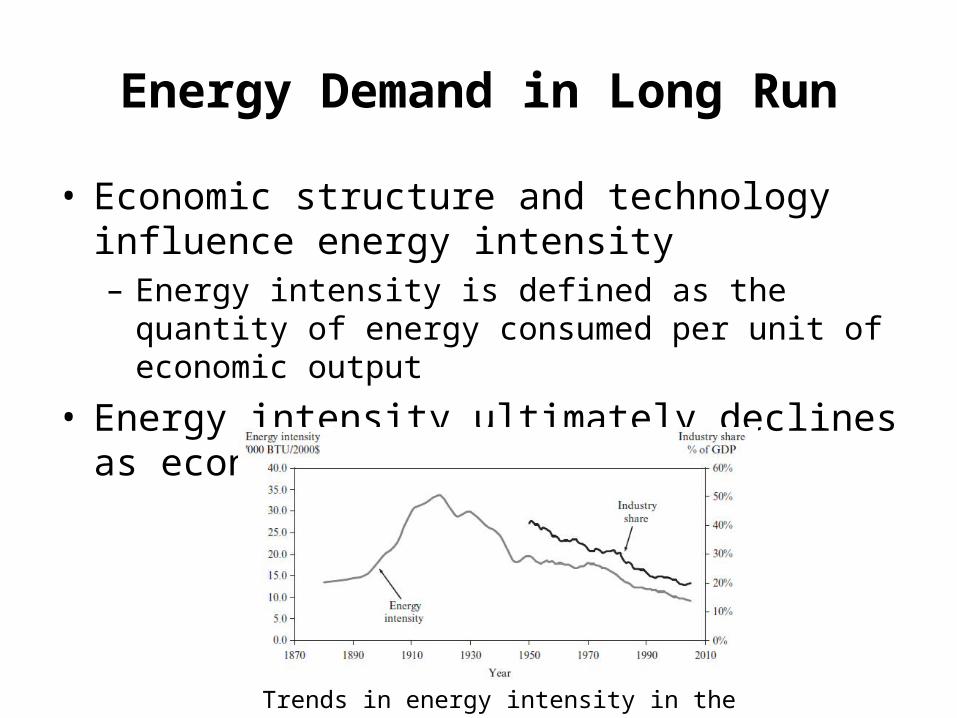
• Economic structure and technology influence energy intensity– Energy intensity is defined as the quantity of energy
consumed per unit of economic output
• Energy intensity ultimately declines as economies develop
Trends in energy intensity in the US (1880–2005)

Energy Demand in Long Run
• The theory of dematerialization – Energy intensity initially increases then decreases with
increasing GDP– The later in time economic growth occurs, the lower the
maximum intensity of use of energy will be
Dematerialization and energy intensity

Energy Demand in Long Run
• Changing economic structure has a significant influence on energy use– The structural changes result in changes in the structure of
the capital stock, which will promote changes in energy intensity• At higher levels of economic development, energy intensity
declines as the service sector relative to other sectors

Energy Demand in Long Run
• Consider a three-sector economy– Total energy consumption is the sum of energy use across
all sectors
– Total output is
– Total energy intensity is
SIA EEEE
SS
SI
I
IA
A
A
S
S
SI
I
IA
A
A
SIA
Y
E
Y
E
Y
E
Y
Y
Y
E
Y
Y
Y
E
Y
Y
Y
EY
EEE
Y
E
SIA YYYY

Energy Demand in Long Run
• Consider a three-sector economy (cont’)– Assume that the energy intensity of each sector can be
ordered such that
– If sector I grows faster than sector A, holding the output share of sector S constant, how will the total energy intensity change?
I
I
S
S
A
A
Y
E
Y
E
Y
E

Energy Demand in Long Run
• Consider a three-sector economy (cont’) – The derivative of the total energy intensity w.r.t the output
share of sector I
– The impact on energy intensity of the shift to sector I is positive0
)1(
)(
I
I
A
A
I
S
S
S
A
A
I
I
A
A
I
S
S
S
I
I
I
IS
A
A
I
S
S
S
I
I
I
I
I
A
A
A
I
Y
E
Y
E
d
d
Y
E
Y
E
Y
E
Y
E
d
d
Y
E
Y
E
d
d
Y
E
d
d
Y
E
d
d
Y
E
d
d
Y
E
d
YEd

Energy Demand in Long Run
• Technological progress effectively lowers the peak energy intensity of an economy
• The influence of technology change can be expressed by
– An increase in energy efficiency in any sector (by adopting a new technology) will lead to a decline in the energy intensity of sector and overall energy intensity
– The impact of the technological change will be the greatest if it occurs in the sector with the largest share of total output
S
S
SSSI
I
IIIA
A
AAA
Y
Ku
Y
Ku
Y
Ku
Y
E
Energy Demand in Long Run
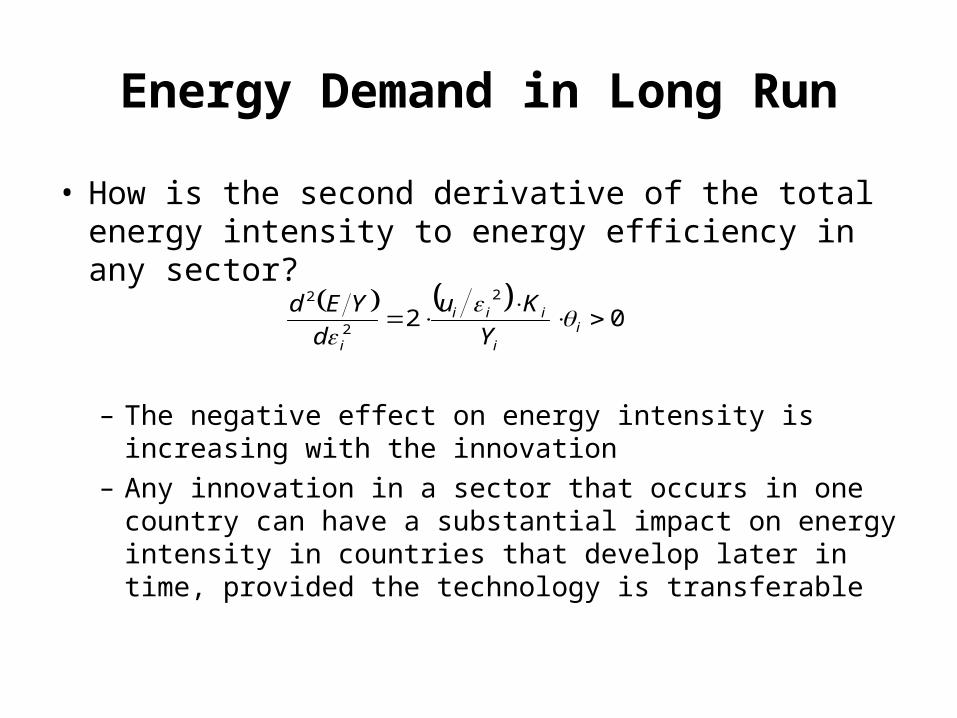
• How is the second derivative of the total energy intensity to energy efficiency in any sector?
– The negative effect on energy intensity is increasing with the innovation
– Any innovation in a sector that occurs in one country can have a substantial impact on energy intensity in countries that develop later in time, provided the technology is transferable
02
2
2
2
ii
iii
i Y
Ku
d
YEd

Modeling Energy Demand
• The decision of energy consumption usually involves three choices as– The choice to invest in capital stocks – The choice of a particular type of capital stocks– The choice of a rate of capital utilization
• These choices all lead to a desired amount of energy service

Modeling Energy Demand
• Dynamic models that incorporate dynamic investment behavior are suited to capture both the short- and long run responses of energy demand to changes in economic variables
• Static models that do not incorporate dynamic behavior are also widely utilized, and they can be valuable in understanding full-adjustment variable response
Modeling Energy Demand
• Model taxonomy– The static model of a firm– The dynamic model of a firm– The static model of a household– The dynamic model of a household
• Please reference a proper model when you will work on a modeling problem– Models on Pages 97-101 are two good examples

Elasticity of Energy Demand
• Elasticity is a measure of how much buyers and sellers respond to changes in market conditions
• The responsiveness (or sensitivity) of consumers to a price change is measured by a product’s price (or income) elasticity of demand
– If a specific percentage change in price produces a larger percentage change in quantity demanded, demand is elastic, otherwise it is inelastic
income)(or pricein change of %
demandedquantity in change of %dE

Elasticity of Energy Demand
• Cross elasticity is the responsiveness of demand of one good to changes in the price of a related good either a substitute or a complement
Y good of pricein change of %
X good of demandedquantity in change of %xyE
Elasticity of Energy Demand
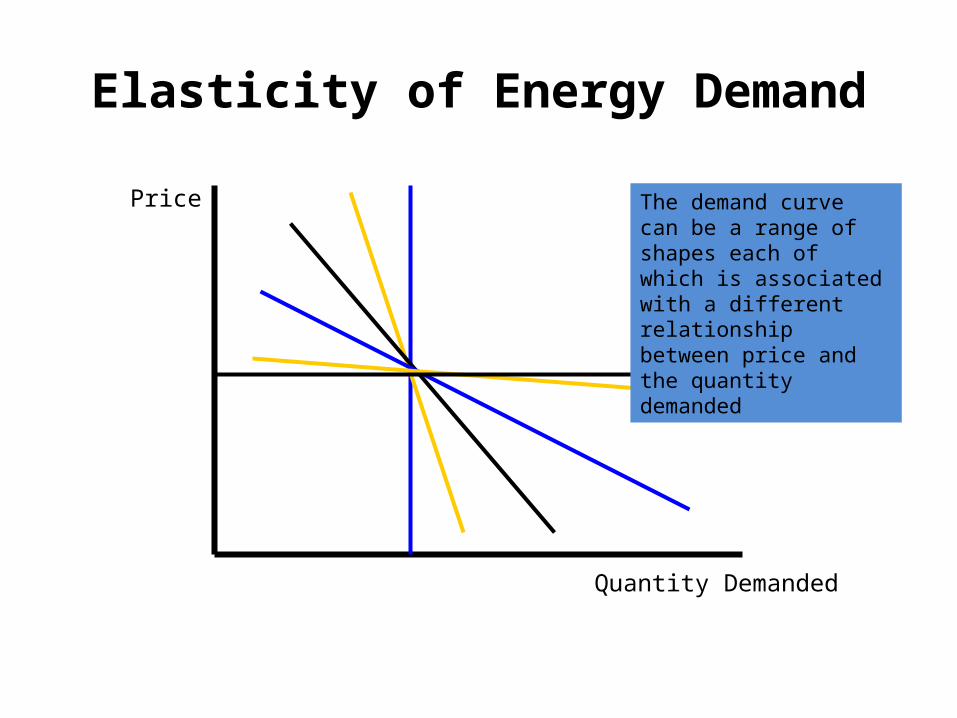
Price
Quantity Demanded
The demand curve can be a range of shapes each of which is associated with a different relationship between price and the quantity demanded

Elasticity of Energy Demand
Price
Quantity Demanded
The importance of elasticity is the information it provides on the effect on total revenue of changes in price.
5
100
Total revenue is price x quantity sold. In this example, TR = 5 x 100,000 = 500,000
This value is represented by the grey shaded rectangle
Total Revenue

Price
Quantity Demanded
D
If the firm decides to decrease price to (say) 3, the degree of price elasticity of the demand curve would determine the extent of the increase in demand and the change therefore in total revenue
5
100
3
140
Total Revenue
Elasticity of Energy Demand

Price
Quantity Demanded
10
D
5
5
6
% Δ Price = -50%
% Δ Quantity Demanded = +20%
Ed = -0.4 (Inelastic)
Total Revenue would fall
Producer decides to lower price to attract sales
Not a good move!
Elasticity of Energy Demand

Price
Quantity Demanded
D
10
5 20
Producer decides to reduce price to increase sales
7
% Δ in Price = - 30%
% Δ in Demand = + 300%
Ed =-10 (Elastic)Total Revenue rises
Good Move!
Elasticity of Energy Demand

Elasticity of Energy Demand
• The price elasticity is often used as an indicator of the impact of various policies aimed at conservation, such as energy taxes or subsidies– For example, if policy targets a demand reduction through
the implementation of a tax in a sector where price elasticity is very low, then the policy is unlikely to achieve its stated goal, which results in large costs being imposed on consumers without an off setting benefit

Next Lecture
• The main topic will be Economics of Energy Supply• Pages from textbooks are good learning reference
including Chapter 3 of [Evans & Hunt, 2009] and Pages 53-56 of [McConnell, Brue & Flynn, 2012]