Energy Division & Program Administrator Energy Efficiency ...
81
Energy Division & Program Administrator Energy Efficiency Evaluation, Measurement and Verification Plan FINAL 2019- 2021 Version 10 CALIFORNIA PUBLIC UTILITIES COMMISSION, ENERGY DIVISION San Francisco, California December 30, 2020
Transcript of Energy Division & Program Administrator Energy Efficiency ...

Energy Division & Program Administrator Energy Efficiency
Evaluation, Measurement and Verification Plan FINAL
2019 - 2021 Version 10
CALIFORNIA PUBLIC UTILITIES COMMISSION, ENERGY DIVISION San Francisco, California December 30, 2020

Contents 1 Overview and Research Summary ........................................................................................................ 1
1.1 Introduction .................................................................................................................................. 1
1.2 Scope ............................................................................................................................................. 1
1.3 EM&V Chapters ............................................................................................................................. 1
1.4 Public Review ................................................................................................................................ 1
1.5 Project Coordination Groups ........................................................................................................ 1
1.6 Resources ...................................................................................................................................... 1
1.7 Plan Budget Summary ................................................................................................................... 2
1.8 Studies by Year .............................................................................................................................. 4
2 Policy & Planning................................................................................................................................. 14 2.1 Commission Decisions ................................................................................................................. 14
3 Residential ........................................................................................................................................... 16 3.1 Residential Portfolio of Programs ............................................................................................... 16
3.2 2019 and 2020 EM&V Studies .................................................................................................... 16
3.3 Planned 2021 EM&V Studies ...................................................................................................... 19
3.4 Ex Ante Coordination .................................................................................................................. 27
3.4.1 Summary of DEER Updates ................................................................................................. 27
3.4.2 Summary of Uncertain Measure Updates .......................................................................... 28
3.4.3 Program Administrators’ Workpaper Submissions ............................................................. 29
4 Commercial ......................................................................................................................................... 31 4.1 Commercial Portfolio of Programs ............................................................................................. 31
4.2 2019 and 2020 EM&V Studies .................................................................................................... 31
4.3 Planned 2021 EM&V Studies ...................................................................................................... 33
4.4 Ex Ante Coordination .................................................................................................................. 37
4.4.1 Summary of DEER Updates ................................................................................................. 37
4.4.2 Summary of Uncertain Measure Updates .......................................................................... 39
4.4.3 Program Administrators’ Workpaper Submissions ............................................................. 40
5 Public Sector ....................................................................................................................................... 41 5.1 Public Sector Portfolio of Programs ............................................................................................ 41
5.2 2019 and 2020 EM&V Studies .................................................................................................... 41
5.3 Planned 2021 EM&V Studies ...................................................................................................... 41
6 Industrial ............................................................................................................................................. 42 6.1 Industrial Portfolio of Programs .................................................................................................. 42

6.2 2019 and 2020 EM&V Studies .................................................................................................... 42
6.3 Planned 2021 EM&V Studies ...................................................................................................... 43
6.4 Ex Ante Coordination .................................................................................................................. 44
6.4.1 Summary of Uncertain Measure Updates .......................................................................... 44
6.4.2 Program Administrators’ Workpaper Submissions ............................................................. 44
7 Agriculture .......................................................................................................................................... 46 7.1 Agriculture Portfolio of Programs ............................................................................................... 46
7.2 2019 EM&V Study ....................................................................................................................... 46
7.3 Planned 2021 EM&V Studies ...................................................................................................... 46
7.4 Ex Ante Coordination .................................................................................................................. 46
7.4.1 Summary of Uncertain Measure Updates .......................................................................... 46
7.4.2 Program Administrators’ Workpaper Submissions ............................................................. 47
8 Cross-Cutting ....................................................................................................................................... 48 8.1 Cross-cutting Portfolio of Programs ............................................................................................ 48
8.2 Marketing, Education & Outreach .............................................................................................. 48
8.2.1 Planned 2021 EM&V Studies .............................................................................................. 48
8.3 Emerging Technologies ............................................................................................................... 50
8.3.1 Planned 2021 EM&V Studies .............................................................................................. 50
8.4 Codes & Standards ...................................................................................................................... 51
8.4.1 Planned 2021 EM&V Studies .............................................................................................. 51
8.5 Workforce, Education, and Training (WE&T) .............................................................................. 52
8.5.1 Planned 2021 EM&V Studies .............................................................................................. 53
8.6 Finance ........................................................................................................................................ 55
8.6.1 Planned 2021 EM&V Studies .............................................................................................. 55
8.7 Integrated Demand Side Management (IDSM) .......................................................................... 56
8.7.1 Planned 2021 EM&V Studies .............................................................................................. 57
8.8 Zero Net Energy (ZNE) and Decarbonization .............................................................................. 57
8.8.1 Planned 2021 EM&V Studies .............................................................................................. 58
8.9 Industrial Agricultural and Large Commercial (IALC) .................................................................. 60
8.9.1 Planned 2021 EM&V Studies .............................................................................................. 60
8.10 Other Cross-Cutting Studies ........................................................................................................ 61
8.10.1 Planned 2021 EM&V Studies .............................................................................................. 62
Appendix A. Guidelines for CPUC-ED and California IOU EM&V Reports ................................................... 65 Appendix B. Impact Evaluation Standard Reporting Guidelines ................................................................. 67

Appendix C. Workpaper Details .................................................................................................................. 72 Appendix D. CPUC ED Resolution E-5082 Approval of the Database for Energy-Efficiency Resources updates for Program Year 2022 and revised version for Program Years 2021 and 2020 .......................... 73 Appendix E. EM&V Studies Table ................................................................................................................ 74 Appendix F. Public Comments .................................................................................................................... 75

List of tables Table 1. 2019 EM&V Studies ......................................................................................................................... 4 Table 2. 2020 EM&V Studies ......................................................................................................................... 7 Table 3. Planned 2021 EM&V Studies ......................................................................................................... 11 Table 4. 2019 and 2020 Residential EM&V Studies Summary .................................................................... 16 Table 5. Planned 2021 Residential Sector EM&V Studies Summary .......................................................... 19 Table 6. Study Description: Early M&V to Inform PG&E’s 2020 Savings Claims for Universal Audit Tool (UAT) (Phase 2) ........................................................................................................................................... 20 Table 7. Study Description: Statewide Early M&V to Inform 2021 Savings Claims for Home Energy Reports ........................................................................................................................................................ 21 Table 8. Study Description: Barriers to Energy Efficiency Program Participation for Underserved Residential Customers ................................................................................................................................ 22 Table 9. Study Description: Gas Fuel Cells Market Study ........................................................................... 23 Table 10. Study Description: Consumer Behavior on Decision-Making Processes ..................................... 23 Table 11. Study Description: Residential EE Market Study ......................................................................... 24 Table 12. Study Description: Whole Building and Measure Level Savings Estimation: Simple Structural Equation Approach ..................................................................................................................................... 25 Table 13. Study Description: SCE Home Energy Report Persistence Pilot Addendum Study ..................... 26 Table 14. 2019 Uncertain Measures Residential Sector ............................................................................. 28 Table 15. 2020 Uncertain Measures Residential Sector (provided for informational purposes) ............... 29 Table 16. 2019 Residential Sector Workpaper Submissions by End-Use Category and IOU ...................... 29 Table 17. 2020 Residential Sector Workpaper Submissions by End-Use Category and IOU ...................... 29 Table 18. 2019 and 2020 Commercial Sector EM&V Studies Summary ..................................................... 32 Table 19. Planned 2021 Commercial Sector EM&V Studies Summary ....................................................... 33 Table 20. Study Description: Follow-on Market Study for Small- and Medium-sized Business (SMB) Commercial Sector ...................................................................................................................................... 33 Table 21. Study Description: ZNE Commercial GHG Emissions .................................................................. 34 Table 22. Study Description: Site-level NMEC Study for Gas ...................................................................... 34 Table 23. Study Description: Market Study for Electrification Potential in Commercial Buildings ............ 35 Table 24. Study Description: Assessment of COVID-19 Impacts on Ventilation Usage in Nonresidential Buildings ...................................................................................................................................................... 35 Table 25. Study Description: Market Assessment of Nonresidential Fuel Substitution Measures ............ 36 Table 26. Study Description: Process Evaluation of SCE’s Project Review Process .................................... 36 Table 27. 2019 Uncertain Measures - Commercial Sector ......................................................................... 39 Table 28. 2020 Uncertain Measures - Commercial Sector (provided for informational purposes) ........... 39 Table 29. 2019 Commercial Sector Workpaper Submissions by End-Use Category and IOU .................... 40 Table 30. 2020 Commercial Sector Workpaper Submissions by End-Use Category and IOU .................... 40 Table 31. 2019 and 2020 Public Sector EM&V Studies Summary ............................................................... 41 Table 32. 2019 and 2020 Industrial EM&V Studies Summary .................................................................... 42 Table 33. Planned 2021 Industrial Sector EM&V Study Summary .............................................................. 43 Table 34. Study Description: Industrial SEM Study ..................................................................................... 43 Table 35. 2019 Uncertain Measures – Industrial Sector ............................................................................. 44 Table 36. 2020 Uncertain Measures - Industrial Sector (provided for informational purposes) ............... 44 Table 37. 2019 Industrial Sector Workpaper Summary by End-Use Category and IOU ............................. 44 Table 38. 2020 Industrial Sector Workpaper Summary by End-Use Category and IOU ............................. 45 Table 39. 2019 Agricultural EM&V Study Summary ................................................................................... 46 Table 40. 2019 Uncertain Measures – Agriculture Sector .......................................................................... 47

Table 41. 2019 Agriculture Sector Workpaper Summary by End-Use Category and IOU .......................... 47 Table 42. 2020 Agriculture Sector Workpaper Summary by End-Use Category and IOU .......................... 47 Table 43. 2019 Marketing, Education & Outreach EM&V Study Summary ................................................ 48 Table 44. Planned 2021 Marketing, Education & Outreach EM&V Studies Summary ............................... 48 Table 45. Study Description: Cross-Cutting Marketing Effectiveness Study ............................................... 49 Table 46. Study Description: ME&O Program Transition from IOUs to Third Parties and CCAs ................ 50 Table 47. 2020 Emerging Technologies EM&V Studies Summary .............................................................. 50 Table 48. 2020 Cross Cutting-Codes & Standards EM&V Study Summary ................................................. 51 Table 49. 2021 Cross-Cutting Codes & Standards EM&V Studies Summary .............................................. 51 Table 50. Study Description: PY2016-2018 Codes and Standards Cost Effectiveness ................................ 51 Table 51. Study Description: PY2016-2018 Codes and Standards Impact Evaluation ................................ 52 Table 52. 2019 and 2020 WE&T EM&V Studies Summary ......................................................................... 53 Table 53. 2021 WE&T EM&V Studies Summary ......................................................................................... 53 Table 54. Study Description: WE&T and Installation Improvement Evaluation Study ............................... 53 Table 55. Study Description: Partnerships with Training Institutions Impact Evaluation .......................... 54 Table 56. Study Description: WE&T Career Connections Process Evaluation ............................................ 54 Table 57. Study Description: Career and Workforce Readiness Process Evaluation .................................. 55 Table 58. 2019 Cross Cutting- Finance EM&V Studies Summary ............................................................... 55 Table 59. 2021 Finance EM&V Studies Summary ....................................................................................... 56 Table 60. Study Description: PY2018 SW On Bill Financing Impact Evaluation .......................................... 56 Table 61. Study Description: PY2020 SW Small Business & Multifamily Pilot Process Evaluation ............. 56 Table 62. 2019 and 2020 IDSM EM&V Studies Summary ........................................................................... 57 Table 63. 2020 ZNE and Decarbonization EM&V Studies Summary ........................................................... 57 Table 64. Proposed 2021 Cross-Cutting- ZNE and Decarbonization EM&V Studies Summary................... 58 Table 65. Study Description: IOU and CCA Cross-Cutting Program Evaluation and Program Facilitation .. 58 Table 66. Study Description: ZNE Retrofit Timelines and Costs ................................................................. 59 Table 67. Study Description: Electric Cooktops Market Study ................................................................... 59 Table 68. 2020 IALC EM&V Study Summary ............................................................................................... 60 Table 69. 2021 IALC EM&V Study Summary ............................................................................................... 60 Table 70. Study Description: Improving Measure Costs for Custom Projects ............................................ 60 Table 71. 2019 and 2020 Other Cross-Cutting EM&V Studies Summary ................................................... 61 Table 72. Proposed 2021 Cross-Cutting- Other EM&V Studies Summary .................................................. 62 Table 73. Study Description: Post Transition Market Study ....................................................................... 62 Table 74. Study Description: Assessment of Community Choice Aggregators ........................................... 63 Table 75. Study Description: Assessment of Local Government Partnerships and Regional Energy Networks ..................................................................................................................................................... 63
List of figures Figure 1. Distribution of Planned 2021 EM&V Funds by Study Type - PAs Only .......................................... 2 Figure 2. Distribution of Planned 2021 EM&V Funds by Sector – PAs Only ................................................. 3 Figure 3. Distribution of Planned 2021 EM&V Funds by Study Type - Energy Division (ED) Only ................ 3

1
1 Overview and Research Summary 1.1 Introduction The evaluation, measurement and verification (EM&V) plan details energy efficiency (EE) program studies conducted by the California Public Utilities Commission (CPUC) Energy Division (ED), investor owned utilities (IOUs) and non-IOU program administrators (PA) Regional Energy Networks (RENs). The purpose of this plan is to identify how the ED and the PAs will track, coordinate and prioritize research activities across sectors. This plan represents studies planned and/or conducted in calendars years 2019 and 2020 and studies proposed to be conducted in 2021.
1.2 Scope This scope of the EM&V Plan supports oversight of the PAs’ portfolio of energy efficiency programs. The PAs file their annual budget advice letters with the Commission September of each year as required as part of the rolling portfolio guidance. The core content of this EM&V Plan followed a disaggregated approach that focused on research needs grouped at the sector level chapters, which are aligned with the PAs business plans.
1.3 EM&V Chapters The chapters in this EM&V Plan include the high-level descriptions of the impact, process and market studies for each sector. This planning effort was a collaborative process between CPUC ED, California IOUs, non-IOU PAs and CPUC consultants.
In developing the EM&V Plan, ED and PA staff focused on the following approach:
1.4 Public Review All studies developed by ED and the PAs will be posted on the ED public document area website (https://pda.energydataweb.com/#!/). In some cases, draft study plans will be posted for public comment. Please visit the public document area for detailed descriptions of the research activities described in this EM&V Plan.
1.5 Project Coordination Groups ED and PA staff will convene Project Coordination Groups (PCGs) to coordinate and plan EM&V activities, and to collaborate on studies.
1.6 Resources ED maintains several tools and processes that allow stakeholders to provide input on research planning and track progress of research projects.

2
1.7 Plan Budget Summary Below are summaries of the current EM&V budgets by activity area and sector. The data for these figures come from the Project Status Reporting (PSR) site,1 which is updated frequently by project managers. The figures below were comprised of data from November 10, 2020. A download of this data is available in Appendix E. EM&V Studies Table.
Figure 1. Distribution of Planned 2021 EM&V Funds by Study Type - PAs Only
1 https://psr.energydataweb.com/
48%
51%
1%
Market Study Other Process Evaluation

3
Figure 2. Distribution of Planned 2021 EM&V Funds by Sector – PAs Only
Figure 3. Distribution of Planned 2021 EM&V Funds by Study Type - Energy Division (ED) Only
33%
7%
4%
56%
Commercial Cross-Cutting Industrial Residential
18%
5%
43%
34%
Impact Evaluation Market Study Other Process Evaluation

4
1.8 Studies by Year Below are tables showing the 2019, 2020 and planned 2021 studies, respectively. This information is also included in Excel format in Appendix E. EM&V Studies Table. Further information on the individual studies can be found on the Project Status Reporting (PSR) site at https://psr.energydataweb.com/.
Table 1. 2019 EM&V Studies
Study Sector Study ID Study Title Study
Manager Study Type Budget Completion
Date
Residential 2019_Residential_511
SCE Home Energy Reports (HERs) Behavior Persistence Analysis
SCE Market Study $92,200 9/15/2020
Residential 2019_Residential_518
SDG&E Home Energy Reports (HERs) Behavior Persistence Analysis
SDG&E Market Study
$50,000 N/A
Residential 2019_Residential_519
Statewide Residential Workpapers Update
SDG&E Other $100,000 N/A
Residential 2019_Residential_552
Group A Impact Evaluation of HVAC ESPI Measures PY2018
CPUC ED Impact Evaluation
$1,157,488 3/1/2020
Residential 2019_Residential_554
Group A Impact Evaluation of Home Energy Reports PY2018 (HERs; PY 2017)
CPUC ED Impact Evaluation $505,000 3/1/2020
Residential 2019_Residential_555
Group A Impact Evaluation of Lighting Non-Residential Midstream and Downstream PY2018
CPUC ED Impact Evaluation $426,000 12/31/2020
Residential 2019_Residential_585
Group A Impact Evaluation of Upstream and Residential Downstream Lighting PY2018
CPUC ED Impact Evaluation $727,000 3/1/2020
Residential 2019_Residential_586
Group A Impact Evaluation of Smart Thermostats PY2018
CPUC ED Impact Evaluation $130,000 3/1/2020
Residential 2019_Residential_587
Group A Impact Evaluation of Pool Pumps PY2018 CPUC ED Impact
Evaluation $100,000 3/1/2020
Residential 2019_Residential_588
Group A Impact Evaluation of Hot Water Savings Fixtures PY2018
CPUC ED Impact Evaluation $100,000 12/31/2020
Residential 2019_Residential_591
Group E Market Adoption Characteristics Study CPUC ED Market
Study $461,500 2/1/2021
Commercial 2019_Commercial_512
Statewide Non-Residential Workpaper Support SCE Market
Study $75,000 N/A
Commercial 2019_Commercial_513
Statewide Commercial Market Characterization Study
SCE Market Study $150,000 N/A
Commercial 2019_Commercial_520
Deemed Measure Costs for Custom Projects & Programs
SDG&E Market Study $145,000 N/A

5
Study Sector Study ID Study Title Study
Manager Study Type Budget Completion
Date
Commercial 2019_Commercial_525
Commercial Whole Building Demonstration Joint Study Report
PG&E Other $80,868 5/1/2019
Commercial 2019_Commercial_ 535
Statewide Interior Lighting Study SCE Market
Study $82,725 9/30/2019
Commercial 2019_Commercial_582
2018-19 Custom Industrial Agricultural and Commercial (CIAC) Impact Evaluation
CPUC ED Impact Evaluation $5,045,000 4/1/2021
Commercial 2019_Commercial_584
2018 Small/Medium Commercial Sector Deemed ESPI Impact Evaluation
CPUC ED Impact Evaluation $1,156,000 3/1/2020
Commercial 2019_Commercial_589
Group A 2017 and 2018 Nonresidential Downstream Program Performance Assessment
CPUC ED Impact Evaluation $600,000 12/31/2020
Public 2019_Public_503
Statewide Public Sector Market Study PG&E Market
Study $300,000 12/31/2021
Public 2019_Public_523
Statewide Study to Quantify Co-benefits and Local Economic Benefits of LGPs in HTR and DAC
PG&E Market Study $150,000 1/31/2021
Industrial 2019_Industrial_514
Statewide Industrial Large Customer Wants and Needs
SCE Market Study $200,000 12/1/2020
Industrial 2019_Industrial_583
2018 Industrial Strategic Energy Management (SEM) Evaluation
SCE Impact Evaluation $1,357,000 6/1/2021
Industrial 2019_Industrial_592
Group E Ind/Ag Market Study CPUC ED Market
Study $450,500 2/1/2021
Agriculture 2019_Agriculture_ 515
Statewide Horticulture Indoor Ag Market Study SCE Market
Study $150,000 N/A
Cross-Cutting
2019_Non-Resource_542
Marketing Education and Outreach Consensus Project
CPUC ED Other $375,000 6/4/2020
Cross-Cutting
2019_Non-Resource_531
Codes and Standards Harmonization Study CPUC ED Other $125,000 12/30/2019
Cross-Cutting
2019_Cross-Cutting_504
Workforce Education and Training (WE&T) Market Assessment to Inform Integrated Energy Education and Training (IEET): Phase 1
PG&E Process Evaluation $100,000 N/A
Cross-Cutting
2019_Cross-Cutting_505
PG&E On-Bill Financing Alternative Pathway Early M&V
PG&E Process Evaluation $88,892 8/24/2020

6
Study Sector Study ID Study Title Study
Manager Study Type Budget Completion
Date
Cross-Cutting
2019_Non-Resource_526
REEL Pilot Financing Impact Evaluation CPUC ED Impact
Evaluation $400,000 10/30/2019
Cross-Cutting
2019_Cross-Cutting_521
Statewide Effectiveness of IDSM ME&O Efforts Study SDG&E Process
Evaluation $100,000 N/A
Cross-Cutting
2019_Cross-Cutting_522
Statewide Interactive Effects of IDSM Projects Study
SDG&E Process Evaluation $105,000 N/A
Cross-Cutting
2019_Cross-Cutting_478
Statewide Energy Efficiency Program Composition Review
PG&E Process Evaluation $169,570 6/3/2019
Cross-Cutting
2019_Cross-Cutting_506
Statewide Bottom-Up Portfolio Analysis PG&E Process
Evaluation $200,000 1/1/2019
Cross-Cutting
2019_Non-Resource_528
SW Small Business & Multifamily Pilot Process Evaluation
CPUC ED Process Evaluation $200,000 10/30/2021
Cross-Cutting
2019_Non-Resource_532
Assessment of Community Choice Aggregators CPUC ED Other $250,000 12/30/2020
Cross-Cutting
2019_Non-Resource_594
Assessment of Local Government Partnerships and Regional Energy Networks
CPUC ED Other $250,000 12/1/2020

7
Table 2. 2020 EM&V Studies
Study Sector Study ID Study Title Study
Manager Study Type Budget Completion
Date
Residential 2020_Residential_559
Bill Salience Customer Attention and Behavior Response Analysis
SCE Market Study $100,000 9/30/2021
Residential 2020_Residential_561
Market Study to Inform Future Whole House Retrofit Programs
PG&E Market Study $100,000 12/31/2021
Residential 2020_Residential_563
California Multifamily Boiler Market Assessment Study - Phase II
SoCalGas Market Study $200,000 6/30/2021
Residential 2020_Residential_568 IDSM & EE+DR Load Impact Methodology
SDG&E Other $150,000 12/31/2020
Residential 2020_Residential_570 IDSM & EE+DR Cost Effective Methodology
SDG&E Other $150,000 12/31/2020
Residential 2020_Residential_572 IDSM & EE+DR Specific to control management
SDG&E Other $250,000 12/31/2020
Residential 2020_Residential_580
Early M&V to Inform PG&E's 2019-20 Home Energy Reports Savings Claims
PG&E Other $98,200 8/31/2022
Residential 2020_Residential_581
Early M&V to Inform PG&E's 2019 Savings Claims for Universal Audit Tool (UAT) Phase One
PG&E Other $150,000 6/24/2022
Residential 2020_Residential_593 Group E EE Potential Study CPUC ED Other $1,000,000 4/30/2021
Residential 2020_Residential_596
SoCalREN Multifamily Program Process Evaluation
SoCalREN Process Evaluation $130,000 07/31/2021
Residential 2020_Residential_598 Population NMEC Comparison Group Assessment
PG&E Other $98,600 4/30/2021
Residential 2020_Residential_608
Group A Impact Evaluation of Smart Thermostats PY2019
CPUC ED Impact Evaluation $719,500 3/1/2021

8
Study Sector Study ID Study Title Study
Manager Study Type Budget Completion
Date
Residential 2020_Residential_609
Group A Impact Evaluation of Residential Water Heaters PY2019
CPUC ED Impact Evaluation $385,060 3/1/2021
Residential 2020_Residential_611
Group A Upstream and Residential Downstream Lighting PY2019
CPUC ED Impact Evaluation $956,881 3/1/2021
Commercial 2020_Commercial_557 Unitary HVAC Market Research SCE Market
Study $30,000 3/31/2021
Commercial 2020_Commercial_560 Commercial Whole Building Needs Assessment
SoCalGas Market Study $200,000 12/31/2020
Commercial 2020_Commercial_565
EE Programs' Effectiveness in California Building Standards Code Compliance
SoCalGas Market Study $150,000 6/30/2021
Commercial 2020_Commercial_566 ZNE Non-Energy Benefits SoCalGas Other $150,000 12/31/2021
Commercial 2020_Commercial_573 RCx HOPPs utilizing NMEC SDG&E Other $75,000 12/31/2020
Commercial 2020_Commercial_576
Commercial Energy Efficiency Programs Ex Ante vs. Ex Post Gap Analysis
PG&E Process Evaluation $110,000 N/A
Commercial 2020_Commercial_597
Group A HVAC A Roadmap for Accelerating the Adoption of Low-GWP Refrigerants
CPUC ED Impact Evaluation $229,000 1/31/2021
Commercial 2020_Commercial_610
Group A Small Commercial Impact Evaluation PY2019
CPUC ED Impact Evaluation $133,661 3/1/2021
Public 2020_Public_590
Public Sector Market Characterization - Financing
SoCalREN Market Study $110,000 01/29/2021
Industrial 2020_Industrial_556 Compressed Air Market Study SCE Market
Study $50,000 3/31/2021
Industrial 2020_Industrial_558 Industrial Electrification Potential
SCE Market Study $150,000 9/30/2021
Industrial 2020_Industrial_578
Process Evaluation of PG&E's Strategic Energy Management Program
PG&E Process Evaluation $100,000 5/27/2022

9
Study Sector Study ID Study Title Study
Manager Study Type Budget Completion
Date
Industrial 2020_Industrial_579
Evaluability and Process Evaluation of PG&E's Commercial Whole Building and Public Sector NMEC Program
PG&E Process Evaluation $100,000 7/1/2022
Cross-Cutting
2020_Cross-Cutting_539
Emerging Technology to Portfolio Evaluation Study
CPUC ED Other $270,000 11/25/2020
Cross-Cutting
2020_Non-Resource_540
Emerging Technology Handoff Study
CPUC ED Other $150,000 2/27/2020
Cross-Cutting
2020_Cross-Cutting_575
Comprehensive Logic Models for the Codes Standards and Crosscutting Programs
PG&E Process Evaluation $115,000 12/9/2020
Cross-Cutting
2020_Cross-Cutting_562
WE&T Study to Inform Future Trainings for WE&T
PG&E Other $100,000 N/A
Cross-Cutting
2020_Non-Resource_548
Knowledge Skills and Abilities Market Studies
CPUC ED Other $275,000 1/30/2020
Cross-Cutting
2020_Cross-Cutting_569
Feasibility Study for the Electrification of Hot Water and Space Conditioning Systems in Residential and Small Commercial
PG&E Market Study $300,000 N/A
Cross-Cutting
2020_Cross-Cutting_571
Costs and Processes of Secondary Service Upgrades in Electrification Retrofits
PG&E Market Study $100,000 6/30/2021
Cross-Cutting
2020_Non-Resource_549
ZNE Community Case Study
CPUC ED Other $485,000 10/14/2021

10
Study Sector Study ID Study Title Study
Manager Study Type Budget Completion
Date
Cross-Cutting
2020__Cross-Cutting_577
Barriers to Efficiency Program Participation for Industrial Agriculture and Large Commercial Customers
PG&E Process Evaluation $95,000 11/18/2020
Cross-Cutting
2020_Cross-Cutting_574
CALMAC and CALEE2018 Maintenance
PG&E Other $85,000 3/6/2020
Cross-Cutting
2020_Cross-Cutting_595
SoCalREN Portfolio-Level Process Evaluation
SoCalREN Process Evaluation $130,000 07/31/2021
Cross-Cutting
2020_Non-Resource_533
Assessment of Community Choice Aggregators
CPUC ED Other $137,500 12/18/2020
Cross-Cutting
2020_Non-Resource_537
Assessment of Local Government Partnerships and Regional Energy Networks
CPUC ED Other $362,500 12/31/2020

11
Table 3. Planned 2021 EM&V Studies
Study Sector Study ID Study Title Study
Manager Study Type Budget Completion
Date
Residential 2021_Residential_600
Early M&V to Inform PG&E's 2020 Savings Claims for Universal Audit Tool (UAT) (Phase 2)
PG&E Other $125,000 6/30/2023
Residential 2021_Residential_601
Statewide Early M&V to Inform 2021 Savings Claims for Home Energy Reports
PG&E Other $250,000 12/31/2023
Residential 2021_Residential_603
Barriers to Energy Efficiency Program Participation for Underserved Residential Customers
MCE Market Study $108,000 6/30/2021
Residential 2021_Residential_605 Gas Fuel Cells Market Study SoCalGas Market
Study $100,000 12/31/2021
Residential 2021_Residential_606 Consumer Behavior on Decision-Making Processes
SoCalGas Market Study $100,000 12/31/2021
Residential 2021_Residential_612 Residential EE Market Study SDG&E Market
Study $350,000 12/31/2022
Residential 2021_Residential_614
Whole Building and Measure Level Savings Estimation: Simple Structural Equation Approach
SCE Other $50,000 10/1/2021
Residential 2021_Residential_615
SCE Home Energy Report Persistence Pilot Addendum Study
SCE Market Study $40,000 10/1/2021
Commercial 2021_Commercial_599
Follow-on Market Study for Small- and Medium-sized Business (SMB) Commercial Sector
PG&E Market Study $200,000 12/31/2021
Commercial 2021_Commercial_602 ZNE Commercial GHG Emissions SoCalGas Other $50,000 12/31/2021
Commercial 2021_Commercial_604 Site-level NMEC Study for Gas SoCalGas Other $100,000 12/31/2021
Commercial 2021_Commercial_613
Market Study for Electrification Potential in Commercial Buildings
SCE Market Study $100,000 6/30/2021

12
Study Sector Study ID Study Title Study
Manager Study Type Budget Completion
Date
Commercial 2021_Commercial_617
Assessment of COVID-19 Impacts on Ventilation Usage in Nonresidential Buildings
PG&E Market Study $200,000 12/31/2021
Commercial 2021_Commercial_618
Market Assessment of Nonresidential Fuel Substitution Measures
PG&E Market Study $200,000 12/31/2021
Commercial 2021_Commercial_620 Process Evaluation of SCE's Project Review Process
SCE Process Evaluation $50,000 11/19/2021
Industrial 2021_Industrial_607 Industrial SEM Study SoCalGas Other $150,000 12/31/2021
Cross-Cutting
2021_Cross-Cutting_541
Cross-Cutting Marketing Effectiveness Study
CPUC ED Process Evaluation $1,900,000 10/30/2021
Cross-Cutting
2021_Non-Resource_543
ME&O Program Transition from IOUs to Third Parties and CCAs
CPUC ED Other $250,000 12/30/2021
Cross-Cutting
2021_Cross-Cutting_529
PY2016-2018 Codes and Standards Impact Evaluation
CPUC ED Impact Evaluation $125,000 3/30/2021
Cross-Cutting
2021_Non-Resource_530
PY2016-2018 Codes and Standards Cost Effectiveness
CPUC ED Other $2,350,000 3/30/2021
Cross-Cutting
2021_Non-Resource_544
WE&T and Installation Improvement Evaluation Study
CPUC ED Impact Evaluation $525,000 10/29/2021
Cross-Cutting
2021_Non-Resource_545
Partnerships with Training Institutions Impact Evaluation
CPUC ED Other $470,000 9/28/2021
Cross-Cutting
2021_Non-Resource_546
WE&T Career Connections Process Evaluation
CPUC ED Process Evaluation $50,000 10/12/2021
Cross-Cutting
2021_Non-Resource_547
Career and Workforce Readiness Process Evaluation
CPUC ED Process Evaluation $50,000 10/12/2021
Cross-Cutting
2021_Non-Resource_527
PY2018 SW On Bill Financing Impact Evaluation
CPUC ED Impact Evaluation $600,000 7/30/2021

13
Study Sector Study ID Study Title Study
Manager Study Type Budget Completion
Date
Cross-Cutting
2021_Non-Resource_528
PY2020 SW Small Business & Multifamily Pilot Process Evaluation
CPUC ED Process Evaluation $200,000 10/30/2021
Cross-Cutting
2021_Cross-Cutting_550
IOU and CCA Cross-Cutting Program Evaluation and Program Facilitation
CPUC ED Other $1,100,000 10/13/2021
Cross-Cutting
2021_Cross-Cutting_551
ZNE Retrofit Timelines and Costs CPUC ED Market
Study $335,000 10/14/2021
Cross-Cutting
2021_Cross-Cutting_619
Electric Cooktops Market Study
PG&E or SDG&E
Market Study $150,000 4/30/2022
Cross-Cutting
2021_Cross-Cutting_616
Improving Measure Costs for Custom Projects
PG&E Other $225,000 6/30/2022
Cross-Cutting
2021_Cross-Cutting_621
Post Transition Market Study SCE Market
Study $100,000 12/31/2021
Cross-Cutting
2021_Non-Resource_534
Assessment of Community Choice Aggregators
CPUC ED Other $166,667 12/17/2021
Cross-Cutting
2021_Non-Resource_538
Assessment of Local Government Partnerships and Regional Energy Networks
CPUC ED Other $333,333 12/17/2021

14
2 Policy & Planning 2.1 Commission Decisions The core objectives of EM&V were set out in D.09-09-047. These objectives were slightly modified in D.10-10-033, D.10-04-029 and R.09-11-014 and were recognized in D.12-11-015 to continue through 2015 activities per D.14-10-046. The core objectives are:
In 2015, D.15-10-028 changed the structure and budget cycles of energy efficiency programs and evaluation by moving to “Rolling Portfolios” that started in 2017. It provided guidance to energy efficiency PAs regarding:
D.16-08-019 described how the evaluation budgets for EM&V may shift after the IOUs’ business plan submission and reinforced the need for continuing evaluation and provided further guidance on rolling portfolio elements and objectives. This decision also adopted the schedule and timing of EM&V activities, and updated the following due dates:
The Commission decided the IOUs’ portion of the total evaluation budget may increase to 40% (maximum) from 27.5% because of an increased emphasis on 1) NMEC and Pay for Performance, and 2) up front planning for third party solicitations and market assessment associated with the market transformation and other programmatic emphasis in SB 350 and AB 802.
In D.17-09-025 the Commission set goals for energy efficiency from 2018 to 2030 and adopted aggressive but achievable goals and targets for the IOUs’ programs. The goals were established using the assessment of energy potential in the state that included the updated avoided cost calculator and greenhouse gas adder that reflects the State’s 2030 greenhouse gas reduction goals.

15
In D.18-01-004, the Commission approved the solicitation process for energy efficiency programs by requiring utilities to have a minimum of sixty percent of energy efficiency portfolio budgets designed and implemented by third parties by the end of 2022. The full decision is available at https://docs.cpuc.ca.gov/PublishedDocs/Published/G000/M205/K560/205560586.PDF.
Resolution E-5082 approves the Database for Energy-Efficiency Resources (DEER) updates for program year 2022 and a revised version for program year 2021 and 2020. The resolution addresses upcoming transitions for DEER and workpaper system operation. The full resolution can be found at https://docs.cpuc.ca.gov/PublishedDocs/Published/G000/M346/K161/346161639.PDF.
In D. 20-11-013, the Commission imposed a moratorium on the award payments issued through the Efficiency Savings and Performance Incentive Mechanism (ESPI) beginning with the 2021 program year. The decision is available at https://docs.cpuc.ca.gov/PublishedDocs/Published/G000/M351/K056/351056387.PDF.

16
3 Residential 3.1 Residential Portfolio of Programs The residential portfolio of programs includes the following:
• Behavioral Program • Direct Install • Electrification • Energy Advisor • Energy Efficiency Kits • Green Labeling • Home Intel • Home Upgrade
• HVAC • Integrated Demand-Side Management • Lighting • Marketplace • Multifamily Energy Efficiency Rebates • Pay-for-Performance • Plug Load and Appliances • Residential New Construction
Please note that some of these programs may be discontinued in the future. For questions, contact CPUC ED and PA staff. Refer to the CEDARS website for details regarding program budgets and anticipated energy savings and demand reductions for each PA.2
3.2 2019 and 2020 EM&V Studies Table 4 summarizes the 2019 and 2020 Residential EM&V studies (including details regarding budgets and timing) for studies managed by the CPUC ED and PAs. These studies include impact evaluations of the 2019 and 2020 programs as well as process evaluations, market studies, and other research efforts active during 2019 and/or 2020. More detailed information on these studies including study descriptions and objectives are available in the 2019 Energy Division & Program Administrator Energy Efficiency Evaluation, Measurement and Verification Plan Version 9 available on the Public Document Area here: https://pda.energydataweb.com/#!/. Detailed information on past and current studies can also be found on the searchable Project Status Reporting site located here: https://psr.energydataweb.com/.
Table 4. 2019 and 2020 Residential EM&V Studies Summary
Study ID Study Title Study Manager Study Type Budget Completion
Date
2019_Residential_511
SCE Home Energy Reports (HERs) Behavior Persistence Analysis
SCE Market Study $92,200 9/15/2020
2019_Residential_518
SDG&E Home Energy Reports (HERs) Behavior Persistence Analysis
SDG&E Market Study $50,000 N/A
2019_Residential_519 Statewide Residential Workpapers Update SDG&E Other $100,000 N/A
2019_Residential_552
Group A Impact Evaluation of HVAC ESPI Measures PY2018
CPUC ED Impact Evaluation $1,157,488 3/1/2020
2 CEDARS website: https://cedars.sound-data.com/

17
Study ID Study Title Study Manager Study Type Budget Completion
Date
2019_Residential_554
Group A Impact Evaluation of Home Energy Reports PY2018 (HERs; PY 2017)
CPUC ED Impact Evaluation $505,000 3/1/2020
2019_Residential_555
Group A Impact Evaluation of Lighting Non-Residential Midstream and Downstream PY2018
CPUC ED Impact Evaluation $426,000 12/31/2020
2019_Residential_585
Group A Impact Evaluation of Upstream and Residential Downstream Lighting PY2018
CPUC ED Impact Evaluation $727,000 3/1/2020
2019_Residential_586 Group A Impact Evaluation of Smart Thermostats PY2018
CPUC ED Impact Evaluation $130,000 3/1/2020
2019_Residential_587 Group A Impact Evaluation of Pool Pumps PY2018
CPUC ED Impact Evaluation $100,000 3/1/2020
2019_Residential_588
Group A Impact Evaluation of Hot Water Savings Fixtures PY2018
CPUC ED Impact Evaluation $100,000 12/31/2020
2019_Residential_591 Group E Market Adoption Characteristics Study
CPUC ED Market Study $461,500 2/1/2021
2020_Residential_559
Bill Salience Customer Attention and Behavior Response Analysis
SCE Market Study $100,000 9/30/2021
2020_Residential_561
Market Study to Inform Future Whole House Retrofit Programs
PG&E Market Study $100,000 12/31/2021
2020_Residential_563
California Multifamily Boiler Market Assessment Study - Phase II
SoCalGas Market Study $200,000 6/30/2021
2020_Residential_568 IDSM & EE+DR Load Impact Methodology SDG&E Other $150,000 12/31/2020
2020_Residential_570 IDSM & EE+DR Cost Effective Methodology
SDG&E Other $150,000 12/31/2020
2020_Residential_572 IDSM & EE+DR Specific to control management
SDG&E Other $250,000 12/31/2020

18
Study ID Study Title Study Manager Study Type Budget Completion
Date
2020_Residential_580
Early M&V to Inform PG&E's 2019-20 Home Energy Reports Savings Claims
PG&E Other $98,200 8/31/2022
2020_Residential_581
Early M&V to Inform PG&E's 2019 Savings Claims for Universal Audit Tool (UAT) Phase One
PG&E Other $150,000 6/24/2022
2020_Residential_593 Group E EE Potential Study CPUC ED Other $1,000,000 4/30/2021
2020_Residential_596 SoCalREN Multifamily Program Process Evaluation
SoCalREN Process Evaluation $130,000 07/31/2021
2020_Residential_598 Population NMEC Comparison Group Assessment
PG&E Other $98,600 4/30/2021
2020_Residential_608 Group A Impact Evaluation of Smart Thermostats PY2019
CPUC ED Impact Evaluation $719,500 3/1/2021
2020_Residential_609
Group A Impact Evaluation of Residential Water Heaters PY2019
CPUC ED Impact Evaluation $385,060 3/1/2021
2020_Residential_611
Group A Upstream and Residential Downstream Lighting PY2019
CPUC ED Impact Evaluation $956,881 3/1/2021
Source: Program Administrators, CPUC ED and their consultants via https://psr.energydataweb.com/

19
3.3 Planned 2021 EM&V Studies Table 5 summarizes the residential sector EM&V studies planned for 2021.
Table 5. Planned 2021 Residential Sector EM&V Studies Summary
Study ID Study Title Study Manager Study Type Budget Completion
Date
2021_Residential_600
Early M&V to Inform PG&E's 2020 Savings Claims for Universal Audit Tool (UAT) (Phase 2)
PG&E Other $125,000 6/30/2023
2021_Residential_601 Statewide Early M&V to Inform 2021 Savings Claims for Home Energy Reports
PG&E Other $250,000 12/31/2023
2021_Residential_603
Barriers to Energy Efficiency Program Participation for Underserved Residential Customers
MCE Market Study $108,000 6/30/2021
2021_Residential_605 Gas Fuel Cells Market Study SoCalGas Market
Study $100,000 12/31/2021
2021_Residential_606 Consumer Behavior on Decision-Making Processes SoCalGas Market
Study $100,000 12/31/2021
2021_Residential_612 Residential EE Market Study SDG&E Market
Study $350,000 12/31/2022
2021_Residential_614
Whole Building and Measure Level Savings Estimation: Simple Structural Equation Approach
SCE Other $50,000 10/1/2021
2021_Residential_615 SCE Home Energy Report Persistence Pilot Addendum Study
SCE Market Study $40,000 10/1/2021
Source: Program Administrators, CPUC ED and their consultants via https://psr.energydataweb.com/

20
The tables below provide further detail regarding each of the studies in Table 5 above.
Table 6. Study Description: Early M&V to Inform PG&E’s 2020 Savings Claims for Universal Audit Tool (UAT) (Phase 2)
Study Title: Early M&V to Inform PG&E's 2020 Savings Claims for Universal Audit Tool (UAT)
(Phase 2) Budget: $125,000
Completion Date: Q2 2023 Study Manager: PG&E
Description: The Universal Audit Tool (UAT) is an online survey designed to identify no- and low-cost energy savings actions that renters and homeowners can undertake to save electricity and natural gas consumption in their homes. Branded by PG&E as Home Energy Checkup (HEC) the UAT provides residential customers with advice tips and suggestions for saving both energy and money based on responses customers provide to an online survey regarding household appliances occupancy and other dwelling characteristics. This Phase 2 study is a follow-on to the previous Early M&V that estimated savings for 2018 while the focus of the current study is designed to inform PG&E savings claims for UAT for 2019. Objective: This Phase 2 study has four main objectives: 1. Assess the feasibility to claim demand savings (MW) using a quasi-experimental design (QED) methodology; 2. Calculate MW savings if feasible; 3. Conduct Early M&V to substantiate 2020 savings claim on the basis of savings observed in 2019 participants; and 4. Estimate minimum sample sizes needed for savings claims at different statistical confidence levels. Key Research Questions: Is it feasible to claim demand savings (MW) when a comparison group is specified using quasi-experimental design (QED) based on the 2020 DEER peak period? The 2020 DEER peak period is called Peak Megawatt Load Reduction or PMLR. At the start of 2020 the peak period definition changed to 4 PM to 9 PM and using the three contiguous weekdays identified as representing the majority of UAT participants within an IOU using the approach developed by Nexant and adopted by DNV GL for the HER measure. If the feasibility test for measuring PMLR is successful what is the calculated MW savings for the most recent period for savings reporting purposes if available? What is the estimated 2020 savings claim for the most recent 12-month period based on Early M&V for UAT? What are estimated minimum number of completes (for gas and electric customers) needed for detecting savings with statistical significance at the 80% and 90% confidence intervals? Potential EM&V Methods: Quasi-experimental design with propensity score matching to identify comparison groups. Difference-of-differences calculation for group comparisons. Monte Carlo simulations to estimate minimum sample sizes.

21
Table 7. Study Description: Statewide Early M&V to Inform 2021 Savings Claims for Home Energy Reports
Study Title: Statewide Early M&V to Inform 2021 Savings Claims for Home Energy Reports Budget: $250,000
Completion Date: Q4 2023 Study Manager: PG&E
Description: Behavior programs have evolved to become the core of the savings claims for the residential portfolio and the Home Energy Reports (HER) measure is its foundation. Given its centrality to the residential portfolio, PG&E, SCE, and SDG&E (the IOUs) believe that two key regulatory developments underscore the ongoing need for research to inform HER ex-ante and ex-post savings claims. The first development is contained in Ordering Paragraph 2 (OP2) of the Decision Implementing Energy Efficiency Goals for 2020-2022 Decision 19-08-034 issued August 23, 2019 which suspends the requirement for ex-post evaluations of the HER Program for three years or until the Commission reinstates this requirement by ruling. The second development is the change made to the DEER peak megawatt load reduction (PMLR) definition used in energy efficiency portfolio planning reporting and evaluation that shifts the peak hours from 2 p.m.-5 p.m. to 4 p.m.-9 p.m. that became effective for 2020. Objective: -Update the savings load shapes for current HER waves to inform electric (kWh) savings critical for calculating cost effectiveness of the HER measure -Calculate peak load savings (kW) (PMLR) for the HER measure for 2021-Substantiate 2021 unadjusted savings estimates of the 3P implementer-Conduct Early M&V to estimate adjusted savings for the basis of each IOUs final ex-post savings claim -Provide ad hoc research necessary for ongoing maintenance of the HER program. Key Research Questions: What are the aggregated savings load shapes for the HER measure at each IOU, and how can existing DEER load shapes be aggregated to approximate these load shapes? What is the peak load savings (PMLR) for the HER measure at each utility? How do independent calculations of kWh kW and therms compare to the unadjusted savings calculations made by the third-party implementer of HER? What is the difference in participation rates in HER treatment groups and HER control groups and what adjustments to unadjusted savings estimates should inform ex-post savings to be used for regulatory reporting purposes to avoid double-counting of savings in HER savings claims? What are the savings holdbacks that each IOU should make from future ex-ante savings claims to minimize potential ex-ante/ex-post gaps in reported savings? Potential EM&V Methods: Program impact will use a lagged dependent variable model; Examine joint savings with downstream measures.

22
Table 8. Study Description: Barriers to Energy Efficiency Program Participation for Underserved Residential Customers
Study Title: Barriers to Energy Efficiency Program Participation for Underserved Residential
Customers Budget: $119,112
Completion Date: Q4 2021 Study Manager: MCE
Description: MCE’s energy efficiency programs tend to serve a predictable demographic despite efforts to broaden its program offerings to reach traditionally underserved customer groups. The reasons behind this are poorly understood within MCE’s service area. Additionally, given that COVID-19 poses a greater threat to underserved communities MCE sees the need to understand how its energy efficiency programs can alleviate some of the pervasive challenges that are faced by these communities. Objective:
• To determine specific recommendations to bring energy efficiency to underserved communities.
• To understand the value of energy efficiency services and products within underserved communities.
• To commit to inclusive practices by ensuring future program designs meet the needs of the intended beneficiaries.
• Improve communications and understand what clean energy technologies would provide a benefit and what the benefit is, particularly for underserved customer groups.
• Identify pathways for advancing energy efficiency in underserved communities, while also fulfilling a mandate to deliver a cost-effective portfolio.
Key Research Questions: 1. Which member communities are aware and knowledgeable of MCE’s EE programs? 2. How effective are MCE’s marketing channels, campaigns, and collateral in communicating
MCE’s program offering and engaging with underserved communities? 3. Are current coordination activities between MCE, PG&E, and BayREN leading to the effective
delivery of unique program solutions to HTR/DACs/underserved? 4. What are the significant barriers and opportunities to participation, awareness, reach? 5. How do we overcome significant barriers to energy efficiency? 6. How do we design holistic programs to address the energy efficiency needs of MCE’s residential
customer base? What are the most impactful EE measures? 7. How can MCE increase investments for programs designed to address the needs of underserved
communities while minimizing costs? 8. Are there gaps that MCE’s residential programs should fill? 9. What factors are preventing underserved customers from participating?
a. Lack of awareness b. Process hurdles c. Financial considerations d. Misconceptions or poor perceptions around EE programs e. Housing conditions f. Other reasons to be discovered

23
Study Title: Barriers to Energy Efficiency Program Participation for Underserved Residential
Customers Budget: $119,112
Potential EM&V Methods: • Focus groups for customers • Implementer and program manager interviews • Market research • Review of program documentation • Literature review
Table 9. Study Description: Gas Fuel Cells Market Study
Study Title: Gas Fuel Cells Market Study Budget: $100,000
Completion Date: Q4 2021 Study Manager: SoCalGas
Description: This market study will examine the gas fuel cell market sensitivity on its technology, costs, potential, benefits, and barriers. Objective: To explore the potential of gas fuel cells as a widely adopted source of energy generation in the residential sector, including the identification of barriers to adoption, benefits beyond the residential sector, and cost impact. Key Research Questions:
1. What is the current state of gas fuel cell technology? 2. What are current costs and project mature market pricing of gas fuel cell technology for the
residential sector? 3. What are ideal target markets, and what is their market potential? 4. What is the estimated full fuel cycle efficiency and emissions performance, including GHG
emissions relative to other electric generation sources? 5. What is the co-generation potential and benefits in water heating applications? 6. What are potential grid benefits as a distributed generation resource? 7. What are the technical, safety, and market barriers that must be overcome?
Potential EM&V Methods: Literature review, expert survey/interview, cost analysis.
Table 10. Study Description: Consumer Behavior on Decision-Making Processes
Study Title: Consumer Behavior on Decision-Making Processes Budget: $100,000
Completion Date: Q4 2021 Study Manager: SoCalGas
Description: With the multitude of gas measures available on the market along with differing fuel types this study will explore the current residential market of water heater and barbeque grill measures and examine the decision-making processes. Objective: To provide insights on consumer behavior when it comes to why consumers choose certain type of measures over others. It will also analyze market conditions, consumer perceptions, market sensitivity, and future outlooks especially with the impact of COVID-19.

24
Study Title: Consumer Behavior on Decision-Making Processes Budget: $100,000
Key Research Questions: 1. What factors influence gas customers to switch from traditional water heaters to tankless water heaters? 2. What is the range of actual savings resulting from switching from a traditional water heater to a tankless water heater? 3. What is the current market mix of barbeque grills by fuel source and how has it changed in the past five to ten years? 4. How are LP (liquid propane) grills marketed? 5. What is the consumer's perception of gas vs LP-fired barbeque grills? 6. What are the benefits of gas over LP-fired grills? 7. What factors lead consumers to choose LP over gas-fired barbeque grills? 8. How likely are customers to choose gas over LP when presented with the benefits of gas grills over LP grills? 9. How should the impact of COVID-19 be addressed in the residential sector?
Potential EM&V Methods: Literature review customer online surveys and/or in-depth interviews.
Table 11. Study Description: Residential EE Market Study
Study Title: Residential EE Market Study Budget: $350,000
Completion Date: Q4 2021 Study Manager: SDG&E
Description: Residential customers are targeted for more conservation every year due to demands on the grid. Technology has also progressed leading to more calibration and continuous development of smart appliances. However, it is unclear how these improvements have benefited and translated to customer implementation. Additionally the move to third-party energy efficiency programs has likely left some populations ineligible for residential EE programs (for example mobile customers without individual meters).The objective of this study is to assess the current state of residential customers and understand their wants and needs to help inform potential program offerings such as the statewide Plug Load & Appliance (PLA) program. The study will also explore gaps in residential program offerings and identify the most effective ways to engage with these customers (distribution channel communication methods etc.). Objective: Assess energy efficiency wants and needs for residential customers (including those in disadvantaged communities (DAC) and hard-to-reach (HTR) customers) Identify populations that are ineligible for residential EE programs Identify gaps in residential program offerings and identify most effective ways to engage with these customers Identify key market barriers and opportunities for energy efficiency savings for each customer segment Create actionable data-driven recommendations.

25
Study Title: Residential EE Market Study Budget: $350,000
Key Research Questions: Key Research Questions: 1. What are the customers’ requirements and priorities for new equipment purchases or upgrades? 2. What are the specific challenges customers face in monitoring and controlling their energy use and demand? 3. Are there residential customer segments that are not being served by current residential EE programs? a. If so, how can IOUs and third-party implementers address these gaps in residential offerings? 4. How should current program offerings be tailored to better address the wants/needs/barriers/perceptions and priorities of the customer segments identified in this study? a. Which distribution channels (retail midstream etc.) have been the most successful at reaching residential customers? How does this differ by customer type (DAC/HTR single family homes multifamily etc.)? b. Which communication methods have resulted in the highest customer participation for each customer type? 5. What opportunities exist for new program offerings that address unmet needs and wants of residential customers (e.g. new services technologies)? Potential EM&V Methods: Literature review residential customer surveys in-depth interviews with subject matter experts.
Table 12. Study Description: Whole Building and Measure Level Savings Estimation: Simple Structural Equation Approach
Study Title: Whole Building and Measure Level Savings Estimation: Simple Structural Equation
Approach Budget: $50,000
Completion Date: Q4 2023 Study Manager: SCE
Description: This research will be applicable to large N residential programs with multiple measures. The study is primarily methodological and is meant to illustrate and explore the advantages of an alternative to current EE methods involving a “pre-weather-normalization -fixed effects - t-test between groups” approach to EE evaluations’ tracking regression work. The ESA 2015-2017 impact study is taken as a ready example. Objective: The study will investigate: a largely fixed effects alternative to a wholesale fixed effects approach; the advantages of having weather participate in estimation equations rather than “pre-normalization” a critical issue; the advantages of a reliable and very readily available covariate (ecological adjustment) in the form of (e.g.) Census tract cohabitant service accounts. One of the “secondary” issues that we have identified in current practice is possibly fundamental to savings mis-estimation.

26
Study Title: Whole Building and Measure Level Savings Estimation: Simple Structural Equation
Approach Budget: $50,000
Key Research Questions: Many of the questions addressed are methodological in nature. 1. Does the method happen to reach similar estimates vs. those of the received study? Is there demonstrably increased accuracy and reliability in using “close control” in the form of ecological usage averages (among nearby customers facing the same weather and general economic conditions)? As suggested in Chapter 8 Uniform Methods Protocol NREL 2017 some sets of comparison/control households may effectively yield “adjusted gross” savings as part of the ecological adjustment while others’ economic straits or previous/later participation statuses making them more similar to current participants will yield “net” savings (quotes meaningful!). Do these speculations appear to hold, and can a small survey verify this to some extent? Does optimized matching (another current favorite) compare to the reliable ecological covariate? 2. The study will be investigating standardization of both the participants’ usage and the neighbors’ “control” usage upon each participant’s mean pre-program usage. It will assess whether this leads to better estimates, i.e. addresses the general EE evaluation problem of heteroscedastic error. 3. Demonstrate the facility with which this method allows examination of new weather scenarios altered planning assumptions regarding target and program content. Potential EM&V Methods: Rebuilding and amending to build analysis data sets re-analysis. Discussion with SCE to decide upon a priori significance/substance tests possible net-to-gross survey or analysis of existing ESA participant tracking data.
Table 13. Study Description: SCE Home Energy Report Persistence Pilot Addendum Study
Study Title: SCE Home Energy Report Persistence Pilot Addendum Study Budget: $40,000
Completion Date: Q4 2021 Study Manager: SCE
Description: This is an addendum study related to Southern California Edison’s (SCE’s) Persistence Pilot which was evaluated in 2020. This secondary study will assess the energy savings of customers who have resumed treatment with home energy reports (HERs) after a twenty-month pause. The Persistence Pilot was launched in October 2018 within SCE’s “Wave 3” HER cohort which began treatment in September 2015. Customers in the discontinued group resumed treatment in June 2020 twenty months. This addendum study aims to compare energy savings between customers with and without a pause in treatment and will cover the time period from June 2020 through May 2021. Objective: The primary objective of the Persistence Pilot is to understand what happens to customer behavior and energy savings if customers stop receiving paper HERs. This addendum study will examine what happens to customer behavior after treatment with paper HERs resumes after a 20-month pause. The addendum study period will cover the time period from June 2020 through May 2021. Key Research Questions: 1. Do energy savings of discontinued customers return to that of continued customers after one year of resumed treatment with paper HERs? 2. Which types of customers show the greatest increase in savings after resuming treatment? 3. Did energy savings continue to decline for any groups of discontinued customers? Additional optional tasks include: 4. Further causal forest analysis (continuation from prior evaluation with a narrower focus on savings persistence)
Potential EM&V Methods: Randomized controlled trial regression modeling causal forest analysis.

27
3.4 Ex Ante Coordination Ex ante processes (including DEER updates and workpaper review) incorporate data and results from the latest EM&V studies. This section highlights the ex-ante values that are relevant to this sector. 3.4.1 Summary of DEER Updates For the residential sector, DEER updates for 2019 include:3
• A limited number of NTG values are updated base on recent EM&V findings. • LED lighting is established as the standard practice baseline for normal replacement, new
construction and replace-on-burnout measures. • Industry Standard Practice (ISP) baselines and new measure tiers for small residential storage
and instantaneous water heaters have been established. • Net-to-Gross methodology has been updated to include treatment of measure utilizing existing
conditions baselines rather than code/standard practice baseline in the case of accelerated replacement (AR) measure application type or a normalized metered energy consumption (NMEC) savings estimation approach.
• The available measure application types, delivery types, and measure impact types were updated to reflect E 4818. The final lists and associated acronyms for the revised codes are shown in Resolution E-4952, Section 5.6
• EUL/RUL policy for add-on equipment and Behavioral, Operational and Retrocommissioning (BRO) measures. EUL update for screw-in LED A-lamps.
• The below-code NTG adjustment factor for accelerated replacement (AR) applications has been suspended, effective 2019-01-01 and lasting indefinitely
Residential sector DEER updates for 2020 include:4
• Peak demand savings and lighting HVAC interactive effects have been updated for all previous DEER measures with no expiration date, or with an expiration date after December 31, 2019.
• New measures have been added for electrically commutated motors (ECM) in residential and commercial furnace units.
• Miscellaneous corrections include an error in residential window area in DEER2017 and an error with fan power in residential two speed air handlers.
• Several residential shell updates in the 2019 Title-24 have been incorporated. • Non-residential upstream packaged HVAC and maintenance measures NTG values are update
based on recent evaluation results. • The numerous building vintage classifications used in previous DEER versions have been
consolidated into "Old," "Median," "Recent," and "New" classifications. • As a result of the transition to 100% LED baseline, the existing screw-in lamp and screw-in
fixture measures – both workpaper and DEER measures - will be expired 12/31/2019. • All workpapers will be statewide for 2020 and beyond. • Consolidate savings by climate zone to eliminate PA-specific records. • Missing RCA measures added to DEER 2020. • Removed DEER 2020 measures which had been previously expired but never removed.
3 Source: http://www.deeresources.com/index.php/deer-versions/deer2018 4 Source: http://www.deeresources.com/index.php/deer-versions/deer2020

28
Residential sector DEER updates for 2021 include:5
• Further review and assessment of lighting measures • Smart controllable thermostats • Update and correct water heater calculators • Correct duct sealing measure EUL • Review on-bill-finance NTGR
Residential sector DEER updates for 2022 include:6
• Modifications to accommodate load shape updates • Effective useful life (EUL) update process revision • Residential heat pumps for SEER >19
3.4.2 Summary of Uncertain Measure Updates The tables below identify residential measures and parameters on the 2019 and 2020 Uncertain Measures lists.
Table 14. 2019 Uncertain Measures Residential Sector
Market Sectors Measure Group
Ag, Com, Ind, Res Lighting Outdoor LED Fixture Com, Res HVAC Maintenance Com, Res HVAC RCA Com, Res Lighting Indoor LED Fixture Com, Res Lighting Indoor LED Lamp Com, Res Lighting Indoor LED Reflector Lamp Com, Res Water Heating Tankless Water Heater Res HVAC Duct Sealing Res HVAC Motor Replacement Res Water Heating Controls Res Water Heating Storage Water Heater
Source: Final 2019 Uncertain Measure List Memo, https://pda.energydataweb.com/#!/documents/2100/view
5 Source: http://deeresources.com/index.php/deer-versions 6 Source: https://docs.cpuc.ca.gov/PublishedDocs/Published/G000/M346/K161/346161639.PDF

29
Table 15. 2020 Uncertain Measures Residential Sector (provided for informational purposes)
Market Sectors Measure Group
Res, Com HVAC Coil Cleaning Res HVAC Controls Smart Thermostat Res HVAC Economizer Repair Res HVAC Maintenance Res HVAC RCA Res HVAC Rooftop HP System Res HVAC Split HP System Res Pool Pump Res Water Heating HPWH
Source: 2020 Uncertain Measures List Memo, https://pda.energydataweb.com/#!/documents/2305/view
3.4.3 Program Administrators’ Workpaper Submissions Planned workpapers, and updates to existing workpapers for the upcoming portfolio cycle are submitted to Commission staff and reviewed and logged. These workpapers often use DEER data and/or methodology to add technologies that are not in DEER to the energy efficiency portfolio. Table 16 and Table 17 summarize the quantity of annual residential workpaper submissions by end-use category and IOU. Appendix C provides the workpaper locations where more information and the papers themselves can be found.
Table 16. 2019 Residential Sector Workpaper Submissions by End-Use Category and IOU
IOU
PG&E SCE SCG SDG&E Appliance or Plug Load 5 1 HVAC 12 2 1 1 Lighting 8 Recreation 1 Service and Domestic Hot Water 9 1 2
Source: CPUC Workpaper and Disposition Archive, http://www.deeresources.net/workpapers
Table 17. 2020 Residential Sector Workpaper Submissions by End-Use Category and IOU
IOU
PG&E SCE SCG SDG&E Appliance or Plug Load 1 4 Building Envelope 1 Commercial Refrigeration 1 HVAC 2 6 Lighting Pool and Spa Equipment Recreation 1 Service 1

30
IOU
PG&E SCE SCG SDG&E Service and Domestic Hot Water 2 2 10 Whole Building 2
Source: CPUC Workpaper and Disposition Archive, http://www.deeresources.net/workpapers

31
4 Commercial 4.1 Commercial Portfolio of Programs
The commercial portfolio of programs includes the following:
• Calculated Incentives • Commercial HVAC • Continuous Energy Improvement • Customer Services • Energy Advisor • Marketing, Education, and Outreach
(ME&O)
• New Financing Offerings • On Bill Repayment (OBR) Small Business
Lease Providers Pilot • OBR Small Business Loan Pilot • OBR for Medium and Large Business • Lighting Innovation • Savings by Design
Please note that some of these programs may be discontinued in the future. For questions, contact CPUC ED and PA staff. Please refer to the CEDARS website for details regarding program budgets and anticipated energy savings and demand reductions for each PA.7
4.2 2019 and 2020 EM&V Studies Table 18 summarizes the 2019 and 2020 commercial sector EM&V studies including details regarding budgets and timing. These studies include impact evaluations of the 2019 and 2020 programs as well as process evaluations, market studies and other research efforts active during 2019 and/or 2020. More detailed information on these studies including study descriptions and objectives are available in the 2019 Energy Division & Program Administrator Energy Efficiency Evaluation, Measurement and Verification Plan Version 9 available on the Public Document Area here: https://pda.energydataweb.com/#!/documents/2325/view.
Detailed information on past and current studies can also be found on the searchable Project Status Reporting site located here: https://psr.energydataweb.com/
7 CEDARS website: https://cedars.sound-data.com/

32
Table 18. 2019 and 2020 Commercial Sector EM&V Studies Summary
Study ID Study Title Study Manager Study Type Budget Completion
Date
2019_Commercial_512 Statewide Non-Residential Workpaper Support SCE Market
Study $75,000 N/A
2019_Commercial_513 Statewide Commercial Market Characterization Study
SCE Market Study $150,000 N/A
2019_Commercial_520 Deemed Measure Costs for Custom Projects & Programs SDG&E Market
Study $145,000 N/A
2019_Commercial_525 Commercial Whole Building Demonstration Joint Study Report
PG&E Other $80,868 5/1/2019
2019_Commercial_ 535
Statewide Interior Lighting Study SCE Market
Study $82,725 9/30/2019
2019_Commercial_582 2018-19 Custom Industrial Agricultural and Commercial (CIAC) Impact Evaluation
CPUC ED Impact Evaluation $5,045,000 4/1/2021
2019_Commercial_584 2018 Small/Medium Commercial Sector Deemed ESPI Impact Evaluation
CPUC ED Impact Evaluation $1,156,000 3/1/2020
2019_Commercial_589
Group A 2017 and 2018 Nonresidential Downstream Program Performance Assessment
CPUC ED Impact Evaluation $600,000 12/31/2020
2020_Commercial_557 Unitary HVAC Market Research SCE Market
Study $30,000 3/31/2021
2020_Commercial_560 Commercial Whole Building Needs Assessment SoCalGas Market
Study $200,000 12/31/2020
2020_Commercial_565 EE Programs' Effectiveness in California Building Standards Code Compliance
SoCalGas Market Study $150,000 6/30/2021
2020_Commercial_566 ZNE Non-Energy Benefits SoCalGas Other $150,000 12/31/2021 2020_Commercial_573 RCx HOPPs utilizing NMEC SDG&E Other $75,000 12/31/2020
2020_Commercial_576 Commercial Energy Efficiency Programs Ex Ante vs. Ex Post Gap Analysis
PG&E Process Evaluation $110,000 N/A
2020_Commercial_597 Group A HVAC A Roadmap for Accelerating the Adoption of Low-GWP Refrigerants
CPUC ED Impact Evaluation $229,000 1/31/2021
2020_Commercial_610 Group A Small Commercial Impact Evaluation PY2019 CPUC ED Impact
Evaluation $133,661 3/1/2021
Source: Program Administrators, CPUC ED and their consultants via https://psr.energydataweb.com/
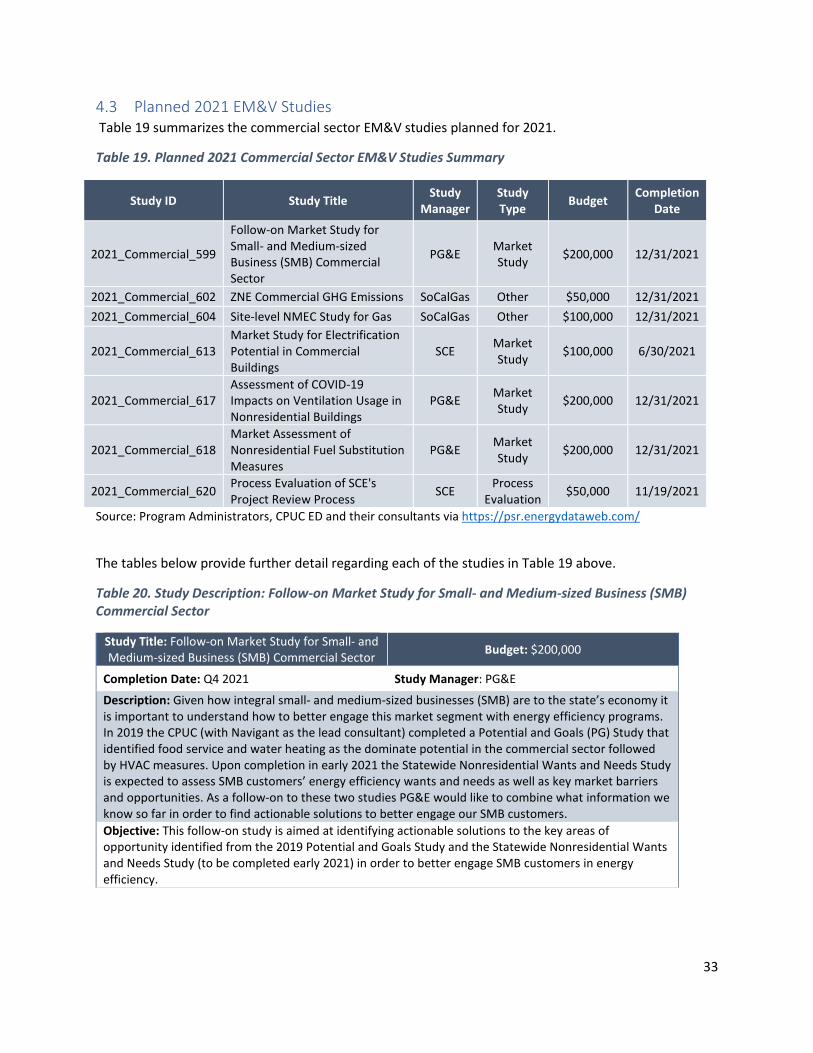
33
4.3 Planned 2021 EM&V Studies Table 19 summarizes the commercial sector EM&V studies planned for 2021.
Table 19. Planned 2021 Commercial Sector EM&V Studies Summary
Study ID Study Title Study Manager
Study Type Budget Completion
Date
2021_Commercial_599
Follow-on Market Study for Small- and Medium-sized Business (SMB) Commercial Sector
PG&E Market Study $200,000 12/31/2021
2021_Commercial_602 ZNE Commercial GHG Emissions SoCalGas Other $50,000 12/31/2021 2021_Commercial_604 Site-level NMEC Study for Gas SoCalGas Other $100,000 12/31/2021
2021_Commercial_613 Market Study for Electrification Potential in Commercial Buildings
SCE Market Study $100,000 6/30/2021
2021_Commercial_617 Assessment of COVID-19 Impacts on Ventilation Usage in Nonresidential Buildings
PG&E Market Study $200,000 12/31/2021
2021_Commercial_618 Market Assessment of Nonresidential Fuel Substitution Measures
PG&E Market Study $200,000 12/31/2021
2021_Commercial_620 Process Evaluation of SCE's Project Review Process SCE Process
Evaluation $50,000 11/19/2021
Source: Program Administrators, CPUC ED and their consultants via https://psr.energydataweb.com/
The tables below provide further detail regarding each of the studies in Table 19 above.
Table 20. Study Description: Follow-on Market Study for Small- and Medium-sized Business (SMB) Commercial Sector
Study Title: Follow-on Market Study for Small- and Medium-sized Business (SMB) Commercial Sector Budget: $200,000
Completion Date: Q4 2021 Study Manager: PG&E
Description: Given how integral small- and medium-sized businesses (SMB) are to the state’s economy it is important to understand how to better engage this market segment with energy efficiency programs. In 2019 the CPUC (with Navigant as the lead consultant) completed a Potential and Goals (PG) Study that identified food service and water heating as the dominate potential in the commercial sector followed by HVAC measures. Upon completion in early 2021 the Statewide Nonresidential Wants and Needs Study is expected to assess SMB customers’ energy efficiency wants and needs as well as key market barriers and opportunities. As a follow-on to these two studies PG&E would like to combine what information we know so far in order to find actionable solutions to better engage our SMB customers. Objective: This follow-on study is aimed at identifying actionable solutions to the key areas of opportunity identified from the 2019 Potential and Goals Study and the Statewide Nonresidential Wants and Needs Study (to be completed early 2021) in order to better engage SMB customers in energy efficiency.

34
Study Title: Follow-on Market Study for Small- and Medium-sized Business (SMB) Commercial Sector Budget: $200,000
Key Research Questions: 1. What are specific areas of potential among SMB customers? 2. What are upstream midstream and downstream opportunities? 3. What are the emerging technologies that exist? 4. What are the actionable solutions that inform program designs and better engage SMB customers? 5. What are key market barriers not identified?
Potential EM&V Methods: Literature review; data collection and analysis.
Table 21. Study Description: ZNE Commercial GHG Emissions
Study Title: ZNE Commercial GHG Emissions Budget: $50,000
Completion Date: Q4 2021 Study Manager: SoCalGas
Description: This study is part of the recommendations from the ZNE Commercial Market Characterization study that is being done by TRC. It will identify if there is an overlap between achieving ZNE and reducing GHG emissions as the State of California has intensified a focus on GHG reduction while prioritizing energy efficiency over renewable energy to achieve ZNE. Objective: To revisit ZNE to meet GHG emissions from a mixed fuel perspective with an emphasis on healthcare mixed use private college hotel and food service segments. This study will help to address GHG objectives and align GHG and ZNE goals. Key Research Questions: 1. What are the options for achieving ZNE in prototype buildings and what is their impact on GHG? 2. What ZNE strategies may have a larger impact than others on GHG emission in various scenarios with different efficiency measures? 3. Should GHG reductions and decarbonization be pursued on a least cost basis for ZNE buildings? What solutions involving advanced technologies and strategies can be critical to lower costs for ZNE buildings?
Potential EM&V Methods: Literature review cost and energy consumption analysis.
Table 22. Study Description: Site-level NMEC Study for Gas
Study Title: Site-level NMEC Study for Gas Budget: $100,000
Completion Date: Q4 2021 Study Manager: SoCalGas
Description: Site-level gas NMEC models in large commercial buildings often fail the goodness of fit criteria described in CPUC’s NMEC Rulebook 2.0 because of the low gas use periods in summer months. This study would review this issue in detail and propose appropriate approaches to accurately model natural gas use commercial buildings. Objective: To explore issues around gas NMEC as well as the impacts of COVID-19 on gas models. The problem is severe for models based on monthly data but also affects models based on shorter time interval data. In general energy modeling for gas has received less attention than for electricity. The problem stems from the type of goodness of fit metrics recommended or the available modeling algorithms used. This prevents otherwise good gas savings projects from participating in site-level NMEC programs.

35
Study Title: Site-level NMEC Study for Gas Budget: $100,000
Key Research Questions: 1. What are the issues for gas NMEC models in large commercial buildings (when compared to electricity) when considering the goodness of fit criteria described in the CPUC's NMEC Rulebook 2.0? 2. What are appropriate methods to accurately model gas use in commercial buildings? 3. How should the impact of COVID-19 be addressed in NMEC gas models? 4. How have other organizations addressed the impact of COVID-19 on NMEC gas models? Potential EM&V Methods: Literature (rule book public data) review on-site surveys energy consumption analysis.
Table 23. Study Description: Market Study for Electrification Potential in Commercial Buildings
Study Title: Market Study for Electrification Potential in Commercial Buildings Budget: $100,000
Completion Date: Q4 2021 Study Manager: SCE
Description: This project is a Market Study for Electrification Potential in Commercial Buildings which will help SCE establish a strategy to encourage Building Electrification among its commercial customers. Objective: SCE has a need to understand the market potential for BE among its commercial customers; specifically, by taking a stock of all-electric buildings among its commercial customers so it can target its BE program efficiently. This can be achieved by taking stock of all-electric vs. mixed-fuel facilities and learn about successes and concerns in SCE's commercial sector. Key Research Questions: 1. What is the mix of all-electric vs. mixed-fuel use buildings among SCE’s commercial customers? 2. Which factors influenced customers’ decision to choose all-electric? 3. What are the benefits to electrification? 4. What are the barriers and customer concerns to electrification?
Potential EM&V Methods: Literature review customer and market actor interviews
Table 24. Study Description: Assessment of COVID-19 Impacts on Ventilation Usage in Nonresidential Buildings
Study Title: Assessment of COVID-19 Impacts on Ventilation Usage in Nonresidential Buildings Budget: $200,000
Completion Date: Q4 2021 Study Manager: PG&E
Description: The COVID-19 pandemic has had wide-reaching implications for energy consumption some which may persist for several years. As a key example of this many schools, hospitals, retail facilities, and other nonresidential buildings have made changes to the operations of their ventilation systems with the intent of reducing pathogen spread. This study will explore these changes and their implications for nonresidential HVAC programs. Objective: This study aims to identify changes to ventilation usage in nonresidential buildings following the onset of the COVID-19 pandemic quantify the impact of these changes on energy consumption and summarize their implications for nonresidential HVAC programs.

36
Study Title: Assessment of COVID-19 Impacts on Ventilation Usage in Nonresidential Buildings Budget: $200,000
Key Research Questions: 1. How have nonresidential buildings modified their ventilation in order to reduce pathogen spread following the onset of the COVID-19 pandemic (e.g., changes to ventilation rates filtration use of outdoor air etc.)? 2. How have these modifications impacted energy consumption for these buildings? 3. Which changes to ventilation usage are expected to persist in a post-pandemic world? a. How does this impact the viability of existing nonresidential HVAC measures? b. Are there new opportunities for HVAC energy-saving measures that may arise? 4. What viable ventilation technologies exist that can reduce pathogen spread in nonresidential buildings while still delivering energy savings?
Potential EM&V Methods: In-depth interviews with facility managers subject matter expert surveys.
Table 25. Study Description: Market Assessment of Nonresidential Fuel Substitution Measures
Study Title: Market Assessment of Nonresidential Fuel Substitution Measures Budget: $200,000
Completion Date: Q2 2022 Study Manager: PG&E
Description: Recent changes to CPUC policies on fuel substitution measures (previously known as the Three-Prong Test) have created new opportunities for energy-saving measures that replace natural gas systems with electric-only alternatives. Because this is a new area of Energy Efficiency within the state of California there are many questions around how PAs can best take advantage of these opportunities and what potential pitfalls may negatively impact savings claims associated with these new measures. Objective: This study has two main goals: 1. Identify key opportunities for new fuel substitution measures in nonresidential facilities with specific interest in campuses hotels and hospitals and 2. Attempt to mitigate risks to savings claims of these measures by estimating the true NTG and actual energy savings. Key Research Questions: 1. What is the current baseline for approved nonresidential fuel substitution measures? a. What % of domestic hot water in nonresidential facilities can be serviced by heat pumps? Will need to focus on key sectors with special interest in campuses hotels and hospitals. b. Do these facilities have the space to install solar PVs? How much energy can be generated onsite to power fuel substitution equipment? c. How many sites in each sector can achieve net zero status if hot water and space conditioning is provided by heat pumps? 2. The CPUC has currently set the NTG for these measures at 1.00. What is the true NTG for these measures? How will this change over the next 5 years? 3. If furnaces are replaced with electric heat pumps that allow for cooling how will this impact actual energy consumption? With temperatures rising will these measures still save energy?
Potential EM&V Methods: Literature review in-depth interviews survey energy savings calculations.
Table 26. Study Description: Process Evaluation of SCE’s Project Review Process
Study Title: Process Evaluation of SCE's Project Review Process Budget: $50,000
Completion Date: Q4 2021 Study Manager: SCE

37
Study Title: Process Evaluation of SCE's Project Review Process Budget: $50,000
Description: SCE has spent significant time and effort on its ex ante review process to increase and improve the screening of custom projects in recent years. This research will describe these process changes and determine their impact on relevant project performance parameters while delivering actionable and relevant recommendations Objective: This process evaluation of SCE's custom project review process will employ traditional process evaluation techniques to examine SCE’s enhancements to their custom review process a process change designed to improve custom NTG and GRR values. In addition to traditional process evaluation methods this research will also align the recommendations with anticipated project reviews for post transition project. Key Research Questions: 1. How have SCE program modification impacted NTG and GRR? 2. How do SCE RR and NTG values compare with custom programs in other states? 3. What project review changes are likely for post transition projects and programs? Potential EM&V Methods: Standard process evaluation techniques including primary and secondary research and benchmarking.
4.4 Ex Ante Coordination Ex ante processes for the commercial sector (including DEER updates and workpaper review) incorporate data and results from the latest EM&V studies. This section highlights the ex-ante values that are relevant to this sector. 4.4.1 Summary of DEER Updates Commercial sector DEER updates for 2019 include:8
• A limited number of NTG values are updated base on recent EM&V findings. • The commercial refrigerant charge measures are updated based on recent EM&V study results. • LED lighting is established as the standard practice baseline for normal replacement, new
construction and replace-on-burnout measures. • The below-code NTG adjustment factor for accelerated replacement (AR) applications has been
suspended, effective 2019-01-01 and lasting indefinitely • Net-to-Gross methodology has been updated to include treatment of measure utilizing existing
conditions baselines rather than code/standard practice baseline in the case of accelerated replacement (AR) measure application type or a normalized metered energy consumption (NMEC) savings estimation approach
• The available measure application types, delivery types, and measure impact types were updated to reflect E 4818. The final lists and associated acronyms for the revised codes are shown in Resolution E-4952, Section 5.6
• EUL/RUL policy for add-on equipment and Behavioral, Operational and Retrocommissioning (BRO) measures. EUL update for screw-in LED A-lamps.
DEER updates for 2020 and 2021 are more comprehensive. Please refer to “Appendix D. CPUC ED Resolution E-5082 Approval of the Database for Energy-Efficiency Resources updates for Program Year
8 Source: http://www.deeresources.com/index.php/deer-versions/deer2018

38
2022 and revised version for Program Years 2021 and 2020 ” for CPUC ED Resolution E-4952 approving DEER updates for 2019 and 2020.9
Commercial sector DEER updates for 2020 include:10
• Peak demand savings and lighting HVAC interactive effects have been updated for all previous DEER measures with no expiration date, or with an expiration date after December 31, 2019.
• New methods and tools for chiller measures to allow calculation of values for deemed measures and custom programs.
• A new commercial building prototype has been added to DEER that includes extended hours of operation of high load activity areas, for use in chiller measures for custom programs.
• The commercial building prototypes were updated to align with the DEER2016 commercial lighting hours-of-use update.
• The numerous building vintage classifications used in previous DEER versions have been consolidated into "Old", "Median", "Recent", and "New" classifications.
• A correction has been made to the occupant density and corresponding outdoor air ventilation rates for the commercial DEER building prototypes.
• Several minor commercial HVAC updates in the 2019 Title-24 have been incorporated. • Non-residential upstream packaged HVAC and maintenance measures NTG values are update
based on recent evaluation results. • The results of recent CPUC sponsored laboratory testing show that LED A-lamps are unlikely to
obtain their rated life or even the Commission staff approved value of 20,000 hours. Based on the testing results the LED screw-in A-Lamp EUL is reduced from 20,000 hours to 10,000 hours effective 1 January 2019.
• Subsequent to E-4952 the linear lamp and fixture measures were revamped significantly through non-DEER workpapers. There is no plan to migrate linear measures back into DEER.
• All workpapers will be statewide for 2020 and beyond. • Consolidate savings by climate zone to eliminate PA-specific records. • Removed DEER 2020 measures which had been previously expired but never removed.
Commercial sector DEER updates for 2021 include:11
• Further review and assessment of lighting measures. Commercial sector DEER updates for 2022 include:12
• Modifications to accommodate load shape updates • Effective useful life (EUL) update process revision • Chiller measure tier definition
9 CPUC ED, 2019. Energy Division Resolution E-4952. Approval of the Database for Energy-Efficient Resources updates for 2020 and revised version 2019 in Compliance with D.15-10-028, D.16-08-019, and Resolution E-4818. October 11, 2018. 10 Source: http://www.deeresources.com/index.php/deer-versions/deer2020 11Source: http://deeresources.com/index.php/deer-versions 12Source: https://docs.cpuc.ca.gov/PublishedDocs/Published/G000/M346/K161/346161639.PDF
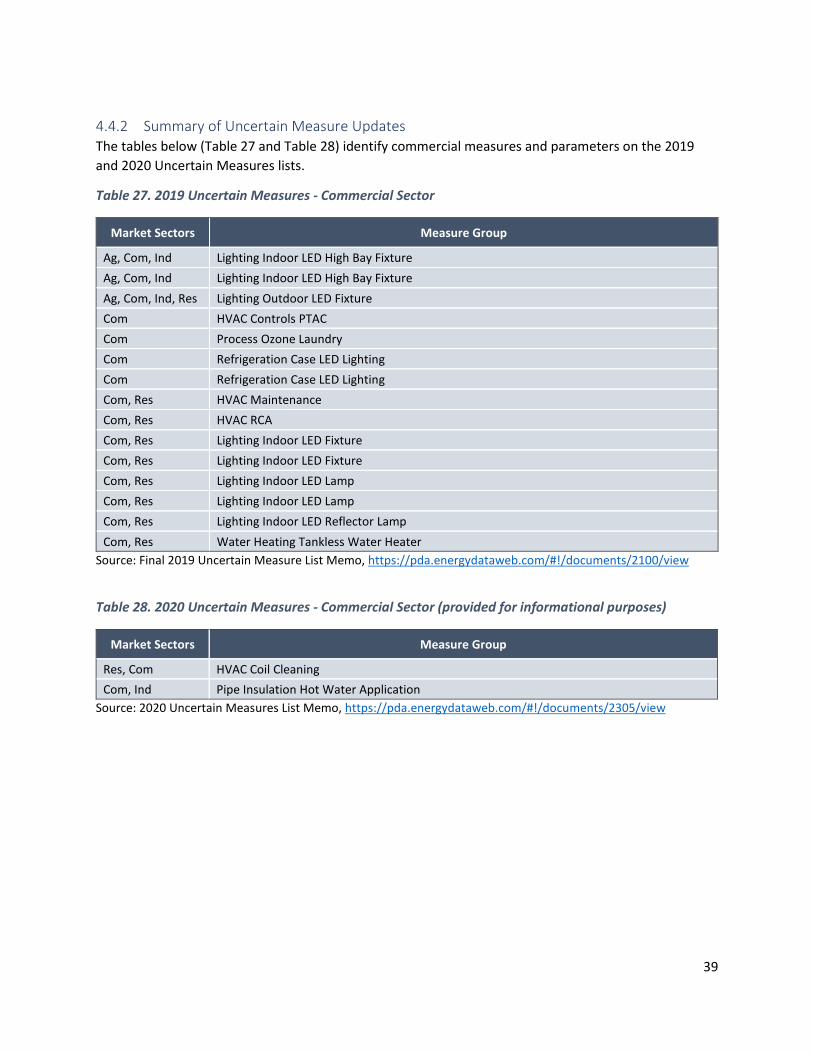
39
4.4.2 Summary of Uncertain Measure Updates The tables below (Table 27 and Table 28) identify commercial measures and parameters on the 2019 and 2020 Uncertain Measures lists.
Table 27. 2019 Uncertain Measures - Commercial Sector
Market Sectors Measure Group
Ag, Com, Ind Lighting Indoor LED High Bay Fixture Ag, Com, Ind Lighting Indoor LED High Bay Fixture Ag, Com, Ind, Res Lighting Outdoor LED Fixture Com HVAC Controls PTAC Com Process Ozone Laundry Com Refrigeration Case LED Lighting Com Refrigeration Case LED Lighting Com, Res HVAC Maintenance Com, Res HVAC RCA Com, Res Lighting Indoor LED Fixture Com, Res Lighting Indoor LED Fixture Com, Res Lighting Indoor LED Lamp Com, Res Lighting Indoor LED Lamp Com, Res Lighting Indoor LED Reflector Lamp Com, Res Water Heating Tankless Water Heater
Source: Final 2019 Uncertain Measure List Memo, https://pda.energydataweb.com/#!/documents/2100/view
Table 28. 2020 Uncertain Measures - Commercial Sector (provided for informational purposes)
Market Sectors Measure Group
Res, Com HVAC Coil Cleaning Com, Ind Pipe Insulation Hot Water Application
Source: 2020 Uncertain Measures List Memo, https://pda.energydataweb.com/#!/documents/2305/view

40
4.4.3 Program Administrators’ Workpaper Submissions Planned workpapers, and updates to existing workpapers for the upcoming portfolio cycle are submitted to Commission staff and reviewed and logged. These workpapers often use DEER data and/or methodology to add technologies that are not in DEER to the energy efficiency portfolio.
Table 29 and Table 30 summarize the quantity of 2019 and 2020 commercial workpaper submissions, respectively, by end-use category and IOU. Appendix C provides the workpaper locations where more information and the papers themselves can be found.Error! Reference source not found.
Table 29. 2019 Commercial Sector Workpaper Submissions by End-Use Category and IOU
End-Use Category IOU
PG&E SCE SCG SDG&E Statewide
Appliance or Plug Load 4 1 Commercial Refrigeration 19 Food Service 14 1 HVAC 25 1 1 2 Lighting 11 3 Process Distribution 1 Recreation 2 Service and Domestic Hot Water 7 5
Source: CPUC Workpaper and Disposition Archive, http://www.deeresources.net/workpapers
Table 30. 2020 Commercial Sector Workpaper Submissions by End-Use Category and IOU
End-Use Category IOU
PG&E SCE SCG SDG&E Statewide
Appliance or Plug Load 1 1 2 Commercial Refrigeration 8 10 Compressed Air 1 Food Service 5 5 9 HVAC 11 9 2 Irrigation 1 Lighting 2 1 Pool and Spa Equipment 1 Process 1 1 Process Heat 1 Recreation 1 1 Service 4 Service and Domestic Hot Water 1 11 1
Source: CPUC Workpaper and Disposition Archive, http://www.deeresources.net/workpapers

41
5 Public Sector 5.1 Public Sector Portfolio of Programs
The public portfolio of programs includes the following:
• Direct Install • Energy Watch • Institutional Partnerships • K-12 Schools • Local Government
Please note that some of these programs may be discontinued in the future. For questions, contact CPUC ED and PA staff. Please refer to the CEDARS website for details regarding program budgets and anticipated energy savings and demand reductions for each PA.13
5.2 2019 and 2020 EM&V Studies Table 31 summarizes the 2019 and 2020 public sector EM&V studies including details regarding budgets and timing. More detailed information on these studies including study descriptions and objectives are available in the 2019 Energy Division & Program Administrator Energy Efficiency Evaluation, Measurement and Verification Plan Version 9 available on the Public Document Area here: https://pda.energydataweb.com/#!/documents/2325/view.
Detailed information on past and current studies can also be found on the searchable Project Status Reporting site located here: https://psr.energydataweb.com/
Table 31. 2019 and 2020 Public Sector EM&V Studies Summary
Study ID Study Title Study Manager Study Type Budget Completion
Date
2019_Public_503 Statewide Public Sector Market Study PG&E Market
Study $300,000 12/31/2021
2019_Public_523 Statewide Study to Quantify Co-benefits and Local Economic Benefits of LGPs in HTR and DAC
PG&E Market Study $150,000 1/31/2021
2020_Public_590 Public Sector Market Characterization - Financing SoCalREN Market
Study $110,000 01/29/2021
Source: Program Administrators, CPUC ED and their consultants via https://psr.energydataweb.com/
5.3 Planned 2021 EM&V Studies There are no planned Public sector studies for 2021.
13 CEDARS website: https://cedars.sound-data.com/

42
6 Industrial 6.1 Industrial Portfolio of Programs
The industrial portfolio of programs includes the following:
• Direct Install • Energy Advisor • Energy Performance
• Market Based Incentive • Strategic Energy Management • Systems Optimization
Please note that some of these programs may be discontinued in the future. For questions, contact CPUC ED and PA staff. Please refer to the CEDARS website for details regarding program budgets and anticipated energy savings and demand reductions for each PA.14
6.2 2019 and 2020 EM&V Studies Table 32 summarizes the 2019 and 2020 industrial sector EM&V studies including details regarding budgets and timing. These studies include impact evaluations of the 2019 and/or 2020 programs as well as market studies active during 2019 and/or 2020. More detailed information on these studies including study descriptions and objectives are available in the 2019 Energy Division & Program Administrator Energy Efficiency Evaluation, Measurement and Verification Plan Version 9 available on the Public Document Area here: https://pda.energydataweb.com/#!/documents/2325/view.
Detailed information on past and current studies can also be found on the searchable Project Status Reporting site located here: https://psr.energydataweb.com/
Table 32. 2019 and 2020 Industrial EM&V Studies Summary
Study ID Study Title Study Manager Study Type Budget Completion
Date
2019_Industrial_514 Statewide Industrial Large Customer Wants and Needs SCE Market Study $200,000 12/1/2020
2019_Industrial_583 2018 Industrial Strategic Energy Management (SEM) Evaluation
SCE Impact Evaluation $1,357,000 6/1/2021
2019_Industrial_592 Group E Ind/Ag Market Study CPUC ED Market Study $450,500 2/1/2021
2020_Industrial_556 Compressed Air Market Study SCE Market Study $50,000 3/31/2021
2020_Industrial_558 Industrial Electrification Potential SCE Market Study $150,000 9/30/2021
2020_Industrial_578 Process Evaluation of PG&E's Strategic Energy Management Program
PG&E Process Evaluation $100,000 5/27/2022
2020_Industrial_579
Evaluability and Process Evaluation of PG&E's Commercial Whole Building and Public Sector NMEC Program
PG&E Process Evaluation $100,000 7/1/2022
Source: Program Administrators, CPUC ED and their consultants via https://psr.energydataweb.com/
14 CEDARS website: https://cedars.sound-data.com/

43
6.3 Planned 2021 EM&V Studies Table 33 summarizes industrial sector EM&V study planned for 2021 and subsequent years.
Table 33. Planned 2021 Industrial Sector EM&V Study Summary
Study ID Study Title Study Manager Study Type Budget Completion
Date
2021_Industrial_607 Industrial SEM Study SoCalGas Other $150,000 12/31/2021
Source: Program Administrators, CPUC ED, and their consultants via https://psr.energydataweb.com/
The table below provides further detail regarding the study in Table 33 above.
Table 34. Study Description: Industrial SEM Study
Study Title: Industrial SEM Study Budget: $150,000
Completion Date: Q2 2021 Study Manager: SoCalGas
Description: This study will aim to determine whether a statewide approach can produce efficiencies in costs and data collection. Part of this study will expand the number of data sets available to test proprietary and public domain models for use in site-level programs and projects. Objective: To explore multiple topics around SEM projects. Similar to recent work developing a test data asset and model testing procedures for hospitals in SoCalGas territory this effort will define additional building types collect data and prepare test data sets to enable gas utilities to test modeling algorithms for offices educational governmental multi-family and other building types. Key Research Questions: 1. How can past approaches in medium industrial sites allow scaling of SEM to more facilities? 2. Can a statewide approach reduce modeling costs and simplify ongoing data collection for participants utilities and implementers? 3. What do the measure lifecycles look like for SEM projects across North America? 4. Should SEM savings have a consistent measure life across all participants? 5. What would appropriate standards be for determining start year for SEM programs that cross calendar years? 6. Determine how to use energy modeling to calculate electricity demand (kW) savings from SEM O&M activities. 7. Provide guidance on when energy modeling is likely to be successful for these calculations and when it is not. 8. How can different building be defined and isolated to test modeling algorithms by building type?
Potential EM&V Methods: In-depth interviews with SEM experts cost and energy consumption analysis.

44
6.4 Ex Ante Coordination Ex ante processes for the industrial sector incorporate data and results from the latest EM&V studies. This section highlights the ex ante values that are relevant to this sector. 6.4.1 Summary of Uncertain Measure Updates Table 35 and Table 36 below identify industrial measures and parameters on the 2019 and 2020 Uncertain Measures lists.
Table 35. 2019 Uncertain Measures – Industrial Sector
Market Sectors Measure Group Ag, Com, Ind Lighting Indoor LED High Bay Fixture Ag, Com, Ind, Res Lighting Outdoor LED Fixture
Source: Final 2019 Uncertain Measure List Memo, https://pda.energydataweb.com/#!/documents/2100/view Table 36. 2020 Uncertain Measures - Industrial Sector (provided for informational purposes)
Market Sectors Measure Group
Com, Ind Pipe Insulation Hot Application Source: 2020 Uncertain Measures List Memo, https://pda.energydataweb.com/#!/documents/2305/view
6.4.2 Program Administrators’ Workpaper Submissions Planned workpapers, and updates to existing workpapers for the upcoming portfolio cycle are submitted to Commission staff and reviewed and logged. These workpapers often use DEER data and/or methodology to add technologies that are not in DEER to the energy efficiency portfolio. Table 37 and Table 38 summarize the 2019 and 2020 industrial workpaper submissions, respectively, by end-use category and IOU. Appendix C provides the workpaper locations where more information and the papers themselves can be found.
Table 37. 2019 Industrial Sector Workpaper Summary by End-Use Category and IOU
End-Use Category IOU
PG&E SCE SCG SDG&E Commercial Refrigeration 2 Lighting 1 Process Distribution 1 Process Heat 1 Service and Domestic Hot Water 2
Source: CPUC Workpaper and Disposition Archive, http://www.deeresources.net/workpapers

45
Table 38. 2020 Industrial Sector Workpaper Summary by End-Use Category and IOU
End-Use Category IOU
PG&E SCE SCG SDG&E Commercial Refrigeration 1 Compressed Air 1 HVAC 1 5 Irrigation 1 Process Distribution 1 Process Heat 1 Service and Domestic Hot Water 1
Source: CPUC Workpaper and Disposition Archive, http://www.deeresources.net/workpapers

46
7 Agriculture 7.1 Agriculture Portfolio of Programs
The agriculture portfolio of programs includes the following:
• Direct Install • Energy Advisor
• Energy Savings Action Plan • Growers Service Program
Please note that some of these programs may be discontinued in the future. For questions, contact CPUC ED and PA staff. Please refer to the CEDARS website for details regarding program budgets and anticipated energy savings and demand reductions for each PA.15
7.2 2019 EM&V Study Table 39 summarizes the 2019 agriculture sector EM&V study including details regarding budget and timing. More detailed information on this study including study description and objective are available in the 2019 Energy Division & Program Administrator Energy Efficiency Evaluation, Measurement and Verification Plan Version 9 available on the Public Document Area here: https://pda.energydataweb.com/#!/documents/2325/view.
Detailed information on past and current studies can also be found on the searchable Project Status Reporting site located here: https://psr.energydataweb.com/
Table 39. 2019 Agricultural EM&V Study Summary
Study ID Study Title Study Manager Study Type Budget Completion
Date 2019_Agriculture_ 515 Statewide Horticulture Indoor Ag Market Study SCE Market
Study $150,000 N/A
Source: Program Administrators, CPUC ED, and their consultants via https://psr.energydataweb.com/
7.3 Planned 2021 EM&V Studies There are no planned 2021 agriculture EM&V studies.
7.4 Ex Ante Coordination Ex ante processes for the agricultural sector incorporate data and results from the latest EM&V studies. This section highlights the ex ante values that are relevant to this sector. 7.4.1 Summary of Uncertain Measure Updates The table below identifies agricultural measures and parameters on the 2019 Uncertain Measures lists (Table 40). There are no Agricultural measures included in the 2020 Uncertain Measure list memo located here: https://pda.energydataweb.com/#!/documents/2305/view.
15 CEDARS website: https://cedars.sound-data.com/

47
Table 40. 2019 Uncertain Measures – Agriculture Sector
Market Sectors Measure Group
Ag Agricultural Irrigation Ag Process Pumping VFD Ag, Com, Ind Lighting Indoor LED High Bay Fixture Ag, Com, Ind, Res Lighting Outdoor LED Fixture
Source: Final 2019 Uncertain Measure List Memo, https://pda.energydataweb.com/#!/documents/2100/view
7.4.2 Program Administrators’ Workpaper Submissions Planned workpapers, and updates to existing workpapers for the upcoming portfolio cycle are submitted to Commission staff and reviewed and logged. These workpapers often use DEER data and/or methodology to add technologies that are not in DEER to the energy efficiency portfolio. Table 41 and Table 42 summarize the quantity of 2019 and 2020 agriculture workpaper submissions, respectively, by end-use category and IOU. Appendix C provides the workpaper locations where more information and the papers themselves can be found.
Table 41. 2019 Agriculture Sector Workpaper Summary by End-Use Category and IOU
End-Use Category Count
PG&E SCE SDG&E Statewide Commercial Refrigeration 1
HVAC 1
Irrigation 6
Process 1
Process Distribution 2
Process Refrigeration 1
Service and Domestic Hot Water 1 Source: CPUC Workpaper and Disposition Archive, http://www.deeresources.net/workpapers Table 42. 2020 Agriculture Sector Workpaper Summary by End-Use Category and IOU
End-Use Category Count
PG&E SCE SDG&E Statewide Irrigation 2
Source: CPUC Workpaper and Disposition Archive, http://www.deeresources.net/workpapers

48
8 Cross-Cutting 8.1 Cross-cutting Portfolio of Programs
The cross-cutting portfolio of programs includes the following:
• Career & Workforce Readiness • Codes and Standards • Emerging Technology • Integrated Demand-Side Management
• Integrated Energy Education & Training • ME&O • On-bill Financing • Residential NMEC
Please note that some of these programs may be discontinued in the future. For questions, contact CPUC ED and PA staff. Please refer to the CEDARS website for details regarding program budgets and anticipated energy savings and demand reductions for each PA.16
8.2 Marketing, Education & Outreach Table 43 summarizes the 2019 marketing, education, and outreach EM&V study including details regarding budget and timing. More detailed information on this study including study description and objective are available in the 2019 Energy Division & Program Administrator Energy Efficiency Evaluation, Measurement and Verification Plan Version 9 available on the Public Document Area here: https://pda.energydataweb.com/#!/documents/2325/view.
Detailed information on past and current studies can also be found on the searchable Project Status Reporting site located here: https://psr.energydataweb.com/
Table 43. 2019 Marketing, Education & Outreach EM&V Study Summary
Study ID Study Title Study Manager Study Type Budget Completion
Date
2019_Non-Resource_542
Marketing Education and Outreach Consensus Project CPUC ED Other $375,000 6/4/2020
Source: Program Administrators, CPUC ED and their consultants via https://psr.energydataweb.com/
8.2.1 Planned 2021 EM&V Studies Table 44 summarizes the Marketing, Education & Outreach EM&V studies planned for 2021.
Table 44. Planned 2021 Marketing, Education & Outreach EM&V Studies Summary
Study ID Study Title Study Manager Study Type Budget Completion
Date
2021_Cross-Cutting_541
Cross-Cutting Marketing Effectiveness Study CPUC ED Process
Evaluation $1,900,000 10/30/2021
2021_Non-Resource_543
ME&O Program Transition from IOUs to Third Parties and CCAs
CPUC ED Other $250,000 12/30/2021
Source: Program Administrators, CPUC ED and their consultants via https://psr.energydataweb.com/
16 CEDARS website: https://cedars.sound-data.com/

49
The tables below provide further detail regarding the studies in Table 44 above.
Table 45. Study Description: Cross-Cutting Marketing Effectiveness Study
Study Title: Cross-Cutting Marketing Effectiveness Study Budget: $1,900,000
Completion Date: Q4 2021 Study Manager: CPUC ED
Description: The Cross-Cutting Marketing Effectiveness Study is designed to assess (1) the performance of the Energy Upgrade California (EUC) campaign in meeting its stated objectives and program performance metrics and (2) the collaborative process among key ME&O stakeholders. The evaluation team will use a multi-pronged approach to assess campaign effectiveness. First the evaluation team will measure and track changes in established program and market metrics over time to provide official measurement of key marketing objectives. Second the evaluation team will conduct a deeper examination of the impact of statewide ME&O on attitudes and behaviors. Third the evaluation team will assess the impact of SW campaign on low-income and hard-to-reach customers through an assessment of CBO partnerships. The collaborative process assessment is designed to allow the CPUC to understand how the current process is working as well as how it performed in achieving the desired outcomes overall. Objective: The overarching objectives of the cross-cutting marketing effectiveness study are to assess the performance of the EUC campaign in meeting its stated objectives and program performance metrics as well as to assess the collaborative process between key ME&O stakeholders. Key Research Questions: Effectiveness Assessment: 1. Are Californians increasing their adoption of energy efficient behaviors? What energy efficient behaviors are they engaging in? 2. What are Californians’ attitudes toward reducing their energy use? How important is it to Californians to reduce their energy use? 3. What messages have been effective in changing Californians’ perceptions of the importance of energy usage? 4. Has the ME&O campaign been effective in achieving its goals? Collaborative Process Assessment: 1. Do stakeholders find the structure of the collaborative process effective and appropriate? 2. Do stakeholders feel the point at which various parties provide feedback in the campaign and materials development process is appropriate? 3. Do stakeholders feel they have enough time to review consider and provide feedback on campaign direction and associated materials? 4. Do stakeholders feel their contributions are taken into account? 5. What benefits do stakeholders see to their participation in the process? 6. Do stakeholders feel monthly and quarterly stakeholder meetings are useful to their organization and its ME&O efforts 7. What value do the smaller ad hoc meetings add to the collaborative process from the stakeholders’ perspectives? 8. Do stakeholders feel that all parties are committed to participating in the process? 9. Do stakeholders feel that all parties are committed to making the SW ME&O campaign as effective as it can be? 10. Do stakeholders feel their perspective/input is valued? Potential EM&V Methods: ME&O stakeholder interviews; Residential customer surveys; Stakeholder meeting observations; Analysis of web analytics; In-depth interviews with participating CBOs and observation of CBO events; Experimental content testing of campaign creative.

50
Table 46. Study Description: ME&O Program Transition from IOUs to Third Parties and CCAs
Study Title: ME&O Program Transition from IOUs to Third Parties and CCAs Budget: $250,000
Completion Date: Q4 2021 Study Manager: CPUC ED
Description: The changing landscape of energy efficiency program implementation brought about by D.18-01-004 has significant implications for the promotion of these programs to consumers as well as their journey from awareness to energy saving action. Two central policy changes; the shift toward third-party program implementation and the rise of CCAs are driving this change which will impact all the players currently engaged in motivating consumers to save energy. The objective of this study is to assess changes in energy efficiency program delivery due to the increased role of CCAs and third-party PAs in California and the impact of those changes on the promotion of energy efficiency programs to residential and small business customers. Objective: Document the energy efficiency programs and marketing efforts of CCAs and third parties. Document CCA and third-party coordination with the IOUs and the statewide ME&O campaign in the implementation of their energy efficiency offerings. Understand the impact of transitioning to CCA and third-party implementation and marketing on the customer Collect CCA third party and IOU feedback on lessons learned in the first phase of implementation and opportunities for improvement.
Key Research Questions: None
Potential EM&V Methods: Key Informant Interviews; Program Documentation Review; Systems Mapping; Dyad and Triad Stakeholder Interviews; Working Group Share-Out and Iteration.
8.3 Emerging Technologies Table 47 summarizes the 2020 emerging technologies EM&V studies including details regarding budgets and timing. More detailed information on these studies including study descriptions and objectives are available in the 2019 Energy Division & Program Administrator Energy Efficiency Evaluation, Measurement and Verification Plan Version 9 available on the Public Document Area here: https://pda.energydataweb.com/#!/documents/2325/view.
Detailed information on past and current studies can also be found on the searchable Project Status Reporting site located here: https://psr.energydataweb.com/
Table 47. 2020 Emerging Technologies EM&V Studies Summary
Study ID Study Title Study Manager Study Type Budget Completion
Date
2020_Cross-Cutting_539
Emerging Technology to Portfolio Evaluation Study CPUC ED Other $270,000 11/25/2020
2020_Non-Resource_540
Emerging Technology Handoff Study CPUC ED Other $150,000 2/27/2020
Source: Program Administrators, CPUC ED and their consultants via https://psr.energydataweb.com/
8.3.1 Planned 2021 EM&V Studies There are no planned Emerging Technologies studies for 2021.

51
8.4 Codes & Standards The codes and standards studies in
Table 48 were active during 2019 and 2020. More detailed information on this study including study description and objective are available in the 2019 Energy Division & Program Administrator Energy Efficiency Evaluation, Measurement and Verification Plan Version 9 available on the Public Document Area here: https://pda.energydataweb.com/#!/documents/2325/view.
Detailed information on past and current studies can also be found on the searchable Project Status Reporting site located here: https://psr.energydataweb.com/
Table 48. 2020 Cross Cutting-Codes & Standards EM&V Study Summary
Study ID Study Title Study Manager Study Type Budget Completion
Date 2019_Non-Resource_531
Codes and Standards Harmonization Study CPUC ED Other $125,000 12/30/2019
2020_Cross-Cutting_575
Comprehensive Logic Models for the Codes Standards and Crosscutting Programs
PG&E Process Evaluation $115,000 12/9/2020
Source: Program Administrators, CPUC ED and their consultants via https://psr.energydataweb.com/
8.4.1 Planned 2021 EM&V Studies Table 49 summarizes the Codes & Standards EM&V studies planned for 2021.
Table 49. 2021 Cross-Cutting Codes & Standards EM&V Studies Summary
Study ID Study Title Study Manager
Study Type Budget Completion
Date
2021_Cross-Cutting_529
PY2016-2018 Codes and Standards Impact Evaluation CPUC ED Impact
Evaluation $125,000 3/30/2021
2021_Non-Resource_530
PY2016-2018 Codes and Standards Cost Effectiveness CPUC ED Other $2,350,000 3/30/2021
The tables below provide further detail regarding the studies in Table 49Table 59 above.
Table 50. Study Description: PY2016-2018 Codes and Standards Cost Effectiveness
Study Title: PY2016-2018 Codes and Standards Cost Effectiveness Budget: $125,000
Completion Date: Q1 2021 Study Manager: CPUC ED
Description: This study continues the work performed in ED_D_CS_2 to develop a process for generating transparent and auditable cost-effectiveness results for utility codes and standards advocacy programs. This process needs to simultaneously be more (1) comparable to resource programs (2) transparent in the treatment of input data and (3) as seamless as resource programs for calculating program cost-effectiveness and reporting results through CEDARS.

52
Objective: The objective of this study is to continue work begun in the Review of the Process for Codes & Standards Program Cost-effectiveness Reporting by resolving gaps in the C&S program cost-effectiveness reporting process. For this study we will completely and consistently define the cost-effectiveness calculation process for C&S. This study will remove any uncertainty in the current calculations by increasing the transparency of the inputs and data transformations. Key Research Questions: 1. How should cost-effectiveness be treated for advocacy programs - specifically Codes and Standards? 2.What data are needed to run cost-effectiveness and what are their sources? 3. What are the specific data analysis steps required to develop CET inputs? 4. What are the TRC and PAC ratios for the IOU Codes and Standards Programs? Potential EM&V Methods: Review documents and data inputs design data processing method perform cost-effectiveness calculations.
Table 51. Study Description: PY2016-2018 Codes and Standards Impact Evaluation
Study Title: PY2016-2018 Codes and Standards Impact Evaluation Budget: $2,350,000
Completion Date: Q1 2021 Study Manager: CPUC ED
Description: This impact evaluation of the SW Codes & Standards program will estimate the compliance level and savings achieved by the IOUs for California’s Building Energy Efficiency Standards (Title 24 or building codes) California Appliance Efficiency Regulations (Title 20 or appliance standards) and Federal appliance standards. The estimated savings under evaluation come from the IOU savings claims for the years 2016 2017 and 2018 and apply to codes and standards with effective dates from January 1, 2016 through December 31, 2018. Objective: This Codes Impact Evaluation will estimate gross savings and compliance for buildings built under the 2016 Title 24 building codes. The Standards Impact Evaluation verifies the potential savings and compliance rates for state and federal standards that became effective during 2016 through 2018. The study will also develop net savings and modify the ISSM model. Key Research Questions: Estimate potential savings for codes that became effective during the program years 2016 through 2018. Evaluate the gross savings of the statewide Title 24 codes advocacy programs; Identify current compliance levels and assess key reasons for non-compliance and savings; Estimate potential savings due to standards that became effective for the program years 2016 through 2018; Estimate gross savings resulting from standards adopted during the evaluation period; Estimate the naturally occurring rate of market adoption; Estimate levels of compliance with appropriate adopted standards; Estimate degree of savings attributable to IOU programs to promote retrofit standards; Estimate net savings by updating the ISSM based on the results of the tasks conducted in C&S_13A and 13B; Update ISSM for new Naturally Occurring Market Adoption (NOMAD) parameters; Apply or develop an allocation approach and allocate net savings to each IOU; Expand the ISSM Potential EM&V Methods: Site visits engineering site visits engineering-based modeling and calculations Delphi panels interviews with motor manufacturers and distributors web scraping product listings advertised for sale.
8.5 Workforce, Education, and Training (WE&T) Table 52 summarize the Workforce, Education, and Training EM&V studies conducted in 2019 and 2020. More detailed information on these studies including study descriptions and objectives are available in the 2019 Energy Division & Program Administrator Energy Efficiency Evaluation, Measurement and Verification Plan Version 9 available on the Public Document Area here: https://pda.energydataweb.com/#!/documents/2325/view.

53
Detailed information on past and current studies can also be found on the searchable Project Status Reporting site located here: https://psr.energydataweb.com/
Table 52. 2019 and 2020 WE&T EM&V Studies Summary
Study ID Study Title Study Manager
Study Type Budget Completion
Date
2019_Cross-Cutting_504
Workforce Education and Training (WE&T) Market Assessment to Inform Integrated Energy Education and Training (IEET): Phase 1
PG&E Process Evaluation $100,000 N/A
2020_Cross-Cutting_562
WE&T Study to Inform Future Trainings for WE&T PG&E Other $100,000 N/A
2020_Non-Resource_548
Knowledge Skills and Abilities Market Studies CPUC ED Other $275,000 1/30/2020
Source: Program Administrators, CPUC ED and their consultants via https://psr.energydataweb.com/
8.5.1 Planned 2021 EM&V Studies Table 53 summarizes the WE&T EM&V studies planned for 2021.
Table 53. 2021 WE&T EM&V Studies Summary
Study ID Study Title Study Manager
Study Type Budget Completion
Date 2021_Non-Resource_544
WE&T and Installation Improvement Evaluation Study CPUC ED Impact
Evaluation $525,000 10/29/2021
2021_Non-Resource_545
Partnerships with Training Institutions Impact Evaluation CPUC ED Other $470,000 9/28/2021
2021_Non-Resource_546
WE&T Career Connections Process Evaluation CPUC ED Process
Evaluation $50,000 10/12/2021
2021_Non-Resource_547
Career and Workforce Readiness Process Evaluation CPUC ED Process
Evaluation $50,000 10/12/2021
The tables below provide further detail regarding the studies in Table 53 above.
Table 54. Study Description: WE&T and Installation Improvement Evaluation Study
Study Title: WE&T and Installation Improvement Evaluation Study Budget: $525,000
Completion Date: Q4 2021 Study Manager: CPUC ED
Description: This study aims to understand whether and to what extent there is a causal link between IOU workforce training programs and improved installation practices. Objective: The study objectives include: 1) Assess the effectiveness of WE&T programs specifically among installation professionals; 2) Assess the impact of each training workshop/session provided for relevant professions; 3) Identify and assess the connection between training and improved installation

54
practices; 4) Provide recommendations on how to improve WE&T programs; and 5) Collect data to assess whether and to what extent WE&T programs drive energy savings.
Key Research Questions: Please refer to the study objectives.
Potential EM&V Methods: Materials/Database Review; ED and Program Staff Interviews; Assess NMEC Methodology Uses; Review/Refine Learning Intervention Exit Survey Instructional Design Assessment; Installer Surveys; Assess Learning; Assess Behavior; Basic Indirect Impact Evaluation.
Table 55. Study Description: Partnerships with Training Institutions Impact Evaluation
Study Title: Partnerships with Training Institutions Impact Evaluation Budget: $470,000
Completion Date: Q3 2021 Study Manager: CPUC ED
Description: A study to understand the functioning and impact of partnerships with WE&T training and job placement organizations such as but not limited to community colleges community-based organizations workforce development boards and apprenticeship programs Objective: The goal of this study is to evaluate a main strategy of WE&T programs’ namely partnerships with training institutions’ and determine the impacts of the partnerships on e.g. job placement and energy savings. Key Research Questions: Define the term partnership; Identify partnership types; Map existing and planned partnerships to partnership types; Determine the evaluability of partnerships; Understand the functioning and impact of partnerships with WE&T training and job placement organizations; Characterize how partnerships are being implemented; Determine and measure partnership effectiveness indicators; Assess the impacts Potential EM&V Methods: Data Requests and Material/Literature Review; Program Staff Interviews; Define Partnerships /Partnership Types; Evaluability Assessment; Interview Partners; Impact Evaluation Plan; In-Depth Interviews with Employers; Survey End-Users; Impact Evaluation
Table 56. Study Description: WE&T Career Connections Process Evaluation
Study Title: WE&T Career Connections Process Evaluation Budget: $50,000
Completion Date: Q4 2021 Study Manager: CPUC ED
Description: A process evaluation of the WE&T Career Connections Program.
Objective: Assess evaluability and adaptability of the program; Assess effectiveness toward program goals and cost-effectiveness; Workforce outcomes for program participants; Assess alignment with the identified Strategic Plan Goals Key Research Questions: 1. What is the current design/implementation strategy for program? 2. How do the program and subcomponents fit into the marketplace? 3. What goals exist for the program and how are they tracked? 4. What number/percentage of K-12 schools have adopted the materials provided by WE&T? 5. What number/percentage of Title 1 schools have adopted the materials provided by WE&T? 6. What number of schools have adopted WE&T the resources as intended? 7. How many K-12 students have been served? 8. How many contact hours of instruction do students receive? 9. What value does the program provide to instructors? 10. How are teachers using the materials on an ongoing basis? 11. Are students gaining knowledge sharing information or making behavior changes?

55
12. Is program funding adequate relative to the objectives? 13. Are students gaining awareness of energy education/career pathways? 14. How is the WE&T program aligned with California’s Strategic Plan and the Needs Assessment? 15. What should utilities do in the future to meet the planned goals? Potential EM&V Methods: Initial Data Request and Program Materials Review; Program Staff Interviews; Participant Data and Materials Analysis; Online Surveys with Participating Schools; In-Depth Interviews with Faculty and Staff at Participating Schools.
Table 57. Study Description: Career and Workforce Readiness Process Evaluation
Study Title: Career and Workforce Readiness Process Evaluation Budget: $50,000
Completion Date: Q4 2021 Study Manager: CPUC ED
Description: A process evaluation of the Career & Workforce Readiness program.
Objective: The research objectives of the CWR process evaluation are to: Assess the evaluability and adaptability of the CWR Program; Track the CWR Program’s progress toward program goals and cost-effectiveness; Consider how the CWR program is doing with regard to workforce outcomes for program participants; and Gage the CWR program’s alignment with the identified Strategic Plan goals and best practices outlined in the Survey of Inclusion Workforce Landscape.
Key Research Questions: Please see research objectives
Potential EM&V Methods: Review Program Materials and Data; In-Depth Interviews with Program Staff; Program Theory & Logic Model; Evaluability Assessment; In-Depth Interviews with Participating Community Based Organizations; In-Depth Interviews with Select Program Participants
8.6 Finance Table 58 summarizes the Finance EM&V studies conducted in 2019. More detailed information on this study including study description and objective are available in the 2019 Energy Division & Program Administrator Energy Efficiency Evaluation, Measurement and Verification Plan Version 9 available on the Public Document Area here: https://pda.energydataweb.com/#!/documents/2325/view.
Detailed information on past and current studies can also be found on the searchable Project Status Reporting site located here: https://psr.energydataweb.com/
Table 58. 2019 Cross Cutting- Finance EM&V Studies Summary
Study ID Study Title Study Manager Study Type Budget Completion
Date 2019_Cross-Cutting_505
PG&E On-Bill Financing Alternative Pathway Early M&V PG&E Process
Evaluation $88,892 8/24/2020
2019_Non-Resource_526
REEL Pilot Financing Impact Evaluation CPUC ED Impact
Evaluation $400,000 10/30/2019
Source: Program Administrators, CPUC ED and their consultants via https://psr.energydataweb.com/
8.6.1 Planned 2021 EM&V Studies Table 59 summarizes the Finance EM&V studies planned for 2021.

56
Table 59. 2021 Finance EM&V Studies Summary
Study ID Study Title Study Manager Study Type Budget Completion
Date 2021_Non-Resource_527
PY2018 SW On Bill Financing Impact Evaluation CPUC ED Impact
Evaluation $600,000 7/30/2021
2021_Non-Resource_528
PY2020 SW Small Business & Multifamily Pilot Process Evaluation CPUC ED Process
Evaluation $200,000 10/30/2021
The tables below provide further detail regarding the studies in Table 59 above.
Table 60. Study Description: PY2018 SW On Bill Financing Impact Evaluation
Study Title: PY2018 SW On Bill Financing Impact Evaluation Budget: $600,000
Completion Date: Q3 2021 Study Manager: CPUC ED
Description: Impact evaluation of OBF-only pathway and the OBF + Rebates program
Objective: Impact evaluation of OBF-only pathway and the OBF + Rebates program
Key Research Questions: Impact evaluation of OBF-only pathway and the OBF + Rebates program
Potential EM&V Methods: Consumption and engineering analysis surveys depth interviews NTG analysis
Table 61. Study Description: PY2020 SW Small Business & Multifamily Pilot Process Evaluation
Study Title: PY2020 SW Small Business & Multifamily Pilot Process Evaluation Budget: $200,000
Completion Date: Q4 2021 Study Manager: CPUC ED
Description: Process evaluation for forthcoming SW Finance Pilots for Small Businesses and Multifamily. Research questions are TBD until pilots launch and ramp up. Objective: Process evaluation for forthcoming SW Finance Pilots for Small Businesses and Multifamily. Research questions are TBD until pilots launch and ramp up. Key Research Questions: Process evaluation for forthcoming SW Finance Pilots for Small Businesses and Multifamily. Research questions are TBD until pilots launch and ramp up. Potential EM&V Methods: Process evaluation for forthcoming SW Finance Pilots for Small Businesses and Multifamily. Research questions are TBD until pilots launch and ramp up.
8.7 Integrated Demand Side Management (IDSM) Table 62 summarizes the studies conducted in 2019 and 2020 that focused on Integrated Demand Side Management (IDSM). More detailed information on these studies including study descriptions and objectives are available in the 2018 Energy Division & Program Administrator Energy Efficiency Evaluation, Measurement and Verification Plan Version 8 available on the Public Document Area here: https://pda.energydataweb.com/#!/documents/2119/view.
Detailed information on past and current studies can also be found on the searchable Project Status Reporting site located here: https://psr.energydataweb.com/

57
Table 62. 2019 and 2020 IDSM EM&V Studies Summary
Study ID Study Title Study Manager
Study Type Budget Completion
Date 2019_Cross-Cutting_521
Statewide Effectiveness of IDSM ME&O Efforts Study SDG&E Process
Evaluation $100,000 N/A
2019_Cross-Cutting_522
Statewide Interactive Effects of IDSM Projects Study SDG&E Process
Evaluation $105,000 N/A
2020_Residential_568 IDSM & EE+DR Load Impact Methodology17
SDG&E or CPUC ED Other $150,000 12/31/2022
2020_Residential_570 IDSM & EE+DR Cost Effective Methodology18
SDG&E or CPUC ED Other $150,000 12/31/2022
Source: Program Administrators, CPUC ED and their consultants via https://psr.energydataweb.com/
8.7.1 Planned 2021 EM&V Studies There are no planned IDSM studies for 2021.
8.8 Zero Net Energy (ZNE) and Decarbonization Table 63 summarizes the ZNE and Decarbonization EM&V studies that were conducted in 2020. More detailed information on these studies including study descriptions and objectives are available in the 2019 Energy Division & Program Administrator Energy Efficiency Evaluation, Measurement and Verification Plan Version 9 available on the Public Document Area here: https://pda.energydataweb.com/#!/documents/2325/view.
Detailed information on past and current studies can also be found on the searchable Project Status Reporting site located here: https://psr.energydataweb.com/
Table 63. 2020 ZNE and Decarbonization EM&V Studies Summary
Study ID Study Title Study Manager
Study Type Budget Completion
Date
2020_Cross-Cutting_569
Feasibility Study for the Electrification of Hot Water and Space Conditioning Systems in Residential and Small Commercial
PG&E Market Study $300,000 N/A
2020_Cross-Cutting_571
Costs and Processes of Secondary Service Upgrades in Electrification Retrofits
PG&E Market Study $100,000 6/30/2021
2020_Non-Resource_549 ZNE Community Case Study CPUC ED Other $485,000 10/14/2021
Source: Program Administrators, CPUC ED and their consultants via https://psr.energydataweb.com/
17 Study 2020_Residential_568 also appears in Chapter 3: Residential. 18 Study 2020_Residential_570 also appears in Chapter 3: Residential.

58
8.8.1 Planned 2021 EM&V Studies Table 64 summarizes the ZNE and Decarbonization EM&V studies planned for 2021.
Table 64. Proposed 2021 Cross-Cutting- ZNE and Decarbonization EM&V Studies Summary
Study ID Study Title Study Manager
Study Type Budget Completion
Date
2021_Cross-Cutting_550
IOU and CCA Cross-Cutting Program Evaluation and Program Facilitation CPUC ED Other $1,100,000 10/13/2021
2021_Cross-Cutting_551 ZNE Retrofit Timelines and Costs CPUC ED Market
Study $335,000 10/14/2021
2021_Cross-Cutting_619 Electric Cooktops Market Study PG&E or
SDG&E Market Study $150,000 4/30/2022
Source: Program Administrators, CPUC ED and their consultants via https://psr.energydataweb.com/
The tables below provide further detail regarding the studies in Table 64 above.
Table 65. Study Description: IOU and CCA Cross-Cutting Program Evaluation and Program Facilitation
Study Title: IOU and CCA Cross-Cutting Program Evaluation and Program Facilitation Budget: $1,100,000
Completion Date: Q4 2021 Study Manager: CPUC ED
Description: A study to develop a market baseline and market characterization of the California heat pump market understand the efforts and effectiveness of CCAs LGPs and RENS in contributing to building and ZNE goals; and exploring barrier to incorporating passive house principles into energy code and new construction programs. Objective: The primary objective of this multi-part evaluation is to assess the quality and cost-effectiveness of the IOU cross-cutting programs with regard to supporting the State's ZNE and building electrification goals. The study will also cross-compare the efforts and effectiveness of third-party implementers Public Sector Programs and CCA Programs related to ZNE and building electrification. Key Research Questions: 1. What barriers exist to incorporating passive house concepts into California Energy Code and new construction programs? 2. What are the current strengths and weaknesses of CCAs LGPs and RENs and how can they contribute to building decarbonization and ZNE goals? 3. What is the current market for air source heat pumps ground source heat pumps heat pump water heaters and pool heaters in California? 4. How are builders incorporating heat pumps into their building plans? 5. How does this differ in the low-income market? 6. What are the price differentials between standard heating and cooling equipment and heat pump equipment? 7. What are the attributes of heat pump programs in other jurisdictions? Potential EM&V Methods: Conduct literature review CPUC and PA interviews; Program Data Collection; Barriers to Achieving Passive House Standards; Survey and depth interviews; Delphi Study; Conduct case studies; Data analysis.

59
Table 66. Study Description: ZNE Retrofit Timelines and Costs
Study Title: ZNE Retrofit Timelines and Costs Budget: $335,000
Completion Date: Q4 2021 Study Manager: CPUC ED
Description: A study to research around ZNE and building electrification retrofit market opportunities relative to the broader context of energy market transformation climate and efficiency goals grid reliability and sustainability. Objective: The study will outline benefits of advanced planning as an important element of the strategy for minimizing total impact on tenants and building occupants while maintaining cost effectiveness. Key Research Questions: What is the importance of advanced planning and effective communication with key stakeholders around the benefits and potential disruption of ZNE and electrification retrofits for multifamily and commercial kitchens?
Potential EM&V Methods: CPUC & SME Interviews; Literature Review; Conduct Primary Research.
Table 67. Study Description: Electric Cooktops Market Study
Study Title: Electric Cooktops Market Study Budget: $150,000
Completion Date: Q2 2022 Study Manager: PG&E or SDG&E
Description: Decarbonizing building energy end uses will be essential to achieve State GHG reduction targets, but gas cooking remains a major hurdle to full electrification. Due to a reluctance to convert gas ranges to electric alternatives there is likely a significant number of homes and commercial sites that cannot be fully electrified. This leaves both GHG emissions reductions and avoided gas infrastructure costs on the table. This market study seeks to understand the emissions and infrastructure impact of retaining gas cooking technologies and provide recommendations to enhance electric cooking adoption. It will explore performance data remaining barriers program design knowledge gaps marketability market absorption assessments and equity issues to help the California IOUs understand the current state of the market and the steps that should be taken to encourage widespread adoption of electric cooking technologies. Objective: 1. Identify the potential GHG reductions and avoided infrastructure costs that are currently inaccessible due to the remaining prevalence of gas cooking. 2. Consolidate the current knowledge base on electric cooking in the residential and commercial sectors to provide recommendations for steps that the IOUs can take to encourage wider adoption of electric cooking: a. Summarize available performance data b. Identify key barriers to wider adoption c. Consolidate information on current program descriptions. Key Research Questions: 1. What are the potential GHG reductions and avoided infrastructure costs that are currently inaccessible due to the remaining prevalence of gas cooking? 2. What is already known about the electric cooking market? a. How do electric cooking technologies perform as compared to their gas counterparts with respect to cooking capabilities (for both low- and high-power needs) energy use emissions first cost and operating costs? b. What barriers remain to widespread adoption of electric cooking technologies in the residential and commercial sectors? (e.g. customer perception and preference cookware requirements cooktop reach code exemptions capital and operating costs) c. What electric cooking programs are available both inside and outside of California how are they designed and how successful have they been? (e.g. grants rebates and lending programs) 3. What equity considerations should be taken into account when considering electric vs. gas cooking (e.g. indoor air quality public safety power shutoffs costs)? 4. What steps can the IOUs take to encourage widespread adoption of electric cooking technologies? 5. Are there electric service capacity and infrastructure needs for induction?

60
6. What are the health and indoor air quality benefits for electric cooking? 7. What are the benefits and challenges with traditional electric cooking vs. induction cooking? Potential EM&V Methods: Literature review in-depth interviews with subject matter expert user surveys.
8.9 Industrial Agricultural and Large Commercial (IALC) Table 68 summarizes the IALC EM&V study conducted in 2020. More detailed information on these studies including study descriptions and objectives are available in the 2019 Energy Division & Program Administrator Energy Efficiency Evaluation, Measurement and Verification Plan Version 9 available on the Public Document Area here: https://pda.energydataweb.com/#!/documents/2325/view.
Detailed information on past and current studies can also be found on the searchable Project Status Reporting site located here: https://psr.energydataweb.com/
Table 68. 2020 IALC EM&V Study Summary
Study ID Study Title Study Manager
Study Type Budget Completion
Date
2020__Cross-Cutting_577
Barriers to Efficiency Program Participation for Industrial Agriculture and Large Commercial Customers
PG&E Process Evaluation $95,000 11/18/2020
Source: Program Administrators, CPUC ED and their consultants via https://psr.energydataweb.com/
8.9.1 Planned 2021 EM&V Studies Table 69 summarizes the IALC study planned for 2021.
Table 69. 2021 IALC EM&V Study Summary
Study ID Study Title Study Manager
Study Type Budget Completion
Date 2021_Cross-Cutting_616
Improving Measure Costs for Custom Projects PG&E Other $225,000 6/30/2022
The table below provides further detail regarding the study in Table 69 above.
Table 70. Study Description: Improving Measure Costs for Custom Projects
Study Title: Improving Measure Costs for Custom Projects Budget: $225,000
Completion Date: Q2 2022 Study Manager: PG&E

61
Study Title: Improving Measure Costs for Custom Projects Budget: $225,000
Description: The purpose of this statewide study is to improve measure cost (MC) reporting for custom projects. Most custom projects generally include a strong emphasis on determining accurate savings estimation but little focus on measure costs. More emphasis on measure costs is needed to streamline the process of determining the appropriate incentive levels/rates incentive capping maximums informing the structure of flexible incentive offerings and determining project and program cost effectiveness. This study may look at various aspects of MCs such as: MCs for common measures MCs for hard-to-estimate measures (e.g. New Construction) methods for excluding project costs that are not directly related to the EE portion of the project how MCs can be adjusted when a portion of project costs are related to quantifiable NEBs and possibly other MC topics. This study will address MCs for gas electric and mixed-fuel measures/projects. Objective: To improve measure cost (MC) reporting for custom projects and/or to aid MC estimation methods and resources for program implementers and project developers. The final scope may not be able to address MCs for all types of custom projects but even addressing subsets of custom projects will be valuable. Key Research Questions: 1. What are the challenges identifying appropriate MCs for custom projects? 2. What can be done to simply MC estimation and improve MC accuracy? 3. Which quantifiable non-energy benefits (NEBs) may be best suited for consideration with MCs? Potential EM&V Methods: Literature review interviews with program staff and project developers review of past MC research exploration of existing measure cost data sources and novel cost analysis methods.
8.10 Other Cross-Cutting Studies Table 71 summarizes the Other Cross-Cutting EM&V studies that were conducted in 2019 and 2020. More detailed information on these studies including study descriptions and objectives are available in the 2019 Energy Division & Program Administrator Energy Efficiency Evaluation, Measurement and Verification Plan Version 9 available on the Public Document Area here: https://pda.energydataweb.com/#!/documents/2325/view.
Detailed information on past and current studies can also be found on the searchable Project Status Reporting site located here: https://psr.energydataweb.com/
Table 71. 2019 and 2020 Other Cross-Cutting EM&V Studies Summary
Study ID Study Title Study Manager
Study Type Budget Completion Date
2019_Cross-Cutting_478
Statewide Energy Efficiency Program Composition Review PG&E Process
Evaluation $169,570 6/3/2019
2019_Cross-Cutting_506
Statewide Bottom-Up Portfolio Analysis PG&E Process
Evaluation $200,000 1/1/2019
2019_Non-Resource_528
SW Small Business & Multifamily Pilot Process Evaluation CPUC ED Process
Evaluation $200,000 10/30/2021
2019_Non-Resource_532
Assessment of Community Choice Aggregators CPUC ED Other $250,000 12/30/2020
2019_Non-Resource_594
Assessment of Local Government Partnerships and Regional Energy Networks
CPUC ED Other $250,000 12/1/2020

62
Study ID Study Title Study Manager
Study Type Budget Completion Date
2020_Cross-Cutting_574
CALMAC and CALEE2018 Maintenance PG&E Other $85,000 3/6/2020
2020_Cross-Cutting_595
SoCalREN Portfolio-Level Process Evaluation SoCalREN Process
Evaluation $130,000 07/31/2021
2020_Non-Resource_533
Assessment of Community Choice Aggregators CPUC ED Other $137,500 12/18/2020
2020_Non-Resource_537
Assessment of Local Government Partnerships and Regional Energy Networks
CPUC ED Other $362,500 12/31/2020
Source: Program Administrators, CPUC ED and their consultants via https://psr.energydataweb.com/
8.10.1 Planned 2021 EM&V Studies Table 72 summarizes the Other Cross-Cutting EM&V studies planned for 2021.
Table 72. Proposed 2021 Cross-Cutting- Other EM&V Studies Summary
Study ID Study Title Study Manager
Study Type Budget Completion
Date
2021_Cross-Cutting_621 Post Transition Market Study SCE Market Study $100,000 12/31/2021
2021_Non-Resource_534
Assessment of Community Choice Aggregators CPUC ED Other $166,667 12/17/2021
2021_Non-Resource_538
Assessment of Local Government Partnerships and Regional Energy Networks
CPUC ED Other $333,333 12/17/2021
Source: Program Administrators, CPUC ED and their consultants via https://psr.energydataweb.com/
The table below provides further detail regarding the studies in Table 72 above.
Table 73. Study Description: Post Transition Market Study
Study Title: Post Transition Market Study Budget: $100,000
Completion Date: Q2 2021 Study Manager: SCE
Description: Conceptually EE research manages risk for policymakers, implementers, and grid managers whether savings estimates savings forecasts or program operations and management. As we transition to increased 3P programs tracking key customer and market metrics can not only satisfy the risks above but can identify service gaps measure emerging market indicators not captured in solicitation contracts construct and measure indicators for innovation or comprehensiveness or satisfaction or simply track metrics already identified by policymakers. These metrics might also provide indicators ways of discerning the impacts of significant events such as COVID-19 on program potential and could support targeted solicitations to address these specific instances/gaps. Objective: This market study will identify and provide customer and program data and metrics to support the post transition program period. The study will identify service gaps measure emerging market indicators not captured in solicitation contracts construct and measure indicators for innovation or comprehensiveness or satisfaction or simply track metrics already identified by policymakers.

63
Study Title: Post Transition Market Study Budget: $100,000
Key Research Questions: 1. What metrics can be identified and tracked that will identify performance service or market potential gaps? 2. Can these gaps be identified and detailed to support additional solicitations or the modification of existing ones in order to provide cost-effective savings? 3. Are there metrics that are not identified in contracts that we should be measuring or have a plan for measuring outside of energy and demand savings? 4. Are there metrics that can track policy outcomes like innovation and comprehensiveness? Potential EM&V Methods: Primary and secondary research techniques including interviews literature reviews and benchmarking.
Table 74. Study Description: Assessment of Community Choice Aggregators
Study Title: Assessment of Community Choice Aggregators Budget: $166,667
Completion Date: Q4 2021 Study Manager: CPUC ED
Description: This study is currently in the scoping stage and may estimate the impacts of CCA resource programs.
Objective: Possibly to estimate the impacts of CCA resource programs.
Key Research Questions: This study is in the scoping stage. ED has indicated an interest in possibly focusing on evaluating the impacts of CCA resource programs for the third-year evaluation.
Potential EM&V Methods: TBD
Table 75. Study Description: Assessment of Local Government Partnerships and Regional Energy Networks
Study Title: Assessment of Local Government Partnerships and Regional Energy Networks Budget: $333,333
Completion Date: Q4 2021 Study Manager: CPUC ED
Description: Assess the energy savings benefits derived from non-resource programs offered by the LGPs and RENs in California through process attribution and channeling analyses. Objective: Assess the contributions of programs and non-resource activities of selected LGPs and the RENs; examine the overlap of activities and programs with other PAs and develop metrics to measure the unique value of LGPs and RENs Key Research Questions: REN effectiveness at achieving the CPUC’s stated program design goals. 1. Which LGP and REN non-resource program activities are successfully leading customers towards resource programs, and which are not? 2. Should there be a shift of resources towards the more successful non-resource programs or an expansion of these programs? 3. How many participants learned about the PAs’ EE resource programs through participation in LGP and REN non-resource programs particularly their ME&O activities? 4. How many went on to participate in resource programs? 5. What are the gross ex ante energy savings achieved by these customers? 6. An assessment of the degree to which LGPs engaged with local government agencies/departments what that experience was like what resulted and how it might be improved to help LGs become more

64
effective including specific initiatives such as effectiveness of code compliance efforts or accessing hard-to-reach market segments.
Potential EM&V Methods: TBD

65
Appendix A. Guidelines for CPUC-ED and California IOU EM&V Reports
Guidelines for CPUC-ED & California IOU
Evaluation Measurement & Verification Reports
Style Guidelines
1. Be clear. People often overestimate their own writing abilities, including technical experts. Consider using a professional technical writer, or at a minimum have your draft reviewed by a professional copy editor. You may have done some great research, but unless it’s well written, no one will ever know. A good rule of thumb is to read the first sentence of every paragraph and make sure the first sentence represents the main idea in the paragraph, and that the sequencing of the paragraphs flow. Achieving consistency in content, structure, and voice is extremely important when there are multiple contributors to a research project.
2. Be concise. Reports should be as short as possible, ideally 50-60 pages. Appendices can be as long as necessary. Executive Summaries should be a maximum of 4 pages.
3. Use graphics appropriately. Graphics are attention grabbing therefore reserve their use for clarity and/or impact. Label graphics carefully and always include the sample size “N”. The best graphics don’t require any explanation in the report to convey a clear message. Employ quality control: Text should match graphics and grammar and spelling should be checked.
4. Avoid repetition. We realize that you may have used content from other documents as a starting point. Carefully review those pasted items and ensure that when concepts are repeated, it is for the explicit purpose of clarifying or emphasizing a point. Otherwise, keep repetition to a minimum.
Content Guidelines
1. Respect multiple audiences. Main audiences for reports include EE program, CPUC, and IOU staffs. However, all final EM&V reports are publicly available. Do not assume everyone reading the report will be familiar with program details, measures, evaluation methods or terminology. Please explain briefly, while maintaining readability. Consider including a glossary of terms and acronyms.
2. Explain study scope. Clearly state the study scope, goals, and limitations and address how this research will add to the current understanding of the subject. Provide an executive summary that allows the reader to remember and recognize the key reasons, conclusions and recommendations of the research effort.
3. Use trained researchers to report data. Researchers should have appropriate training and experience to effectively review and report on qualitative data. Poor analysis of qualitative data can lead to inaccurate and misleading conclusions.
4. Identify all sources of data. Data need not be quantitative, but all sources need to be very well-identified. Qualitative data are fine but need to be properly reported and analyzed. Ensure that

66
data sources and reference materials are appropriate. Wikipedia and blogs are not appropriate citations or references for information included in evaluation reports.
5. Indicate sample sizes and descriptive statistics. When reporting results and summary statistics, whether in graphics or in the narrative, always include the sample size “N”, standard deviation, min/max, and standard error. The questions on which data tables and data reporting are built need to be in the footnotes or in a table so the reader can properly interpret data in the context of what was originally asked.
6. Differentiate between conclusions and recommendations. Ensure that conclusions are (1) very tightly tied to data and (2) logical results emerge from the data and analysis. Recommendations are often helpful, but it is important that they also be well-tied to data and data sources. When providing recommendations, identify caveats while distinguishing ideas, opinions, possibilities, and suggestions, from true data-driven recommendations. For example, use words such as “should” or “must” for a recommendation and words such as “can” or “may” for a suggestion.
7. Explain clearly how the need for each recommendation is supported by your findings. Specify the measurable benefit that should be the result of following a recommendation. If there are no data showing a need, and if you cannot state a measurable benefit or improvement, do not make that recommendation.
8. Don’t over utilize the "Other” category. Too often fill-in-the-blank responses or pre-codes are poorly handled resulting in high percentages of responses falling into the “other” category. Too often these responses are ignored and/or not properly analyzed, and therefore represent wasted time and research dollars. Typically, these responses are the result of (1) poor interviewing (2) a bad coding system or (3) a researcher who does not take the time to investigate why a high incidence of “other” is occurring.
9. Respect confidential data. Ensure that the report protects all confidential customer information as appropriate.

67
Appendix B. Impact Evaluation Standard Reporting Guidelines The purpose of this memo is to inform parties to R.13-11-005 of the Impact Evaluation Standard Reporting (IESR) guidelines, which are proposed for inclusion as an appendix to current and future impact evaluation reports.
Many California energy efficiency (EE) stakeholder parties rely on impact evaluations for a variety of needs, including program, policy and procurement planning. The impact evaluation reports are the primary source of energy savings information upon which many of these groups can base decisions or gauge measure, program and portfolio performance. Representatives from the California Public Utilities Commission (CPUC) and the Investor Owned Utilities (IOUs) recently conducted a review of the 2010 – 2012 impact evaluation reports with the goal of identifying best practices and areas in which more consistency is needed to ensure that these reports achieve the following principal functions:
1. Comprehensive evaluation results are documented 2. Ex Ante vs. Ex Post savings are comparable 3. Readers can easily access and identify important results 4. Results from different impact evaluations are comparable
These goals are complicated by the many different savings domains and metrics by which the IOU portfolios are measured. The CPUC has established goals and incentives for IOU EE programs based on ex ante and ex post, gross and net, and first year, annualized19 and lifecycle savings as well as average portfolio Effective Useful Life (EUL)220. Therefore, comprehensive impact evaluations must measure, organize, and report results in each of these categories. When multiple firms conduct the evaluations, using a variety of reporting methods, it becomes even more important that complete, comparable, and fundamental results can be readily found in every report.
.
The following protocols were developed to ensure the above goals are met. These guidelines, and the associated templates, are intended to supplement current styles and practices rather than replace them.
Guideline 1. Complete the Appendix A template for reporting of first year and lifecycle savings and associated metrics. This template includes two tables (gross and net) that report:
a.) Ex Ante and Ex Post Gross and Net savings
19 Annualized savings = lifecycle savings/EUL. When a measure is installed as part of new construction, as natural replacement or as replace on burnout, annualized savings is equal to first year savings. In cases of early retirement, annualized savings reflects the impact of the remaining useful life (RUL) periods and associated baselines on lifecycle savings 20 2In Decision 12-05-015, the CPUC adopted gross annual savings goals for 2013 – 2014 program cycle. The Decision Adopting Efficiency Savings and Performance Incentive Mechanism (ESPI; Decision 13-09-023) calls for the resource savings component of the ESPI to be determined based on a combination of locked down ex ante and verified ex post net lifecycle savings. The latter are based on annualized savings goals and portfolio average EUL. The Decision quotes a “business as usual” portfolio average EUL of 9 years for electric and 14 years for gas EE measures with target goals of 12 years for electric and 15 years for gas.

68
b.) Gross Realization Rate (GRR) and Net Realization Rate (NRR) for both total and evaluated savings
c.) Ex Ante and Ex Post Net-to-Gross Ratios (NTG) for both total and evaluated savings
d.) Percent of Each Measure Group Passed Through
These savings and metrics are to be broken out by:
i.) Evaluated Measure Groups
ii.) Other Passed Through Measure Groups.
The precise methodology to determine precision of the evaluated GRR may vary by evaluation. However, precision measurements are essential for complete results and should be included either in the Appendix A tables below or in separate tables/discussion also included in Appendix A of the evaluation. All evaluated savings321 should be included in Appendix A within a Measure Group422. Within a Measure Group, a portion or all of the gross savings from certain individual measures may be passed through. The portion of a Measure Group’s passed through gross savings should be reported as a percentage of ex ante savings as shown in the Appendix A example. The GRR for each measure group is reported based both on the total ex ante and ex post gross savings (including pass through) and the evaluated ex ante and ex post gross savings (excluding pass through). Similarly, the NTG ratio of a measure group should be reported based on both the total and evaluated savings. Note that the sample of evaluated gross savings may not correspond to the sample of evaluated net savings. Other passed through savings (from measures not included in Measure Groups) should be reported523 and may be broken out into multiple categories if appropriate and illustrative. The savings and associated realization rates and NTG ratios are rolled up to both the IOU level and statewide.
Custom measures may not lend themselves to well defined measure groups. Alternative appropriate strategies for the completion of the Appendix A tables for custom impact evaluations include a savings breakout by segmentation schemes, project types or measure types.
The Appendix A table should be repeated for each category of analyzed impacts (energy, peak load, and natural gas). Thus, up to 12 Appendix A tables may be needed:
• First Year Gross Energy (kWh) Savings
21 Evaluated savings have been updated by impact parameter measurements and/or NTG adjustments. 22 4Measure Groups should be chosen by the evaluator such that results from similar individual measures are summed together. Recent examples include High Impact Measure groups from the 2010 – 2012 impact evaluation cycle and measure categories identified as highly uncertain in the Decision Adopting Efficiency Savings and Performance Incentive Mechanism (ESPI; Decision 13-09-023). 23 5Inclusion and standard treatment of passed through savings is critical for both completeness and transparency as not all parties within the broader impact evaluation audience have access to program tracking data or familiarity with each measure assigned to an evaluation. Aggregated passed through measures often account for a significant fraction of total savings and their inclusion or exclusion can also have substantial impacts on realization rates, NTG values and decision making.

69
• First Year Net Energy (kWh) Savings • Lifecycle Gross Energy (kWh) Savings • Lifecycle Net Energy (kWh) Savings • First Year Gross Peak Load (MW) Savings • First Year Net Peak Load (MW) Savings • Lifecycle Gross Peak Load (MW) Savings • Lifecycle Net Peak Load (MW) Savings • First Year Gross Natural Gas (MMTherms) Savings • First Year Net Natural Gas (MMTherms) Savings • Lifecycle Gross Natural Gas (MMTherms) Savings • Lifecycle Net Natural Gas (MMTherms) Savings
Finally, if applicable, interactive effects should be included in the savings reported for all measures.
Guideline 2. For Measure Groups or passed through measures in which early retirement (ER) is claimed or found in the evaluation, report an Appendix B table that gives ER and EUL metrics along with first year and annualized savings. These tables are designed to provide standardized information regarding ER and useful life. Early retirement can have a major impact over both first year and lifecycle savings. For a complete understanding of measure performance and to enable a comprehensive comparison of ex ante and ex post savings, stakeholders need metrics on ex ante ER claims and ex post ER findings along with the effect ER has on savings. Because of the emphasis on both annual and lifecycle savings and the definitive goals established for each, EULs should be reported for all evaluated Measure Groups. The Appendix B template standardizes reporting of ER, EUL and annualized savings by Measure Group and develops a weighted EUL. The appendix B table should be repeated for:
• Energy (kWh) Savings • Peak Load (MW) Savings • Natural Gas (MMTherms) Savings - when applicable
Guideline 3. Include a standardized Appendix C to catalog recommendations resulting from the evaluation research. This should take the form of a table or prepopulated Excel spreadsheet that would facilitate the Response to Recommendation (RTR) process. The target for each recommendation should be specified along with a brief description of the study findings upon which the recommendation is based and, if needed, where more detailed information that supports the recommendation can be found. This appendix would make the RTR process more transparent and help draw attention to recommendations that are aimed at coordinated/collaborative processes across multiple parties, such as Ex Ante Review or organization of program tracking data. Recommendations aimed at specific workpaper or DEER updates should be included and specified accordingly. An RTR template with illustrative example recommendations is included in Appendix C of this memo.

70

71

72
Appendix C. Workpaper Details All workpapers through 2020 can be found on the CPUC Workpaper and Disposition Archive here: http://www.deeresources.net/workpapers
This archive provides the links to download each workpaper.
The planned 2021 workpapers will be added to the CPUC Workpaper and Disposition Archive throughout 2021. All in-progress workpapers, which includes workpapers that have been submitted but not disposed at the time of the publish date of the report, and also workpapers in development with a workpaper plan are available here: http://www.deeresources.com/index.php/non-deer-workpapers
This site is updated monthly.

73
Appendix D. CPUC ED Resolution E-5082 Approval of the Database for Energy-Efficiency Resources updates for Program Year 2022 and revised version for Program Years 2021 and 2020
The full draft resolution is publicly available here: https://docs.cpuc.ca.gov/PublishedDocs/Published/G000/M346/K161/346161639.PDF

74
Appendix E. EM&V Studies Table
A table containing all the EM&V studies can be found in the attached Excel document titled, “Appendix E - All Studies_2019_2021.”

75
Appendix F. Public Comments
A table containing all public comments can be found in the attached Excel document titled, “Appendix F – Public Comments_2019_2021 “.