Energy Data Management Manual for the Wastewater Treatment ... · energy data for accounting or...
35
Energy Data Management Manual for the Wastewater Treatment Sector DECEMBER 2017 DOE/EE-1700
-
Upload
hoangxuyen -
Category
Documents
-
view
216 -
download
0
Transcript of Energy Data Management Manual for the Wastewater Treatment ... · energy data for accounting or...
Energy Data Management Manual for the Wastewater Treatment Sector DECEMBER 2017
DOE/EE-1700

Learn more at betterbuildingsinitiative.energy.gov
Authors and AcknowledgementsThis report was prepared by Paul Lemar, Resource Dynamics Corporation, under contract with Oak Ridge National Laboratory (ORNL) and in collaboration with Andre de Fontaine at the U.S. Department of Energy. The work described in this technical report was funded by the U.S. Department of Energy's Office of Energy Efficiency and Renewable Energy under Oak Ridge National Laboratory Contract No. DE-AC05-00OR22725.
Acknowledgements: The authors of this document would like to thank the following professionals for their contributions:
Joe Cantwell, Wisconsin Focus on Energy
Alice Dasek, U.S. Department of Energy
Brian Erickson, Stoughton Utilities
Lauren Fillmore, Water Environment & Reuse Foundation
Sapna Gheewala, U.S. Department of Energy
Joe Kottwitz, Wisconsin Focus on Energy
Megan Levy, Wisconsin Office of Energy Innovation
Barry Liner, Water Environment Federation
Bruce Lung, U.S. Department of Energy
Sachin Nimbalkar, Oak Ridge National Laboratory
Prakash Rao, Lawrence Berkeley National Laboratory
Melissa Rickert, Wisconsin Focus on Energy
U.S. Environmental Protection Agency – multiple individuals
Disclaimer: This report was prepared as an account of work sponsored by an agency of the United States Government. Neither the United States Government nor any agency thereof, nor any of their employees, makes any warranty, express or implied, or assumes any legal liability or responsibility for the accuracy, completeness, or usefulness of any information, apparatus, product, or process disclosed, or represents that its use would not infringe privately owned rights. Reference herein to any specific commercial product, process, or service by trade name, trademark, manufacturer, or otherwise, does not necessarily constitute or imply its endorsement, recommendation, or favoring by the United States Government or any agency thereof. The views and opinions of authors expressed herein do not necessarily state or reflect those of the United States Government or any agency thereof.
2

Table of Contents
Glossary ..................................................................................................................................................... 1
Introduction ............................................................................................................................................... 2
Evolution of Wastewater Treatment Plants and Focus on Energy Performance ..........................................3
Organizational Benefits of Energy Management ..........................................................................................4
Energy Data Management as a Foundational Element to Strong Energy Management .............................5
Barriers to Energy Data Management ...........................................................................................................6
Issues to Consider Before Starting ............................................................................................................ 7
Energy Consumption in Wastewater Treatment Plants .................................................................................7
Importance and Value of Submetering ..........................................................................................................8
Addressing Biogas .........................................................................................................................................9
Energy Data Management: Step-by-Step Approach ............................................................................... 10
Step 1: Define the Boundary .......................................................................................................................10
Step 2: Establish the Baseline ......................................................................................................................11
Step 3: Assemble Data and Apply Conversions ..........................................................................................11
Applying Conversions ...........................................................................................................................................................................................................................................................................................12
Accounting for On-Site Electricity Generation From Biogas ......................................................................................................................................................................12
Step 4: Determine a Metric or Set of Metrics to Track Over Time .............................................................15
Step 5: Set Up a Tracking System ................................................................................................................17
Overview of Publicly Available Energy Data Management Tools ............................................................ 19
EPA ENERGY STAR Portfolio Manager .......................................................................................................19
Considerations.................................................................................................................................................................................................................................................................................................................20
EPA Energy Assessment Tool ......................................................................................................................20
Considerations.................................................................................................................................................................................................................................................................................................................21
DOE EnPI Tools ............................................................................................................................................21
Considerations.................................................................................................................................................................................................................................................................................................................22
EnPI Lite .....................................................................................................................................................................................................................................................................................................................................22
Next Steps ............................................................................................................................................... 23
Additional Resources ............................................................................................................................... 24
Appendices .............................................................................................................................................. 26
Appendix A. Energy Unit Conversion Factors and Primary Energy Conversion Factors ...........................26
Appendix B. Wastewater Energy Performance Data Tool Comparison Matrix ..........................................27
Appendix C. FAQs: Getting Started With Data Tools .................................................................................28

Learn more at betterbuildingsinitiative.energy.gov
GlossaryGlossary
Benchmarking: The ability to compare the energy performance of one plant to the performance of another plant or group of plants.
British thermal unit (Btu): The amount of heat required to raise the temperature of one pound of water one degree Fahrenheit; equal to 252 calories. Btu is a unit of measurement that allows multiple energy sources, such as kilowatt-hours of electricity and therms of natural gas, to be converted to a common unit.
Calendarization: The process of aligning all energy performance data inputs into 12 equal increments. This is important because utility bills do not always correspond perfectly with calendar months. As a result, other data collected in monthly increments, such as flow volumes and biochemical oxygen demand (BOD) levels, sometimes need to be adjusted to match the utility billing cycle.
Combined heat and power (CHP): The concurrent production of electricity or mechanical power and useful thermal energy (heating and/or cooling) from a single source of energy. Because CHP systems generate electricity at the point of use, heat normally lost in the power generation process can be recovered to provide needed heating and/or cooling. As a result, CHP applications operate at 65% to 75% efficiency, a large improvement over the national average of about 50% for these services provided separately.
Energy data management: The process of collecting and analyzing energy data to support an energy management system, identify energy-saving opportunities, and strengthen energy-related operational practices.
Energy data tracking: The practice of keeping track of energy data for accounting or financial reasons, not for energy management reasons.
Energy intensity: A ratio of energy consumption to some measured level of activity or facility size. In the wastewater treatment sector, energy intensity metrics are often represented as energy consumed per pound of biological oxygen demand removed or energy consumed per volume of water treated.
Energy management system: An integrated set of policies and procedures that allows facilities to systematically track, analyze, and improve energy efficiency. Energy management systems typically follow the "plan, do, check, act" approach, as described in the ISO 50001 energy management standard.
Joule: A metric unit of energy or work. One joule is equivalent to the energy produced by a force of one newton operating through a distance of one meter. One joule per second equals one watt, and one Btu equals 1,055 joules. Similar to Btu, a joule is a unit of measurement that allows multiple energy sources to be converted to a common unit.
Kilowatt-hour (kWh): A unit or measure of electricity supply or consumption of 1,000 watts over the period of one hour; equivalent to 3,412 Btu. This is the unit that most commonly appears on electric bills.
Primary energy: Also known as source energy, primary energy is the energy consumed by a plant or building (site energy) plus the energy required to produce and deliver the energy products to the location. The Department of Energy (DOE) uses a national factor of three to convert site energy to source energy.
Renewable energy: Energy derived from resources that are regenerative or for all practical purposes can not be depleted. Types of renewable energy resources include moving water (hydro, tidal, and wave power), thermal gradients in ocean water, biomass, earth, sun, and wind. Biogas generated through the anaerobic digestion process in wastewater treatment plants is considered a renewable energy resource for the purposes of this document.
Site energy: This is the energy directly consumed by the plant or building, measured using facility meters and provided in electric bills; it does not take into account the energy required to produce and deliver the energy to the end user.
Submeter: These devices allow property owners and facility managers to measure energy consumption at a more detailed level than provided through the primary utility meter. Submeters can measure energy consumption of a particular process or piece of equipment in an industrial facility, or in a room or on a floor of a commercial building.
Water resource recovery facility: A new term for wastewater treatment plants that reflects their broader role in recovering nutrients, materials, and energy, beyond producing clean water.
1
IntroductionEnergy efficiency has become a higher priority within the wastewater treatment sector, with facility operators and state and local governments ramping up efforts to reduce energy costs and improve environmental performance. Across the country, municipal wastewater treatment plants are estimated to consume more than 30 terawatt hours per year of electricity,1 which equates to about $2 billion in annual electric costs.2 Electricity alone can constitute 25% to 40%3 of a wastewater treatment plant’s annual operating budget and make up a significant portion of a given municipality’s total energy bill. These energy needs are expected to grow over time, driven by population growth and increasingly stringent water quality requirements.
As a result, wastewater treatment plants are taking steps to manage and reduce their energy consumption. Over the years, many examples have been documented that demonstrate significant energy reductions are possible through cost-effective measures.4
Building on this success, many in the industry are taking a broader, more strategic approach to energy management. Many wastewater treatment plants are setting ambitious, long-term energy efficiency goals and incorporating renewable energy as well. As the wastewater treatment sector’s approach to energy management evolves, the need for reliable and robust energy data management systems is growing as well. These systems help plants track progress against their energy goals, determine whether their energy efficiency efforts are having a meaningful impact, uncover opportunities for savings, and allow for comparison to other, similar plants. In short, energy data management is an essential element to a robust energy management system.
DOE Partnerships Inform Guidance
This document is informed by the Department of Energy’s (DOE's) experience working with partners in the wastewater treatment sector through the following programs:
The Better Buildings Sustainable Wastewater Infrastructure of the Future (SWIFt) Accelerator, in which 27 state, regional, and local agencies representing almost 85 facilities are striving toward a 30% energy-savings goal. Through a specially designed data phase, SWIFt partners received guidance on energy data management and were asked to establish a baseline, identify appropriate energy performance metrics, and select an energy data-tracking tool.
The Better Buildings, Better Plants Program and Challenge, through which 24 water and wastewater treatment agencies have set organization-wide energy-saving goals and report their progress once a year to DOE. Partners receive guidance from DOE on setting baselines and tracking energy performance over time.
The Superior Energy Performance (SEP) Program, through which seven water and wastewater treatment facilities are seeking certification to ISO 50001, the international energy management standard. Also, using a rigorous measurement and verification protocol, the facilities must demonstrate a threshold level of energy performance improvement.
. 1 Arzbaecher, C., K. Parmenter, R. Ehrhard, and J. Murphy. 2013. Electricity Use and Management in the Municipal Water Supply and Wastewater Industries. Palo Alto, CA: Electric Power Research Institute and Water Research Foundation. http://www.waterrf.org/PublicReportLibrary/4454.pdf.
. 2 Assumes 7 cents per kilowatt-hour (kWh) average electric costs.
. 3 New York State Energy Research and Development Authority 2008. Statewide Assessment of Energy Use by the Municipal Water and Wastewater Sector: Final Report. Albany, NY.
. 4 Crawford, G., and J. Sandino. 2010. Energy Efficiency in Wastewater Treatment in North America: A Compendium of Best Practices and Case Studies of Novel Approaches. Alexandria, VA: Water Environment Research Foundation.
2
Learn more at betterbuildingsinitiative.energy.gov
The purpose of this document is to describe the benefits of energy data management, explain how it can help drive savings when linked to a strong energy management program, and provide clear, step-by-step guidance to wastewater treatment plants on how to appropriately track energy performance. It covers the basics of energy data management and related concepts and describes different options for key steps, recognizing that a single approach may not work for all agencies. Wherever possible, the document calls out simpler, less time-intensive approaches to help smaller plants with more limited resources measure and track energy performance. Reviews of key, publicly available energy-tracking tools are provided to help organizations select a tool that makes the most sense for them. Finally, this document describes additional steps wastewater treatment plant operators can take to build on their energy data management systems and further accelerate energy savings.
Evolution of Wastewater Treatment Plants and Focus on Energy Performance
The wastewater treatment sector is evolving as it seeks to upgrade its operations and move to a future that includes lower energy consumption and greater reliance on renewable sources of power. Reflecting this shift, in 2014, the Water Environment Federation (WEF) and other water groups formally began using the term "water resource recovery facility" in place of "wastewater treatment plant"5 to recognize the multipurpose role these facilities play in producing clean water, recovering nutrients (such as phosphorus and nitrogen), and reducing dependence on fossil fuel through the production and use of renewable energy.6 Several cities have followed suit and formally adopted this term for their plants as well.7 While acknowledging the momentum and rationale behind "water resource recovery facility," this document uses the term "wastewater treatment plant" to align with language used by the U.S. Environmental Protection Agency (EPA) and some DOE programs.
Several wastewater treatment plants have set "zero energy" or "energy neutral" goals,8 which means they reduce the amount of energy consumed to the maximum extent practicable and then rely on the energy they recover from their waste stream, or other renewable energy resources, to meet their remaining needs. Many more plants have set ambitious energy efficiency targets and implemented other energy management practices. Close to 150 plants, processing about 14% of the nation's wastewater flow and serving almost 13% of its population, have set ambitious energy-saving goals through DOE partnership programs alone. Additionally, between 500 to 1,000 wastewater treatment plants have used EPA's ENERGY STAR Portfolio Manager to benchmark their energy consumption.
. 5 Fulcher, J. 2014. Changing the terms: Water resource recovery facility terminology gains momentum. WEF Highlights. May 22. http://news.wef.org/changing-the-terms.
. 6 U.S. Environmental Protection Agency. 2016. Types of Anaerobic Digesters: Digesters at Water Resource Recovery Facilities. https://www.epa.gov/anaerobic-digestion/types-anaerobic-digesters#WRRFdigesters.
. 7 See, for example, City of East Lansing, MI. October 6, 2015. Resolution Renaming the East Lansing Waste Water Treatment Plant to the Water Resource Recovery Facility and Acknowledging the Dedicated Public Servants Who Run the Facility. (2015, October 6). Retrieved from http://eastlansing.granicus.com/MetaViewer.php?view_id=2&clip_id=487&meta_id=30770.
. 8 Tarallo, S., A. Shaw, and E. Zamenski, et al. 2015. Demonstrated Energy Neutrality Leadership: A Study of Five Champions of Change. Alexandria, VA: Water Environment Research Foundation.
3

Organizational Benefits of Energy Management
The benefits of taking a more systematic, or strategic, approach to energy management are clear. Plants across different size categories, geographic locations, and treatment types have achieved significant energy and cost savings through energy management approaches, which generally feature top leadership commitment, clear targets, accountability systems, and robust data tracking (see text box for a more detailed description of energy management systems). A few examples include:
� The Greater Lawrence Sanitary District in North Andover, MA, cut energy intensity by 50% through participation in a state energy management pilot program. Savings resulted from cost-effective measures, such as putting together an energy plan, benchmarking energy use, and implementing projects uncovered through energy audits. These actions are saving nearly $1.5 million per year.9
� The Victor Valley Wastewater Reclamation Authority (VVWRA) in the high Mojave desert region of California paired energy efficiency measures with an innovative energy recovery project to achieve a 27% improvement in energy intensity. These measures have saved the agency about $400,000 per year in energy costs, which represents about a third of its total energy bill.10 Alongside these efforts, VVWRA is developing a robust energy management system through participation in DOE’s SEP program, which will allow it to better sustain these savings over time.
� Consistent with an energy management plan its board of directors approved in 2017, the Orange Water & Sewer Authority implemented a series of upgrades to its aeration and mixing systems, which resulted in energy intensity reductions greater than 40% at its Mason Farm plant in Chapel Hill, NC. This project cut electric bills by about $350,000 per year, a little more than 40% of the plant’s total annual purchases.11
Smaller facilities have also demonstrated significant energy savings by adopting energy management practices. For example:
� The Village of Palmyra, WI, wastewater treatment facility, upgraded its aerators to a fine bubble diffusion system, which has reduced electrical consumption by close to 50%. The facility, which serves just under 2,000 people, is saving more than $1,000 a month in estimated energy bills.
� A plant in Northern Moraine, WI, reduced electricity consumption by close to 70% after making a series of upgrades to its 0.6 mgd activated sludge treatment system. Improvements, which included installing a fine bubble aeration system with dissolved oxygen controls and switching to smaller capacity blowers, is saving the facility close to an estimated $2,000 per month.12
. 9 U.S. Environmental Protection Agency. 2013. Energy Efficiency in Water and Wastewater Facilities: A Guide to Developing and Implementing Greenhouse Gas Reduction Programs. Washington, DC. https://www.epa.gov/sites/production/files/2015-08/documents/wastewater-guide.pdf.
. 10 See Victor Valley Wastewater Reclamation Authority’s profile page on the Better Buildings Solution Center, here: https://betterbuildingssolutioncenter.energy.gov/partners/victor-valley-wastewater-reclamation-authority.
. 11 U.S. Department of Energy, Better Buildings. 2017. Showcase Project: Energy Efficient Aeration and Mixing for Mason Farm Wastewater Treatment Plant. https://betterbuildingssolutioncenter.energy.gov/showcase-projects/energy-efficient-aeration-and-mixing-mason-farm-wastewater-treatment-plant.
. 12 E-mail correspondence with State of Wisconsin Energy Office
What Is an Energy Management System?
The ISO 50001 energy management standard defines an energy management system as a set of interrelated elements to establish an energy policy and objectives, and the process and procedures to achieve those objectives. An energy management system positions organizations to achieve energy and cost savings through informed decision-making. Implementing such a system helps an organization develop a culture for continual improvement of energy performance and efficiency, resulting in sustained energy savings.
4
Learn more at betterbuildingsinitiative.energy.gov
Cost savings are often the primary driver behind the establishment of aggressive energy goals. Money not spent on energy can be used for other purposes, such as modernizing equipment, hiring new employees, and avoiding future rate increases. Since wastewater treatment plants are usually the largest electric consumer within a municipality, they are often called upon to implement energy reduction measures to help cities meet their broader energy and sustainability goals. Additionally, broader, societal benefits of energy efficiency can be important motivating factors, such as:
� Extending infrastructure life. Energy-efficient options often have longer service lives and require less maintenance than older, less efficient units, according to the EPA.13 Other maintenance issues can be addressed in the course of implementing energy projects, improving the facility's overall operations.
� Supporting economic growth and job creation. Energy efficiency investments can stimulate the local economy and grow markets by hiring and sourcing locally. The energy efficiency services sector accounts for more than 800,000 jobs and is growing by 3% annually.14 Most of these jobs are performed locally by workers from relatively small companies.
� Demonstrating leadership. By implementing energy efficiency projects, wastewater treatment facilities and local governments can demonstrate leadership through responsible stewardship of ratepayer funds. This can have a positive impact on the public’s view of the wastewater treatment plant and lead to improved relations with the surrounding community.
� Reducing air pollution. By improving energy efficiency, wastewater treatment facilities cut electric demand, which can lead to corresponding decreases in greenhouse gas emissions and criteria air pollutants within the electric utility sector. This can have important public health benefits for residents.
This document is focused on energy data management, an important component of a broader energy management system. For more information on other aspects of energy management, such as establishing goals, identifying energy champions, and understanding utility rate structures, please see resources such as the WEF Energy Roadmap,15 DOE's ISO 50001 web pages,16 and EPA's Energy Management Guidebook for Water and Wastewater Utilities.17
Energy Data Management as a Foundational Element to Strong Energy Management
Energy performance data management will not lead to improved energy performance by itself. Improved metrics should support a broader energy management system that will drive significant savings. This document uses the term "energy data management" to stress the link to a larger energy management strategy. Energy data management is distinct from energy data tracking—the practice of tracking energy bills simply for accounting reasons, which many plants already do. Energy data management signifies that energy data are tracked, analyzed, and used to identify energy-saving opportunities, validate implemented energy efficiency actions, or strengthen energy-related operational practices.
Energy data management has a number of benefits. It can help facility operators with:
� Tracking performance against goals. Organizations that set quantitative energy efficiency goals need robust energy data to establish a baseline and to measure progress toward those goals over time.
. 13 U.S. Environmental Protection Agency. 2013. https://archive.epa.gov/epa/sites/production/files/2015-08/documents/wastewater-guide.pdf.
. 14 American Council for an Energy-Efficient Economy. August 31, 2012. Energy Efficiency and Economic Opportunity. Fact sheet. Washington, DC.
. 15 The Water Environment Federation. 2013. The Energy Roadmap: A Water and Wastewater Utility Guide to More Sustainable Energy Management. Alexandria, VA.
. 16 U.S. Department of Energy. ISO 50001 Energy Management Standard. https://energy.gov/ISO50001
. 17 U.S. Environmental Protection Agency. 2008. Ensuring a Sustainable Future: An Energy Management Guidebook for Wastewater and Water Utilities. Washington, DC. https://goo.gl/LGm3Pn
5

� Validating energy management efforts. Without strong data, it is impossible to determine whether energy efficiency investments have a measurable impact on consumption and costs. Energy data allows plant operators to conduct analyses to demonstrate the benefits of their energy efficiency actions, which helps maintain momentum for energy management within the organizations.
� Identifying "hot spots." Detailed energy data can help plant operators identify pieces of equipment that consume the most energy, which may be the ones most in need of improvement. In this way, energy data can draw a map to areas that hold the greatest potential for cost-effective improvements.
� Spotting anomalies or billing errors. Energy data collected on a continuous or at least monthly basis will uncover patterns of use and may help identify consumption spikes or other anomalies. Further investigation can reveal pieces of equipment unnecessarily being left on or utility billing errors. Careful monitoring of energy data, especially submetering data, can help identify malfunctioning equipment and potentially predict equipment failure before it occurs.
� Allowing for comparative analyses. In some cases, energy data can facilitate benchmarking, which is the act of comparing the energy performance of one plant to similar, peer facilities. Benchmarking can help determine whether the facility is performing at or below average levels, and whether it could benefit from more focused attention on energy efficiency.
� Celebrating progress. Plants need energy data to know when they have met their energy reduction goals. In the eyes of internal and external stakeholders, sophisticated and transparent energy data management systems tend to provide greater credibility to energy efficiency accomplishments.
For these reasons, all credible energy management frameworks include energy performance data tracking as a key, required element. These frameworks include the ISO 50001 energy management standard, EPA’s ENERGY STAR Guidelines for Energy Management, EPA's Energy Management Guidebook for Wastewater and Water Utilities, and the WEF Energy Roadmap. Additionally, establishing an energy baseline and performance tracking system is a requirement of both SWIFt and the Better Plants Program and Challenge (see Additional Resources section for more information on these programs).
Barriers to Energy Data Management
Despite the benefits, the current state of energy data management within the wastewater treatment sector is uneven. While some plants carefully collect and analyze data to support their energy goals, others simply track costs, and still others consider energy a basic, unavoidable cost of business and pay the monthly bills without tracking the underlying performance data. About a third of the facilities polled through SWIFt indicated they were not tracking energy performance data.
The barriers to improving energy data management are real but manageable. Plants prioritize the production of clean water at low cost above all other issues. As a result, energy efficiency and related energy data management systems will not always receive the sustained senior-level attention and resources they need to succeed. To overcome this barrier, plant staff must clearly demonstrate the benefits of energy management to senior leaders and show how it advances the plant’s goals of producing high-quality water at lowest possible cost to ratepayers. Pointing to the cost savings and other benefits experienced by other wastewater treatment plants can be an effective strategy for doing this.
Lack of staff time to collect and analyze energy performance data is another commonly cited barrier. Experience with Better Plants partners has shown that the establishment of an energy data management system does require upfront effort, but that effort decreases over time, after the system has been built and data are collected, analyzed, and maintained in a consistent, ongoing manner. Publicly available data-tracking tools, which are reviewed in this document, can make performance data tracking easier for plant operators. While several of these tools are available, the wastewater treatment sector has so far not coalesced around a single tool that meets its specific data management needs. The lack of a commonly accepted tool is itself a barrier to energy data management in this sector.
6
Learn more at betterbuildingsinitiative.energy.gov
A related barrier is the lack of staff expertise to accurately and appropriately collect and analyze energy performance data. Energy data management can be technically complex, but plants can choose from a range of different approaches that vary in complexity and require different levels of effort. This guide describes some of these options to help plant operators determine which approach makes the most sense for them, considering their level of experience and the effort they are prepared to expend. Plants new to the process may consider beginning with a relatively simple approach and progress to more complex systems over time, as technical proficiency among staff increases. Wherever relevant, this document indicates which options are more or less suitable for smaller plants or those just getting started on energy data management.
Issues to Consider Before StartingThere are three important issues wastewater treatment plants should consider before developing an energy data management system. These include understanding: (1) how energy is used within the plant, (2) the extent that energy metering and submetering are in place or likely to be installed in the near future, and (3) whether renewable energy resources will be used on-site. Some investigation into these three issues will help plants determine the type of metrics to track, the type of data to collect, where to locate the data, and the type of conversion factors they need to arrive at common, comparable units of measurement. This section briefly explores these issues.
Energy Consumption in Wastewater Treatment Plants
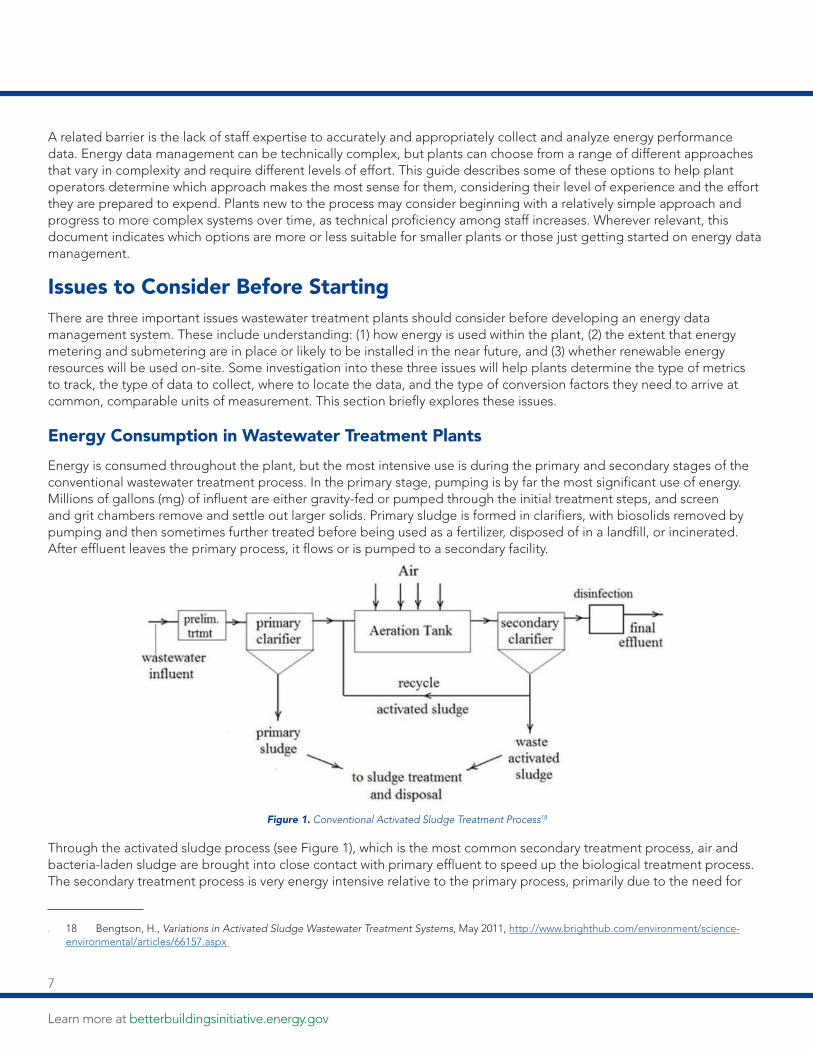
Energy is consumed throughout the plant, but the most intensive use is during the primary and secondary stages of the conventional wastewater treatment process. In the primary stage, pumping is by far the most significant use of energy. Millions of gallons (mg) of influent are either gravity-fed or pumped through the initial treatment steps, and screen and grit chambers remove and settle out larger solids. Primary sludge is formed in clarifiers, with biosolids removed by pumping and then sometimes further treated before being used as a fertilizer, disposed of in a landfill, or incinerated. After effluent leaves the primary process, it flows or is pumped to a secondary facility.
Figure 1. Conventional Activated Sludge Treatment Process18
Through the activated sludge process (see Figure 1), which is the most common secondary treatment process, air and bacteria-laden sludge are brought into close contact with primary effluent to speed up the biological treatment process. The secondary treatment process is very energy intensive relative to the primary process, primarily due to the need for
. 18 Bengtson, H., Variations in Activated Sludge Wastewater Treatment Systems, May 2011, http://www.brighthub.com/environment/science-environmental/articles/66157.aspx
7
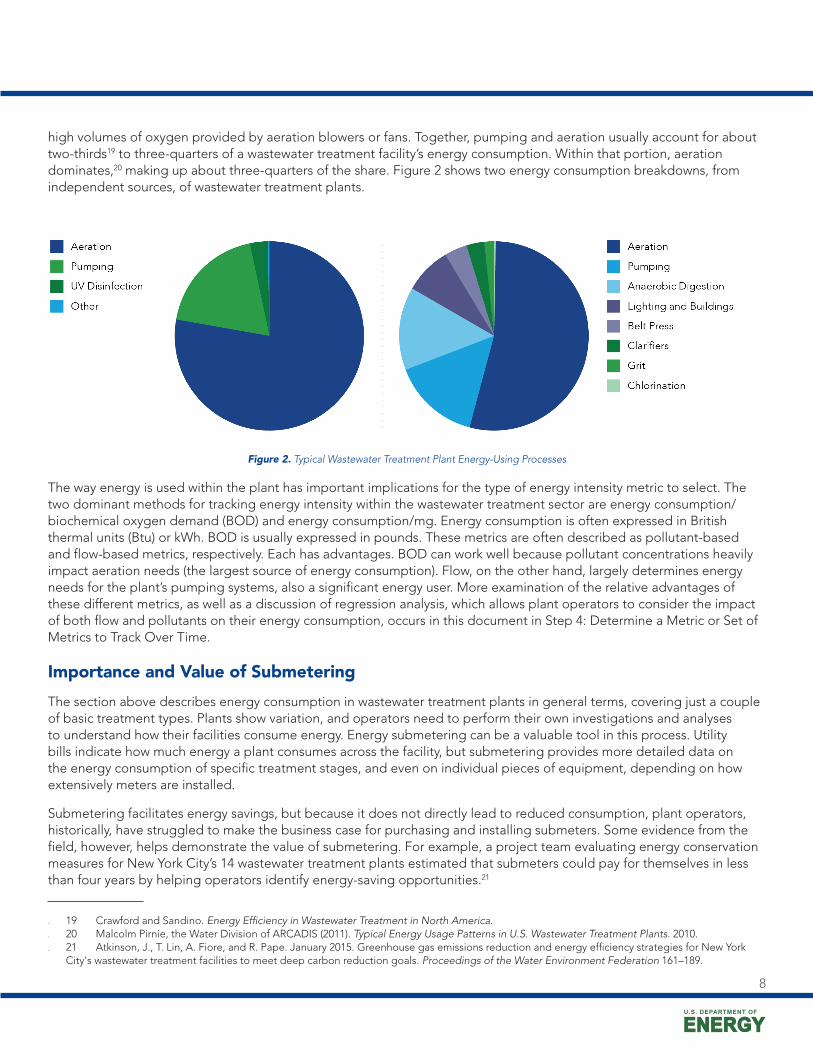
high volumes of oxygen provided by aeration blowers or fans. Together, pumping and aeration usually account for about two-thirds19 to three-quarters of a wastewater treatment facility’s energy consumption. Within that portion, aeration dominates,20 making up about three-quarters of the share. Figure 2 shows two energy consumption breakdowns, from independent sources, of wastewater treatment plants.
Figure 2. Typical Wastewater Treatment Plant Energy-Using Processes
The way energy is used within the plant has important implications for the type of energy intensity metric to select. The two dominant methods for tracking energy intensity within the wastewater treatment sector are energy consumption/biochemical oxygen demand (BOD) and energy consumption/mg. Energy consumption is often expressed in British thermal units (Btu) or kWh. BOD is usually expressed in pounds. These metrics are often described as pollutant-based and flow-based metrics, respectively. Each has advantages. BOD can work well because pollutant concentrations heavily impact aeration needs (the largest source of energy consumption). Flow, on the other hand, largely determines energy needs for the plant’s pumping systems, also a significant energy user. More examination of the relative advantages of these different metrics, as well as a discussion of regression analysis, which allows plant operators to consider the impact of both flow and pollutants on their energy consumption, occurs in this document in Step 4: Determine a Metric or Set of Metrics to Track Over Time.
Importance and Value of Submetering
The section above describes energy consumption in wastewater treatment plants in general terms, covering just a couple of basic treatment types. Plants show variation, and operators need to perform their own investigations and analyses to understand how their facilities consume energy. Energy submetering can be a valuable tool in this process. Utility bills indicate how much energy a plant consumes across the facility, but submetering provides more detailed data on the energy consumption of specific treatment stages, and even on individual pieces of equipment, depending on how extensively meters are installed.
Submetering facilitates energy savings, but because it does not directly lead to reduced consumption, plant operators, historically, have struggled to make the business case for purchasing and installing submeters. Some evidence from the field, however, helps demonstrate the value of submetering. For example, a project team evaluating energy conservation measures for New York City’s 14 wastewater treatment plants estimated that submeters could pay for themselves in less than four years by helping operators identify energy-saving opportunities.21
. 19 Crawford and Sandino. Energy Efficiency in Wastewater Treatment in North America.
. 20 Malcolm Pirnie, the Water Division of ARCADIS (2011). Typical Energy Usage Patterns in U.S. Wastewater Treatment Plants. 2010.
. 21 Atkinson, J., T. Lin, A. Fiore, and R. Pape. January 2015. Greenhouse gas emissions reduction and energy efficiency strategies for New York City's wastewater treatment facilities to meet deep carbon reduction goals. Proceedings of the Water Environment Federation 161–189.
8
Learn more at betterbuildingsinitiative.energy.gov
Small facilities have also benefited from submeters. Stoughton Wastewater Utilities, which treats about 1 mgd, has used submeters for about a decade. By more precisely measuring energy consumption at the process and equipment level, Stoughtnon has been able to implement a number of energy saving projects, including: replacing three 75 horsepower blowers with one VFD-equipped 50 horsepower blower that saved 30% in the aeration process; upgrading its digester mixing system so that only one mixer is running at a time, leading to savings of close to 40% in this process; and installing controls on its sludge storage mixers to limit their use during peak hours and completely shut them off at night when they are not needed.22
Addressing Biogas
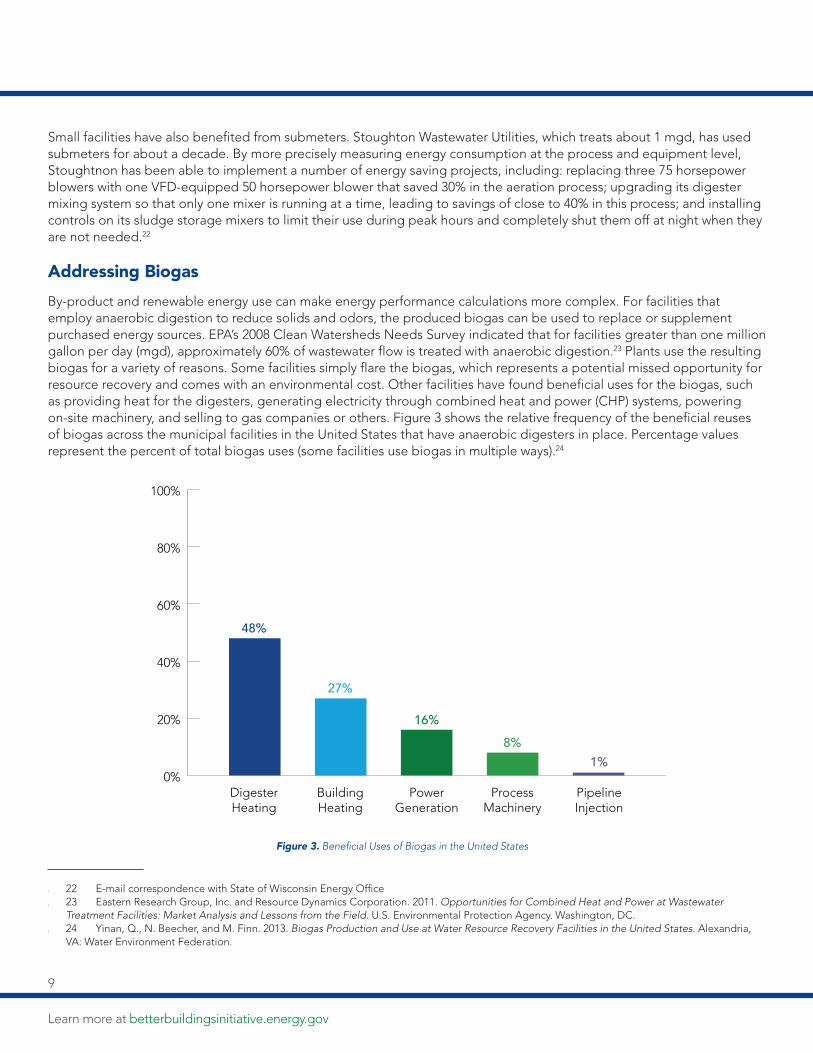
By-product and renewable energy use can make energy performance calculations more complex. For facilities that employ anaerobic digestion to reduce solids and odors, the produced biogas can be used to replace or supplement purchased energy sources. EPA’s 2008 Clean Watersheds Needs Survey indicated that for facilities greater than one million gallon per day (mgd), approximately 60% of wastewater flow is treated with anaerobic digestion.23 Plants use the resulting biogas for a variety of reasons. Some facilities simply flare the biogas, which represents a potential missed opportunity for resource recovery and comes with an environmental cost. Other facilities have found beneficial uses for the biogas, such as providing heat for the digesters, generating electricity through combined heat and power (CHP) systems, powering on-site machinery, and selling to gas companies or others. Figure 3 shows the relative frequency of the beneficial reuses of biogas across the municipal facilities in the United States that have anaerobic digesters in place. Percentage values represent the percent of total biogas uses (some facilities use biogas in multiple ways).24
0%
20%
40%
60%
80%
100%
DigesterHeating
BuildingHeating
PowerGeneration
ProcessMachinery
PipelineInjection
48%
27%
16%8%
1%
Figure 3. Beneficial Uses of Biogas in the United States
. 22 E-mail correspondence with State of Wisconsin Energy Office
. 23 Eastern Research Group, Inc. and Resource Dynamics Corporation. 2011. Opportunities for Combined Heat and Power at Wastewater Treatment Facilities: Market Analysis and Lessons from the Field. U.S. Environmental Protection Agency. Washington, DC.
. 24 Yinan, Q., N. Beecher, and M. Finn. 2013. Biogas Production and Use at Water Resource Recovery Facilities in the United States. Alexandria, VA: Water Environment Federation.
9

Tracking the electricity consumed from on-site biogas combustion presents a significant accounting challenge. There are different accounting methodologies currently in use. Each presents trade-offs and can have widely differing impacts on how a plant’s overall energy performance is represented. Methodologically, the issue centers around determining which energy sources to track and selecting the appropriate conversion factors that allow energy units to be summed and compared. This issue is discussed in greater detail in this document in Step 3: Assemble Data and Apply Conversions.
Energy Data Management: Step-by-Step ApproachWastewater treatment facilities can establish an energy data management system by following these five steps:
1. Define the boundary.
2. Establish the baseline.
3. Assemble data and apply conversions.
4. Determine a metric or set of metrics to track over time.
5. Set up a tracking system.
Although the steps are presented sequentially, establishing an energy performance tracking system is an iterative process. Experience gained from working through some of the later steps helps inform decisions made for the earlier steps. For example, to choose the baseline year, data on energy consumption and treatment activity for the years being considered are needed.
Step 1: Define the Boundary
In this step, plants establish the set of energy-consuming activities and operations they will measure over time. Usually, the boundary covers operations and activities the organization has direct financial or operational control over. This generally includes everything within a wastewater treatment plant’s fence line and sometimes includes associated pumping or lift stations. Figure 4 shows a sample boundary—the equipment and processes within the dashed yellow line are included in this facility’s boundary. Some organizations include office space and laboratories, particularly if they are not separately metered. Most organizations exclude energy used for vehicles, as this tends to add complexity. Transportation energy use typically calls for different energy management strategies than those targeted directly at the facility. Energy consumption from suppliers and customers should be excluded from the organization’s boundary.
Figure 4. Sample Boundary for Wastewater Treatment Plant
Considerations for Smaller Facilities
The five basic steps to establishing an energy data management system are applicable to facilities of all sizes. Some of the options described within these steps, however, are more time- and resource- intensive than others. Smaller facilities, and others just getting started, may want to consider sticking with the more basic options to simplify the process and reduce the time needed to track and manage energy data. The more time-intensive options, which are also called out in the text, include calendarization, utilizing regression analysis, and accounting for biogas-derived electric consumption.
10

Learn more at betterbuildingsinitiative.energy.gov
Organizations with multiple treatment plants usually establish separate boundaries at each plant and track energy performance at each individual facility. In theory, all facilities can be included under one boundary. While this may add simplicity from an accounting perspective, it masks trends unique to one plant and makes it difficult to identify the impacts of energy efficiency efforts. Additionally, it eliminates the energy manager’s ability to identify leading and lagging plants. For this reason, DOE recommends that wastewater treatment agencies separately track energy performance at each facility. Agencies interested in pursuing an agency-wide energy efficiency goal can track each plant separately and roll the plant-level metrics into a single agency-wide percentage improvement number.25
Step 2: Establish the Baseline
The baseline year acts as the point of comparison against which all future efforts and progress toward energy performance goals are measured. To set a baseline year, a facility should choose a recent calendar or fiscal year for which it has a full year of relevant data available, including energy, treatment volume, and pollutant load. Often, this will be the last full year before the initiation of a new energy program. Because the baseline year serves as the point of comparison for future efforts, organizations should select a 12-month period that reflects relatively stable operating conditions. For example, if a major expansion that will double a plant’s design treatment capacity is underway, the plant should use the 12-month period following the expansion as its baseline year. Or, if flow volumes were unusually low in the most recent year, perhaps due to drought conditions, the plant should select a previous year, when flow tracked closer to historical norms. Changing treatment requirements may also impact energy consumption over time. A 2015 report, for example, found that new nutrient removal standards triggered significant upgrades at New York wastewater treatment plants and resulted in increased energy consumption that effectively erased the gains made through previous efficiency measures.26 Sometimes major operational changes and other disruptions occur unexpectedly. In those cases, baseline adjustments can be made retroactively, but these can be complicated. As such, plant operators should select baseline periods that preclude the need for future baseline adjustments.
Typically, plants set calendar-year baseline periods, but fiscal years may also make sense if that period allows for easier integration into existing facility or agency accounting systems. Plants should also consider whether their efforts are tied to other agency or city-wide goals. For example, if the wastewater treatment plant is included as part of a city’s broader energy efficiency or sustainability goals, it should select a baseline year that aligns with the city's baseline year.
Step 3: Assemble Data and Apply Conversions
Next, basic energy and activity-level data should be collected. Smaller facilities and those not utilizing digester gas or regression analysis can usually get all the data they need from utility bills, combined with their own data that tracks flow volumes or BOD load. Plants utilizing biogas for heat or electricity, will need to collect data on digester gas volumes and some measure of gas heating value. Data on gas volume are commonly available at most treatment plants, but periodic testing is usually needed to measure gas heating values. Monthly measurements of gas heating values are ideal, but quarterly or annual data usually suffice. Plants using regression analysis will need to collect additional data on variables that may impact energy consumption, such as outdoor temperature, rainfall, and influent temperature. Weather data can be obtained from either government or third-party websites, at no cost.27
As a best practice, data should be collected on a monthly basis. This allows the facility to observe changes within a year, identify anomalous months, and develop regression models, if desired. If a facility is just getting started, however,
. 25 For more information on how to perform this roll-up, please see U.S. Department of Energy, Better Plants. 2015. Energy Intensity Baselining and Tracking Guidance. Washington, DC.
. 26 Andrews, N., J. Willis, D. Nasciemento. 2015. Current Energy Position of New York State Wastewater Treatment Facilities. Alexandria, VA. Water Environment Research Foundation.
. 27 www.weatherdatadepot.com provides data on heating and cooling degree days for many locations, and www.usclimatedata.com offers data on precipitation and average temperatures.
11

annual data is sufficient to select a baseline year and determine year-end energy performance, if only on a preliminary basis. Submetered data, if available, should be incorporated to allow for better understanding of changes in energy consumption and across processes.
When possible, plants should ensure data are collected on a consistent time frame, sometimes referred to as "calendarization" of data. Utility bills do not always correspond perfectly with calendar months. For example, bills may go from the 27th to the 26th, or from the 4th to the 3rd. These dates may not align with how the facility collects other data, such as flow volumes and BOD levels. As a result, peaks in energy use will not correspond to peaks in facility activity, which can lead to inaccurate energy intensity measurements. Facilities can request a change in billing period from the local utility, though these are not often granted. More commonly, facilities will need to realign their internal data on flow volume and BOD load to match the utility’s billing periods. The calendarization process does take time. Generally speaking, plants should only do it if their monthly data sets are off by five days or more. Additionally, smaller facilities and others that lack staff time can forgo calendarization, especially if they are only interested in tracking annual changes in energy performance.
Applying Conversions
Energy consumption needs to be converted to a common unit so different energy sources can be added together. Often, U.S. facilities use Btu as the common unit — they will convert electricity and natural gas from kWh and therms, respectively, to Btu, using commonly accepted conversion factors, a list of which can be found in Appendix A. Other common units include gigajoules and kWh.
DOE and EPA both recommend expressing energy consumption in terms of primary energy, which accounts for losses resulting from the generation, transmission, and distribution of the energy, particularly electricity. Organizations participating in DOE and EPA voluntary energy efficiency programs are generally required to report their energy consumption in primary energy units. In practical terms, this means that site electricity (which comes from the facility meter or electricity bills) is converted to primary energy with a common conversion factor, typically ranging from 3.0 to 3.3. On-site energy generation is tracked separately. For nonrenewable fossil fuels such as natural gas, the energy content of the fuel source is calculated and tracked. In this case, no site-to-source conversion factor is needed because there are no transmission and distribution losses, and generation losses are accounted for by capturing the full, pre-combustion energy content of the fuel source. On-site renewable energy, such as solar power, should be counted using a 1.0 multiplier, because this form of energy also does not experience any transmission, generation, or distribution losses. This effectively means that using on-site renewables helps facilities meet their energy efficiency goals while also accounting for all energy consumed on-site. Some plants do not account for renewable energy consumption at all in energy performance metrics on the basis that the fuel source is free and does not result in any greenhouse gas emissions or other air pollution. Failing to account for these energy sources, however, means plant operators lose the ability to fully understand how the plant consumes energy, and they may miss improvement opportunities. In many cases, excess solar power can be sold to the grid or other users, meaning there is an opportunity cost to wasting this energy source.
Accounting for On-Site Electricity Generation From Biogas
The inclusion of biogas in plant energy metrics raises some tricky issues related to conversion factors. The following section includes technical detail that is only relevant to those plants that capture and reuse biogas for energy purposes. Others can move on to the next section on determining metrics. The three prevailing biogas energy accounting options are: (A) treat the biogas as free energy and omit it from energy performance calculations, (B) measure and track the energy content of the biogas as it enters the CHP unit, and (C) measure and track the electricity that is produced and recovered waste heat (if practical). DOE recommends plants use option (C) as it strikes the right balance between providing an efficiency benefit for the use of a renewable energy source while also accounting for all energy sources that enter the facility.
12

Learn more at betterbuildingsinitiative.energy.gov
While DOE recommends option (C), a full description of all the options (illustrated in Figure 5) is included below to help plant operators understand the advantages and tradeoffs of each. As shown in figure 6, the selection of one accounting approach over another can result in wide swings in how energy performance is represented. The discussion of these options and their implications assumes plant operators account for grid-purchased electricity in primary energy units, as described above. Generally, biogas-derived electricity displaces grid-purchased electricity. The extent that biogas-derived electricity leads to improved energy performance depends on how the waste heat is being used and whether the accounting approach treats the conversion efficiency of biogas more or less favorably than grid-purchased electricity.
Figure 5. Options for Measuring Recovered Energy in a Wastewater Treatment Plant
A. Treat biogas as free energy and omit it from energy performance data. With this approach, biogas used on-site, including for electricity generation, is excluded from the plant’s energy performance metrics. The energy produced on-site that displaces grid-purchased electricity or purchased fuel effectively counts as a reduction in energy consumption. This approach has the largest, positive effect on a facility’s energy performance and most directly incentivizes resource recovery. It appears to be the only accounting approach compatible with the net zero energy goals set by some wastewater treatment plants.
The downside is that excluding a significant energy source from measurement systems is inconsistent with strong energy management principles, which call for the measurement and management of all fuel streams entering a facility. There are still environmental and financial impacts associated with this energy use. Failing to measure these energy sources, therefore, hinders plant operators’ ability to manage their impacts. For example, a facility may be able to use the biogas-derived electricity more efficiently, leaving more energy generation available to meet future plant expansion needs or to sell into the electric grid. Without tracking this energy source, the plant has no way of knowing if this capacity exists.
B. Measure the energy content of biogas as it enters the CHP unit. This option recognizes biogas as a fuel and accounts for it the same way facilities typically count natural gas or other fuels combusted on-site. That is, they incorporate the Btu content of the fuel in their energy performance accounting. Because the Btu content of the fuel is inclusive of the resulting electricity and heat generated from the CHP unit, this approach applies strong energy management principles that emphasize measuring and managing all energy sources consumed within a facility. One concern with this option, however, is that it can be technically difficult to measure, as most sites measure flow rate but do not consistently measure heat content of the resulting biogas.
More significantly, this approach can create incentives against using biogas for electricity generation and pit the goals of resource recovery against the goals of energy efficiency. Data from several Better Plants partners indicate that energy performance can actually be compromised when electricity generation from biogas production is counted this way. This can occur if the CHP system generates electricity less efficiently than the grid, and the
13

wastewater treatment plant is unable to displace purchased fuels with the resulting waste heat. This is especially common in plants that were previously using biogas to heat their digesters and facilities. When such a plant upgrades to a CHP unit, it will generate electricity in addition to heat, but the heat will be used the same way it was used before the CHP unit was installed. In this case, the heat from the CHP unit is not displacing anything and the impact on the facility’s energy performance metrics will be driven entirely by the electric conversion efficiency of the CHP unit relative to the grid. If this same plant had previously been flaring all its biogas and using natural gas to heat its digesters and facility, the CHP upgrade would likely result in an efficiency benefit. In this case, the waste heat from the CHP unit would be displacing natural gas purchases.
C. Measure the electricity produced and recovered waste heat (if practical). This approach counts the electric output when biogas is used to generate electricity and resulting waste heat when possible and practical. Mathematically, this is equivalent to applying a 1.0 site-to-source multiplier to the biogas-derived electricity. This treatment is similar to how DOE and EPA programs treat on-site renewable energy, such as solar photovoltaic power. This approach provides incentives for resource recovery, as it builds in a significant efficiency gain relative to grid-purchased electricity. The efficiency gain, though, is not as significant as not counting the energy source at all (option A). In addition, biogas electricity projects typically are metered, so measurement is not an issue. Plants should also measure the waste heat used in the plant, particularly if the heat is displacing fossil fuel purchases. Specific measurement techniques will vary based on the heat recovery system. In water based systems, the facility would need to measure temperature change and flow of the water; then, calculate the percentage of the heat flowing to the digester and facility. The facility does not need to measure the CHP waste heat if it is displacing heat previously generated through biogas. In this case, reuse of the heat will have an insignificant impact on the facility's energy performance metrics.
The selection of one of these options to incorporate into a wastewater treatment plant’s energy performance metrics can have a large impact on the plant's performance. Looking at a sample of five Better Plants Partners, Figure 6 shows a marked improvement, up to 70%, when going from counting biogas as a fuel (option B), to not including biogas at all (option A). Option C, counting biogas electricity generation as renewable, consistently falls in-between. Plants 1, 3 and 5 that show energy performance degradation following CHP installation were previously using the biogas for on-site heating purposes, so they do not experience an efficiency gain from the waste heat.
Treating biogas-derived electricity similarly to on-site solar power allows facilities to get credit for its use while continuing to account for this form of consumption, consistent with strong energy management principles. This is why DOE recommends plants use option C and include only the electric output from the CHP unit in their energy performance of calculations. Because biogas is included in most state renewable portfolio standards, treating this fuel as akin to on-site solar is consistent with these state-based regulatory frameworks. Wastewater treatment agencies participating in Better Plants and SWIFt should use option C to quantify the energy consumption related to biogas use and incorporate that consumption into their energy performance metrics. SEP’s Measurement and Verification Protocol gives participants the choice of using either option C or option B.
-10%
0%
10%
20%
30%
40%
50%
60%
70%
80%
Plant 5Plant 4Plant 3Plant 2Plant 1
Option A: Exclude Biogas-Derived Energy
Option B: Treat Biogas as Fuel
Option C: Treat Electricity as Renewable
Ener
gy-
Inte
nsity
Imp
rove
men
t
Figure 6. Impact of Biogas Energy Accounting Treatment on Energy Intensity Improvement at Five Wastewater Treatment Plants
14

Learn more at betterbuildingsinitiative.energy.gov
In addition to their energy efficiency targets, plants may consider metrics that more closely align with their resource recovery goals. Such a metric could include energy recovered as a percent of the total chemical energy present in the wastewater influent. This metric takes a broad view of the energy potential entering the facility and measures the plant’s ability to convert that energy into a useful form. It can be viewed as a complementary metric to the energy neutral goals some plants have set. Not all plants will be able to measure the energy content of their influent, however. In these cases, default factors can be used. One rule of thumb, published by EPA, is that each mgd of wastewater flow can produce enough biogas to generate 26 kilowatts of electricity through a CHP system.28 Plants could also calculate electricity generated as a percent of the total energy content of all biogas produced on site. Goals set using this metric would incentivize management practices, such as increasing the volume of biogas entering the CHP unit (by reducing flaring, for example) and improving the conversion efficiency of the CHP unit.
Step 4: Determine a Metric or Set of Metrics to Track Over Time
Absolute energy consumption, i.e. total energy consumed over a given time period, is probably the simplest energy metric to track for a wastewater treatment plant. This is an imperfect way, however, of measuring energy performance, which seeks to quantify the impact of deliberate energy efficiency actions and practices. Absolute energy consumption can vary significantly due to factors outside a plant’s direct control such as flow volume or pollutant loading. For that reason, an energy-intensity based metric, which expresses energy consumption per unit of activity, is an improvement over absolute energy consumption, because it adjusts for periods of high or low activity. This approach has been used for years in the manufacturing sector and for commercial buildings.
Energy intensity metrics typically are represented as a ratio, with energy consumption as the numerator and some measured level of activity or size as the denominator. Selecting a denominator most closely correlated with energy consumption is a best practice across all sectors. Manufacturers often use unit of output as the denominator—as more product is made, energy consumption typically increases. Commercial building operators usually settle on square feet of building space as the denominator, because larger buildings require more energy for heating, cooling, lighting, and other needs. These metrics do not quite work for the wastewater treatment sector, however, because of the way these plants use energy.
Aeration, which is tied to BOD removal, can make up 50% or more of a plant’s total energy consumption. For this reason, energy intensity metrics that use pounds of BOD removed as the denominator are favored by many wastewater treatment plants, especially those operating in Europe. In the United States, more plants use flow, measured in mg, as the denominator.
Either metric is acceptable for tracking energy performance over time, but wastewater treatment plant operators should be familiar with the advantages and disadvantages of both. The advantage of using BOD as the denominator is that it appears to be more directly tied to the primary driver of energy consumption in the plant. But plant operators should determine whether this correlation holds at their individual sites. Plants cannot always adjust operations based on pollutant loads. Conservative levels of aeration, outdated blower controls, infrequent maintenance of aerators, and lack of dissolved oxygen sensors and controls are practical issues that can disrupt the causal relationship between BOD loads and energy consumption. A flow-based metric has the advantage of being easier to understand. The output for wastewater treatment plants is the amount of water treated. BOD load will sometimes go up with increased influent volume, which means that in the right circumstances the flow metric can capture the two primary drivers of energy consumption within the plant: aeration and pumping. This will not always be the case, however. For example, if increased flow stems from infiltration and inflow following periods of heavy rain, flow will increase and BOD will stay the same.
. 28 Eastern Research Group, Inc. and Resource Dynamics Corporation. 2011.
15

DOE conducted a high-level analysis of nine wastewater treatment plants participating in its Better Plants program and found that for these plants, flow exerted a stronger influence than BOD on energy consumption. In these nine plants, flow and BOD, along with energy consumption, were tracked over a 48-month period. Figure 7 shows the frequency with which energy consumption changed with BOD load and flow. The analysis showed that change in flow and change in energy consumption were correlated in about 60% of the months surveyed. Another takeaway is that for four facilities (those treating 275, 41, 13 and 10 mgd), flow and energy consumption were more strongly correlated. In one facility (19 mgd), BOD was stronger; in the remaining four, flow and BOD were about equally correlated with energy consumption. Other studies have found that neither flow nor pollutant load tracks particularly well with energy consumption. A 2015 WERF study, for example, pointed out the shortcomings with both metrics, including the negative impact water conservation measures have on energy efficiency when measured on a flow basis. Essentially, as water consumption goes down, BOD load will often stay level. The energy consumption related to the treatment process thus stays flat, but flow-based energy intensity will increase since the denominator will have shrunk.29
Treatment plants do not need to limit themselves to one metric. Separate metrics for the primary and secondary treatment processes can be developed, provided submetering that allows the plant to isolate energy consumption at each treatment stage is in place. Developing a flow-based metric for the primary process, where pumping energy use dominates, and a BOD-based metric for the secondary process, where aeration energy use dominates, can provide a clearer picture of energy performance across the facility. Additionally, some plants meter their administrative buildings separately, and track energy intensity on a Btu/sq ft basis there. These metrics can be combined to track facility-wide energy performance, by first calculating the percentage improvement at each treatment stage, and then calculating a weighted average improvement across both stages with baseline year energy consumption serving as the weights. Plants can also track flow- and load-based metrics at the same facility for additional context on their energy performance.
Figure 7. Comparison of Flow and BOD as Independent Variables That Tie to Changes in Energy Use
Using Regression Analysis
Regression analysis is a more data-intensive option that, when done properly, can provide better insight into a plant's energy consumption than either a BOD- or flow-based metric. This statistical technique estimates the dependence of a variable (in this case, energy consumption) on one or more independent variables (such as ambient temperature)
. 29 Andrews, N., J. Willis, D. Nasciemento. 2015. Current Energy Position of New York State Wastewater Treatment Facilities. Alexandria, VA. Water Environment Research Foundation.
0% 10% 20% 30% 40% 50% 60% 70% 80% 90% 100%
BOD
Flow
8
10
12
13
15
19
22
41
275
Aver
age
Flow
(mgd
) per
Plan
t
Percent of Months When Energy Use Changes With Activity
16

Learn more at betterbuildingsinitiative.energy.gov
while controlling for the influence of other variables. Regression analysis is commonly used to estimate energy savings through the measurement and verification of energy projects and programs. It is used in EPA's Portfolio Manager to develop normalized EUI values and is increasingly being incorporated into state and utility based SEM programs. Regression analysis has proven to be reliable when the input data covers the full annual variation in operating conditions. For wastewater treatment facilities, proper use of regression analysis can provide a reliable estimate of energy savings resulting from energy efficiency improvements by accounting for the effects of variables such as flow, pollutant load, and weather. By modeling a wastewater treatment plant’s energy consumption, regression analysis allows for better comparison with prior years and can help predict future energy consumption patterns. While regression analysis provides many benefits, it also requires more data, staff time, and expertise to conduct properly, relative to other approaches. Smaller plants and others new to energy data management often find it more straightforward to begin with a simpler Btu/mg or Btu/BOD metric.
Such efforts should, at a minimum, examine flow and BOD removal as independent variables. Heating degree days, cooling degree days, rainfall, and other variables that sometimes impact energy use should also be considered. In effect, with regression analysis, plants do not need to choose between BOD and flow as their energy intensity metric, they can include both in their model to estimate the unique impact each variable has on their energy consumption. In this way, regression analysis can provide further detail and clarity on how energy is consumed within a site. It not only indicates which variables have an impact on energy consumption, it also estimates their relative impact by establishing specific coefficients for those variables. It can also help tease out how much of the energy consumption varies by activity level, and how much is fixed.
Regression analysis allows for consistent comparison over time. Most commonly, an energy manager or plant engineer develops an equation to hold a set of baseline conditions constant over time, allowing the user to measure the change in energy consumption independent of any changes to the other variables, such as BOD and flow. As an example, assume a treatment plant calculated a 0.6% improvement in energy intensity on a flow basis after one year. The plant operators decided to investigate this result, as they were expecting stronger improvement resulting from some significant, recently implemented energy projects. When reviewing the data, they noted a reduction in flow in 2015, relative to the baseline year. Although lower flow volume can lead to reduced energy consumption on an absolute basis (because there is less water to treat and pump), plant operators understood it could also result in higher pollutant concentrations in the influent, leading to higher per gallon energy requirements in the treatment process. Using regression analysis, plant operators were able to obtain models that evaluated the statistical fit of both purchased electricity and total fuel use against independent variables, including influent temperature and flow. Influent temperature was included because plant operators knew from experience that oxygen solubility decreases with temperature and causes blowers to use more electricity. The model adjusted the energy intensity improvement up to 4.3%, primarily because it adjusted for the decrease in flow, but also due to a slight increase in influent temperature for the year.
Step 5: Set Up a Tracking System
DOE recommends using a tracking tool to develop annual reports that profile energy performance and allow comparison with peer plants or the same plant during a baseline period. The next section provides an overview of four publicly available tools from EPA and DOE: EPA's ENERGY STAR Portfolio Manager, EPA's Energy Assessment Tool (EAT), and DOE's Energy Performance Indicator (EnPI) and EnPI Lite.
Through SWIFt, DOE conducted a series of webinars to help partners understand these energy data management tools. DOE asked all partners to select a tool to use on an ongoing basis to compile and track energy performance metrics. Of the 66 facility partners that made their selections known, just under half used one of the four tools reviewed in this document (see Figure 8 for a full breakdown). The largest share of facilities, just over a third, elected to use their
17

own internally developed spreadsheet tool. This option was especially popular for the smaller plants. Of the 17 plants with a treatment capacity less than or equal to 1 mgd, 14 opted to use their own spreadsheet. The remaining three used either EAT, Portfolio Manager, or EnPI. A little under 10% of facility partners are using Hach-WIMS, a commercially available system that helps water agencies track multiple data points, including energy. Another 11% used some other commercially available tracking tool.
Spreadsheet 36%
DOE's Energy Performance Indicator (EnPI)
18%
EPA's Portfolio Manager 15%
EPA's Energy Assessment Tool (EAT)
11%
Other 11%
Hach-WIMS 9%
Figure 8: SWIFt Partner Data Tool Selections – March 2017
18
Learn more at betterbuildingsinitiative.energy.gov
Overview of Publicly Available Energy Data Management ToolsDOE and EPA have developed several publicly available software tools (described in more detail below) that help wastewater treatment plants measure and track energy performance. These tools have pros and cons that previously have not been fully explored in industry guidance documents. Additionally, a comparison matrix of these tools is included in Appendix B, with brief frequently asked questions (FAQs) that help users quickly get started in Appendix C. These are by no means the only tools available on the market, but they are free of charge and have been developed specifically to support energy management. Internal spreadsheets can also be used successfully, as several SWIFt partners have demonstrated, but there are some advantages to using established tools. These tools contain standard methodologies that lend credibility to the metrics produced. Plus, the calculations are automated within the tools, which reduces the risk of math errors.
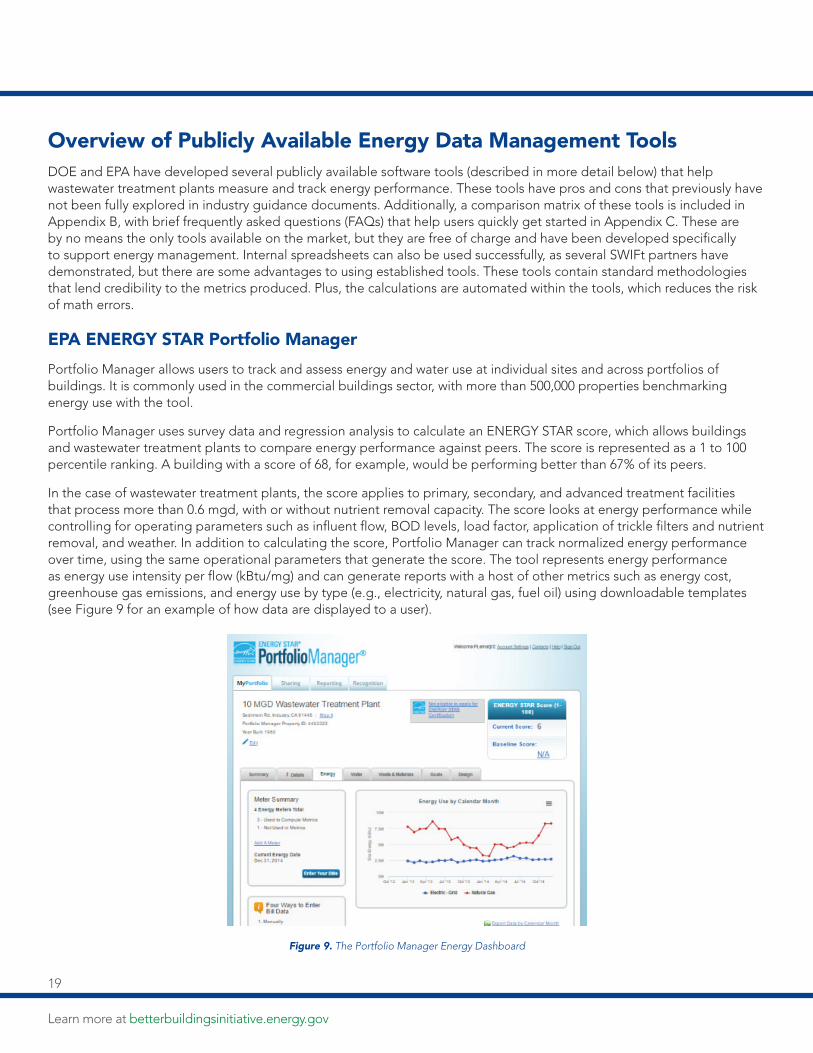
EPA ENERGY STAR Portfolio Manager
Portfolio Manager allows users to track and assess energy and water use at individual sites and across portfolios of buildings. It is commonly used in the commercial buildings sector, with more than 500,000 properties benchmarking energy use with the tool.
Portfolio Manager uses survey data and regression analysis to calculate an ENERGY STAR score, which allows buildings and wastewater treatment plants to compare energy performance against peers. The score is represented as a 1 to 100 percentile ranking. A building with a score of 68, for example, would be performing better than 67% of its peers.
In the case of wastewater treatment plants, the score applies to primary, secondary, and advanced treatment facilities that process more than 0.6 mgd, with or without nutrient removal capacity. The score looks at energy performance while controlling for operating parameters such as influent flow, BOD levels, load factor, application of trickle filters and nutrient removal, and weather. In addition to calculating the score, Portfolio Manager can track normalized energy performance over time, using the same operational parameters that generate the score. The tool represents energy performance as energy use intensity per flow (kBtu/mg) and can generate reports with a host of other metrics such as energy cost, greenhouse gas emissions, and energy use by type (e.g., electricity, natural gas, fuel oil) using downloadable templates (see Figure 9 for an example of how data are displayed to a user).
Figure 9. The Portfolio Manager Energy Dashboard
19

Considerations
Portfolio Manager is a commonly used web-enabled tool that allows users to incorporate wastewater treatment plants into a portfolio of buildings already in Portfolio Manager, which could be especially useful for agencies that are part of a municipal-wide goal or program, such as the Better Buildings Challenge. The benchmarking component has proven to be very powerful for applicable building types, although this feature is less relevant to the wastewater treatment sector because of the age of the underlying survey data. Because it uses regression analysis, the tool is a good fit for plants seeking greater clarity on the impact of energy management activities independent of variations in weather, flow, and other operating parameters. The data needs are greater than some other tools, however. Because Portfolio Manager was originally developed for commercial buildings, some data elements, such as square footage, are still required to get started, even though they are not fully applicable to wastewater treatment plants. Portfolio Manager also does not contain a separate field for users to account for biogas, although users can input biogas-derived electricity as on-site solar, which allows accounting for this energy source in a manner consistent with the approach recommended in this document.
EPA Energy Assessment Tool
The Energy Assessment Tool (EAT) is a spreadsheet-based tool developed by EPA’s Region 4 office. The tool enables wastewater treatment facilities to easily and quickly develop metrics for energy efficiency and energy savings. Facilities can develop absolute, flow-normalized, and BOD load-normalized values with this tool.
EAT is very simple and easy to understand. If the facility has its data available, the tool can create a summary table and charts in minutes. Furthermore, data can easily be copied into another spreadsheet and formatted for use in regression model tools, such as the EnPI tool described later. Users input up to five years of energy use, costs, and flow or BOD-load data, and the tool calculates energy intensity (kWh/mg or kWh/BOD) for the baseline and reporting periods, percent change in energy intensity, and annual energy and cost savings, among other metrics (see Figure 10 for an example of the tool’s outputs).
Figure 10. EAT Summary Table
20
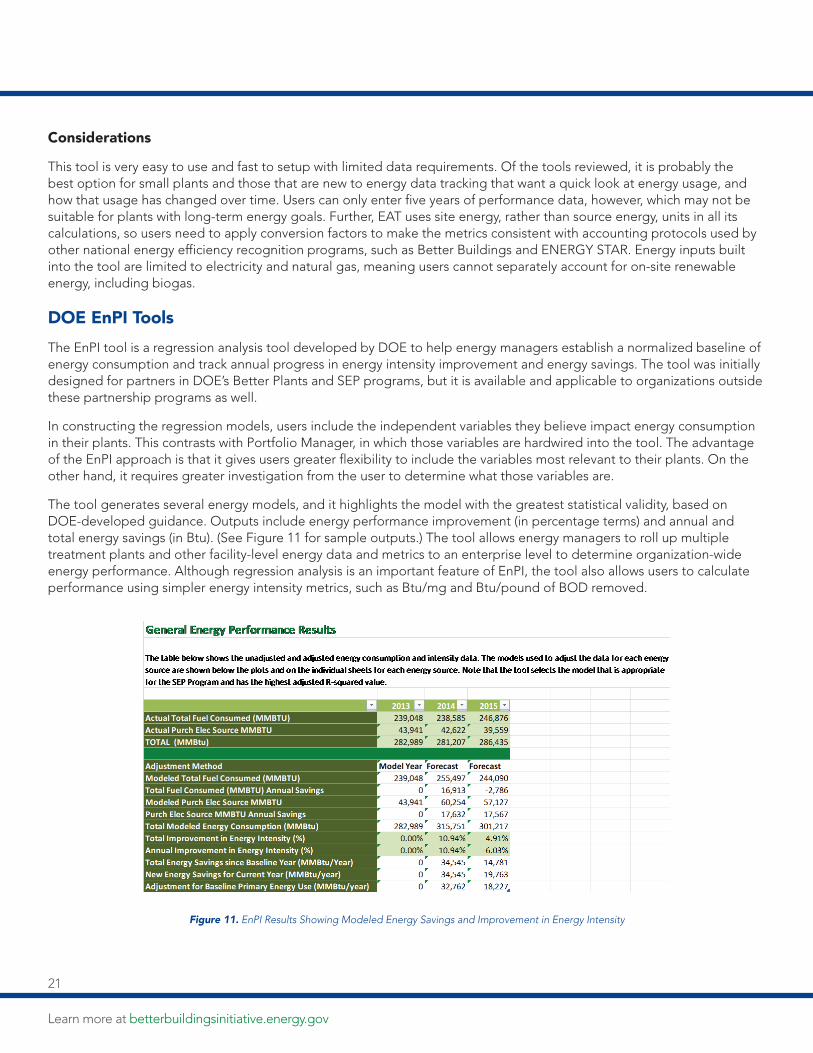
Learn more at betterbuildingsinitiative.energy.gov
Considerations
This tool is very easy to use and fast to setup with limited data requirements. Of the tools reviewed, it is probably the best option for small plants and those that are new to energy data tracking that want a quick look at energy usage, and how that usage has changed over time. Users can only enter five years of performance data, however, which may not be suitable for plants with long-term energy goals. Further, EAT uses site energy, rather than source energy, units in all its calculations, so users need to apply conversion factors to make the metrics consistent with accounting protocols used by other national energy efficiency recognition programs, such as Better Buildings and ENERGY STAR. Energy inputs built into the tool are limited to electricity and natural gas, meaning users cannot separately account for on-site renewable energy, including biogas.
DOE EnPI Tools
The EnPI tool is a regression analysis tool developed by DOE to help energy managers establish a normalized baseline of energy consumption and track annual progress in energy intensity improvement and energy savings. The tool was initially designed for partners in DOE’s Better Plants and SEP programs, but it is available and applicable to organizations outside these partnership programs as well.
In constructing the regression models, users include the independent variables they believe impact energy consumption in their plants. This contrasts with Portfolio Manager, in which those variables are hardwired into the tool. The advantage of the EnPI approach is that it gives users greater flexibility to include the variables most relevant to their plants. On the other hand, it requires greater investigation from the user to determine what those variables are.
The tool generates several energy models, and it highlights the model with the greatest statistical validity, based on DOE-developed guidance. Outputs include energy performance improvement (in percentage terms) and annual and total energy savings (in Btu). (See Figure 11 for sample outputs.) The tool allows energy managers to roll up multiple treatment plants and other facility-level energy data and metrics to an enterprise level to determine organization-wide energy performance. Although regression analysis is an important feature of EnPI, the tool also allows users to calculate performance using simpler energy intensity metrics, such as Btu/mg and Btu/pound of BOD removed.
Figure 11. EnPI Results Showing Modeled Energy Savings and Improvement in Energy Intensity
21

Considerations
This tool can be more challenging to use than others described in this document. The data input is not guided by the tool, although there is a step-by-step wizard that helps. Users generally require introductory knowledge of statistics to get the most value out of the tool. On the positive side, the EnPI tool performs robust regression analysis and provides the greatest flexibility in its ability to consider any variables that may be impacting energy use. It is especially well-suited for large wastewater treatment agencies that want to roll up multiple sites into a single organizational metric.
EnPI Lite
DOE recently released the EnPI Lite tool, which offers some of the same features as the EnPI tool in a more simplified, online format. The tool was designed as a special feature of DOE's 50001 Ready program and is now freely available to all. Through 50001 Ready, users self-attest to the completion of the 50001 Navigator—an online tool that guides organizations through the elements of the ISO 50001 energy management standard—and demonstrate energy performance improvement. DOE recommends users employ EnPI Lite to demonstrate and report their energy performance.
EnPI Lite, similar to EnPI, uses regression analysis to calculate normalized energy performance. The online user interface is more intuitive, and the outputs are easier to understand. On the other hand, some functionality is reduced. For example, EnPI Lite does not allow users to roll up metrics from multiple plants into a single organization-wide metric, as EnPI does. EnPI Lite can accept energy data uploads from Portfolio Manager and other spreadsheets, and it is integrated with DOE’s Energy Footprint Tool, which helps facilities identify significant energy uses within their plants, as well as operational and other factors impacting energy use. An illustration of how EnPI Lite works is shown in Figure 12.
Figure 12. EnPI Lite Workflow
22

Learn more at betterbuildingsinitiative.energy.gov
Next StepsOnce established, an energy performance data management system should be reviewed on an annual basis and updated as needed. These reviews can catch errors committed in previous data collection cycles, such as improper application of conversion factors, misaligned time periods for key data fields, and inadvertent omission of fuel sources. Annual reviews also provide an opportunity to assess whether any operational changes have occurred that may impact energy performance metrics. For example, a wastewater treatment plant may face new treatment requirements through updated permit limits or consent decrees. Generally, this leads to an increase in energy intensity and makes it harder for the plant to meet its energy goals. In these cases, the plant operators should explore making a baseline adjustment, which involves quantifying the increased energy consumption attributable to the new treatment requirements and retroactively building that into the baseline. In some cases, the operational changes are so significant that a baseline adjustment is not possible, or the plant lacks the metering equipment needed to isolate the unique energy impacts of the new treatment requirements. In those cases, plant operators can explore resetting the baseline year to cover a 12-month period following the operational change.
Ultimately, accurate and reliable data are a means to an end. As such, the energy data management system should be evaluated on the basis of whether it is helping the wastewater treatment plant meet its energy goals. As plant operators gain experience with data management, they may find that more sophisticated approaches are needed to support their broader energy management initiatives. Plants that previously calculated energy intensity on a straight Btu/mg or Btu/BOD basis could, for example, consider regression methods to normalize for these and other variables to view more clearly the impact of energy efficiency efforts. Plant operators may also find that utility billing data are not enough to fully understand how energy is consumed within the facilities. In those cases, they may choose to deploy submetering to better inform their energy management strategies and identify energy-saving opportunities.
Plant operators can also seek out opportunities to improve their broader energy management strategies. If they do not follow a set of formal energy management guidelines, plant operators should consider adopting established frameworks, such as those developed by EPA’s ENERGY STAR program and ISO 50001. Both follow a "plan, do, check, act" process for continuous improvement, and both recognize energy performance data tracking as an integral component of the overall energy management system. Both ISO 50001 and ENERGY STAR help plants maintain a focus on energy data management and improve broader energy management strategies. More information on these and other DOE resources is included in the Additional Resources section of this document.
23

Additional ResourcesWastewater treatment plants looking to further advance energy management strategies and drive greater cost savings have several options to choose from, a few of which are described below. All of these voluntary programs stress robust data management as a foundational element to strong energy management systems, but go further by also working with partners to set goals, identify energy-saving projects, and recognize progress.
DOE’s Better Buildings, Better Plants Program and Challenge. Better Plants partners set a goal to improve energy intensity, usually by 25% over 10 years, across their entire portfolio of industrial facilities. They establish energy baselines and report energy performance to DOE once a year. DOE helps partners establish appropriate metrics, develop energy management plans, learn from their peers, and identify energy efficiency projects and CHP opportunities. Currently, close to 200 industrial organizations participate in Better Plants, including more than 20 water and wastewater treatment agencies that range in size from small, single-plant operations (such as the Victor Valley Wastewater Reclamation Authority) to large, multi-site systems (such as the New York City Department of Environmental Protection). Contact [email protected] for information on how to join.
EPA’s ENERGY STAR Program. ENERGY STAR is a national, voluntary partnership program that provides diverse organizations with tools and resources to reduce energy use in their buildings and plants. ENERGY STAR partners agree to measure, track, and benchmark energy performance and to develop energy management plans following a well-established framework, depicted in Figure 13. EPA recognizes high-performing partners at an annual awards ceremony and through plant- and building-level certifications. For more information, visit https://www.energystar.gov/buildings?s=mega.
Figure 13. EPA ENERGY STAR Energy Management Framework
24

Learn more at betterbuildingsinitiative.energy.gov
Better Buildings Sustainable Wastewater Infrastructure of the Future (SWIFt) Accelerator. Through SWIFt, DOE offers its partners assistance in establishing energy data management systems, identifying no- and low-cost energy-saving opportunities, evaluating new energy-saving technologies, and developing comprehensive infrastructure improvement plans. SWIFt also provides wastewater treatment plants with a platform to share best practices and industry knowledge. Together with DOE, partners are developing road-tested tools and other resources to drive energy efficiency across the sector. For more information on SWIFt and how to join, contact Ben Nathan at [email protected].
DOE’s 50001 Ready. DOE has developed a suite of resources to help buildings and plants develop energy management systems based on the structure of the ISO 50001 energy management standard. This includes the 50001 Ready Navigator, an online tool that walks users through the steps of establishing such systems, complete with templates, detailed examples, and tips to facilitate the process. Plants can use the tool to prepare for full ISO 50001 certification (which requires a third-party audit), qualify for DOE recognition by self-attesting to completion of the tool, or both. For more information about 50001 Ready, contact Pete Langlois at [email protected].
DOE’s Superior Energy Performance Program. SEP is a plant-level certification program that requires facilities to satisfy two criteria: (1) achieve ISO 50001 certification for their energy management systems, and (2) demonstrate third-party verified energy savings. 50001 Ready and its Navigator can be a useful first step toward SEP certification. More than 40 buildings and plants have already been SEP certified, demonstrating savings of up to 30% over three years. Five wastewater treatment plants are currently seeking certification to SEP under a DOE pilot to evaluate the applicability of the program to this sector.
25

Energy Source
Delivery Measurement Units
Step 1: Convert to Btu by Multiplying by Unit Conversion Factors
Step 2: Convert to Primary Energy by Multiplying by Production Energy or Electric Energy Conversion Factors
Unit Conversion Factors Production Energy Conversion Multiplier Formula
Production Energy Conversion Default Factor
Electric Energy Primary Conversion Multiplier
Steam Pounds Per steam tables22 (using temperature and pressure)
Btu/pound 1/combusion system efficiency (for non-electric boilers)
1.33 (for non-electric boilers)
1.0 for fired boilers, 3.0 for electric boilers
Hot water Hot water volume (gallons/year)
8.3423 Btu/galof 1/combusion system efficiency (for non-electric boilers)
1.33 (for non-electric boilers)
1.0 for fired boilers, 3.0 for electric boilers
Solar kWh 3,412 Btu/kWh 1 1 1
Wind kWh 3,412 Btu/kWh 1 1 1
Biogas24 (as a fuel)
SCF Per lab results, based on higher heating value; if unavailable, can use industry value
Btu/SCF 1 1 1
Biogas25 (as electricity and thermal outputs from CHP system)
kWh 3,412 Btu/kWh 1 1 1
Recovered heat, based on hot water volume (gallons/year)
8.3426 Btu/galof 1 1 1
. 22 For values taken from steam tables, subtract the enthalpy (Btu/pound) of water at inlet conditions.
. 23 Gallons per year values should be multiplied by the unit conversion factor and by the temperature difference between preheated and delivered hot water.
. 24 Accounting for biogas energy content can be done according to one of three prevailing biogas energy accounting options: (A) treat the biogas as free energy and omit it from energy performance calculations, (B) convert the energy content of the biogas as a fuel, and (C) convert the energy content of biogas as electricity and recovered thermal energy produced. DOE recommends option (C), but see Accounting for On-Site Electricity Generation From Biogas in this document for further discussion.
. 25 Ibid.
. 26 Recovered heat energy content can be valued using gallons per year of hot water flow multiplied by the unit conversion factor and by the temperature difference between preheated and delivered hot water.
Appendices
Appendix A. Energy Unit Conversion Factors and Primary Energy Conversion Factors
26
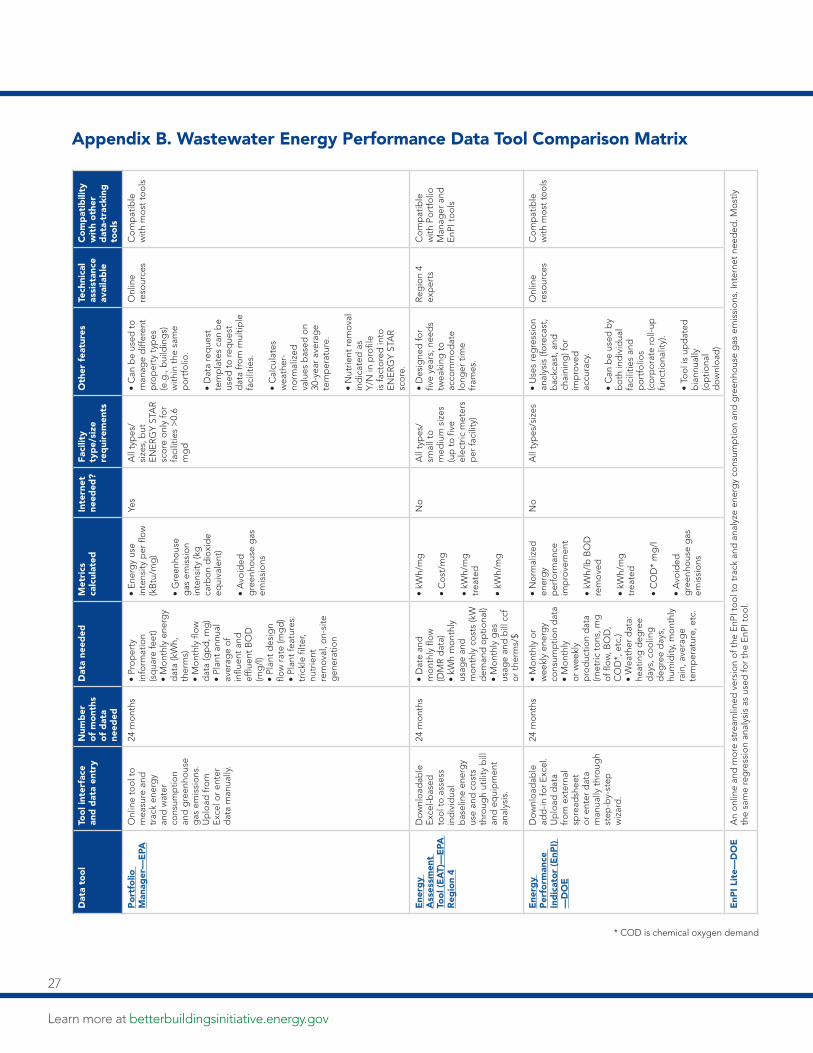
Learn more at betterbuildingsinitiative.energy.gov
Appendix B. Wastewater Energy Performance Data Tool Comparison Matrix
Dat
a to
ol
Too
l int
erfa
ce
and
dat
a en
try
Num
ber
o
f m
ont
hs
of
dat
a ne
eded
Dat
a ne
eded
Met
rics
ca
lcul
ated
In
tern
et
need
ed?
Faci
lity
typ
e/si
ze
req
uire
men
ts
Oth
er f
eatu
res
Tech
nica
l as
sist
ance
av
aila
ble
Co
mp
atib
ility
w
ith
oth
er
dat
a-tr
acki
ng
too
ls
Po
rtfo
lio
Man
ager
—E
PAO
nlin
e to
ol t
o
mea
sure
and
tr
ack
ener
gy
and
wat
er
cons
ump
tion
and
gre
enho
use
gas
em
issi
ons
. U
plo
ad fr
om
E
xcel
or
ente
r d
ata
man
ually
.
24 m
ont
hs•
Pro
per
ty
info
rmat
ion
(sq
uare
feet
) •
Mo
nthl
y en
erg
y d
ata
(kW
h,
ther
ms)
•
Mo
nthl
y flo
w
dat
a (g
pd
, mg
) •
Plan
t an
nual
av
erag
e o
f in
fluen
t an
d
efflu
ent
BO
D
(mg
/l)
• Pl
ant
des
ign
flow
rat
e (m
gd
) •
Plan
t fe
atur
es:
tric
kle
filte
r, nu
trie
nt
rem
ova
l, o
n-si
te
gen
erat
ion
• E
nerg
y us
e in
tens
ity p
er fl
ow
(k
Btu
/mg
)
• G
reen
hous
e g
as e
mis
sio
n in
tens
ity (k
g
carb
on
dio
xid
e eq
uiva
lent
)
• A
void
ed
gre
enho
use
gas
em
issi
ons
Yes
All
typ
es/
size
s, b
ut
EN
ER
GY
STA
R
sco
re o
nly
for
faci
litie
s >
0.6
mg
d
• C
an b
e us
ed t
o
man
age
diff
eren
t p
rop
erty
typ
es
(e.g
., b
uild
ing
s)
with
in t
he s
ame
po
rtfo
lio.
• D
ata
req
uest
te
mp
late
s ca
n b
e us
ed t
o re
que
st
dat
a fr
om
mul
tiple
fa
cilit
ies.
• C
alcu
late
s w
eath
er-
norm
aliz
ed
valu
es b
ased
on
30-y
ear
aver
age
tem
per
atur
e.
• N
utrie
nt re
mo
val
ind
icat
ed a
s Y/
N in
pro
file
is fa
cto
red
into
E
NE
RG
Y ST
AR
sc
ore
.
Onl
ine
reso
urce
sC
om
pat
ible
w
ith m
ost
to
ols
Ene
rgy
Ass
essm
ent
Too
l (E
AT)
—E
PA
Reg
ion
4
Do
wnl
oad
able
E
xcel
-bas
ed
too
l to
ass
ess
ind
ivid
ual
bas
elin
e en
erg
y us
e an
d c
ost
s th
roug
h ut
ility
bill
an
d e
qui
pm
ent
anal
ysis
.
24 m
ont
hs•
Dat
e an
d
mo
nthl
y flo
w
(DM
R d
ata)
•
kWh
mo
nthl
y us
age
and
m
ont
hly
cost
s (k
W
dem
and
op
tiona
l) •
Mo
nthl
y g
as
usag
e an
d b
ill c
cf
or
ther
ms/
$
• kW
h/m
g
• C
ost
/mg
• kW
h/m
g
trea
ted
• kW
h/m
g
No
All
typ
es/
smal
l to
m
ediu
m s
izes
(u
p t
o fi
ve
elec
tric
met
ers
per
faci
lity)
• D
esig
ned
for
five
year
s; n
eed
s tw
eaki
ng t
o
acco
mm
od
ate
long
er t
ime
fram
es.
Reg
ion
4 ex
per
tsC
om
pat
ible
w
ith P
ort
folio
M
anag
er a
nd
EnP
I to
ols
Ene
rgy
Per
form
ance
In
dic
ato
r (E
nPI)
—
DO
E
Do
wnl
oad
able
ad
d-in
for
Exc
el.
Up
load
dat
a fr
om
ext
erna
l sp
read
shee
t o
r en
ter
dat
a m
anua
lly t
hro
ugh
step
-by-
step
w
izar
d.
24 m
ont
hs•
Mo
nthl
y o
r w
eekl
y en
erg
y co
nsum
ptio
n d
ata
• M
ont
hly
or
wee
kly
pro
duc
tion
dat
a (m
etric
to
ns, m
g
of f
low
, BO
D,
CO
D*,
etc
.) •
Wea
ther
dat
a:
heat
ing
deg
ree
day
s, c
oo
ling
d
egre
e d
ays,
hu
mid
ity, m
ont
hly
rain
, ave
rag
e te
mp
erat
ure,
etc
.
• N
orm
aliz
ed
ener
gy
per
form
ance
im
pro
vem
ent
• kW
h/lb
BO
D
rem
ove
d
• kW
h/m
g
trea
ted
• C
OD
* m
g/l
• A
void
ed
gre
enho
use
gas
em
issi
ons
No
All
typ
es/s
izes
• U
ses
reg
ress
ion
anal
ysis
(fo
reca
st,
bac
kcas
t, a
nd
chai
ning
) fo
r im
pro
ved
ac
cura
cy.
• C
an b
e us
ed b
y b
oth
ind
ivid
ual
faci
litie
s an
d
po
rtfo
lios
(co
rpo
rate
roll-
up
func
tiona
lity)
.
• To
ol i
s up
dat
ed
bia
nnua
lly
(op
tiona
l d
ow
nlo
ad)
Onl
ine
reso
urce
sC
om
pat
ible
w
ith m
ost
to
ols
EnP
I Lit
e—D
OE
An
onl
ine
and
mo
re s
trea
mlin
ed v
ersi
on
of t
he E
nPI t
oo
l to
tra
ck a
nd a
naly
ze e
nerg
y co
nsum
ptio
n an
d g
reen
hous
e g
as e
mis
sio
ns. I
nter
net
need
ed. M
ost
ly
the
sam
e re
gre
ssio
n an
alys
is a
s us
ed fo
r th
e E
nPI t
oo
l.
* COD is chemical oxygen demand
27

Appendix C. FAQs: Getting Started With Data Tools
FAQs: Getting Started With Portfolio ManagerHow do I add a record in Portfolio Manager?
To add a meter record in Portfolio Manager, please follow these steps:
1) Log into Portfolio Manager.
2) Click on the property where you would like to create a meter record.
If you want to add flow meter data:
1) Navigate to the "Details" tab.
2) Click the name of the flow meter you would like to add information to.
3) If you have not set up your energy and flow meters, you may do so by clicking "Add a Meter" in the "Plant Flow Rate Meters" section and following the prompts.
4) Scroll down to the bottom of the page and click "Add an Entry." If you have multiple entries to add, click the button multiple times, once for each entry.
5) Once you are done, click "Save Bills."
6) Repeat as required for any additional flow meters.
If you want to add energy meter data:
1) Navigate to the "Energy" tab.
2) Click the name of the energy meter you would like to add information to.
3) If you have not set up your energy and flow meters, you may do so by clicking "Add a Meter" in the "Meters – Used to Compute Metrics" section and following the prompts.
4) Scroll down to the bottom of the page and click "Add an Entry." If you have multiple entries to add, click the button multiple times, once for each entry.
5) Once you are done, click "Save Bills."
6) Repeat as required for any additional energy meters.
For more information about adding entries to meters, as well as alternate input options, visit https://portfoliomanager.zendesk.com/hc/en-us/articles/211026098-How-do-I-add-energy-meter-data-bills-to-my-property-.
28

Learn more at betterbuildingsinitiative.energy.gov
How do I set a baseline year in Portfolio Manager?
To set a baseline year in Portfolio Manager:
1) Log into Portfolio Manager.
2) Click on the property whose baseline you would like to set.
3) Navigate to the "Goals" tab.
4) Scroll down until you see the "Set Baselines or Target" button.
5) Select the last month in your desired baseline period on this screen. For example, if you want to set your baseline as calendar year 2014, then select 12/31/2014 on this screen.
If you choose to not set a baseline year, Portfolio Manager will automatically set the baseline to the first 12-month period that has complete energy meter data. However, you can change it to any 12-month period that you want.
For more information on how to set a baseline period, as well as information on how to set a baseline for all properties in your portfolio at once, visit https://portfoliomanager.zendesk.com/hc/en-us/articles/211027628-What-is-a-baseline-year-How-do-I-change-it-.
How do I calculate baseline energy use and change from baseline in Portfolio Manager?
In Portfolio Manager, you can use the Reporting feature to get metrics for your property for any time period. First, you need to create a custom report template with the necessary metrics. The steps are:
1) Navigate to the "Reporting" tab.
2) Click the "Create a New Template" button.
3) Name your template. Note that everything you select here can be changed later. If you want to change the name of the report or the metrics that you’ve included, you can do so easily.
4) Select your reporting period. To get metrics for your baseline year, select "Baseline Energy Year." Portfolio Manager can also give you metrics for multiple years at once. For a comparison between the most recent year and the baseline year, select the "Current Energy Year vs. Baseline Energy Year" option.
5) Pick the property or properties you want included in the report.
6) Select the metrics you want included in the report. The most useful metrics likely are the "Water/Wastewater Site EUI (kBtu/gpd)" and "Water/Wastewater Source EUI (kBtu/gpd)," but you can also include total energy use, flow amounts, or costs. The metrics are sorted by category on the left, and you can include up to 50 in a single report.
7) Click "Save Template," and you’re done. You can run the report by finding it on the Reporting tab and selecting "Generate Report" from the drop-down menu.
More information about creating custom reports can be found at https://www.energystar.gov/buildings/tools-and-resources/portfolio-manager-custom-reporting-guide.
Where can I go if I need additional help? ENERGY STAR Portfolio Manager has a full FAQ website at https://portfoliomanager.zendesk.com/hc/en-us.
29

FAQs: Getting Started With the EPA Region 4 Energy Assessment ToolHow do I add a record in EAT?
To enter a new record in EAT, you must enter new monthly data for each electricity and natural gas meter, as well as updated flow data, in a new row. To do this:
1) Open the file.
2) Click on the "Plant and Energy Data" tab.
3) Fill in all visible columns, starting in row 25.
All entries should have the same date, and data must be sorted from oldest to newest, so new entries must be put at the bottom of the list.
How do I set a baseline year in EAT?
To set a baseline for a property in EAT:
1) Navigate to the "Plant & Energy Data Entry" tab of the document.
2) In cell C11, enter the date of your baseline.
Note that the date entered into C11 is the final day of your baseline period, and EAT requires 2 years of baseline data. So, for example, if you want your baseline period to end in December 2015, enter 12/31/2015 in cell C11. You need data from 1/1/2014 through 12/31/2015 to successfully calculate baseline metrics.
How do I calculate baseline energy use and change from baseline in EAT?
Once you set your baseline year, simply navigate to the "Summary Table" tab. On the "Summary Table" tab, average values for flow and energy use are listed for the baseline year, as well as the metrics and savings for the current period. To find the percent change from the baseline, refer to the metrics in the "% Change" column on the same tab.
Where can I go if I need additional help?
Contact the tool's developers at EPA: Bob Freeman at (404) 562-9243 or (605) 265-1193, or Brendan Held at (404) 562-8018.
30