Energy Corridor MD 2016 Report Draft - Wolff...
66
Transcript of Energy Corridor MD 2016 Report Draft - Wolff...

The Energy Corridor 2016 Inventory and Database
2

The Energy Corridor 2016 Inventory and Database
i
Table of ContentsTable of Contents............................................................................................................................... ............ iTable of Exhibits ............................................................................................................................... .............. iIntroduction and Overview........................................................................................................................... 1Major Employers............................................................................................................................... ............ 3Land Use............................................................................................................................... ......................... 4Land Use Maps ............................................................................................................................... ............ 4Development Summary............................................................................................................................ 16Multi Family Housing ............................................................................................................................... 18Retail............................................................................................................................... .......................... 19Office ............................................................................................................................... ......................... 21Industrial/Warehouse/Distribution.......................................................................................................... 26Hospitality ............................................................................................................................... ................. 27Institutional ............................................................................................................................... ............... 28
Hospitals ............................................................................................................................... ............... 28Educational Institutions ....................................................................................................................... 29
Comparison to Other Employment Centers ............................................................................................... 30Office Development in the Activity Centers............................................................................................. 31
The Energy Corridor Area Occupations....................................................................................................... 32Comparison of 30 minute Drive Time ...................................................................................................... 32Overall Location of Business and Technical Professionals ....................................................................... 35
Detailed Demographic Information ............................................................................................................ 42
Table of ExhibitsExhibit 1 The Energy Corridor Boundary Map ............................................................................................ 1Exhibit 2 Map of The Energy Corridor “Commute Zone” ........................................................................... 2Exhibit 3 Residential Location of Workers 2013 ......................................................................................... 2Table 1 Major Employers (200+ employees) .............................................................................................. 3Exhibit 4 Overall Existing Land Use Map..................................................................................................... 4Exhibit 5 Overall 2030 Land Use Map......................................................................................................... 5Exhibit 6 Western Zone Existing Land Use Map ....................................................................................... 6Exhibit 7 Western Zone 2030 Land Use Map............................................................................................ 7Exhibit 8 West Central Zone Existing Land Use Map................................................................................ 8Exhibit 9 West Central Zone 2030 Land Use Map .................................................................................... 9Exhibit 10 East Central Zone Existing Land Use Map ............................................................................. 10Exhibit 11 East Central Zone 2030 Land Use Map.................................................................................. 11Exhibit 12 Eastern Zone Existing Land Use Map..................................................................................... 12Exhibit 13 Eastern Zone 2030 Land Use Map ......................................................................................... 13Exhibit 14 Southern Zone Existing Land Use Map .................................................................................. 14Exhibit 15 Southern Zone 2030 Land Use Map ...................................................................................... 15

The Energy Corridor 2016 Inventory and Database
ii
Table 2 Existing and Future Commercial and Industrial Space................................................................. 16Table 3 Current and Future Housing Units ............................................................................................... 17Table 4 Current and Future Population and Employment........................................................................ 17Table 5 Apartments ............................................................................................................................... ...18Table 6 Apartments – Under Construction and Proposed........................................................................ 18Table 7 Retail Centers ............................................................................................................................... 19Table 8 Retail Centers Under Construction and Proposed..................................................................... 20Table 9 Regional Shopping Centers .......................................................................................................... 20Table 10 Class A Office Buildings ............................................................................................................ 21Table 11 Class B Office Buildings ............................................................................................................ 22Table 12 Class C Office Buildings ............................................................................................................ 23Table 13 Summary of Existing Office Buildings by Sub District ................................................................ 24Exhibit 16 The Energy Corridor Sub Districts Map ................................................................................... 24Exhibit 17 The Energy Corridor Office Construction History .................................................................... 25Table 14 Office Buildings Under Construction and Proposed ................................................................ 25Table 15 Industrial/Warehouse/Distribution Facilities............................................................................. 26Table 16 Hotels and Motels ...................................................................................................................... 27Table 17 Proposed Hotels and Motels...................................................................................................... 27Table 18 Existing Hospitals ....................................................................................................................... 28Table 19 Universities and Colleges ........................................................................................................... 29Table 20 Area Independent School Districts............................................................................................. 29Exhibit 18 – Houston Area Major Office Employment Centers .................................................................. 30Table 21 – Employment Centers and Office Development ........................................................................ 31Exhibit 19 30 Minute Drive Time Map...................................................................................................... 32Table 22 The Energy Corridor Occupations .............................................................................................. 34Table 23 The Energy Corridor Business and Technical Professionals ....................................................... 35Exhibit 20 Map of Residential Location of Architects and Engineers 2016 ............................................ 36Exhibit 21 Map of Residential Location of Business and Financial Professionals 2016.......................... 37Exhibit 22 Map of Residential Location of Computer and Mathematical Professionals 2016 ............... 38Exhibit 23 Map of Residential Location of Life Science Professionals 2016 ........................................... 39Exhibit 24 Map of Residential Location of Office and Administrative Support Staff 2016..................... 40Exhibit 25 Map of Residential Location of Sales and Related Professionals 2016 ................................. 41Exhibit 26 The Energy Corridor District Boundaries ................................................................................. 42Exhibit 27 The Energy Corridor Area Map ................................................................................................ 43Exhibit 28 The Energy Corridor Demographic Area .................................................................................. 44Exhibit 29 The Energy Corridor Commuting Region ................................................................................. 45Exhibit 30 Houston Baytown Sugar Land Metropolitan Statistical Area (MSA)....................................... 46Table 24 2016 Estimated Demographic Data ........................................................................................... 47Table 25 2010 Census Demographics ....................................................................................................... 57

The Energy Corridor 2016 Inventory and Database
1
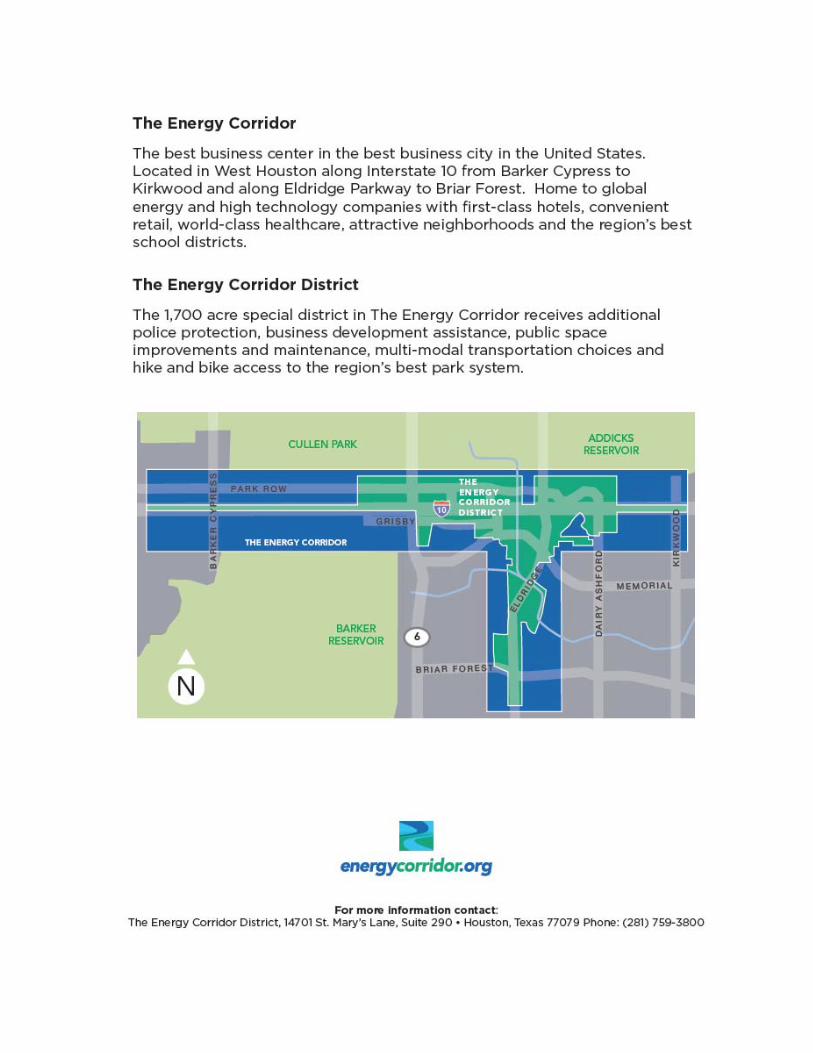
Introduction and OverviewThis report presents a land use, development and demographic profile of The Energy Corridor for 2016.The Texas State Legislature created Harris County Improvement District #4, more commonly known asThe Energy Corridor District, in 2001 with the mission to improve, enhance and promote the area withinits boundaries. Exhibit 1 illustrates the boundaries of the general market area of The Energy Corridor thatwill be used in most sections of this report.
The Energy Corridor is considered one of the nation’s premier employment centers. It is located alongInterstate 10 from the intersection at Kirkwood to just west of the intersection at Barker Cypress Road,and extends south along Eldridge Parkway to just south of Briar Forest Drive. The Energy Corridor is socalled because it contains the headquarters locations and regional offices of prominent internationalenergy and energy services firms including BP America, Shell Exploration and Production, ConocoPhillips,CITGO, Dow Chemical, PGS, and Mustang/Wood Group. Other, non energy, companies also have a majorpresence in the corridor including Cardinal Health Care Inc., Sysco Corporation, Gulf States Toyota, andStar Furniture. Overall, The Energy Corridor has the capacity for a population of 22,000 and 105,000 jobs.This capacity is based on counts of housing units and commercial square footage, assuming a highoccupancy. The capacity estimates are explained further on page 17 of this report. The Corridor containsover 25 million square feet of office space (of which 81% is Class A) and over 2.8 million square feet ofretail. While several projects remain proposed, 2016 will see the opening of all presently underconstruction office space in the Energy Corridor. This space is considered complete for the purposes ofthis report.
Another geographic area that will be used in this report is much larger than the Energy Corridor, the“Commute Zone” (Illustrated on Exhibit 2). This area includes the zip codes that are most oftenrepresented in surveys of The Energy Corridor employees.
Exhibit 1 The Energy Corridor Boundary Map
The Energy Corridor 2016 Inventory and Database
2
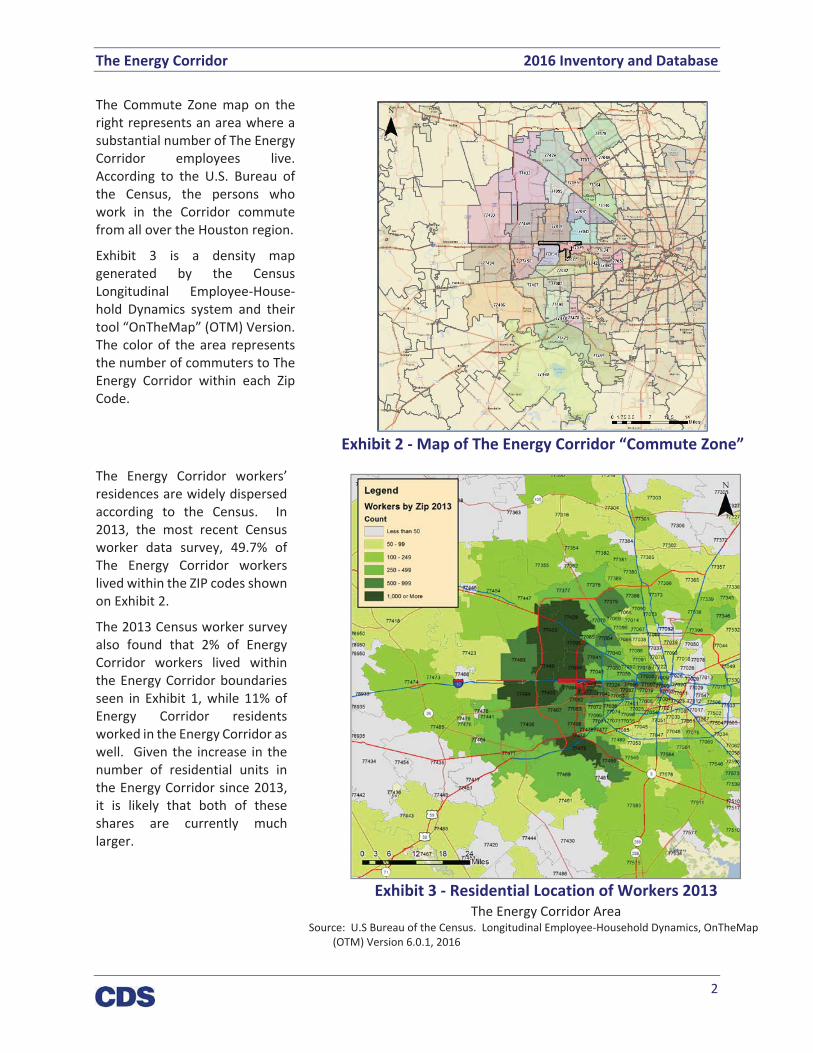
The Commute Zone map on theright represents an area where asubstantial number of The EnergyCorridor employees live.According to the U.S. Bureau ofthe Census, the persons whowork in the Corridor commutefrom all over the Houston region.
Exhibit 3 is a density mapgenerated by the CensusLongitudinal Employee Household Dynamics system and theirtool “OnTheMap” (OTM) Version.The color of the area representsthe number of commuters to TheEnergy Corridor within each ZipCode.
The Energy Corridor workers’residences are widely dispersedaccording to the Census. In2013, the most recent Censusworker data survey, 49.7% ofThe Energy Corridor workerslived within the ZIP codes shownon Exhibit 2.
The 2013 Census worker surveyalso found that 2% of EnergyCorridor workers lived withinthe Energy Corridor boundariesseen in Exhibit 1, while 11% ofEnergy Corridor residentsworked in the Energy Corridor aswell. Given the increase in thenumber of residential units inthe Energy Corridor since 2013,it is likely that both of theseshares are currently muchlarger.
Exhibit 2 Map of The Energy Corridor “Commute Zone”
Exhibit 3 Residential Location of Workers 2013The Energy Corridor Area
Source: U.S Bureau of the Census. Longitudinal Employee Household Dynamics, OnTheMap(OTM) Version 6.0.1, 2016

The Energy Corridor 2016 Inventory and Database
3
Major EmployersTable 1 Major Employers (200+ employees)
Company Name Address EmployeesWood Group 19416 Park Row, Suite 100 10,960BP America, Inc. 501 Westlake Park Blvd. 9,537Technip USA Inc. 11700 Katy Freeway, Suite 150 4,300ConocoPhillips 600 N. Dairy Ashford 3,000Shell Oil Company, Woodcreek 200 North Dairy Ashford 3,000Methodist West Houston Hospital 18500 Katy Freeway 2,100Mariner Post Acute Network 15415 Katy Freeway, Suite 800 2,000The Friedkin Group 1375 Enclave Pkwy. 2,000Sysco Corporation 1390 Enclave Pkwy. 1,800CITGO Petroleum Corporation 1293 Eldridge Parkway 1,367Dow Chemical 1254 Enclave Parkway 1,330Foster Wheeler USA Corporation 2020 S. Dairy Ashford Road 1,000Texas Children's Hospital West 18200 Katy Freeway 1,000Mustang Engineering (a Wood Group company) 16001 Park Ten Place, Suite 500 985Star Furniture Company 16666 Barker Springs Road 850Cardinal Health Pharmacy Services 1330 Enclave Pkwy. 750KBR Inc. 1080 Eldridge Parkway 700McDermott International Inc 777 N Eldridge Pkwy 700Gulf States Toyota, Inc. 1375 Enclave Pkwy. 600Alliance Engineering 330 Barker Cypress 450Sercel Inc. 17200 Park Row 450Worley Parsons 575 N Dairy Ashford St 450Gulf Interstate Engineering Co. 16010 Barkers Point Ln, Suite 600 430J. Ray McDermott, Inc. 757 N. Eldridge Pkwy. 400Expro Americas LLC 738 Highway 6 South, Suite 1000 350Schlumberger Financial 1200 Enclave Pkwy. 350Top Golf 1030 Memorial Brook Blvd. 350Bergaila & Associates, Inc. 1880 S. Dairy Ashford Rd, Suite 606 341Clover Global Solutions LP 16225 Park Ten Place, Suite 420 300Diamond Offshore Drilling, Inc. 15415 Katy Freeway 300Saipem America Inc. 15950 Park Row 300Stone & Webster Mgt. Consultant, Inc. 1430 Enclave Parkway 300PGS Americas 15150 Memorial Dr 295Mossy Nissan 12150 Katy Freeway 230Omni Houston Hotel Westside 13210 Katy Freeway 221Westside Lexus 12000 Old Katy Road 220Atwood Oceanics 15835 Park 10 Place 200SBM Atlantia, Inc. 1255 Enclave Pkwy. Suite 600 200Sonangol USA 1177 Enclave Parkway, Suite 200 200
Source: CDS Market Research, based on data from the Greater Houston Partnership business database. The employmentnumbers are approximate.

The Energy Corridor 2016 Inventory and Database
4
Land Use
Land Use Maps
Exhibit 4 Overall Existing Land Use Map

The Energy Corridor 2016 Inventory and Database
5
Exhibit 5 Overall 2030 Land Use Map
Note: The 2030 Land Use Map represents the most likely land uses based on current ownership or typical marketforces.
The Energy Corridor 2016 Inventory and Database
6
Exhibit 6 Western Zone Existing Land Use Map

The Energy Corridor 2016 Inventory and Database
7
Exhibit 7 Western Zone 2030 Land Use Map

The Energy Corridor 2016 Inventory and Database
8
Exhibit 8 West Central Zone Existing Land Use Map
The Energy Corridor 2016 Inventory and Database
9
Exhibit 9 West Central Zone 2030 Land Use Map
*
* Assumes ‘Livable Centers’ plan is enacted

The Energy Corridor 2016 Inventory and Database
10
Exhibit 10 East Central Zone Existing Land Use Map

The Energy Corridor 2016 Inventory and Database
11
Exhibit 11 East Central Zone 2030 Land Use Map
*
* Assumes ‘Livable Centers’ plan is enacted
The Energy Corridor 2016 Inventory and Database
12
Exhibit 12 Eastern Zone Existing Land Use Map

The Energy Corridor 2016 Inventory and Database
13
Exhibit 13 Eastern Zone 2030 Land Use Map

The Energy Corridor 2016 Inventory and Database
14
Exhibit 14 Southern Zone Existing Land Use Map

The Energy Corridor 2016 Inventory and Database
15
Exhibit 15 Southern Zone 2030 Land Use Map

The Energy Corridor 2016 Inventory and Database
16
Development Summary
The table below illustrates the total commercial development in The Energy Corridor as of September2015. This data is based on the parcel level GIS information on land use, illustrated on the previous pages,prepared by CDS Market Research. The source data used in this analysis was updated for the 2016inventory. The parcel level shape file was downloaded from the Harris County Appraisal District tocapture tracts that were subdivided. The parcel data was downloaded from HCAD’s public data inventoryin September 2015, when the 2015 tax records were finalized. Where parcel data was not available fromHCAD, CDS added data from the inventory. The present boundaries of The Energy Corridor Study areawere confirmed in 2011 and the numbers in following tables do not correlate entirely with those from thesame categories in editions of this report issued prior to 2011.
Table 2 Existing and Future Commercial and Industrial Space
The Energy Corridor
Building Size in Square Feet
Type West WestCentral
EastCentral East South Total
Existing 2016
Office/Mixed Use 3,825,485 3,539,109 3,996,484 11,818,238 3,219,409 26,398,725
Industrial/Warehouse 1,955,506 222,585 10,000 0 217,076 2,405,167
Retail 541,727 507,177 438,151 228,133 1,134,901 2,850,089
Grand Total 6,322,718 4,268,871 4,444,635 12,046,371 4,571,386 31,653,981Future 2030
Office/Mixed Use 4,954,275 12,272,499 4,496,384 16,649,214 4,055,411 42,427,783
Industrial/Warehouse 1,766,686 231,585 10,000 0 7,493 2,015,764
Retail 1,043,042 658,836 464,822 438,324 904,141 3,509,165
Grand Total 7,764,003 13,162,920 4,971,206 17,087,538 4,967,045 47,952,712
These numbers differ from those listed in the tables on pages 18 through 27. The tables on the upcomingpages are a listed inventory assembled by CDS that does not include some of the small commercialproperties that HCAD parcel data counts.
The office space tabulation above is reasonably consistent with the office building listings in Tables 10through 13.
In the case of retail, the 2.8 million square feet in the table above is substantially more than in the 1.2million square feet listing in the tabulation of shopping centers (Table 7). The reason for this difference isthat Table 7 largely includes shopping centers in excess of 10,000 square feet in size and does not includemost of the owner occupied, single use, or “pad” retail buildings such as banks, freestanding restaurants,car dealerships, and convenience stores.
The Energy Corridor 2016 Inventory and Database
17
Table 3 Current and Future Housing Units
The Energy Corridor
Number of Housing Units
Type West WestCentral
EastCentral East South Total
Existing 2016
Multifamily Condo/Apts 0 1,677 3,722 3,090 491 8,980
Single Family, Attached 0 0 30 137 0 167
Single Family, Detached 0 991 129 540 146 1,806
Grand Total 0 2,668 3,881 3,767 637 10,953Future 2030
Multifamily Condo/Apts 384 3,532 3,752 6,499 803 14,970
Single Family, Attached 0 0 30 137 0 167
Single Family, Detached 0 991 129 585 146 1,851
Grand Total 384 4,523 3,911 7,221 949 16,988
For the 2016 multifamily unit count, the 8,979 units listed in the table above include condominiumprojects and HCAD unit counts as compared with the 8,331 units in only apartment projects listed in Table5.
Table 4 Current and Future Population and Employment
The Energy Corridor
Population and Employment Capacity
Type West WestCentral
EastCentral East South Total
Existing 2016
Population Estimate 689 6,884 5,088 7,704 1,668 22,034
Employment Estimate 22,724 13,834 14,684 40,240 13,607 105,090Future 2030
Population Estimate 1,656 9,279 5,126 12,601 2,058 30,720
Employment Estimate 27,632 46,360 16,411 56,901 15,684 162,989
The table above contains estimates for the Energy Corridor’s capacity for population and employment.These estimates were calculated based on characteristics in the parcel data from HCAD andsupplementations that CDS added. Population is calculated using a variety of people per housing unitratios, depending on the type of housing unit. Employment is calculated using square foot per employeeratios specific to the various commercial land uses. All ratios assume a reasonably high, but not 100%,occupancy rate, which is why these estimates are termed as the Energy Corridor’s capacity for populationand employment.

The Energy Corridor 2016 Inventory and Database
18
Multi Family HousingTable 5 Apartments
The Energy Corridor (sorted by class, then by number of units)Apartment Complex Address Zip Class Units Built
Chandler Park 1950 Eldridge Pkwy 77077 A 432 1998Broadstone Memorial 875 Eldridge Pkwy 77079 A 401 2008Heritage at Park Row 15211 Park Row 77084 A 400 1999Briar Forest Apartments/Lofts 13202 Briar Forest 77077 A 400 2009San Paloma 1255 Eldridge Pkwy 77077 A 396 2006Carrington Park Empirian 15335 Park Row 77084 A 390 2004AMLI of Eldridge Parkway Ph I 1415 Eldridge Pkwy 77077 A 368 1997Alexan Enclave Apartments 13411 Briar Forest 77077 A 354 2016Village on the Parkway 1333 Eldridge Pkwy 77077 A 352 1994The Heights at Park Row Worthing 13710 Park Row 77084 A 342 2015Park on Memorial, The 14855 Memorial Dr 77079 A 334 1991Eclipse 1725 Crescent Plaza 77077 A 330 2009Grayco Apartments WestMemorial Place 15375 Memorial Dr 77079 A 329 2015Alliance 7 Seventy Eldridge 770 N Eldridge Pkwy 77079 A 327 2014Domain on Eldridge, The 1755 Crescent Plaza Dr 77077 A 320 2012Arcadian West 14220 Park Row 77079 A 318 1998San Montego 1600 Eldridge 77077 A 314 1998Village on Memorial, The 15200 Memorial Drive 77079 A 305 2005Legend at Park Ten, The 15000 Park Row 77084 A 236 1999Park Place 15200 Park Row 77084 A 229 1996Promenade Memorial 15135 Memorial 77079 A 228 1992Memorial Aura 14900 Memorial Dr. 77079 A 228 2015AMLI of Eldridge Parkway Ph II 1415 Eldridge Pkwy 77077 A 216 1999Marquis on Memorial, The 15885 Memorial Dr 77079 A 104 1993Grayco Rental West MemorialPlace 15375 Memorial Dr 77079 A 70 2015Eagle Hollow 11900 Wickchester 77043 B 350 1981Live Oak 851 Threadneedle 77079 B 162 1977Meadows on Memorial 700 Memorial Mews 77079 B 96 1981
Total Units 8,331Source: Enriched Data (formerly O’Connor & Associates), CDS Market Research
Table 6 Apartments – Under Construction and ProposedThe Energy Corridor
Apartment Complex Location Class Units StatusBroadstone Energy Park 710 Highway 6 S A 417 U/C
Huntington 10 Oaks Park Row at Barker Cypress A 384 U/CTrammell Crow Urban Alexan Ashford 1200 N. Dairy Ashford A 312 U/C
H6 Apartments Duke Inc. SH 6 at Grisby A 293 U/CTotal Units 1,406
Source: Enriched Data (formerly O’Connor & Associates), CDS Market Research, Energy Corridor District

The Energy Corridor 2016 Inventory and Database
19
RetailTable 7 Retail Centers
The Energy Corridor ranked by sizeExisting Center Name Address Zip Net SF Year Built
Star Furniture 16666 Barker Springs 77084 174,425 1980Bally Park 10 17750 Katy Fwy 77084 150,000 2006Tully I 10 Shopping Ctr 12151 Katy Frwy 77079 126,600 1974Parkway Villages Shopping Ctr 1506 Eldridge Pkwy 77077 100,000 2000Kirkwood Center 11635 Katy Frwy 77079 50,400 1969Top Golf Entertainment Memorial Brook Blvd 77084 50,000 2012Plazas At The Parkway, The 1127 Eldridge Pkwy 77077 46,670 2001LA Fitness 1555 Eldridge Pkwy 77088 45,000 2006TK Center Retail 1809 Eldridge Pkwy 77077 42,000 2009Dairy Ashford Center 1001 Dairy Ashford 77079 26,598 1978Grainger Supply Store 17010 Katy Fwy 77084 26,400 200611939 Katy Frwy 11939 Katy Frwy 77079 20,522 1979Parkway Villages (Phase II) 13410 Briar Forest 77077 18,700 2007Olive Hill 1531 Eldridge Pkwy 77077 18,320 2008Eldridge Retail Center 1520 Eldridge Pkwy 77077 18,320 2009Plaza at the Park Ten 1029 Hwy 6 N 77079 18,102 2000Satya retail at Sandbridge 1275 Eldridge Pkwy 77077 18,000 2007Golden Oak 214 Addicks Howell Rd 77079 17,645 2008Retail 14515 Katy Freeway 14515 Katy Freeway 77079 17,645 2009Addicks Plaza 432 Hwy 6, N 77079 17,460 1978Eldridge Briar Retail Center 1635 Eldridge Pkwy 77077 16,750 2009Satya Retail Pad Sites Eldridge Crescent 77077 16,750 2009Eldridge Village Shopping Ctr 1402 Eldridge Pkwy 77077 15,960 1998Kayvon Plaza II 15445 Memorial Dr 77079 15,313 200415625 Katy Frwy 15625 Katy Frwy 77094 15,000 1996Kayvon Plaza I 15455 Memorial Dr 77079 15,000 2004La Z Boy Furniture 15905 Katy Fwy 77094 14,724 2000CVS Pharmacy 15010 Memorial Dr, N 77079 13,647 2005Memorial & Eldridge Center 840 N Eldridge Pkwy 77079 12,421 1998Briarforest Plaza 13346 Briar Forest 77077 11,981 2005IBC Bank Eldridge and Briar Forest 1545 Eldridge Pkwy 77077 11,981 2007Briar Hills Parkway 1101 Hwy 6, S 77077 11,650 1978Barker Cypress Plaza 18111 Katy Frwy 77079 10,750 2009Katy Addicks Plaza 14725 Katy Fwy 77079 10,065 2003Le Mistral and Foody's 1420 Eldridge Pkwy 77077 10,000 2008Fincher Eldridge/Enclave 1140 Eldridge Pkwy 77077 10,000 2009Chick Fil A Restaurant 13412 Briar Forest Dr 77077 5,000 2014People’s Trust Credit Union Crescent at Eldridge Parkway 77077 5,000 2013
Total SF 1,224,799
Source: Enriched Data (formerly O’Connor & Associates), CDS Market Research, Energy Corridor District

The Energy Corridor 2016 Inventory and Database
20
Table 8 Retail Centers Under Construction and Proposed
The Energy Corridor ranked by sizeCenter Name Address Zip Net SF Status
Sewell Mercedes Benz (former Sam's Club) 1025 Hwy 6, N 77079 135,000 ProposedTotal SF 135,000
Source: Enriched Data (formerly O’Connor & Associates), CDS Market Research, Harris County Appraisal District,Energy Corridor District
Table 9 Regional Shopping Centers
(Serving The Houston Houston Energy Corridor but outside of the boundaries)
Center Name Location Zip Net SF Year Built
Memorial City Mall Interstate 10 at Gessner Road 77024 1,883,497 1966Katy Mills Mall Interstate 10 at Pin Oak Road 77024 1,189,816 1999West Oaks Mall FM 1093 at State Highway 6 77082 1,073,112 1984
Total 4,146,425
Source: Enriched Data (formerly O’Connor & Associates), CDS Market Research, Harris County Appraisal District

The Energy Corridor 2016 Inventory and Database
21
OfficeTable 10 Class A Office Buildings
The Energy Corridor (listed by size)Class A Building Address Zip Sq. Feet Built
Conoco Center, 16 Buildings 600 N Dairy Ashford Rd. 77079 1,200,000 1984One Westlake Park BP Center 501 Westlake Park Blvd. 77079 949,379 1982Shell Woodcreek 200 Dairy Ashford 77079 820,000 1981Energy Center 4 935 N. Eldridge Pkwy 77079 600,000 2015Four Westlake Park 200 Westlake Park Blvd. 77079 598,057 1992Energy Center 3 935 N. Eldridge Pkwy 77079 550,000 2014Energy Center 5 IH 10 at Eldridge 77079 550,000 2016Gulf States Toyota 2 office buildings 1345 Enclave 77077 500,000 2009Energy Tower III 11740 Katy Fwy 77079 429,000 2014Energy Tower IV 11750 Old Katy Rd. 77079 429,000 2015Energy Tower II 11720 Katy Fwy 77079 428,000 2009Three Westlake Park 550 Westlake Park Blvd. 77079 414,792 1983Shell Oil 5 200 N. Dairy Ashford 77079 402,000 2015BP Helios Plaza / E&P Learning Ctr 501 Westlake Park 77079 390,000 2009Two Westlake Park 580 Westlake Park Blvd. 77079 381,327 1982Shell Oil 3 200 N. Dairy Ashford 77079 375,000 2014Shell Oil 4 200 N. Dairy Ashford 77079 375,000 2014Dow Houston The Plaza at Enclave 1254 Enclave 77077 354,000 2008West Memorial Place II Skanska 15375 Memorial Dr 77079 350,000 2016Eldridge Oaks I 1080 Eldridge Parkway 77079 350,000 2009West Memorial Place I Skanska 15375 Memorial Dr 77079 350,000 2015Houston EC Development 13501 Katy Fwy 77079 345,900 1980Energy Center I 575 N. Dairy Ashford Rd. 77079 330,000 2008Energy Crossing II 15011 Katy Frwy 77094 327,000 2014Energy Tower I 11700 Katy Fwy 77079 325,826 1999Shaw Stone & Webster Bldg. 1430 Enclave Parkway 77077 312,564 1994Sysco Headquarters Ph I 1370 Enclave Parkway 77077 312,000 2006Energy Center II 585 N. Dairy Ashford 77079 303,000 2009Enclave Place 1414 Enclave Parkway 77077 302,000 2015Three Eldridge Place 737 N Eldridge Parkway 77079 300,000 2009Kirkwood Atrium III 11757 Katy Fwy 77079 280,435 1984Two Eldridge Place 757 N Eldridge Pkwy. 77079 279,329 1986Ten West Corporate Center II 17420 Katy Fwy 77094 250,000 2007CITGO Eldridge Green 1293 Eldridge Parkway 77077 249,158 1999Transwestern Westgate 1 17220 Katy Fwy 77084 249,000 2014One Eldridge Place 777 N Eldridge Parkway 77079 239,501 1985Energy Crossing I 15021 Katy Frwy 77079 239,166 2009Transwestern Westgate 3 17220 Katy Fwy 77084 226,000 2014Kirkwood Atrium II 11767 Katy Fwy 77079 224,630 19821401 Enclave Pkwy 1401 Enclave Parkway 77077 208,000 2006Cardinal Health Services 1330 Enclave Parkway 77077 200,000 1999Sysco Conference Center 1390 Enclave Parkway 77077 200,000 2005Ten West Corporate Center I 17404 Katy Fwy 77094 200,000 1998Transwestern Westgate 2 17220 Katy Fwy 77084 186,000 2014

The Energy Corridor 2016 Inventory and Database
22
Class A Building Address Zip Sq. Feet BuiltStena Sasol Wickchester Lane 77079 175,000 2015Stena Jacobs Plaza 12140 Wickchester Lane 77079 175,000 2015Enclave on the Lake 1255 Enclave Parkway 77077 171,091 1999Shell Exploration & Production 150 N Dairy Ashford 77079 170,000 2009Shell Woodcreek Phase I 200 N. Dairy Ashford Rd. 77079 170,000 2008Methodist Professional Building 2 18000 Katy Fwy 77084 166,000 2014One Park 10 Plaza 16225 Park Ten Place Dr. 77084 164,676 1982The Offices at Park 10, Phase 1 16282 Park Ten Place Dr. 77084 160,800 1999The Offices at Park 10, Phase 2 16290 Park Ten Place Dr. 77084 156,468 2006Park Ten Plaza 15115 Park Row 77084 155,789 2000Park Ten Centre 1311 Broadfield Blvd. 77084 155,040 19991200 Enclave Pkwy. 1200 Enclave Parkway 77077 153,667 1999The Reserve at Park Ten Place Phase I 15721 Park Row 77084 150,000 2009Methodist Hospital Medical Office 18000 Katy Fwy 77084 150,000 2012Texas Children's Hospital Physician Bldg 18400 Katy Fwy 77084 150,000 2010Metro National 15150 Memorial Dr. 77079 146,765 1992Lincoln Park 10 Center I 16200 Park Row 77084 146,429 2015Barker's Landing Gulf Plaza 16010 Barkers Point Ln. 77079 120,651 1982Woodbranch Office Plaza I 12121 Wickchester Ln. 77079 119,639 1983Woodbranch Office Plaza II 12141 Wickchester Ln. 77079 118,448 1983Park Ten Place 16365 Park Ten 77084 110,405 2009BP communications center 501 Westlake Park Blvd. 77079 110,000 2014Woodbranch Bldg. 12012 Wickchester Ln. 77079 108,999 1983Reliability Bldg 16400 Park Row 77084 90,000 1985Shell Exploration Amenities Center 200 N. Dairy Ashford Rd. 77079 30,000 2008Total Class A SF 20,409,931
Source: Enriched Data (formerly O’Connor & Associates), CDS Market Research, Harris County Appraisal District, EnergyCorridor District
Table 11 Class B Office BuildingsThe Energy Corridor (listed by size)
Class B Building Address Zip Sq. Feet Built
Ashford V 14701 St. Mary's Ln. 77079 202,916 1981Ashford VII 900 Threadneedle St. 77079 188,113 1979Ashford VI 1155 Dairy Ashford Rd. 77079 183,268 1981Freeway Tech Center 17000 Katy Fwy 77084 174,521 2007Diamond Offshore 15415 Katy Fwy 77094 165,600 1983Memorial 6 Office Bldg. 738 S Hwy 6 77079 156,703 1985Atrium at Park Ten 16340 Park Ten Place Dr. 77084 139,834 198116001 Park Ten Place Dr. 16001 Park Ten Place Dr. 77084 136,954 1983Timberway II 15995 N Barkers Landing Rd. 77079 130,578 1983Park Row Place (Mustang) 17900 Park Row 77084 121,000 2007Park Row Center 15342 Park Row 77084 118,500 2009Ashford East 1160 Dairy Ashford Rd. 77079 113,289 1979Parkview I 330 Barker Cypress Rd. 77094 111,532 198716430 Park Ten Pl 16430 Park Ten Place Dr. 77084 109,544 1982

The Energy Corridor 2016 Inventory and Database
23
Class B Building Address Zip Sq. Feet BuiltTen Plaza West Sea Engineering 15915 Katy Fwy 77094 104,337 1982Abby Office Center 1400 Broadfield Blvd. 77084 102,865 1982Briar Hills I 1011 S Hwy 6 77077 101,630 1982PBS&J Plaza 1250 Woodbranch Park Dr. 77079 100,054 1981Yancey Hausman Office/Flex 16901 Park Row 77084 100,000 2009Timberway I 15990 N Barkers Landing Rd. 77079 93,789 1982Lincoln Park Ten 15810 Park Ten Place Dr. 77084 85,026 1982Ashford Place III 14800 St. Mary's Ln. 77079 84,775 1979Park 10 16420 Park Ten Place Dr. 77084 83,078 1982Mustang Engineering 16900 Park Row 77084 82,212 198017171 Park Row Bldg. 17171 Park Row 77084 74,774 1982Park Ten Place I 16350 Park Ten Place Dr. 77084 71,893 1979Park Ten Place II 16360 Park Ten Place Dr. 77084 69,667 1981810 S Hwy 6 810 S Hwy 6 77079 68,987 1980Atwood Oceanics 15835 Park Ten Place Dr. 77084 59,825 1981Ashford Place 950 Threadneedle St. 77079 58,511 19771201 Dairy Ashford Rd. 1201 Dairy Ashford Rd. 77079 58,001 1976Ashford IV 14811 St. Mary's Ln. 77079 57,311 1980Two Park Ten Place 16300 Katy Fwy 77094 57,050 1983Ashford Atrium 14825 St. Mary's Ln. 77079 44,474 1978Barkers Point Plaza 16000 Barkers Point Ln. 77079 41,607 198116211 Park Ten Place Dr. 16211 Park Ten Place Dr. 77084 40,800 1980Wood Group 1410 Park Ten Blvd. 77084 40,000 2003Universal Fidelity Corporation 1445 Langham Creek Dr. 77084 40,000 2006Sonangal 1177 Enclave Pkwy. 77077 36,907 2002Bernstien Perwin 3 Story Office Bldg. 14511 Old Katy Rd 77079 36,000 2009Wells Fargo Bank Bldg. 1035 Dairy Ashford Rd. 77079 35,150 1977One Park Ten Place 16365 Park Ten Place Dr. 77084 34,034 2006Memorial Office Park, Bldg. B 14925 Memorial Dr. 77079 33,578 1979Memorial Office Park, Bldg. A 14925 Memorial Dr. 77079 28,951 197916000 Memorial Dr. 16000 Memorial Dr. 77079 28,229 1981Briarhills Parkway Bldg. 14515 Briarhills Pkwy. 77077 25,173 1982Bernstien Perwein Office Building 14521 Old Katy Rd 77084 25,000 2005Ashford Plaza Medical Center 14730 14740 Barryknoll Ln. 77079 20,000 1978Sylvan Inc. Orthodontist 1398 Eldridge 77077 18,000 2007Foundation Surgery 15775 Park Ten Place Dr. 77084 18,000 2004Total Class B SF 4,112,040
Source: Enriched Data (formerly O’Connor & Associates), CDS Market Research, Harris County Appraisal District, EnergyCorridor District
Table 12 Class C Office BuildingsThe Energy Corridor (listed by size)
Class C Building Address Zip Sq. Feet BuiltKirkwood Atrium North & South 11777 Katy Fwy 77079 123,300 1979Fountains @ Park Ten 16430 Park Ten Place 77084 114,000 198211999 Katy Fwy 11999 Katy Fwy 77079 106,748 1980One Woodbranch Centre 11931 Wickchester Ln. 77043 65,900 1984

The Energy Corridor 2016 Inventory and Database
24
Class C Building Address Zip Sq. Feet BuiltAddicks Ten Business Park 14520, 14526, 14530 Old Katy Rd. 77079 31,000 1981NACE International 1440 S Creek Dr 77084 28,000 1977West Quad Bldg 16600 Park Row 77084 24,000 1981Addicks Atrium 430 S Hwy 6 77079 20,006 1979Syntron 17150 Park Row 77084 17,000 1981Memorial Plaza 15119 Memorial Dr. 77079 15,351 196914960 Park Row 14960 Park Row 77084 13,508 1995303 Stafford St. 303 Stafford St. 77079 11,000 1981Total Class C SF 569,813
Source: Enriched Data (formerly O’Connor & Associates), CDS Market Research, Harris County Appraisal District, EnergyCorridor District
Table 13 Summary of Existing Office Buildings by Sub DistrictThe Energy Corridor
District Class A Class B Class C Grand TotalAshford Place 129,249 129,249Energy Corridor District 11,484,997 1,196,536 67,859 12,749,392Enclave Parkway 2,713,322 2,713,322Other Areas 265,974 265,974Park Ten West 2,710,818 1,942,109 186,000 4,838,927South Highway 6 686,817 478,118 20,006 1,184,941Woodbranch/Kirkwood 2,813,977 100,054 295,948 3,209,979Grand Total 20,409,931 4,112,040 569,813 25,091,784
Exhibit 16 The Energy Corridor Sub Districts Map

The Energy Corridor 2016 Inventory and Database
25
Table 14 Office Buildings Proposed
Proposed
Proposed Building Location Zip Sq. FeetRepublic Square – Houston ECDevelopment Mixed Use Project
13501 Katy Fwy 77079 2,600,000
Transwestern Pinnacle West Office Park Row 77079 1,500,000Westlake 5 IH 10 at Keating 77079 750,000Core Office Park West II Park Row 77084 750,000Core Office Park West III Park Row 77084 750,000Core Office Park West IV Park Row 77084 750,000Eldridge Oaks II Eldridge at Enclave 77079 350,000Shell Oil 6 200 N. Dairy Ashford 77079 350,000Core Office Park West I Park Row 77084 321,000Enclave Corporate Center Enclave 77077 170,000The Reserve at Park Ten Place Phase II 15720 Park Ten Place 77084 150,000Lincoln Park 10 Center II Park Row 77084 146,429
Total Proposed SF 8,587,429
Exhibit 17 The Energy Corridor Office Construction History
0
2,000,000
4,000,000
6,000,000
8,000,000
10,000,000
12,000,000
14,000,000
1976 1985 1986 1995 1996 2005 2006 2016
Office Space by Square Feet
Class C
Class B
Class A

The Energy Corridor 2016 Inventory and Database
26
Industrial/Warehouse/DistributionTable 15 Industrial/Warehouse/Distribution FacilitiesFacility Address Zip Gross SF Yr Built
Park 10 Service Center 16802 Barker Springs 77084 250,331 1978Park Ten Distribution Center 1325 Creek Dr 77084 152,700 1980Star Furniture 16666 Barker Springs 77084 141,850 1980Public Storage 11900 Old Katy Rd 723 77079 136,132 197916400 Park Row 16400 Park Row 77084 131,000 198016727 Park Row 16727 Park Row 77084 100,000 1975Park Ten Crescent 1304 Langham Creek Dr 77084 89,541 1979First Document Storage Building 16900 Park Row 77084 82,212 1980Techniplex Business Center 1441 Park Ten Blvd 77084 79,000 1976Techniplex Business Center I 16203 Park Row 77084 78,116 1982Syntron Inc 17200 Park Row 77084 75,000 1980Memorial Mini Storage 1101 Tully 77079 72,058 1978Park Row Center 16522 Park Row 77084 71,500 1979Saipem America 15950 Park Row 77084 70,000 197617015 Park Row 17015 Park Row 77084 60,100 197916514 Park Row 16514 Park Row 77084 57,500 1990South Coast Technology 16503 Park Row 77084 50,500 1978Canteen 15951 Park Row 77084 50,000 1980Sercel, Inc 17155 Park Row 77084 50,000 1981Blue Bell 16770 Park Row 77084 50,000 2007Business Center at Park Ten Phase I 15740 Park Row 77084 45,000 1998Park Row Technology Center 16700 Park Row 77084 42,070 1998Business Center at Park Ten Phase II 15730 Park Row 77084 41,400 1998Techniplex Business Center II 16223 Park Row 77084 38,244 2000Technipark Ten Service Center 16155 Park Row 77084 37,701 198416610 Barker Springs 16610 Barker Springs 77084 35,361 1980Terrapin Corporation 16337 Park Row 77084 35,170 197916400 B Park Row 16400 Park Row 77084 35,000 1985Technipark Ten Service Center #4 16115 Park Row 77084 33,934 198416600 Park Row 16600 Park Row 77084 31,410 1981Park Row, 16910 16910 Park Row 77084 29,709 197816930 Park Row 16930 Park Row 77084 29,600 1978Business Center at Park Ten Phase III 15720 Park Row 77084 28,800 1998Continental Carbon 16850 Park Row 77084 28,000 198017150 Park Row 17150 Park Row 77084 27,500 1978McMillian Equipment Company 16720 Park Row 77084 27,000 1973Sears Service Center 16555 Park Row 77084 24,118 1978Addicks 10 Business Park 13800 Old Katy Rd 77079 15,400 1961Park Row Center I 15330 Park Row 77084 15,000 2008Park Row, 16534 16534 Park Row 77084 14,750 1978600 Highway 6 600 Highway 6 77079 13,602 200517111 Katy Freeway 17111 Katy Fwy 77094 11,400 1980Park Ten Business Park 16510 Park Row 77084 10,000 1980
Total Industrial SF 2,497,709Source: Enriched Data (formerly O’Connor & Associates), CDS Market Research, Harris County Appraisal District, Grubb & EllisData Services

The Energy Corridor 2016 Inventory and Database
27
HospitalityTable 16 Hotels and Motels
Hotel/Motel Address KeysOmni Westside Hotel 13210 Katy Freeway 400Wyndham: Houston West 14703 Park Row 344Embassy Suites Energy Corridor 11730 Katy Freeway 216Marriott Park 10 16011 Katy Freeway 206Hilton Garden Inn Houston Energy Corridor 12245 Katy Freeway 190Courtyard by Marriott 12401 Katy Freeway 176Extended Stay Deluxe 15385 Katy Freeway 145Courtyard by Marriott 18010 Park Row 135Motel 6 Studio Extended Stay 14833 Katy Freeway 135Studio 6 1255 N Highway 6 134Residence Inn West 1150 Eldridge Pkwy 129Red Roof Inn 15701 Park Ten Place 123Holiday Inn Energy Corridor 1112 Eldridge Pkwy 122Staybridge Suites 1225 Eldridge Pkwy 122Value Place I 10 West 121 Baker Rd 121Residence Inn Marriott 1550 Barker Cypress 120Drury Inn West Houston 1000 Hwy. 6 @ Katy Freeway 119La Quinta Inn & Suites Park 10 15225 Katy Freeway 117Hyatt Summerfield Suites 15405 Katy Freeway 116Holiday Inn Express West Energy 12323 Katy Freeway 115Spring Hill Suites 1350 Broadfield 110TownePlace Suites West 15155 Katy Freeway 94Fairfield Inn Katy Freeway 15111 Katy Freeway 80Homewood Suites Park 10 Lodging 14450 Park Row 74Quality Inn 715 Hwy. 6 @Memorial 63America's Best Value Inn and Suites 15101 Katy Freeway 47
Total Rooms 3,753
Source: Texas Hotel Performance Factbook, 2015 Annual, Source Strategies, San Antonio, TX
Hotels and Motels in the Energy Corridor have increased their revenue 49.3% since 2010, topping $91million in 2015. Average daily room rates are up $18 since 2010, to $108.60 in 2015. Averageoccupancy has risen from 55.6% to 65.8% during this time.
Table 17 – Under Construction Hotels and MotelsHotel/Motel Address Keys
Hampton Inn & Suites Park Row at Barker Cypress 135Four Points by Sheraton Baker Road at I 10 134
Total Rooms 269
The Energy Corridor 2016 Inventory and Database
28
Institutional
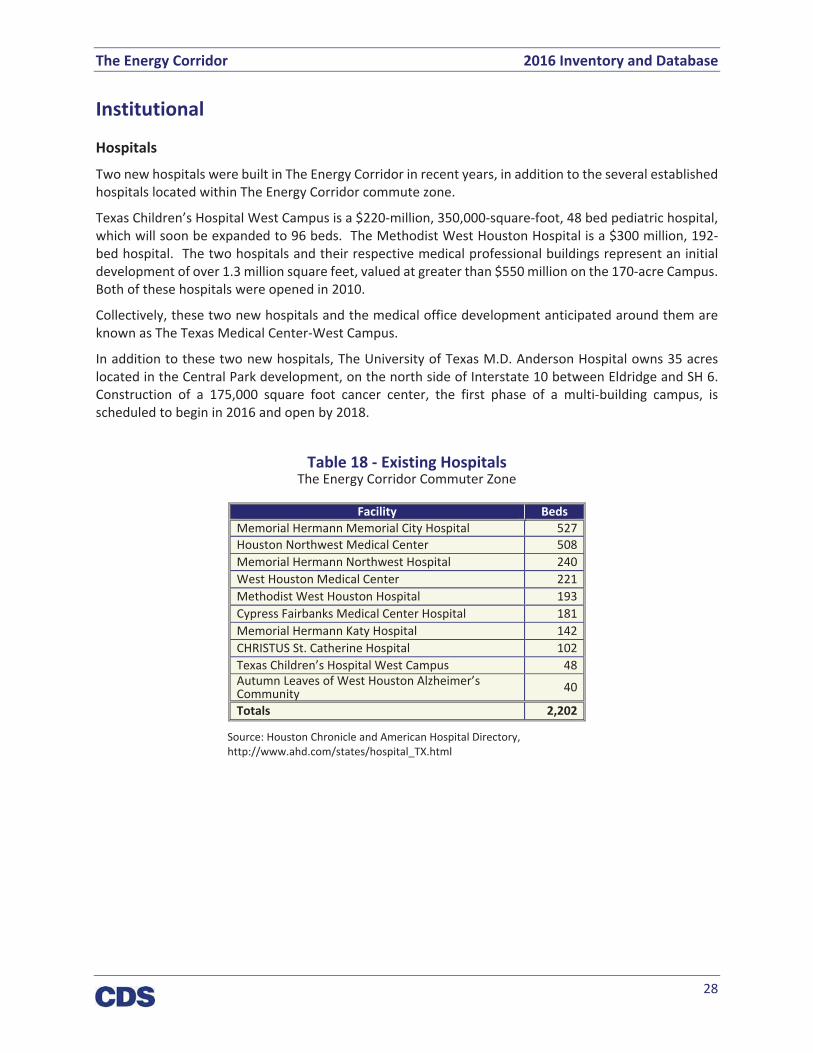
Hospitals
Two new hospitals were built in The Energy Corridor in recent years, in addition to the several establishedhospitals located within The Energy Corridor commute zone.
Texas Children’s Hospital West Campus is a $220 million, 350,000 square foot, 48 bed pediatric hospital,which will soon be expanded to 96 beds. The Methodist West Houston Hospital is a $300 million, 192bed hospital. The two hospitals and their respective medical professional buildings represent an initialdevelopment of over 1.3 million square feet, valued at greater than $550million on the 170 acre Campus.Both of these hospitals were opened in 2010.
Collectively, these two new hospitals and the medical office development anticipated around them areknown as The Texas Medical Center West Campus.
In addition to these two new hospitals, The University of Texas M.D. Anderson Hospital owns 35 acreslocated in the Central Park development, on the north side of Interstate 10 between Eldridge and SH 6.Construction of a 175,000 square foot cancer center, the first phase of a multi building campus, isscheduled to begin in 2016 and open by 2018.
Table 18 Existing HospitalsThe Energy Corridor Commuter Zone
Facility BedsMemorial Hermann Memorial City Hospital 527Houston Northwest Medical Center 508Memorial Hermann Northwest Hospital 240West Houston Medical Center 221Methodist West Houston Hospital 193Cypress Fairbanks Medical Center Hospital 181Memorial Hermann Katy Hospital 142CHRISTUS St. Catherine Hospital 102Texas Children’s Hospital West Campus 48Autumn Leaves of West Houston Alzheimer’sCommunity 40
Totals 2,202
Source: Houston Chronicle and American Hospital Directory,http://www.ahd.com/states/hospital_TX.html

The Energy Corridor 2016 Inventory and Database
29
Educational Institutions
In addition to the universities listed below, the University of Houston has plans to construct anew campus just west of the Energy Corridor, in the Katy area, in the coming years.
Table 19 Universities and CollegesThe Energy Corridor Commuter Zone
SchoolFall 2015EnrollmentEstimate
Houston Community College Northwest 33,900Lone Star College – Cy Fair 20,500University of Phoenix – Houston Westside 2,700DeVry University – Westway Park 2,200University of Houston – Cinco Ranch 2,000Strayer University 190Belhaven University 180
Source: CDS Market Research
Table 20 Area Independent SchoolDistricts
School DistrictFall 2014Enrollment
2014 TEARating
Alief 46,207 Met StandardCypress Fairbanks 111,173 Met StandardFort Bend 70,512 Met StandardHouston 210,716 Met StandardKaty 67,015 Met StandardSpring Branch 35,218 Met StandardSource: Texas Education Agency (TEA)Note: TEA changed their accountability rating system for
2013

The Energy Corridor 2016 Inventory and Database
30
Comparison to Other Employment CentersThe Houston MSA has developed in a low density suburban form, uninhibited by naturalgeographic boundaries or excessive political regulation. Other loosely defined ‘edge cities’comprise a large portion of the region’s employment base. These typically aremade up of a loosecluster of office, medical office, hotel, and supportive retail land uses.
This report includes a comparison of the following major Houston Area Business ActivityCenters:
Downtown / Central Business District (CBD)Energy CorridorGreenway PlazaMemorial City (including City Centre)Spring WoodsThe WoodlandsUptown/GalleriaWestchase
Exhibit 18 – Houston Area Major Office Employment Centers

The Energy Corridor 2016 Inventory and Database
31
Office Development in the Activity CentersFor a fair comparison to be made, a single source of office development data was used whencomparing these employment centers. Because of this, the numbers for the Energy Corridorwill differ slightly from those given earlier in the report.
Downtown/CDB includes the largest amount of office space in the Houston region, with49,626,212 square feet. The Energy Corridor ranks second in total office square footage with24,002,496 square feet. It includes a few more buildings than Downtown but hasapproximately half the total office space.
The Downtown and Westchase areas are reporting the largest amount of office space currentlyunder construction, each at 1.5 million.
Table 21 – Employment Centers and Office Development
Employment Center SF Buildings UnderConstruction
Downtown 49,626,212 164 1,578,258The Energy Corridor 24,002,496 169 952,893Uptown 21,492,321 101 1,285,000Westchase 17,296,465 133 1,545,000Woodlands 12,778,708 226 50,083Greenway Plaza 9,076,920 111 210,000Memorial City 6,852,859 45 226,511Spring Woods Village 3,668,692 7 0
Source: CoStar, CDS Market Research

The Energy Corridor 2016 Inventory and Database
32
The Energy Corridor Area OccupationsIn this analysis, CDS Market Research used the demographic data from Neilsen/Claritas to compare thepopulation demographics of two areas, The Houston Central Business District and The Energy Corridor.The Neilsen/Claritas database provides estimates of area demographics based on the 2010 Census andthe American Community Survey with adjustments to account for changes over time. CDS has purchasedthe data and uses the analysis tool PCensus, to determine the demographics of any area selected on amap.
Comparison of 30 minute Drive TimeThe blue line on the map at the right illustrates the area within which the morning commute would takeapproximately 30 minutes to The Energy Corridor.
The 30 minute drive times coming out of our demographic analysis program are rough approximations,not based on detailed peak period directional speeds. This works reasonably well for non peak periodsof travel. The only adjustment that can be made to approximate peak period travel is to provide lowerpeak period speeds by roadway type (Freeway, Highway, Arterial, Local). Therefore, this analysis cannotallow for faster speeds in the reverse commute direction than in the peak travel direction. A more correctanalysis should show an expanded commute profile on the eastern side of the contour. The tables on thefollowing pages illustrate the results of the 30 minute drive time demographic analysis.
Exhibit 19 30 Minute Drive Time Map

The Energy Corridor 2016 Inventory and Database
33
In summary, The Energy Corridor 30 minute commute zone contains, as of 2016:
Over 2.5 million people
More than 910,000 households
Over 1.25 million employed persons
37.5% of the Houston MSA population
39.3% of Houston MSA households
39.7% of Houston MSA employed persons
43.0% of the “business and technical professionals” * in the Houston MSA.
* “Business and Technical Professional” occupational categories include: Management; Business and Financial Operations;Computer and Mathematical; Architecture and Engineering; Life, Physical, and Social Science; Office and AdministrativeSupport; and Sales and Related

The Energy Corridor 2016 Inventory and Database
34
Table 22 The Energy Corridor Occupations30 minute drive time
Employment Facts: Energy Corridor – 30minute drive time Houston MSA
Count Share Count SharePopulation2021 Projection 2,714,682 7,243,8512016 Estimate 2,500,845 6,677,3402010 Census 2,207,018 5,920,4162000 Census 1,754,588 4,693,140
Growth 2016 2021 8.55% 8.48%Growth 2010 2016 13.31% 12.78%Growth 2000 2010 25.79% 26.15%
Households2021 Projection 988,759 2,518,8972016 Estimate 911,086 2,320,8062010 Census 808,229 2,062,5292000 Census 652,702 1,648,146
Growth 2016 2021 8.53% 8.54%Growth 2010 2016 12.73% 12.52%Growth 2000 2010 23.83% 25.14%
2016 Est. Civ. Employed Pop 16+ byOccupation 1,258,574 3,168,192
Architect/Engineer 48,096 3.8% 96,780 3.1%Arts/Entertainment/Sports 26,144 2.1% 49,952 1.6%Building Grounds Maintenance 54,171 4.3% 137,939 4.4%Business/Financial Operations 87,018 6.9% 170,961 5.4%Community/Social Services 12,292 1.0% 34,871 1.1%Computer/Mathematical 38,820 3.1% 76,864 2.4%Construction/Extraction 71,048 5.7% 224,760 7.1%Education/Training/Library 72,090 5.7% 182,831 5.8%Farming/Fishing/Forestry 1,737 0.1% 6,204 0.2%Food Prep/Serving 66,972 5.3% 167,531 5.3%Healthcare Practitioner/Technician 62,949 5.0% 161,820 5.1%Healthcare Support 23,069 1.8% 63,646 2.0%Maintenance Repair 38,287 3.0% 115,686 3.7%Legal 25,731 2.0% 41,283 1.3%Life/Physical/Social Science 16,770 1.3% 34,129 1.1%Management 138,719 11.0% 312,625 9.9%Office/Admin. Support 147,116 11.7% 397,075 12.5%Production 64,878 5.2% 199,461 6.3%Protective Service 19,923 1.6% 63,957 2.0%Sales/Related 144,400 11.5% 345,604 10.9%Personal Care/Service 37,733 3.0% 91,160 2.9%Transportation/Moving 60,614 4.8% 193,053 6.1%
Source: PCensus for MapInfo, Tetrad Computer Applications, a reseller of Nielson/Claritas demographics

The Energy Corridor 2016 Inventory and Database
35
Overall Location of Business and Technical ProfessionalsBecause the residential location of business and technical professionals is critical to the businesses in TheEnergy Corridor, it is important to understand where they live. Business and technical professionals fallinto the following employment categories: Management; Business and Financial Operations; Computerand Mathematical; Architecture and Engineering; Life, Physical, and Social Science; Office andAdministrative Support; and Sales and Related. The table shows the 30 minute drive time’s share of theregion’s employed residents in these categories and maps on the following pages illustrate the residentialdensity of these professionals in the Houston area. Each dot on the map represents one professionalliving within each Census block group. These maps tend to illustrate a strong westside preference forsuburban neighborhoods.
Table 23 The Energy Corridor Business and Technical Professionals
Employment Facts: Energy Corridor – 30minute drive time Houston MSA
Count Share Count Share2016 Est. Civ. Employed Pop 16+ byOccupation 1,258,574 39.7% 3,168,192 100.0%
All Business and Technical Professionals 482,220 43.0% 1,121,413 100.0%
Architect/Engineer 48,096 49.7% 96,780 100.0%
Business/Financial Operations 87,018 50.9% 170,961 100.0%
Computer/Mathematical 38,820 50.5% 76,864 100.0%
Life/Physical/Social Science 16,770 49.1% 34,129 100.0%
Office/Admin. Support 147,116 37.0% 397,075 100.0%
Sales/Related 144,400 41.8% 345,604 100.0%
Source: PCensus for MapInfo, Tetrad Computer Applications, a reseller of Nielson/Claritas demographics
The Energy Corridor 30 minute drive time area contains a larger share of the of the regionaltotals of all business and technical professionals (43.0%) than it does its share of the regionaltotal of all employed residents, indicating the presence of a well educated and above averageearning population in the area. In five of the six business and technical professional categories,the 30 minute drive time area had a higher share of the regional total than it did its share of theregional total of all employed residents.

The Energy Corridor 2016 Inventory and Database
36
Exhibit 20 Map of Residential Location of Architects and Engineers 2016
Source: PCensus for MapInfo, Tetrad Computer Applications, a reseller of Nielsen/Claritas demographics

The Energy Corridor 2016 Inventory and Database
37
Exhibit 21 Map of Residential Location of Business and Financial Professionals 2016
Source: PCensus for MapInfo, Tetrad Computer Applications, a reseller of Nielsen/Claritas demographics

The Energy Corridor 2016 Inventory and Database
38
Exhibit 22 Map of Residential Location of Computer and Mathematical Professionals 2016
Source: PCensus for MapInfo, Tetrad Computer Applications, a reseller of Nielsen/Claritas demographics

The Energy Corridor 2016 Inventory and Database
39
Exhibit 23 Map of Residential Location of Life Science Professionals 2016
Source: PCensus for MapInfo, Tetrad Computer Applications, a reseller of Nielsen/Claritas demographics

The Energy Corridor 2016 Inventory and Database
40
Exhibit 24 Map of Residential Location of Office and Administrative Support Staff 2016
Source: PCensus for MapInfo, Tetrad Computer Applications, a reseller of Nielsen/Claritas demographics

The Energy Corridor 2016 Inventory and Database
41
Exhibit 25 Map of Residential Location of Sales and Related Professionals 2016
Source: PCensus for MapInfo, Tetrad Computer Applications, a reseller of Nielsen/Claritas demographics

The Energy Corridor 2016 Inventory and Database
42
Detailed Demographic Information
Exhibit 26 The Energy Corridor District Boundaries

The Energy Corridor 2016 Inventory and Database
43
Exhibit 27 The Energy Corridor Area Map

The Energy Corridor 2016 Inventory and Database
44
Exhibit 28 The Energy Corridor Demographic Area

The Energy Corridor 2016 Inventory and Database
45
Exhibit 29 The Energy Corridor Commuting Region
Including ZIP Codes 77024, 77040, 77041, 77042, 77043, 77057, 77063, 77064, 77065, 77069, 77070, 77077,77079, 77082, 77083, 77084, 77094, 77095, 77379, 77406, 77407, 77429, 77433, 77449, 77450, 77459, 77469,77478, 77479, 77489, 77493, 77494, and 77498

The Energy Corridor 2016 Inventory and Database
46
Exhibit 30 Houston Baytown Sugar Land Metropolitan Statistical Area (MSA)
Including Austin, Brazoria, Chambers, Fort Bend, Galveston, Harris, Liberty, Montgomery, and Waller Counties
The Energy Corridor 2016 Inventory and Database
47
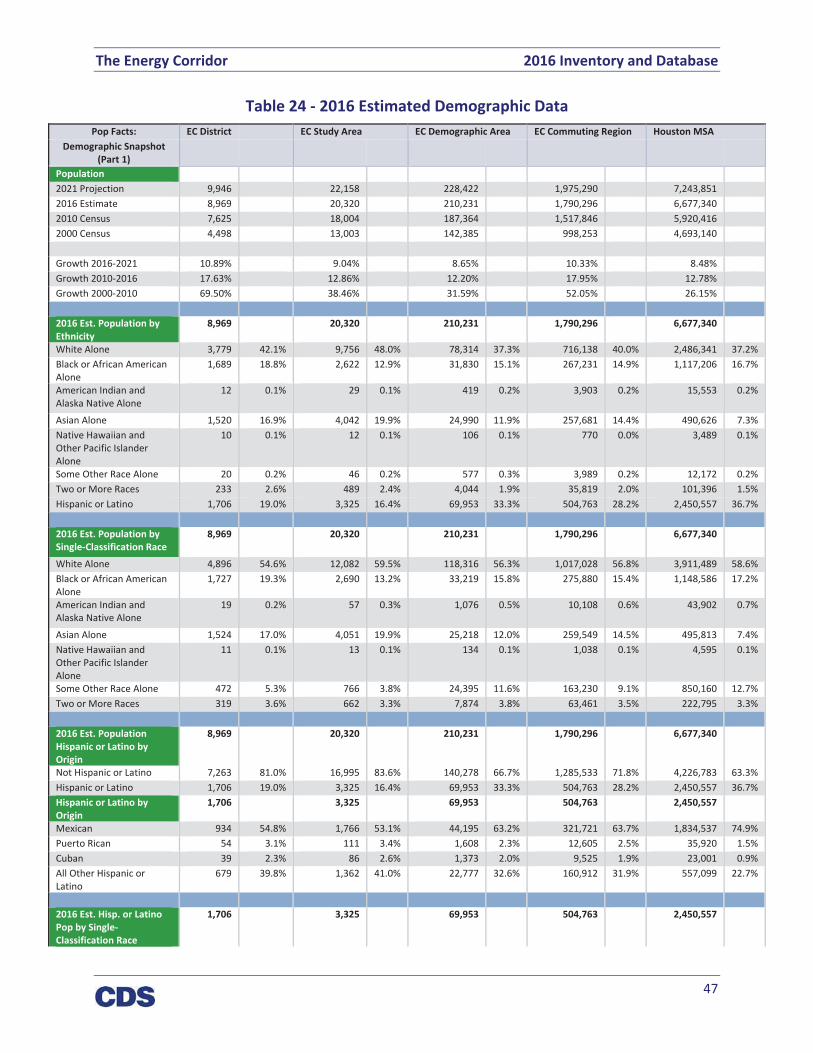
Table 24 2016 Estimated Demographic DataPop Facts: EC District EC Study Area EC Demographic Area EC Commuting Region Houston MSA
Demographic Snapshot(Part 1)
Population2021 Projection 9,946 22,158 228,422 1,975,290 7,243,8512016 Estimate 8,969 20,320 210,231 1,790,296 6,677,3402010 Census 7,625 18,004 187,364 1,517,846 5,920,4162000 Census 4,498 13,003 142,385 998,253 4,693,140
Growth 2016 2021 10.89% 9.04% 8.65% 10.33% 8.48%Growth 2010 2016 17.63% 12.86% 12.20% 17.95% 12.78%Growth 2000 2010 69.50% 38.46% 31.59% 52.05% 26.15%
2016 Est. Population byEthnicity
8,969 20,320 210,231 1,790,296 6,677,340
White Alone 3,779 42.1% 9,756 48.0% 78,314 37.3% 716,138 40.0% 2,486,341 37.2%Black or African AmericanAlone
1,689 18.8% 2,622 12.9% 31,830 15.1% 267,231 14.9% 1,117,206 16.7%
American Indian andAlaska Native Alone
12 0.1% 29 0.1% 419 0.2% 3,903 0.2% 15,553 0.2%
Asian Alone 1,520 16.9% 4,042 19.9% 24,990 11.9% 257,681 14.4% 490,626 7.3%Native Hawaiian andOther Pacific IslanderAlone
10 0.1% 12 0.1% 106 0.1% 770 0.0% 3,489 0.1%
Some Other Race Alone 20 0.2% 46 0.2% 577 0.3% 3,989 0.2% 12,172 0.2%Two or More Races 233 2.6% 489 2.4% 4,044 1.9% 35,819 2.0% 101,396 1.5%Hispanic or Latino 1,706 19.0% 3,325 16.4% 69,953 33.3% 504,763 28.2% 2,450,557 36.7%
2016 Est. Population bySingle Classification Race
8,969 20,320 210,231 1,790,296 6,677,340
White Alone 4,896 54.6% 12,082 59.5% 118,316 56.3% 1,017,028 56.8% 3,911,489 58.6%Black or African AmericanAlone
1,727 19.3% 2,690 13.2% 33,219 15.8% 275,880 15.4% 1,148,586 17.2%
American Indian andAlaska Native Alone
19 0.2% 57 0.3% 1,076 0.5% 10,108 0.6% 43,902 0.7%
Asian Alone 1,524 17.0% 4,051 19.9% 25,218 12.0% 259,549 14.5% 495,813 7.4%Native Hawaiian andOther Pacific IslanderAlone
11 0.1% 13 0.1% 134 0.1% 1,038 0.1% 4,595 0.1%
Some Other Race Alone 472 5.3% 766 3.8% 24,395 11.6% 163,230 9.1% 850,160 12.7%Two or More Races 319 3.6% 662 3.3% 7,874 3.8% 63,461 3.5% 222,795 3.3%
2016 Est. PopulationHispanic or Latino byOrigin
8,969 20,320 210,231 1,790,296 6,677,340
Not Hispanic or Latino 7,263 81.0% 16,995 83.6% 140,278 66.7% 1,285,533 71.8% 4,226,783 63.3%Hispanic or Latino 1,706 19.0% 3,325 16.4% 69,953 33.3% 504,763 28.2% 2,450,557 36.7%Hispanic or Latino byOrigin
1,706 3,325 69,953 504,763 2,450,557
Mexican 934 54.8% 1,766 53.1% 44,195 63.2% 321,721 63.7% 1,834,537 74.9%Puerto Rican 54 3.1% 111 3.4% 1,608 2.3% 12,605 2.5% 35,920 1.5%Cuban 39 2.3% 86 2.6% 1,373 2.0% 9,525 1.9% 23,001 0.9%All Other Hispanic orLatino
679 39.8% 1,362 41.0% 22,777 32.6% 160,912 31.9% 557,099 22.7%
2016 Est. Hisp. or LatinoPop by SingleClassification Race
1,706 3,325 69,953 504,763 2,450,557
The Energy Corridor 2016 Inventory and Database
48
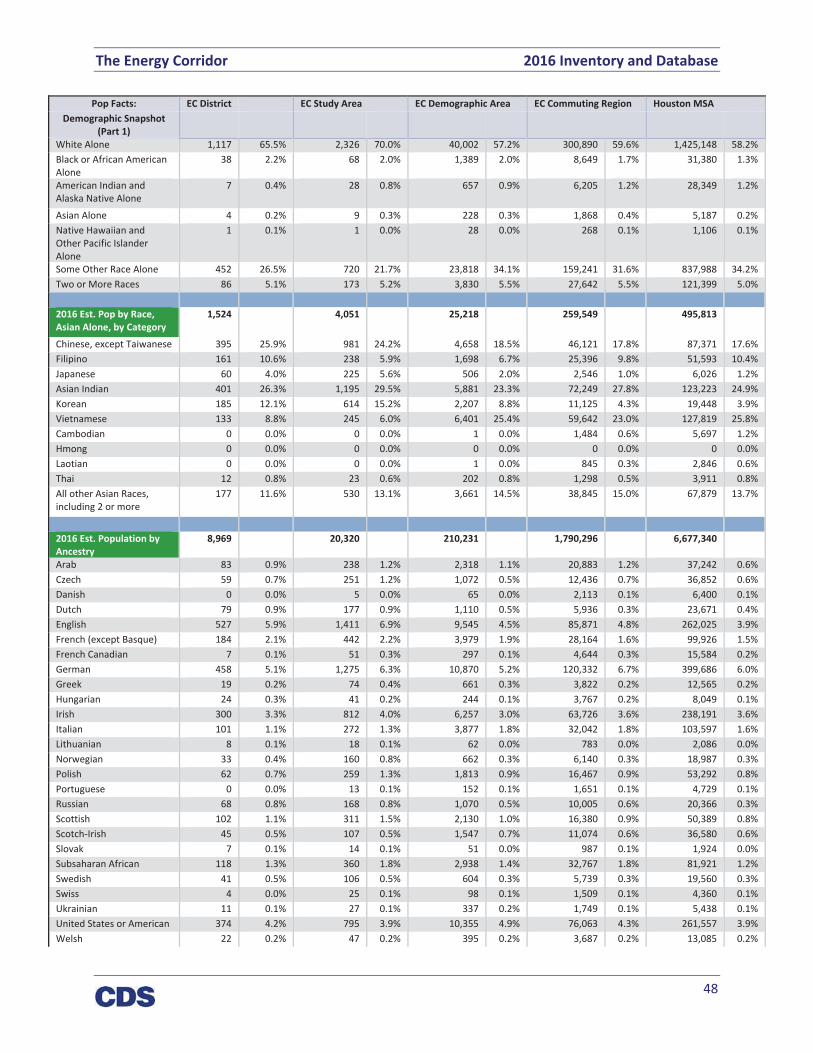
Pop Facts: EC District EC Study Area EC Demographic Area EC Commuting Region Houston MSADemographic Snapshot
(Part 1)White Alone 1,117 65.5% 2,326 70.0% 40,002 57.2% 300,890 59.6% 1,425,148 58.2%Black or African AmericanAlone
38 2.2% 68 2.0% 1,389 2.0% 8,649 1.7% 31,380 1.3%
American Indian andAlaska Native Alone
7 0.4% 28 0.8% 657 0.9% 6,205 1.2% 28,349 1.2%
Asian Alone 4 0.2% 9 0.3% 228 0.3% 1,868 0.4% 5,187 0.2%Native Hawaiian andOther Pacific IslanderAlone
1 0.1% 1 0.0% 28 0.0% 268 0.1% 1,106 0.1%
Some Other Race Alone 452 26.5% 720 21.7% 23,818 34.1% 159,241 31.6% 837,988 34.2%Two or More Races 86 5.1% 173 5.2% 3,830 5.5% 27,642 5.5% 121,399 5.0%
2016 Est. Pop by Race,Asian Alone, by Category
1,524 4,051 25,218 259,549 495,813
Chinese, except Taiwanese 395 25.9% 981 24.2% 4,658 18.5% 46,121 17.8% 87,371 17.6%Filipino 161 10.6% 238 5.9% 1,698 6.7% 25,396 9.8% 51,593 10.4%Japanese 60 4.0% 225 5.6% 506 2.0% 2,546 1.0% 6,026 1.2%Asian Indian 401 26.3% 1,195 29.5% 5,881 23.3% 72,249 27.8% 123,223 24.9%Korean 185 12.1% 614 15.2% 2,207 8.8% 11,125 4.3% 19,448 3.9%Vietnamese 133 8.8% 245 6.0% 6,401 25.4% 59,642 23.0% 127,819 25.8%Cambodian 0 0.0% 0 0.0% 1 0.0% 1,484 0.6% 5,697 1.2%Hmong 0 0.0% 0 0.0% 0 0.0% 0 0.0% 0 0.0%Laotian 0 0.0% 0 0.0% 1 0.0% 845 0.3% 2,846 0.6%Thai 12 0.8% 23 0.6% 202 0.8% 1,298 0.5% 3,911 0.8%All other Asian Races,including 2 or more
177 11.6% 530 13.1% 3,661 14.5% 38,845 15.0% 67,879 13.7%
2016 Est. Population byAncestry
8,969 20,320 210,231 1,790,296 6,677,340
Arab 83 0.9% 238 1.2% 2,318 1.1% 20,883 1.2% 37,242 0.6%Czech 59 0.7% 251 1.2% 1,072 0.5% 12,436 0.7% 36,852 0.6%Danish 0 0.0% 5 0.0% 65 0.0% 2,113 0.1% 6,400 0.1%Dutch 79 0.9% 177 0.9% 1,110 0.5% 5,936 0.3% 23,671 0.4%English 527 5.9% 1,411 6.9% 9,545 4.5% 85,871 4.8% 262,025 3.9%French (except Basque) 184 2.1% 442 2.2% 3,979 1.9% 28,164 1.6% 99,926 1.5%French Canadian 7 0.1% 51 0.3% 297 0.1% 4,644 0.3% 15,584 0.2%German 458 5.1% 1,275 6.3% 10,870 5.2% 120,332 6.7% 399,686 6.0%Greek 19 0.2% 74 0.4% 661 0.3% 3,822 0.2% 12,565 0.2%Hungarian 24 0.3% 41 0.2% 244 0.1% 3,767 0.2% 8,049 0.1%Irish 300 3.3% 812 4.0% 6,257 3.0% 63,726 3.6% 238,191 3.6%Italian 101 1.1% 272 1.3% 3,877 1.8% 32,042 1.8% 103,597 1.6%Lithuanian 8 0.1% 18 0.1% 62 0.0% 783 0.0% 2,086 0.0%Norwegian 33 0.4% 160 0.8% 662 0.3% 6,140 0.3% 18,987 0.3%Polish 62 0.7% 259 1.3% 1,813 0.9% 16,467 0.9% 53,292 0.8%Portuguese 0 0.0% 13 0.1% 152 0.1% 1,651 0.1% 4,729 0.1%Russian 68 0.8% 168 0.8% 1,070 0.5% 10,005 0.6% 20,366 0.3%Scottish 102 1.1% 311 1.5% 2,130 1.0% 16,380 0.9% 50,389 0.8%Scotch Irish 45 0.5% 107 0.5% 1,547 0.7% 11,074 0.6% 36,580 0.6%Slovak 7 0.1% 14 0.1% 51 0.0% 987 0.1% 1,924 0.0%Subsaharan African 118 1.3% 360 1.8% 2,938 1.4% 32,767 1.8% 81,921 1.2%Swedish 41 0.5% 106 0.5% 604 0.3% 5,739 0.3% 19,560 0.3%Swiss 4 0.0% 25 0.1% 98 0.1% 1,509 0.1% 4,360 0.1%Ukrainian 11 0.1% 27 0.1% 337 0.2% 1,749 0.1% 5,438 0.1%United States or American 374 4.2% 795 3.9% 10,355 4.9% 76,063 4.3% 261,557 3.9%Welsh 22 0.2% 47 0.2% 395 0.2% 3,687 0.2% 13,085 0.2%
The Energy Corridor 2016 Inventory and Database
49
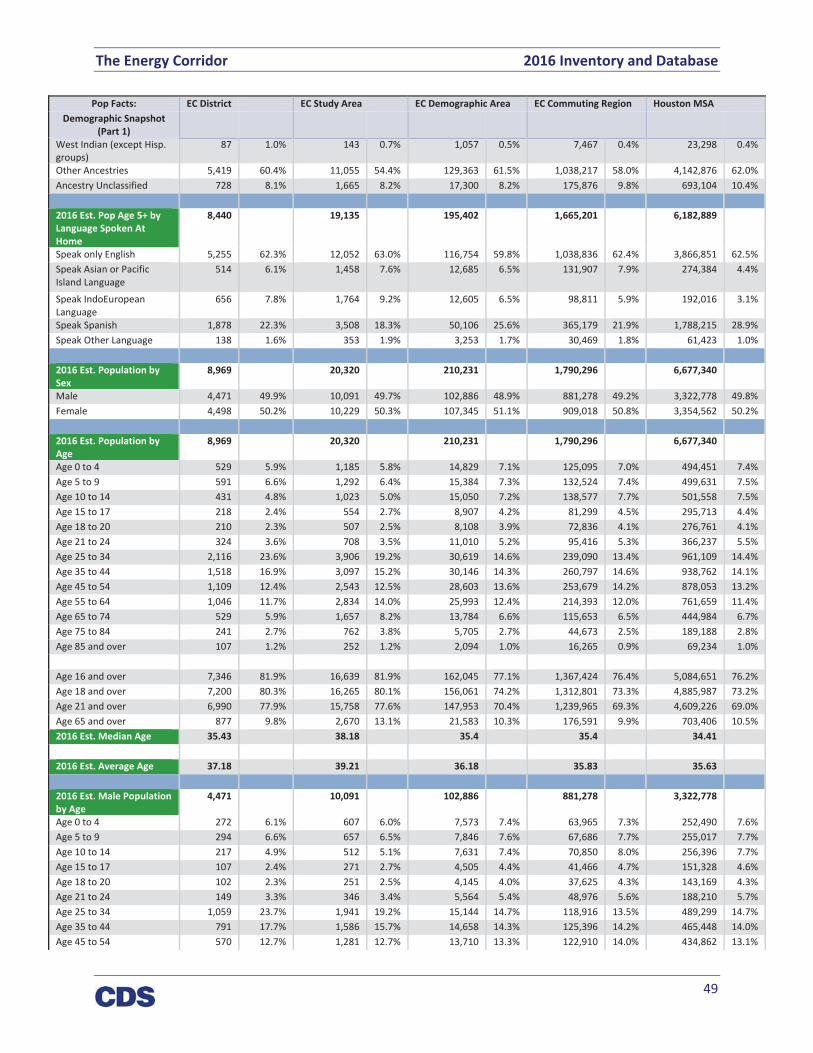
Pop Facts: EC District EC Study Area EC Demographic Area EC Commuting Region Houston MSADemographic Snapshot
(Part 1)West Indian (except Hisp.groups)
87 1.0% 143 0.7% 1,057 0.5% 7,467 0.4% 23,298 0.4%
Other Ancestries 5,419 60.4% 11,055 54.4% 129,363 61.5% 1,038,217 58.0% 4,142,876 62.0%Ancestry Unclassified 728 8.1% 1,665 8.2% 17,300 8.2% 175,876 9.8% 693,104 10.4%
2016 Est. Pop Age 5+ byLanguage Spoken AtHome
8,440 19,135 195,402 1,665,201 6,182,889
Speak only English 5,255 62.3% 12,052 63.0% 116,754 59.8% 1,038,836 62.4% 3,866,851 62.5%Speak Asian or PacificIsland Language
514 6.1% 1,458 7.6% 12,685 6.5% 131,907 7.9% 274,384 4.4%
Speak IndoEuropeanLanguage
656 7.8% 1,764 9.2% 12,605 6.5% 98,811 5.9% 192,016 3.1%
Speak Spanish 1,878 22.3% 3,508 18.3% 50,106 25.6% 365,179 21.9% 1,788,215 28.9%Speak Other Language 138 1.6% 353 1.9% 3,253 1.7% 30,469 1.8% 61,423 1.0%
2016 Est. Population bySex
8,969 20,320 210,231 1,790,296 6,677,340
Male 4,471 49.9% 10,091 49.7% 102,886 48.9% 881,278 49.2% 3,322,778 49.8%Female 4,498 50.2% 10,229 50.3% 107,345 51.1% 909,018 50.8% 3,354,562 50.2%
2016 Est. Population byAge
8,969 20,320 210,231 1,790,296 6,677,340
Age 0 to 4 529 5.9% 1,185 5.8% 14,829 7.1% 125,095 7.0% 494,451 7.4%Age 5 to 9 591 6.6% 1,292 6.4% 15,384 7.3% 132,524 7.4% 499,631 7.5%Age 10 to 14 431 4.8% 1,023 5.0% 15,050 7.2% 138,577 7.7% 501,558 7.5%Age 15 to 17 218 2.4% 554 2.7% 8,907 4.2% 81,299 4.5% 295,713 4.4%Age 18 to 20 210 2.3% 507 2.5% 8,108 3.9% 72,836 4.1% 276,761 4.1%Age 21 to 24 324 3.6% 708 3.5% 11,010 5.2% 95,416 5.3% 366,237 5.5%Age 25 to 34 2,116 23.6% 3,906 19.2% 30,619 14.6% 239,090 13.4% 961,109 14.4%Age 35 to 44 1,518 16.9% 3,097 15.2% 30,146 14.3% 260,797 14.6% 938,762 14.1%Age 45 to 54 1,109 12.4% 2,543 12.5% 28,603 13.6% 253,679 14.2% 878,053 13.2%Age 55 to 64 1,046 11.7% 2,834 14.0% 25,993 12.4% 214,393 12.0% 761,659 11.4%Age 65 to 74 529 5.9% 1,657 8.2% 13,784 6.6% 115,653 6.5% 444,984 6.7%Age 75 to 84 241 2.7% 762 3.8% 5,705 2.7% 44,673 2.5% 189,188 2.8%Age 85 and over 107 1.2% 252 1.2% 2,094 1.0% 16,265 0.9% 69,234 1.0%
Age 16 and over 7,346 81.9% 16,639 81.9% 162,045 77.1% 1,367,424 76.4% 5,084,651 76.2%Age 18 and over 7,200 80.3% 16,265 80.1% 156,061 74.2% 1,312,801 73.3% 4,885,987 73.2%Age 21 and over 6,990 77.9% 15,758 77.6% 147,953 70.4% 1,239,965 69.3% 4,609,226 69.0%Age 65 and over 877 9.8% 2,670 13.1% 21,583 10.3% 176,591 9.9% 703,406 10.5%2016 Est. Median Age 35.43 38.18 35.4 35.4 34.41
2016 Est. Average Age 37.18 39.21 36.18 35.83 35.63
2016 Est. Male Populationby Age
4,471 10,091 102,886 881,278 3,322,778
Age 0 to 4 272 6.1% 607 6.0% 7,573 7.4% 63,965 7.3% 252,490 7.6%Age 5 to 9 294 6.6% 657 6.5% 7,846 7.6% 67,686 7.7% 255,017 7.7%Age 10 to 14 217 4.9% 512 5.1% 7,631 7.4% 70,850 8.0% 256,396 7.7%Age 15 to 17 107 2.4% 271 2.7% 4,505 4.4% 41,466 4.7% 151,328 4.6%Age 18 to 20 102 2.3% 251 2.5% 4,145 4.0% 37,625 4.3% 143,169 4.3%Age 21 to 24 149 3.3% 346 3.4% 5,564 5.4% 48,976 5.6% 188,210 5.7%Age 25 to 34 1,059 23.7% 1,941 19.2% 15,144 14.7% 118,916 13.5% 489,299 14.7%Age 35 to 44 791 17.7% 1,586 15.7% 14,658 14.3% 125,396 14.2% 465,448 14.0%Age 45 to 54 570 12.7% 1,281 12.7% 13,710 13.3% 122,910 14.0% 434,862 13.1%
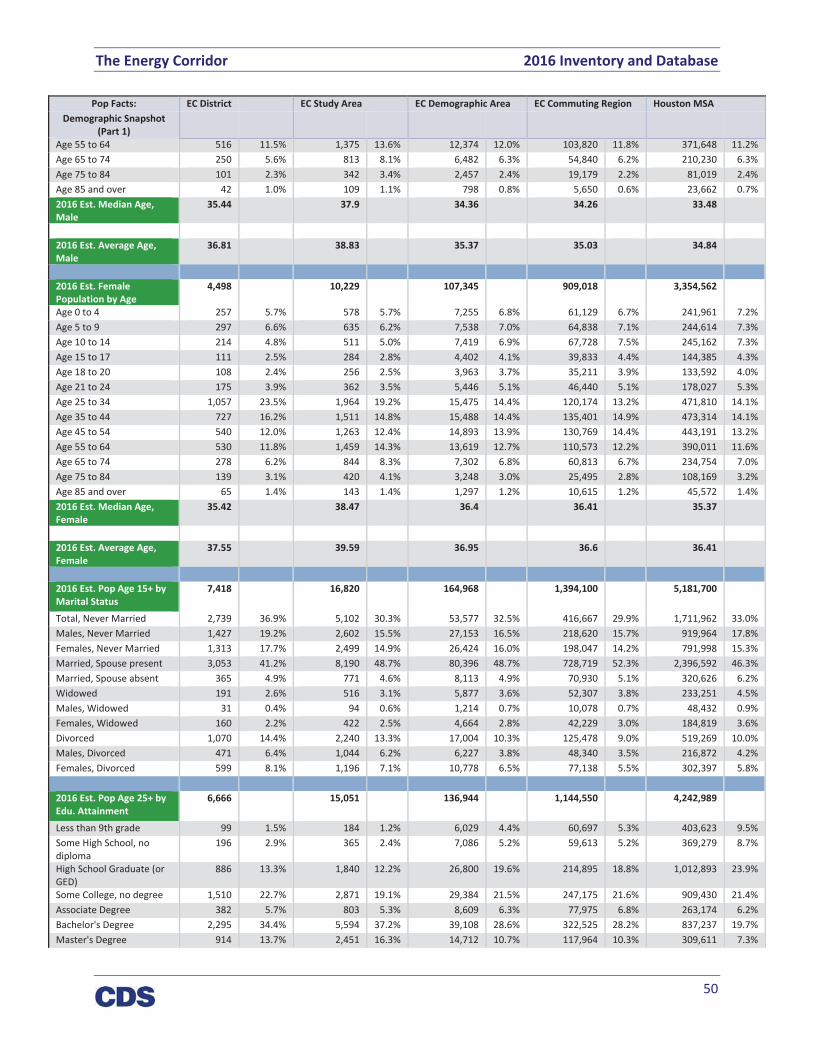
The Energy Corridor 2016 Inventory and Database
50
Pop Facts: EC District EC Study Area EC Demographic Area EC Commuting Region Houston MSADemographic Snapshot
(Part 1)Age 55 to 64 516 11.5% 1,375 13.6% 12,374 12.0% 103,820 11.8% 371,648 11.2%Age 65 to 74 250 5.6% 813 8.1% 6,482 6.3% 54,840 6.2% 210,230 6.3%Age 75 to 84 101 2.3% 342 3.4% 2,457 2.4% 19,179 2.2% 81,019 2.4%Age 85 and over 42 1.0% 109 1.1% 798 0.8% 5,650 0.6% 23,662 0.7%2016 Est. Median Age,Male
35.44 37.9 34.36 34.26 33.48
2016 Est. Average Age,Male
36.81 38.83 35.37 35.03 34.84
2016 Est. FemalePopulation by Age
4,498 10,229 107,345 909,018 3,354,562
Age 0 to 4 257 5.7% 578 5.7% 7,255 6.8% 61,129 6.7% 241,961 7.2%Age 5 to 9 297 6.6% 635 6.2% 7,538 7.0% 64,838 7.1% 244,614 7.3%Age 10 to 14 214 4.8% 511 5.0% 7,419 6.9% 67,728 7.5% 245,162 7.3%Age 15 to 17 111 2.5% 284 2.8% 4,402 4.1% 39,833 4.4% 144,385 4.3%Age 18 to 20 108 2.4% 256 2.5% 3,963 3.7% 35,211 3.9% 133,592 4.0%Age 21 to 24 175 3.9% 362 3.5% 5,446 5.1% 46,440 5.1% 178,027 5.3%Age 25 to 34 1,057 23.5% 1,964 19.2% 15,475 14.4% 120,174 13.2% 471,810 14.1%Age 35 to 44 727 16.2% 1,511 14.8% 15,488 14.4% 135,401 14.9% 473,314 14.1%Age 45 to 54 540 12.0% 1,263 12.4% 14,893 13.9% 130,769 14.4% 443,191 13.2%Age 55 to 64 530 11.8% 1,459 14.3% 13,619 12.7% 110,573 12.2% 390,011 11.6%Age 65 to 74 278 6.2% 844 8.3% 7,302 6.8% 60,813 6.7% 234,754 7.0%Age 75 to 84 139 3.1% 420 4.1% 3,248 3.0% 25,495 2.8% 108,169 3.2%Age 85 and over 65 1.4% 143 1.4% 1,297 1.2% 10,615 1.2% 45,572 1.4%2016 Est. Median Age,Female
35.42 38.47 36.4 36.41 35.37
2016 Est. Average Age,Female
37.55 39.59 36.95 36.6 36.41
2016 Est. Pop Age 15+ byMarital Status
7,418 16,820 164,968 1,394,100 5,181,700
Total, Never Married 2,739 36.9% 5,102 30.3% 53,577 32.5% 416,667 29.9% 1,711,962 33.0%Males, Never Married 1,427 19.2% 2,602 15.5% 27,153 16.5% 218,620 15.7% 919,964 17.8%Females, Never Married 1,313 17.7% 2,499 14.9% 26,424 16.0% 198,047 14.2% 791,998 15.3%Married, Spouse present 3,053 41.2% 8,190 48.7% 80,396 48.7% 728,719 52.3% 2,396,592 46.3%Married, Spouse absent 365 4.9% 771 4.6% 8,113 4.9% 70,930 5.1% 320,626 6.2%Widowed 191 2.6% 516 3.1% 5,877 3.6% 52,307 3.8% 233,251 4.5%Males, Widowed 31 0.4% 94 0.6% 1,214 0.7% 10,078 0.7% 48,432 0.9%Females, Widowed 160 2.2% 422 2.5% 4,664 2.8% 42,229 3.0% 184,819 3.6%Divorced 1,070 14.4% 2,240 13.3% 17,004 10.3% 125,478 9.0% 519,269 10.0%Males, Divorced 471 6.4% 1,044 6.2% 6,227 3.8% 48,340 3.5% 216,872 4.2%Females, Divorced 599 8.1% 1,196 7.1% 10,778 6.5% 77,138 5.5% 302,397 5.8%
2016 Est. Pop Age 25+ byEdu. Attainment
6,666 15,051 136,944 1,144,550 4,242,989
Less than 9th grade 99 1.5% 184 1.2% 6,029 4.4% 60,697 5.3% 403,623 9.5%Some High School, nodiploma
196 2.9% 365 2.4% 7,086 5.2% 59,613 5.2% 369,279 8.7%
High School Graduate (orGED)
886 13.3% 1,840 12.2% 26,800 19.6% 214,895 18.8% 1,012,893 23.9%
Some College, no degree 1,510 22.7% 2,871 19.1% 29,384 21.5% 247,175 21.6% 909,430 21.4%Associate Degree 382 5.7% 803 5.3% 8,609 6.3% 77,975 6.8% 263,174 6.2%Bachelor's Degree 2,295 34.4% 5,594 37.2% 39,108 28.6% 322,525 28.2% 837,237 19.7%Master's Degree 914 13.7% 2,451 16.3% 14,712 10.7% 117,964 10.3% 309,611 7.3%

The Energy Corridor 2016 Inventory and Database
51
Pop Facts: EC District EC Study Area EC Demographic Area EC Commuting Region Houston MSADemographic Snapshot
(Part 1)Professional SchoolDegree
197 3.0% 514 3.4% 2,885 2.1% 24,189 2.1% 82,517 1.9%
Doctorate Degree 187 2.8% 429 2.9% 2,331 1.7% 19,517 1.7% 55,225 1.3%
2016 Est. Pop. Age 25+ byEdu. Attain., Hisp./Lat.
1,105 2,127 38,804 279,281 1,335,638
No High School Diploma 226 20.5% 399 18.8% 9,732 25.1% 75,528 27.0% 547,372 41.0%High School Graduate 237 21.4% 415 19.5% 11,828 30.5% 72,883 26.1% 352,779 26.4%Some College orAssociate's Degree
298 26.9% 562 26.4% 8,729 22.5% 70,317 25.2% 271,057 20.3%
Bachelor's Degree orHigher
345 31.2% 751 35.3% 8,516 22.0% 60,553 21.7% 164,430 12.3%
Pop Facts: EC District EC Study Area EC Demographic Area EC Commuting Region Houston MSADemographic Snapshot
(Part 2)Households2021 Projection 5,008 10,508 84,704 683,013 2,518,8972016 Estimate 4,563 9,700 78,463 621,726 2,320,8062010 Census 3,999 8,748 71,110 535,149 2,062,5292000 Census 2,201 6,018 55,776 364,077 1,648,146
Growth 2016 2021 9.75% 8.33% 7.95% 9.86% 8.54%Growth 2010 2016 14.11% 10.88% 10.34% 16.18% 12.52%Growth 2000 2010 81.72% 45.37% 27.49% 46.99% 25.14%
2016 Est. Households byHousehold Type
4,563 9,700 78,463 621,726 2,320,806
Family Households 2,050 44.9% 5,164 53.2% 53,122 67.7% 456,709 73.5% 1,649,881 71.1%Nonfamily Households 2,513 55.1% 4,536 46.8% 25,341 32.3% 165,017 26.5% 670,925 28.9%
2016 Est. Group QuartersPopulation
11 15 121 7,216 80,012
2016 HHs by Ethnicity:Hispanic/Latino
722 15.8% 1,343 13.8% 20,042 25.5% 139,195 22.4% 659,537 28.4%
2016 Est. Households byHH Income
4,563 9,700 78,463 621,726 2,320,806
Income < $15,000 375 8.2% 742 7.7% 5,237 6.7% 38,601 6.2% 239,229 10.3%Income $15,000 to$24,999
287 6.3% 579 6.0% 5,850 7.5% 40,031 6.4% 223,811 9.6%
Income $25,000 to$34,999
369 8.1% 671 6.9% 6,984 8.9% 45,103 7.3% 213,320 9.2%
Income $35,000 to$49,999
507 11.1% 921 9.5% 9,667 12.3% 69,295 11.2% 298,439 12.9%
Income $50,000 to$74,999
929 20.4% 1,730 17.8% 13,725 17.5% 102,716 16.5% 387,693 16.7%
Income $75,000 to$99,999
630 13.8% 1,169 12.1% 10,306 13.1% 77,608 12.5% 271,376 11.7%
Income $100,000 to$124,999
419 9.2% 912 9.4% 7,050 9.0% 64,059 10.3% 202,091 8.7%
Income $125,000 to$149,999
339 7.4% 729 7.5% 4,900 6.2% 47,304 7.6% 136,531 5.9%
Income $150,000 to$199,999
292 6.4% 834 8.6% 6,050 7.7% 58,040 9.3% 154,484 6.7%

The Energy Corridor 2016 Inventory and Database
52
Pop Facts: EC District EC Study Area EC Demographic Area EC Commuting Region Houston MSADemographic Snapshot
(Part 1)Income $200,000 to$249,999
133 2.9% 432 4.5% 2,934 3.7% 27,480 4.4% 69,109 3.0%
Income $250,000 to$499,999
201 4.4% 666 6.9% 3,952 5.0% 34,751 5.6% 84,151 3.6%
Income $500,000+ 81 1.8% 314 3.2% 1,807 2.3% 16,739 2.7% 40,572 1.8%2016 Est. AverageHousehold Income
$95,830 $114,832 $101,334 $110,530 $88,764
2016 Est. MedianHousehold Income
$69,997 $79,411 $70,935 $79,870 $61,968
2016 Median HH Incomeby Single Class. Race orEthn.White Alone $73,499 $87,283 $80,947 $89,678 $70,271Black or African AmericanAlone
$54,772 $57,531 $49,224 $58,429 $44,283
American Indian andAlaska Native Alone
$43,992 $48,470 $53,136 $52,750 $47,738
Asian Alone $93,231 $95,993 $90,962 $97,566 $83,303Native Hawaiian andOther Pacific IslanderAlone
$111,186 $49,913 $41,295 $53,127 $43,786
Some Other Race Alone $42,276 $44,854 $48,582 $50,425 $44,192Two or More Races $64,240 $76,056 $68,774 $73,420 $59,542
Hispanic or Latino $62,508 $65,955 $55,257 $58,152 $45,754Not Hispanic or Latino $72,004 $82,990 $77,816 $89,086 $70,338
2016 Est. Family HH Typeby Presence of OwnChildren
2,050 5,164 53,122 456,709 1,649,881
Married Couple Family,own children
590 28.8% 1,544 29.9% 19,586 36.9% 189,805 41.6% 600,451 36.4%
Married Couple Family, noown children
866 42.2% 2,489 48.2% 19,704 37.1% 165,443 36.2% 591,594 35.9%
Male Householder, ownchildren
74 3.6% 128 2.5% 1,869 3.5% 13,842 3.0% 60,933 3.7%
Male Householder, noown children
81 3.9% 163 3.2% 1,867 3.5% 14,252 3.1% 68,424 4.2%
Female Householder, ownchildren
264 12.9% 484 9.4% 6,227 11.7% 44,374 9.7% 187,756 11.4%
Female Householder, noown children
176 8.6% 356 6.9% 3,870 7.3% 28,994 6.4% 140,723 8.5%
2016 Est. Households byHousehold Size
4,563 9,700 78,463 621,726 2,320,806
1 person 2,040 44.7% 3,777 38.9% 20,819 26.5% 136,068 21.9% 549,060 23.7%2 person 1,402 30.7% 3,234 33.3% 22,963 29.3% 174,881 28.1% 653,701 28.2%3 person 610 13.4% 1,360 14.0% 13,383 17.1% 111,980 18.0% 398,805 17.2%4 person 337 7.4% 869 9.0% 11,199 14.3% 103,825 16.7% 352,410 15.2%5 person 121 2.7% 315 3.2% 5,852 7.5% 55,532 8.9% 202,547 8.7%6 person 39 0.9% 100 1.0% 2,491 3.2% 23,887 3.8% 95,122 4.1%7 or more person 13 0.3% 45 0.5% 1,755 2.2% 15,554 2.5% 69,161 3.0%
2016 Est. AverageHousehold Size
1.96 2.09 2.68 2.87 2.84
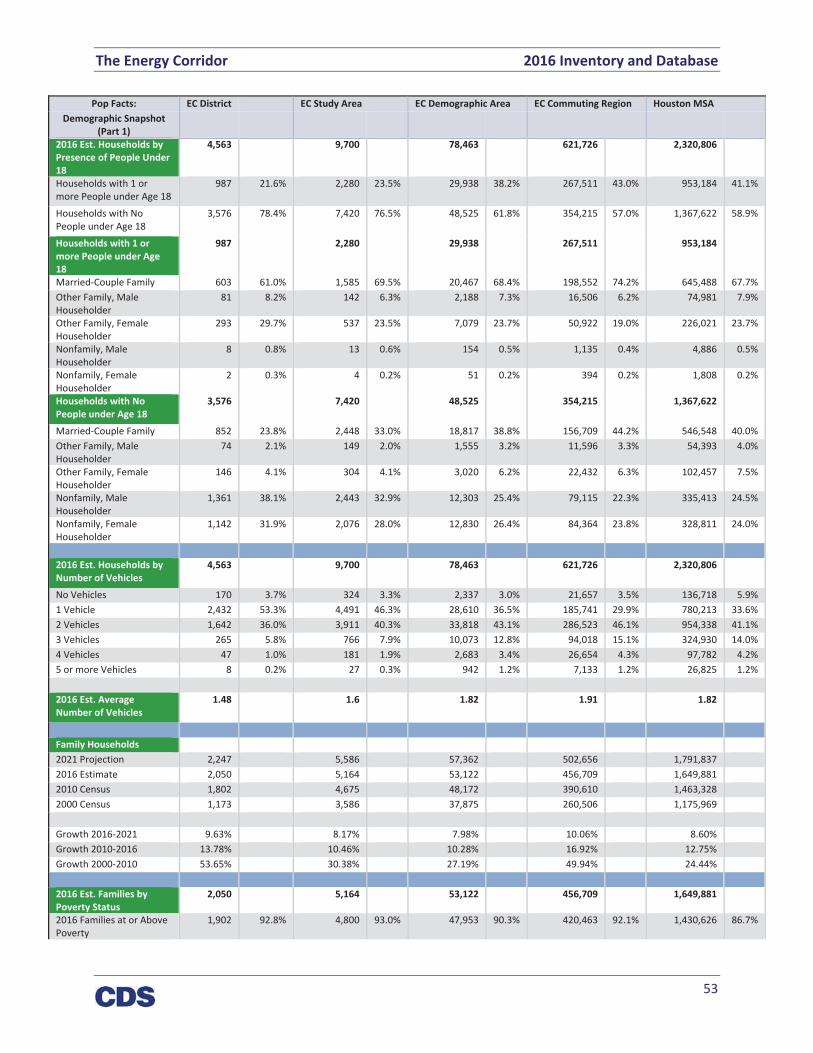
The Energy Corridor 2016 Inventory and Database
53
Pop Facts: EC District EC Study Area EC Demographic Area EC Commuting Region Houston MSADemographic Snapshot
(Part 1)2016 Est. Households byPresence of People Under18
4,563 9,700 78,463 621,726 2,320,806
Households with 1 ormore People under Age 18
987 21.6% 2,280 23.5% 29,938 38.2% 267,511 43.0% 953,184 41.1%
Households with NoPeople under Age 18
3,576 78.4% 7,420 76.5% 48,525 61.8% 354,215 57.0% 1,367,622 58.9%
Households with 1 ormore People under Age18
987 2,280 29,938 267,511 953,184
Married Couple Family 603 61.0% 1,585 69.5% 20,467 68.4% 198,552 74.2% 645,488 67.7%Other Family, MaleHouseholder
81 8.2% 142 6.3% 2,188 7.3% 16,506 6.2% 74,981 7.9%
Other Family, FemaleHouseholder
293 29.7% 537 23.5% 7,079 23.7% 50,922 19.0% 226,021 23.7%
Nonfamily, MaleHouseholder
8 0.8% 13 0.6% 154 0.5% 1,135 0.4% 4,886 0.5%
Nonfamily, FemaleHouseholder
2 0.3% 4 0.2% 51 0.2% 394 0.2% 1,808 0.2%
Households with NoPeople under Age 18
3,576 7,420 48,525 354,215 1,367,622
Married Couple Family 852 23.8% 2,448 33.0% 18,817 38.8% 156,709 44.2% 546,548 40.0%Other Family, MaleHouseholder
74 2.1% 149 2.0% 1,555 3.2% 11,596 3.3% 54,393 4.0%
Other Family, FemaleHouseholder
146 4.1% 304 4.1% 3,020 6.2% 22,432 6.3% 102,457 7.5%
Nonfamily, MaleHouseholder
1,361 38.1% 2,443 32.9% 12,303 25.4% 79,115 22.3% 335,413 24.5%
Nonfamily, FemaleHouseholder
1,142 31.9% 2,076 28.0% 12,830 26.4% 84,364 23.8% 328,811 24.0%
2016 Est. Households byNumber of Vehicles
4,563 9,700 78,463 621,726 2,320,806
No Vehicles 170 3.7% 324 3.3% 2,337 3.0% 21,657 3.5% 136,718 5.9%1 Vehicle 2,432 53.3% 4,491 46.3% 28,610 36.5% 185,741 29.9% 780,213 33.6%2 Vehicles 1,642 36.0% 3,911 40.3% 33,818 43.1% 286,523 46.1% 954,338 41.1%3 Vehicles 265 5.8% 766 7.9% 10,073 12.8% 94,018 15.1% 324,930 14.0%4 Vehicles 47 1.0% 181 1.9% 2,683 3.4% 26,654 4.3% 97,782 4.2%5 or more Vehicles 8 0.2% 27 0.3% 942 1.2% 7,133 1.2% 26,825 1.2%
2016 Est. AverageNumber of Vehicles
1.48 1.6 1.82 1.91 1.82
Family Households2021 Projection 2,247 5,586 57,362 502,656 1,791,8372016 Estimate 2,050 5,164 53,122 456,709 1,649,8812010 Census 1,802 4,675 48,172 390,610 1,463,3282000 Census 1,173 3,586 37,875 260,506 1,175,969
Growth 2016 2021 9.63% 8.17% 7.98% 10.06% 8.60%Growth 2010 2016 13.78% 10.46% 10.28% 16.92% 12.75%Growth 2000 2010 53.65% 30.38% 27.19% 49.94% 24.44%
2016 Est. Families byPoverty Status
2,050 5,164 53,122 456,709 1,649,881
2016 Families at or AbovePoverty
1,902 92.8% 4,800 93.0% 47,953 90.3% 420,463 92.1% 1,430,626 86.7%
The Energy Corridor 2016 Inventory and Database
54
Pop Facts: EC District EC Study Area EC Demographic Area EC Commuting Region Houston MSADemographic Snapshot
(Part 1)2016 Families at or AbovePoverty with Children
911 44.4% 1,964 38.0% 23,600 44.4% 225,965 49.5% 733,379 44.5%
2016 Families BelowPoverty
148 7.2% 364 7.1% 5,168 9.7% 36,247 7.9% 219,255 13.3%
2016 Families BelowPoverty with Children
125 6.1% 245 4.8% 3,925 7.4% 28,286 6.2% 177,290 10.8%
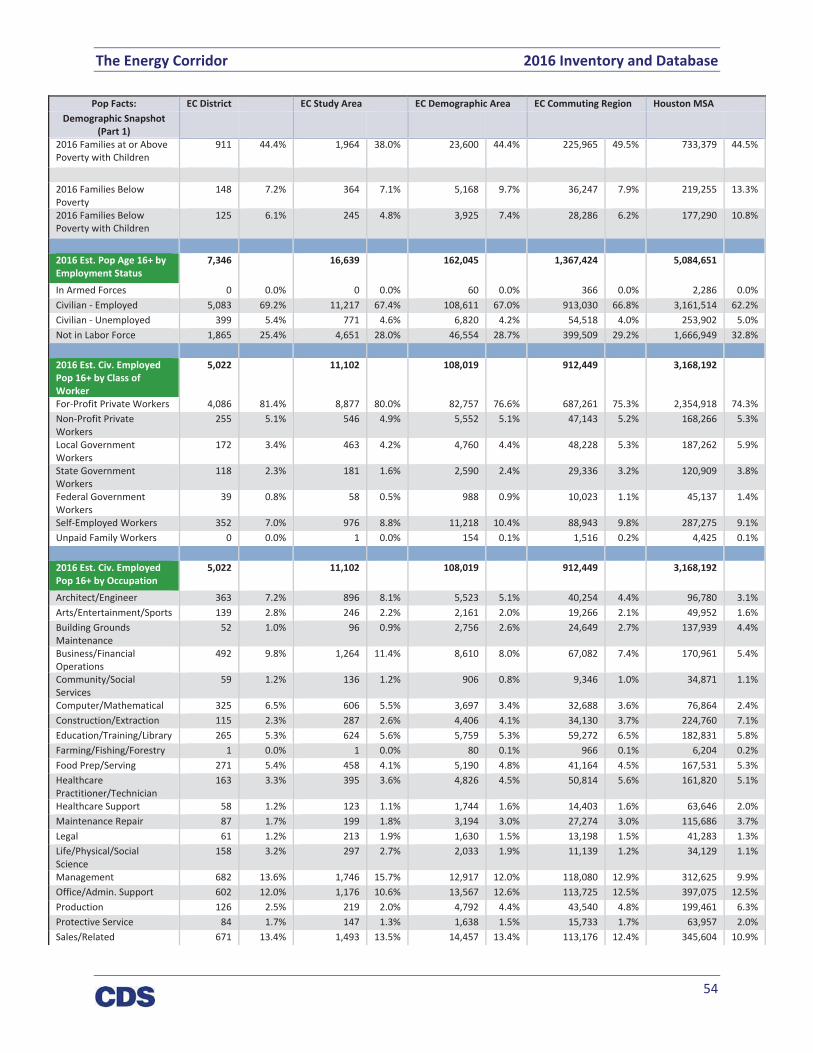
2016 Est. Pop Age 16+ byEmployment Status
7,346 16,639 162,045 1,367,424 5,084,651
In Armed Forces 0 0.0% 0 0.0% 60 0.0% 366 0.0% 2,286 0.0%Civilian Employed 5,083 69.2% 11,217 67.4% 108,611 67.0% 913,030 66.8% 3,161,514 62.2%Civilian Unemployed 399 5.4% 771 4.6% 6,820 4.2% 54,518 4.0% 253,902 5.0%Not in Labor Force 1,865 25.4% 4,651 28.0% 46,554 28.7% 399,509 29.2% 1,666,949 32.8%
2016 Est. Civ. EmployedPop 16+ by Class ofWorker
5,022 11,102 108,019 912,449 3,168,192
For Profit Private Workers 4,086 81.4% 8,877 80.0% 82,757 76.6% 687,261 75.3% 2,354,918 74.3%Non Profit PrivateWorkers
255 5.1% 546 4.9% 5,552 5.1% 47,143 5.2% 168,266 5.3%
Local GovernmentWorkers
172 3.4% 463 4.2% 4,760 4.4% 48,228 5.3% 187,262 5.9%
State GovernmentWorkers
118 2.3% 181 1.6% 2,590 2.4% 29,336 3.2% 120,909 3.8%
Federal GovernmentWorkers
39 0.8% 58 0.5% 988 0.9% 10,023 1.1% 45,137 1.4%
Self Employed Workers 352 7.0% 976 8.8% 11,218 10.4% 88,943 9.8% 287,275 9.1%Unpaid Family Workers 0 0.0% 1 0.0% 154 0.1% 1,516 0.2% 4,425 0.1%
2016 Est. Civ. EmployedPop 16+ by Occupation
5,022 11,102 108,019 912,449 3,168,192
Architect/Engineer 363 7.2% 896 8.1% 5,523 5.1% 40,254 4.4% 96,780 3.1%Arts/Entertainment/Sports 139 2.8% 246 2.2% 2,161 2.0% 19,266 2.1% 49,952 1.6%Building GroundsMaintenance
52 1.0% 96 0.9% 2,756 2.6% 24,649 2.7% 137,939 4.4%
Business/FinancialOperations
492 9.8% 1,264 11.4% 8,610 8.0% 67,082 7.4% 170,961 5.4%
Community/SocialServices
59 1.2% 136 1.2% 906 0.8% 9,346 1.0% 34,871 1.1%
Computer/Mathematical 325 6.5% 606 5.5% 3,697 3.4% 32,688 3.6% 76,864 2.4%Construction/Extraction 115 2.3% 287 2.6% 4,406 4.1% 34,130 3.7% 224,760 7.1%Education/Training/Library 265 5.3% 624 5.6% 5,759 5.3% 59,272 6.5% 182,831 5.8%Farming/Fishing/Forestry 1 0.0% 1 0.0% 80 0.1% 966 0.1% 6,204 0.2%Food Prep/Serving 271 5.4% 458 4.1% 5,190 4.8% 41,164 4.5% 167,531 5.3%HealthcarePractitioner/Technician
163 3.3% 395 3.6% 4,826 4.5% 50,814 5.6% 161,820 5.1%
Healthcare Support 58 1.2% 123 1.1% 1,744 1.6% 14,403 1.6% 63,646 2.0%Maintenance Repair 87 1.7% 199 1.8% 3,194 3.0% 27,274 3.0% 115,686 3.7%Legal 61 1.2% 213 1.9% 1,630 1.5% 13,198 1.5% 41,283 1.3%Life/Physical/SocialScience
158 3.2% 297 2.7% 2,033 1.9% 11,139 1.2% 34,129 1.1%
Management 682 13.6% 1,746 15.7% 12,917 12.0% 118,080 12.9% 312,625 9.9%Office/Admin. Support 602 12.0% 1,176 10.6% 13,567 12.6% 113,725 12.5% 397,075 12.5%Production 126 2.5% 219 2.0% 4,792 4.4% 43,540 4.8% 199,461 6.3%Protective Service 84 1.7% 147 1.3% 1,638 1.5% 15,733 1.7% 63,957 2.0%Sales/Related 671 13.4% 1,493 13.5% 14,457 13.4% 113,176 12.4% 345,604 10.9%

The Energy Corridor 2016 Inventory and Database
55
Pop Facts: EC District EC Study Area EC Demographic Area EC Commuting Region Houston MSADemographic Snapshot
(Part 1)Personal Care/Service 84 1.7% 207 1.9% 3,043 2.8% 24,102 2.6% 91,160 2.9%Transportation/Moving 162 3.2% 272 2.5% 5,088 4.7% 38,446 4.2% 193,053 6.1%
2016 Est. Pop 16+ byOccupation Classification
5,022 11,102 108,019 912,449 3,168,192
Blue Collar 491 9.8% 977 8.8% 17,480 16.2% 143,390 15.7% 732,960 23.1%White Collar 3,980 79.3% 9,092 81.9% 76,087 70.4% 648,040 71.0% 1,904,795 60.1%Service & Farm 551 11.0% 1,033 9.3% 14,452 13.4% 121,018 13.3% 530,437 16.7%
2016 Est. Workers Age16+ by Transp. To Work
4,970 10,995 106,700 899,542 3,114,431
Drove Alone 4,242 85.4% 9,405 85.5% 89,238 83.6% 734,141 81.6% 2,490,346 80.0%Car Pooled 361 7.3% 711 6.5% 8,373 7.9% 88,132 9.8% 337,275 10.8%Public Transportation 77 1.6% 236 2.2% 2,299 2.2% 18,335 2.0% 74,421 2.4%Walked 89 1.8% 199 1.8% 1,359 1.3% 8,543 1.0% 44,138 1.4%Bicycle 6 0.1% 18 0.2% 450 0.4% 1,742 0.2% 12,620 0.4%Other Means 33 0.7% 58 0.5% 678 0.6% 9,072 1.0% 45,135 1.5%Worked at Home 161 3.2% 367 3.3% 4,303 4.0% 39,576 4.4% 110,496 3.6%
2016 Est. Workers Age16+ by Travel Time toWork*Less than 15 minutes 1,327 2,868 17,885 141,596 586,16515 to 29 Minutes 1,819 3,797 34,595 273,197 1,031,44830 to 44 Minutes 1,141 2,549 29,428 240,818 754,86145 to 59 Minutes 365 874 11,435 113,531 324,57460 or more Minutes 196 568 8,956 91,364 307,6662016 Est. Avg. Travel Timeto Work in Minutes*
25.96 27.18 31.81 33.58 31.81
2016 Est. OccupiedHousing Units by Tenure
4,563 9,700 78,463 621,726 2,320,806
Owner Occupied 892 19.6% 3,301 34.0% 44,650 56.9% 420,471 67.6% 1,457,561 62.8%Renter Occupied 3,671 80.4% 6,399 66.0% 33,813 43.1% 201,255 32.4% 863,245 37.2%
2016 Occupied HousingUnits: Avg. Length ofResidenceOwner Occupied 15 15 14 12 14Renter Occupied 6 6 6 6 7
2016 Est. Owner OccupiedHousing Units by Value
892 3,301 44,650 420,471 1,457,561
Value Less than $20,000 2 0.2% 4 0.1% 356 0.8% 5,366 1.3% 38,786 2.7%Value $20,000 to $39,999 15 1.7% 26 0.8% 217 0.5% 3,031 0.7% 34,626 2.4%Value $40,000 to $59,999 10 1.1% 30 0.9% 206 0.5% 2,556 0.6% 43,109 3.0%Value $60,000 to $79,999 14 1.6% 31 1.0% 553 1.2% 6,198 1.5% 73,353 5.0%Value $80,000 to $99,999 83 9.3% 135 4.1% 2,574 5.8% 17,069 4.1% 116,522 8.0%Value $100,000 to$149,999
128 14.3% 265 8.0% 11,838 26.5% 83,637 19.9% 320,354 22.0%
Value $150,000 to$199,999
100 11.2% 286 8.7% 8,707 19.5% 89,755 21.4% 259,913 17.8%
Value $200,000 to$299,999
189 21.1% 601 18.2% 7,914 17.7% 96,324 22.9% 260,833 17.9%
Value $300,000 to$399,999
196 21.9% 773 23.4% 4,465 10.0% 47,228 11.2% 123,737 8.5%
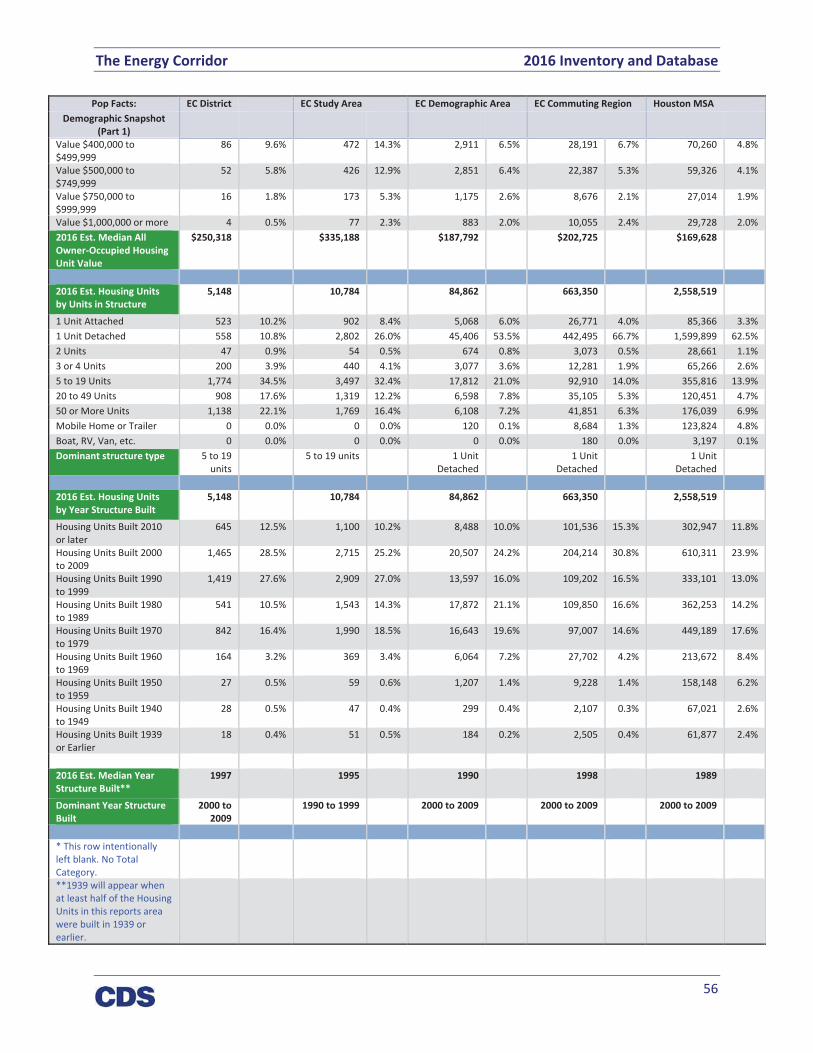
The Energy Corridor 2016 Inventory and Database
56
Pop Facts: EC District EC Study Area EC Demographic Area EC Commuting Region Houston MSADemographic Snapshot
(Part 1)Value $400,000 to$499,999
86 9.6% 472 14.3% 2,911 6.5% 28,191 6.7% 70,260 4.8%
Value $500,000 to$749,999
52 5.8% 426 12.9% 2,851 6.4% 22,387 5.3% 59,326 4.1%
Value $750,000 to$999,999
16 1.8% 173 5.3% 1,175 2.6% 8,676 2.1% 27,014 1.9%
Value $1,000,000 or more 4 0.5% 77 2.3% 883 2.0% 10,055 2.4% 29,728 2.0%2016 Est. Median AllOwner Occupied HousingUnit Value
$250,318 $335,188 $187,792 $202,725 $169,628
2016 Est. Housing Unitsby Units in Structure
5,148 10,784 84,862 663,350 2,558,519
1 Unit Attached 523 10.2% 902 8.4% 5,068 6.0% 26,771 4.0% 85,366 3.3%1 Unit Detached 558 10.8% 2,802 26.0% 45,406 53.5% 442,495 66.7% 1,599,899 62.5%2 Units 47 0.9% 54 0.5% 674 0.8% 3,073 0.5% 28,661 1.1%3 or 4 Units 200 3.9% 440 4.1% 3,077 3.6% 12,281 1.9% 65,266 2.6%5 to 19 Units 1,774 34.5% 3,497 32.4% 17,812 21.0% 92,910 14.0% 355,816 13.9%20 to 49 Units 908 17.6% 1,319 12.2% 6,598 7.8% 35,105 5.3% 120,451 4.7%50 or More Units 1,138 22.1% 1,769 16.4% 6,108 7.2% 41,851 6.3% 176,039 6.9%Mobile Home or Trailer 0 0.0% 0 0.0% 120 0.1% 8,684 1.3% 123,824 4.8%Boat, RV, Van, etc. 0 0.0% 0 0.0% 0 0.0% 180 0.0% 3,197 0.1%Dominant structure type 5 to 19
units5 to 19 units 1 Unit
Detached1 Unit
Detached1 Unit
Detached
2016 Est. Housing Unitsby Year Structure Built
5,148 10,784 84,862 663,350 2,558,519
Housing Units Built 2010or later
645 12.5% 1,100 10.2% 8,488 10.0% 101,536 15.3% 302,947 11.8%
Housing Units Built 2000to 2009
1,465 28.5% 2,715 25.2% 20,507 24.2% 204,214 30.8% 610,311 23.9%
Housing Units Built 1990to 1999
1,419 27.6% 2,909 27.0% 13,597 16.0% 109,202 16.5% 333,101 13.0%
Housing Units Built 1980to 1989
541 10.5% 1,543 14.3% 17,872 21.1% 109,850 16.6% 362,253 14.2%
Housing Units Built 1970to 1979
842 16.4% 1,990 18.5% 16,643 19.6% 97,007 14.6% 449,189 17.6%
Housing Units Built 1960to 1969
164 3.2% 369 3.4% 6,064 7.2% 27,702 4.2% 213,672 8.4%
Housing Units Built 1950to 1959
27 0.5% 59 0.6% 1,207 1.4% 9,228 1.4% 158,148 6.2%
Housing Units Built 1940to 1949
28 0.5% 47 0.4% 299 0.4% 2,107 0.3% 67,021 2.6%
Housing Units Built 1939or Earlier
18 0.4% 51 0.5% 184 0.2% 2,505 0.4% 61,877 2.4%
2016 Est. Median YearStructure Built**
1997 1995 1990 1998 1989
Dominant Year StructureBuilt
2000 to2009
1990 to 1999 2000 to 2009 2000 to 2009 2000 to 2009
* This row intentionallyleft blank. No TotalCategory.**1939 will appear whenat least half of the HousingUnits in this reports areawere built in 1939 orearlier.

The Energy Corridor 2016 Inventory and Database
57
Table 25 2010 Census DemographicsPop Facts: EC
DistrictEC Study Area EC Demographic
AreaEC CommutingRegion
Houston MSA
Census DemographicOverview (Part 1)
Population
2021 Projection 9,946 22,158 228,422 1,975,290 7,243,8512016 Estimate 8,969 20,320 210,231 1,790,296 6,677,3402010 Census 7,625 18,004 187,364 1,517,846 5,920,4162000 Census 4,498 13,003 142,385 998,253 4,693,140
Growth 2016 2021 10.89% 9.04% 8.65% 10.33% 8.48%Growth 2010 2016 17.63% 12.86% 12.20% 17.95% 12.78%Growth 2000 2010 69.50% 38.46% 31.59% 52.05% 26.15%
2016 Est. Population byEthnicity
7,625 18,004 187,364 1,517,846 5,920,416
White Alone 3,842 50.4% 9,935 55.2% 81,037 43.3% 668,578 44.0% 2,340,268 39.5%Black or African AmericanAlone
1,115 14.6% 1,822 10.1% 25,149 13.4% 211,480 13.9% 996,221 16.8%
American Indian and AlaskaNative Alone
12 0.2% 28 0.2% 393 0.2% 3,342 0.2% 13,824 0.2%
Asian Alone 1,059 13.9% 2,961 16.4% 19,202 10.2% 195,286 12.9% 384,476 6.5%Native Hawaiian and OtherPacific Islander Alone
9 0.1% 11 0.1% 102 0.1% 646 0.0% 2,907 0.0%
Some Other Race Alone 20 0.3% 43 0.2% 555 0.3% 3,657 0.2% 11,023 0.2%Two or More Races 170 2.2% 373 2.1% 3,281 1.8% 26,251 1.7% 75,165 1.3%Hispanic or Latino 1,398 18.3% 2,832 15.7% 57,646 30.8% 408,607 26.9% 2,096,532 35.4%
2010 Population by SingleClassification Race
7,625 18,004 187,364 1,517,846 5,920,416
White Alone 4,777 62.7% 11,946 66.4% 114,408 61.1% 913,335 60.2% 3,559,241 60.1%Black or African AmericanAlone
1,145 15.0% 1,878 10.4% 26,296 14.0% 218,474 14.4% 1,023,065 17.3%
American Indian and AlaskaNative Alone
18 0.2% 53 0.3% 977 0.5% 8,533 0.6% 38,072 0.6%
Asian Alone 1,062 13.9% 2,970 16.5% 19,404 10.4% 196,872 13.0% 388,884 6.6%Native Hawaiian and OtherPacific Islander Alone
10 0.1% 12 0.1% 126 0.1% 868 0.1% 3,851 0.1%
Some Other Race Alone 365 4.8% 622 3.5% 19,705 10.5% 130,925 8.6% 728,315 12.3%Two or More Races 247 3.2% 524 2.9% 6,448 3.4% 48,839 3.2% 178,988 3.0%
2010 Population ByEthnicity
7,625 18,004 187,364 1,517,846 5,920,416
Not Hispanic or Latino 6,227 81.7% 15,172 84.3% 129,718 69.2% 1,109,239 73.1% 3,823,884 64.6%Hispanic or Latino 1,398 18.3% 2,832 15.7% 57,646 30.8% 408,607 26.9% 2,096,532 35.4%
2010 Hispanic or Latino bySingle Classification Race
1,398 2,832 57,646 408,607 2,096,532
White Alone 935 66.9% 2,011 71.0% 33,371 57.9% 244,757 59.9% 1,218,973 58.1%Black or African AmericanAlone
30 2.1% 56 2.0% 1,147 2.0% 6,994 1.7% 26,844 1.3%
American Indian and AlaskaNative Alone
6 0.5% 25 0.9% 584 1.0% 5,191 1.3% 24,248 1.2%
Asian Alone 3 0.2% 9 0.3% 202 0.4% 1,586 0.4% 4,408 0.2%Native Hawaiian and OtherPacific Islander Alone
1 0.1% 1 0.0% 24 0.0% 222 0.1% 944 0.1%

The Energy Corridor 2016 Inventory and Database
58
Pop Facts: ECDistrict
EC Study Area EC DemographicArea
EC CommutingRegion
Houston MSA
Census DemographicOverview (Part 1)
Some Other Race Alone 345 24.7% 579 20.4% 19,150 33.2% 127,268 31.2% 717,292 34.2%Two or More Races 77 5.5% 151 5.3% 3,167 5.5% 22,588 5.5% 103,823 5.0%
2010 Population by Sex 7,625 18,004 187,364 1,517,846 5,920,416Male 3,796 49.8% 8,937 49.6% 91,393 48.8% 746,511 49.2% 2,944,237 49.7%Female 3,829 50.2% 9,067 50.4% 95,972 51.2% 771,335 50.8% 2,976,179 50.3%Male/Female Ratio 0.99 0.99 0.95 0.97 0.99
2010 Population by Age 7,625 18,004 187,364 1,517,846 5,920,416Age 0 to 4 517 6.8% 1,159 6.4% 14,280 7.6% 114,484 7.5% 470,610 8.0%Age 5 to 9 350 4.6% 874 4.9% 13,857 7.4% 120,184 7.9% 462,866 7.8%Age 10 to 14 281 3.7% 801 4.5% 13,583 7.3% 121,238 8.0% 450,724 7.6%Age 15 to 17 173 2.3% 464 2.6% 8,369 4.5% 71,917 4.7% 271,764 4.6%Age 18 to 20 197 2.6% 429 2.4% 6,701 3.6% 54,375 3.6% 242,803 4.1%Age 21 to 24 616 8.1% 1,091 6.1% 10,003 5.3% 73,569 4.9% 323,809 5.5%Age 25 to 34 1,916 25.1% 3,740 20.8% 29,435 15.7% 221,995 14.6% 897,087 15.2%Age 35 to 44 1,157 15.2% 2,540 14.1% 27,832 14.9% 237,490 15.7% 857,547 14.5%Age 45 to 54 1,048 13.8% 2,676 14.9% 27,741 14.8% 227,934 15.0% 829,267 14.0%Age 55 to 64 762 10.0% 2,284 12.7% 20,288 10.8% 159,137 10.5% 606,951 10.3%Age 65 to 74 333 4.4% 1,138 6.3% 9,027 4.8% 69,980 4.6% 300,383 5.1%Age 75 to 84 198 2.6% 627 3.5% 4,664 2.5% 33,451 2.2% 152,522 2.6%Age 85 and over 76 1.0% 182 1.0% 1,585 0.9% 12,093 0.8% 54,083 0.9%
Age 16 and over 6,428 84.3% 15,036 83.5% 142,837 76.2% 1,137,982 75.0% 4,446,918 75.1%Age 18 and over 6,304 82.7% 14,706 81.7% 137,275 73.3% 1,090,024 71.8% 4,264,452 72.0%Age 21 and over 6,107 80.1% 14,277 79.3% 130,574 69.7% 1,035,649 68.2% 4,021,649 67.9%Age 65 and over 608 8.0% 1,946 10.8% 15,275 8.2% 115,524 7.6% 506,988 8.6%2010 Median Age 33.76 36.75 34.14 34.15 33.22
2010 Male Population byAge
3,796 8,937 91,393 746,511 2,944,237
Age 0 to 4 256 6.8% 591 6.6% 7,295 8.0% 58,586 7.9% 239,995 8.2%Age 5 to 9 176 4.6% 434 4.9% 7,010 7.7% 61,267 8.2% 236,413 8.0%Age 10 to 14 145 3.8% 398 4.5% 6,941 7.6% 62,129 8.3% 230,646 7.8%Age 15 to 17 95 2.5% 236 2.7% 4,314 4.7% 37,001 5.0% 139,574 4.7%Age 18 to 20 99 2.6% 229 2.6% 3,416 3.7% 28,501 3.8% 126,651 4.3%Age 21 to 24 273 7.2% 490 5.5% 4,903 5.4% 36,947 5.0% 165,300 5.6%Age 25 to 34 963 25.4% 1,877 21.0% 14,277 15.6% 108,070 14.5% 450,699 15.3%Age 35 to 44 617 16.3% 1,332 14.9% 13,485 14.8% 114,852 15.4% 426,543 14.5%Age 45 to 54 538 14.2% 1,313 14.7% 13,188 14.4% 110,590 14.8% 410,192 13.9%Age 55 to 64 373 9.8% 1,122 12.6% 9,774 10.7% 77,530 10.4% 296,649 10.1%Age 65 to 74 149 3.9% 548 6.1% 4,216 4.6% 33,089 4.4% 140,807 4.8%Age 75 to 84 82 2.2% 285 3.2% 1,966 2.2% 13,925 1.9% 63,192 2.2%Age 85 and over 31 0.8% 82 0.9% 607 0.7% 4,024 0.5% 17,576 0.6%2010 Median Age, Male 33.87 36.61 33.28 33.22 32.4
2010 Female Population byAge
3,829 9,067 95,972 771,335 2,976,179
Age 0 to 4 260 6.8% 568 6.3% 6,985 7.3% 55,898 7.3% 230,615 7.8%Age 5 to 9 174 4.5% 440 4.9% 6,847 7.1% 58,917 7.6% 226,453 7.6%Age 10 to 14 136 3.6% 404 4.5% 6,643 6.9% 59,110 7.7% 220,078 7.4%Age 15 to 17 78 2.0% 227 2.5% 4,054 4.2% 34,916 4.5% 132,190 4.4%
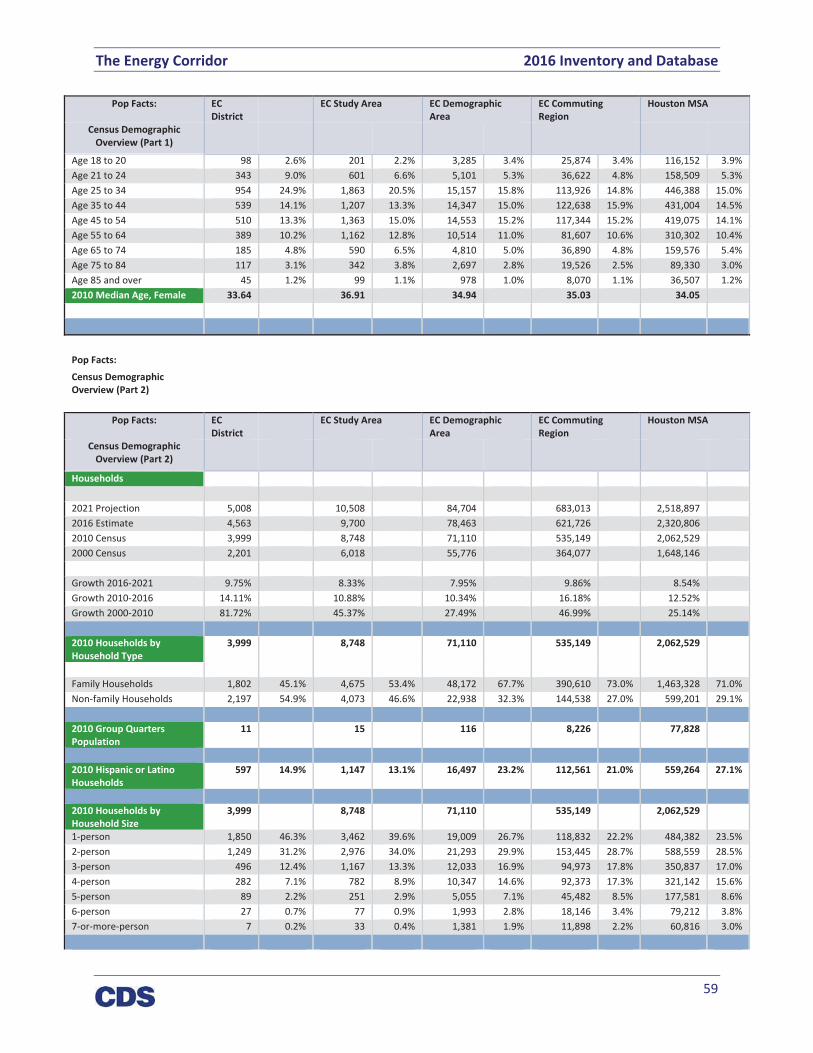
The Energy Corridor 2016 Inventory and Database
59
Pop Facts: ECDistrict
EC Study Area EC DemographicArea
EC CommutingRegion
Houston MSA
Census DemographicOverview (Part 1)
Age 18 to 20 98 2.6% 201 2.2% 3,285 3.4% 25,874 3.4% 116,152 3.9%Age 21 to 24 343 9.0% 601 6.6% 5,101 5.3% 36,622 4.8% 158,509 5.3%Age 25 to 34 954 24.9% 1,863 20.5% 15,157 15.8% 113,926 14.8% 446,388 15.0%Age 35 to 44 539 14.1% 1,207 13.3% 14,347 15.0% 122,638 15.9% 431,004 14.5%Age 45 to 54 510 13.3% 1,363 15.0% 14,553 15.2% 117,344 15.2% 419,075 14.1%Age 55 to 64 389 10.2% 1,162 12.8% 10,514 11.0% 81,607 10.6% 310,302 10.4%Age 65 to 74 185 4.8% 590 6.5% 4,810 5.0% 36,890 4.8% 159,576 5.4%Age 75 to 84 117 3.1% 342 3.8% 2,697 2.8% 19,526 2.5% 89,330 3.0%Age 85 and over 45 1.2% 99 1.1% 978 1.0% 8,070 1.1% 36,507 1.2%2010 Median Age, Female 33.64 36.91 34.94 35.03 34.05
Pop Facts: Census DemographicOverview (Part 2)
Pop Facts: ECDistrict
EC Study Area EC DemographicArea
EC CommutingRegion
Houston MSA
Census DemographicOverview (Part 2)
Households
2021 Projection 5,008 10,508 84,704 683,013 2,518,8972016 Estimate 4,563 9,700 78,463 621,726 2,320,8062010 Census 3,999 8,748 71,110 535,149 2,062,5292000 Census 2,201 6,018 55,776 364,077 1,648,146
Growth 2016 2021 9.75% 8.33% 7.95% 9.86% 8.54%Growth 2010 2016 14.11% 10.88% 10.34% 16.18% 12.52%Growth 2000 2010 81.72% 45.37% 27.49% 46.99% 25.14%
2010 Households byHousehold Type
3,999 8,748 71,110 535,149 2,062,529
Family Households 1,802 45.1% 4,675 53.4% 48,172 67.7% 390,610 73.0% 1,463,328 71.0%Non family Households 2,197 54.9% 4,073 46.6% 22,938 32.3% 144,538 27.0% 599,201 29.1%
2010 Group QuartersPopulation
11 15 116 8,226 77,828
2010 Hispanic or LatinoHouseholds
597 14.9% 1,147 13.1% 16,497 23.2% 112,561 21.0% 559,264 27.1%
2010 Households byHousehold Size
3,999 8,748 71,110 535,149 2,062,529
1 person 1,850 46.3% 3,462 39.6% 19,009 26.7% 118,832 22.2% 484,382 23.5%2 person 1,249 31.2% 2,976 34.0% 21,293 29.9% 153,445 28.7% 588,559 28.5%3 person 496 12.4% 1,167 13.3% 12,033 16.9% 94,973 17.8% 350,837 17.0%4 person 282 7.1% 782 8.9% 10,347 14.6% 92,373 17.3% 321,142 15.6%5 person 89 2.2% 251 2.9% 5,055 7.1% 45,482 8.5% 177,581 8.6%6 person 27 0.7% 77 0.9% 1,993 2.8% 18,146 3.4% 79,212 3.8%7 or more person 7 0.2% 33 0.4% 1,381 1.9% 11,898 2.2% 60,816 3.0%

The Energy Corridor 2016 Inventory and Database
60
Pop Facts: ECDistrict
EC Study Area EC DemographicArea
EC CommutingRegion
Houston MSA
Census DemographicOverview (Part 1)
2010 Households by Typeand Presence of Children
3,999 8,748 71,110 535,149 2,062,529
Married Couple Family, ownchildren
518 13.0% 1,396 16.0% 17,693 24.9% 159,410 29.8% 526,018 25.5%
Male Householder, ownchildren
64 1.6% 114 1.3% 1,688 2.4% 11,949 2.2% 54,623 2.7%
Female Householder, ownchildren
227 5.7% 430 4.9% 5,636 7.9% 38,330 7.2% 168,058 8.2%
Married Couple Family, noown children
771 19.3% 2,269 25.9% 17,948 25.2% 143,071 26.7% 525,213 25.5%
Male Householder, no ownchildren
70 1.8% 146 1.7% 1,693 2.4% 12,509 2.3% 62,013 3.0%
Female Householder, noown children
152 3.8% 319 3.7% 3,514 4.9% 25,341 4.7% 127,403 6.2%
Non family Households 2,197 54.9% 4,073 46.6% 22,938 32.3% 144,538 27.0% 599,201 29.1%
2010 Households byPresence of People UnderAge 18
3,999 8,748 71,110 535,149 2,062,529
HH with 1 or More PeopleUnder Age 18:
857 21.4% 2,047 23.4% 27,047 38.0% 226,598 42.3% 842,760 40.9%
Households with No PeopleUnder Age 18:
3,142 78.6% 6,701 76.6% 44,064 62.0% 308,550 57.7% 1,219,769 59.1%
HH with 1 or More PeopleUnder Age 18:
857 2,047 27,047 226,598 842,760
Married Couple Family 529 61.8% 1,432 70.0% 18,481 68.3% 166,942 73.7% 566,572 67.2%Other Family, MaleHouseholder
69 8.1% 126 6.2% 1,976 7.3% 14,287 6.3% 67,389 8.0%
Other Family, FemaleHouseholder
249 29.1% 474 23.2% 6,406 23.7% 44,037 19.4% 202,766 24.1%
Nonfamily, MaleHouseholder
7 0.8% 11 0.5% 137 0.5% 984 0.4% 4,391 0.5%
Nonfamily, FemaleHouseholder
2 0.3% 4 0.2% 47 0.2% 348 0.2% 1,642 0.2%
Households with No PeopleUnder Age 18:
3,142 6,701 44,064 308,550 1,219,769
Married Couple Family 760 24.2% 2,234 33.3% 17,160 38.9% 135,538 43.9% 484,659 39.7%Other Family, MaleHouseholder
65 2.1% 133 2.0% 1,405 3.2% 10,171 3.3% 49,247 4.0%
Other Family, FemaleHouseholder
129 4.1% 275 4.1% 2,744 6.2% 19,634 6.4% 92,695 7.6%
Nonfamily, MaleHouseholder
1,192 38.0% 2,198 32.8% 11,136 25.3% 69,248 22.4% 299,580 24.6%
Nonfamily, FemaleHouseholder
995 31.7% 1,861 27.8% 11,619 26.4% 73,959 24.0% 293,588 24.1%
2010 Occupied HousingUnits by Tenure
3,999 8,748 71,110 535,149 2,062,529
Owner Occupied 799 20.0% 3,024 34.6% 40,584 57.1% 358,669 67.0% 1,286,423 62.4%Renter Occupied 3,200 80.0% 5,724 65.4% 30,526 42.9% 176,479 33.0% 776,106 37.6%
The Energy Corridor 2016 Inventory and Database
61
1001 South Dairy Ashford Street, Suite 450Houston, TX 77077
281 582 0855www.cdsmr.com