ENERGY CONSERVATION STUDY at - TN
22
ENERGY CONSERVATION STUDY at Big Creek Utility District Coalmont, TN The University of Memphis Civil Engineering Department by Larry W. Moore, Ph.D., P.E. August, 2010
Transcript of ENERGY CONSERVATION STUDY at - TN

ENERGY CONSERVATION STUDY
at
Big Creek Utility District Coalmont, TN
The University of Memphis Civil Engineering Department
by
Larry W. Moore, Ph.D., P.E.
August, 2010

IMPORTANT NOTICE
The contents of this report are for general guidance only and are not intended to be a
standard of the State of Tennessee. No reference in this report to any specific method,
product, process, or service constitutes or implies an endorsement or warranty by the
University of Memphis, the University of Tennessee Center for Industrial Services
(UTCIS), or the State of Tennessee. This report reflects the best judgment of the author,
but the University of Memphis, UTCIS, and the State of Tennessee assume no liability
for implementation of the information contained herein. Anyone using this information
assumes all liability arising from such use, including but not limited to infringement of
any patent or patents.
I. INTRODUCTION
The Big Creek Utility District operates one water treatment plant (conventional
plant) at one location in near Coalmont, Tennessee. The water source for this facility is
Big Creek Lake, located adjacent to the water treatment plant. Water is withdrawn from
the lake and pumped about 600 feet to the water treatment plant. The original water
treatment plant began operations in 1962. The treatment plant can produce up to 1.5 mgd.
Finished water produced by the water treatment process is pumped into the
Coalmont elevated storage tank, supplying approximately 8,650 people in Marion
County, Sequachee County, Van Buren County, Warren County, and Grundy County in
Tennessee. On an average day, this water treatment plant produces 0.90 million gallons
per day (mgd) of drinking water. The peak day production of 1.08 mgd occurred in
January, 2010. The Big Creek Utility District (BCUD) water distribution system consists
of about 450 miles of distribution lines. There is only one booster pump station in the
distribution system, the Altamont pump station.
The purpose of this study is to develop an energy audit for the Big Creek Utility
District water treatment plant (WTP). Dr. Moore conducted an energy audit during his
visit to the WTP on May 26, 2010. Using the energy audit, Dr. Moore, in conjunction
with water treatment plant personnel, developed process energy conservation measure
(ECM) ideas. These ideas were then evaluated with respect to technical feasibility and
cost-effectiveness. Based on this detailed evaluation, specific ECMs were recommended
for the BCUD.
2
II. DESCRIPTION OF WATER TREATMENT PROCESS
The conventional surface water treatment process consists of rapid mixing,
flocculation, sedimentation, filtration, and disinfection. There is one flash mix basin.
There are two flocculation basins, each with one flocculator unit. There are four
sedimentation basins; each basin is rectangular and none has sludge collection and
automatic sludge withdrawal capability. There are 4 filters, each with 108 square feet of
surface area. The filters are dual media filters, with media consisting of graded sand
overlain by anthracite coal. The filters usually are backwashed every 96 hours; on a
typical day one filter will be backwashed, using about 0.02 mgd of finished water for
backwashing. Backwash rate is about 15 gpm/ft2 for 10 to 12 minutes. Hydraulic scour is
used to provide turbulence during backwashing to ensure that the media are effectively
cleaned. All backwash water is supplied by a backwash pump.
Chemicals are added to coagulate the water. Coagulation is the process of
neutralizing the electrical charge on the colloidal and suspended particles so that a floc
forms. After coagulation, water enters the flocculation basins where the water is gently
mixed to allow the particles in the water to collide and grow larger. Water then passes to
the sedimentation basins where the floc particles settle. The relatively clear water is then
filtered to remove nearly all of the remaining particulate matter, disinfected, and pumped
into the Coalmont elevated tank.
Two raw water pumps transport water from the lake to the head of the
conventional treatment process. Sodium permanganate at a dosage of 0.3 mg/L is used to

3
chemically oxidize manganese in the lake water. The primary coagulant used at the plant
is polyaluminum chloride, and the flocculent used is Polymer 309 (a cationic polymer).
In the summer, typical dosages of polyaluminum chloride are 5 to 10 mg/L. Alum is used
as the primary coagulant in the winter (December through March); typical dosages of
alum are 5 to 10 mg/L. Powdered activated carbon (PAC) is used year-round to prevent
problems with trihalomethanes (THMs) and haloacetic acids (HAAs) in the finished
water. PAC dosages are in the range of 5 to 20 mg/L. Caustic (25%) is used to raise the
pH of the water from 6.3 to 7.1; caustic may be added to the raw water to improve
coagulation and/or to raise the pH of the finished water to about 7.1. Chlorine is added to
the raw water and to the finished water to provide disinfection; typical chlorine dosages
are 3 to 6 mg/L (pre-chlorination plus post-chlorination). Orthophosphate is added at
about 0.3 mg/L to help minimize corrosion and scale formation in the distribution system.
III. PLANT OPERATIONAL DATA FOR 2006 - 2010
A. Water Production Rates
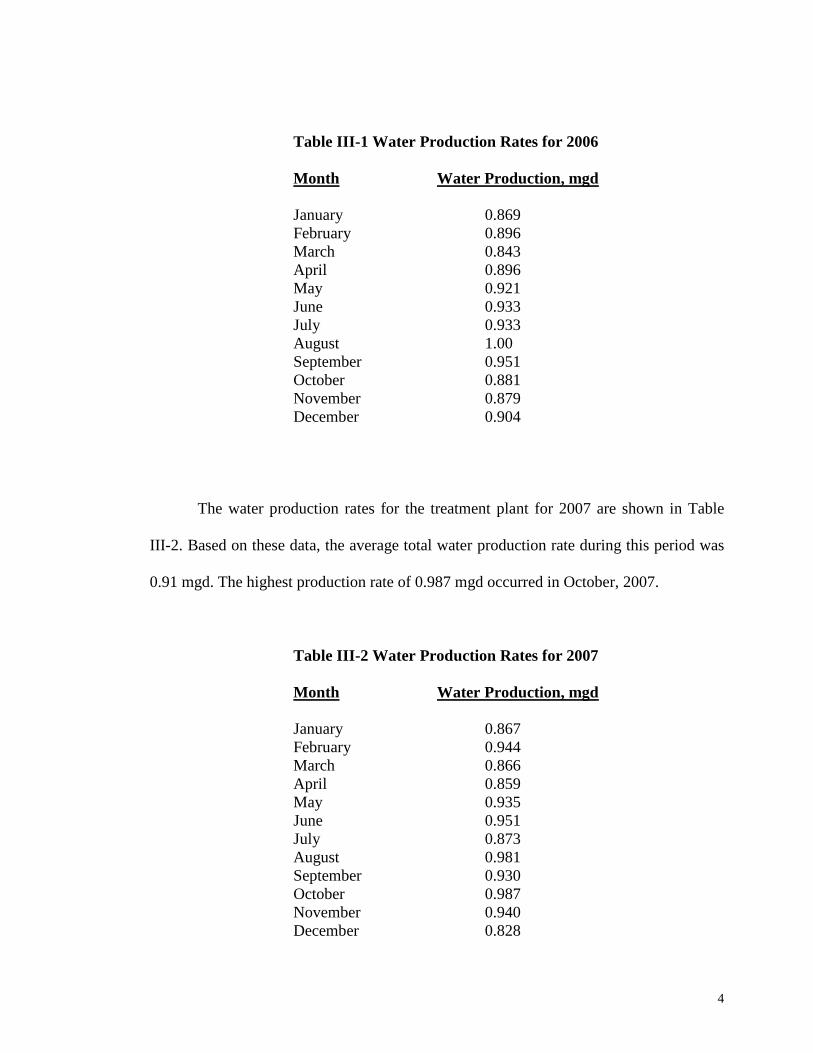
The water production rates for the treatment plant for 2006 are shown in Table
III-1. Based on these data, the average total water production rate during this period was
0.91 mgd with a peak day of 1.08 mgd.
4
Table III-1 Water Production Rates for 2006
Month Water Production, mgd
January 0.869 February 0.896 March 0.843 April 0.896 May 0.921 June 0.933 July 0.933 August 1.00 September 0.951 October 0.881 November 0.879 December 0.904
The water production rates for the treatment plant for 2007 are shown in Table
III-2. Based on these data, the average total water production rate during this period was
0.91 mgd. The highest production rate of 0.987 mgd occurred in October, 2007.
Table III-2 Water Production Rates for 2007
Month Water Production, mgd
January 0.867 February 0.944 March 0.866 April 0.859 May 0.935 June 0.951 July 0.873 August 0.981 September 0.930 October 0.987 November 0.940 December 0.828

5
The water production rates for the treatment plant for 2008 are shown in Table
III-3. Based on these data, the average total water production rate during this period was
0.86 mgd. The highest production rate of 0.937 mgd occurred in June, 2008.
The water production rates for the treatment plant for 2009 are shown in Table
III-4. Based on these data, the average total water production rate during this period was
0.88 mgd. The highest production rate of 0.962 mgd occurred in June, 2009.
The water production rates for the treatment plant for 2010 are shown in Table
III-5. Based on these data, the average total water production rate during this period was
0.99 mgd. The highest production rate of 1.08 mgd occurred in January, 2010.
Table III-3 Water Production Rates for 2008
Month Water Production, mgd
January 0.867 February 0.944 March 0.866 April 0.859 May 0.935 June 0.951 July 0.873 August 0.981 September 0.930 October 0.987 November 0.940 December 0.828

6
Table III-4 Water Production Rates for 2009
Month Water Production, mgd
January 0.867 February 0.944 March 0.866 April 0.859 May 0.935 June 0.951 July 0.873 August 0.981 September 0.930 October 0.987 November 0.940 December 0.828
Table III-5 Water Production Rates for 2010
Month Water Production, mgd
January 1.078 February 0.982 March 0.915 April 0.808 May 0.837 June 0.860 July 0.951
B. Water Quality
The raw water taken from the lake has relatively good quality. Temperatures vary
from 5̊ C to 10˚C in January to 25˚C to 30˚C in August. The pH of the raw water is
usually from 6.0 to 6.5. Turbidity of the lake water is usually in the range of 3 to 10 ntu.
The alkalinity of the raw water is normally 20 mg/L to 30 mg/L. Hardness typically
varies from 50 to 60 mg/L, with 45% of the hardness being carbonate hardness
(associated with alkalinity species); approximately 55% of the hardness is non-carbonate
7
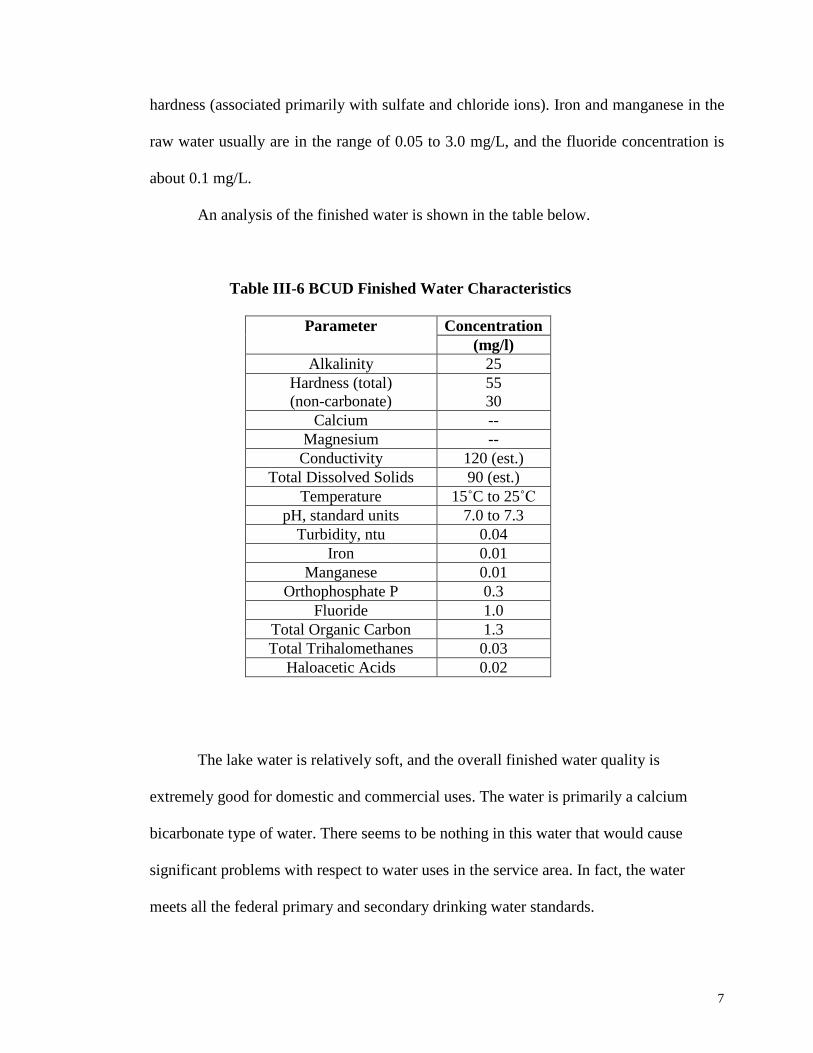
hardness (associated primarily with sulfate and chloride ions). Iron and manganese in the
raw water usually are in the range of 0.05 to 3.0 mg/L, and the fluoride concentration is
about 0.1 mg/L.
An analysis of the finished water is shown in the table below.
Table III-6 BCUD Finished Water Characteristics
Parameter Concentration (mg/l)
Alkalinity 25 Hardness (total) (non-carbonate)
55 30
Calcium -- Magnesium -- Conductivity 120 (est.)
Total Dissolved Solids 90 (est.) Temperature 15˚C to 25˚C
pH, standard units 7.0 to 7.3 Turbidity, ntu 0.04
Iron 0.01 Manganese 0.01
Orthophosphate P 0.3 Fluoride 1.0
Total Organic Carbon 1.3 Total Trihalomethanes 0.03
Haloacetic Acids 0.02
The lake water is relatively soft, and the overall finished water quality is
extremely good for domestic and commercial uses. The water is primarily a calcium
bicarbonate type of water. There seems to be nothing in this water that would cause
significant problems with respect to water uses in the service area. In fact, the water
meets all the federal primary and secondary drinking water standards.

8
IV. EQUIPMENT INVENTORY AND ENERGY DEMAND
A. Raw Water and High Service Pumping
The raw water pumping facility actually consists of two pumps located in a small
building adjacent to Ranger Lake, approximately 600 feet from the water treatment plant.
Each of the two raw water pumps is 25 hp and pumps against a total dynamic head
(TDH) of 84 feet (according to the pump curve). The TDH of 84 feet approximately
consists of 55 feet of static head and 29 feet of friction head. These pumps are vertical
turbine pumps, and each has a soft starter. According to the pump curve for each of these
25-hp pumps, they were designed to pump 850 gpm with an efficiency of about 81
percent. Based on information provided by BCUD staff, both pumps run simultaneously
from 7:00 a.m. to 11:00 p.m. A butterfly valve is used to throttle the two pumps so that
they each pump about 500 gpm. Consequently, these pumps are only operating at about
65% efficiency. The raw water pump station uses about 18,000 kWh/month of electricity
at a cost of about $1500/month.
The high service pumping facility actually consists of two pumps located at the
water treatment plant. Each of the two high service pumps is 100 hp and pumps against a
total dynamic head (TDH) of 315 feet (according to the pump curve). The TDH of 315
feet approximately consists of 276 feet of static head and 39 feet of friction head. These
pumps are vertical turbine pumps; one has a soft starter and one does not. According to
the pump curve for each of these 100-hp pumps, they were designed to pump 850 gpm
with an efficiency of about 83 percent. Based on information provided by BCUD staff,
one high service pump runs continuously from 7:00 a.m. to 11:00 p.m. The high service
pumps use about 36,000 kWh/month of electricity at a cost of about $3000/month.

9
The raw water pumps and the two high service pumps are on one electric meter,
with electrical service provided by Sequachee Valley Electric Service. Over the last 3
years, the monthly electric bill for the raw water pumps and high service pumps has
averaged about $4500 or about 74% of the total electrical costs of the BCUD water
treatment plant and distribution system. In 2007, the raw water and high service pumping
facilities used an average of 54,300 kWh/month of electricity (kWh is kilowatt hours). In
2008, the raw water and high service pumping facilities used an average of 54,500
kWh/month of electricity. In 2009, the raw water and high service pumping facilities
used an average of 55,200 kWh/month of electricity; this is about 77% of the energy use.
Thus, on average the raw water and high service pumping facilities use about 54,700
kWh/month of electricity. Of the monthly electric bill of $4500 for raw water and high
service pumping, approximately 22% is the demand charge or about $1000/month.
B. Conventional Filter Plant
The conventional filter plant receives electricity supplied by Sequachee Valley
Electric Service. The following equipment is part of the filter plant meter:
Rapid mixers
Flocculators
Sedimentation basins
Coagulant feed pumps
Polymer feed pumps
Carbon feed pumps

10
Caustic feed pumps
Filters
Backwash pump
Chlorine feed system
Lab, administration, and maintenance building
Over the last 3 years, the monthly electric bill for the filter plant has averaged about $754
or about 13% of the total electrical costs of the BCUD water treatment plant and
distribution system. In 2007, the filter plant used an average of 7600 kWh/month of
electricity. In 2008, the filter plant used an average of 7800 kWh/month of electricity. In
2009, the filter plant used an average of 6900 kWh/month of electricity. Including the
electricity use for the partial year of 2010, on average the filter plant uses about 8000
kWh/month of electricity. Of the monthly electric bill of $754, the demand charge is zero
dollars each month. The breakdown of these electrical costs for the water treatment plant
only is estimated below:
Table IV-1 Filter Plant Energy Costs (Excluding High Service and Raw Pumps)
Component % of Total Energy Use Monthly Elec. Costs, $
Coagulant Feed 0.1 6 Polymer Feed 0.3 17 Rapid Mix 4.1 239 Flocculation 1.2 70 Sedimentation 0.2 12 Gravity Filtration 2.5 145 Hydraulic Surface Wash 0.3 17 Backwash Pump 0.4 23 In-Plant Pumping 1.8 104 Chlorine Feed 0.3 17 Admin, Lab & Maintenance 1.8 104 Subtotal 13 $754

11
C. Distribution System and Office
There are three main energy users in the distribution system: the Altamont pump
station, the distribution shop, and the Barkers Cove tank. The Altamont pump station uses
about 1500 kWh of electricity per month on average at a monthly cost of about $175. The
distribution shop uses about 2400 kWh of electricity per month on average at a monthly
cost of about $250. The Barkers Cove tank uses about 400 kWh of electricity per month
on average at a monthly cost of about $50. The office uses about 2400 kWh of electricity
per month on average at a monthly cost of about $400. Cumulatively, the distribution
system and office use a total of about 6700 kWh/month at a monthly cost of $875; this
accounts for approximately 10% of the total energy use and about 14% of the energy cost
of the BCUD water treatment plant and distribution system.
D. Total Energy Demand and Cost Breakdown
The total energy use (on average) for the entire BCUD water treatment plant and
distribution system is approximately 69,000 kWh/month. The average monthly electric
costs for the BCUD water treatment plant and distribution system is about $6100. Thus,
the average energy cost is about $0.089 per kWh. The detailed breakdown of these
energy costs (including distribution system pumping) is provided below:

12
Table IV-2 Energy Costs for Water Treatment Plant and Distribution System
% of Energy Use
Mo. Electric Cost, $
Raw Water Pumping
25.1
1500 Coagulant Feed
0.1
6
Polymer Feed
0.3
17 Rapid Mix
4.1
239
Flocculation
1.2
70 Sedimentation
0.2
12
Gravity Filtration
2.5
145 Hyd Surface Wash
0.3
17
Backwash Pump
0.4
23 In-Plant Pumping
1.8
104
Chlorine Feed
0.3
17 Office
3.5
400
High Serv. Pumps
52.2
3000 Distribution System
6.2
475
Admin, Lab & Maintenance
1.8
104
TOTAL 100
6,129
If you combine raw water pumping, in-plant pumping, backwash pumping, high
service pumping, and distribution system pumping, pumping energy costs account for
about 81% of the total energy costs of the BCUD water treatment plant and distribution
system. If you exclude distribution system energy costs, the actual breakdown of energy
costs at the water treatment plant (WTP) is as follows:

13
Table IV-3 Energy Costs for Water Treatment Plant (Excluding Distribution)
Component % of WTP Energy Use Mo. Elect Cost, $
Raw Water Pumping 26.7 1500 Coagulant Feed 0.1 6 Polymer Feed 0.3 17 Rapid Mix 4.4 239 Flocculation 1.3 70 Sedimentation 0.2 12 Gravity Filtration 2.7 145 Hyd Surface Wash 0.3 17 Backwash Pumps 0.4 23 In-Plant Pumping 1.9 104 Chlorine Feed 0.3 17 Office 3.7 400 High Service Pumps 55.8 3000 Admin, Lab & Maintenance 1.9 104 Total 100 $5,654
Therefore, pumping is about 85% of the total energy use at the water treatment plant.
The energy consumed per unit volume of water produced is a metric that can be
used to compare this water district to other water treatment plants. For water treatment
plants (WTPs) with 75 psi high service pumps, the typical energy use is about 1250
kWh/mil gal. For water treatment plants (WTPs) with 100 psi high service pumps, the
typical energy use is about 1450 kWh/mil gal. For water treatment plants (WTPs) with
125 psi high service pumps, the typical energy use is about 1700 kWh/mil gal. Based on
the trends of energy use for WTPs as high service pump pressure increases, a WTP with
136 psi high service pumps might be expected to have a typical energy use of 1850
kWh/mil gal.
The BCUD water treatment plant (WTP) has about 136 psi high service pumps if
one considers that the high service pumps are pumping against 315 feet of TDH. If the
energy use of the distribution system is excluded, the energy use of the BCUD WTP is

14
about 2300 kWh/mil gal. Thus, the energy use at the BCUD WTP is about 24% more
than the typical WTP with 136 psi high service pumps. Therefore, it appears that the
BCUD water treatment plant has some room for improvement as far as energy
conservation is concerned, when compared to comparable WTPs.
V. DEVELOPMENT OF ENERGY CONSERVATION MEASURES
A. Raw Water Pumping
According to the pump curve for the two raw water pumps, the best efficiency
point (BEP) is at a total dynamic head (TDH) of 84 feet and a pumping rate of 850 gpm.
At this operating point, each pump should have an efficiency of 81%. However, a valve is
used to throttle the flow rate of each pump at 500 gpm. This is done to produce a total
flow rate of 1000 gpm with both pumps running at the same time. Thus, the actual
operating point is well to the left of the BEP, yielding a pump efficiency of only 65%.
One alternative is to run only one of these 25-hp pumps at a time and allow them to
run 24 hours per day without being throttled. Operating at or near the BEP, one pump
can supply 1.2 mgd of raw water to the head of the water treatment plant (WTP). If this
was done, the energy use of the raw water pump station would be 450 kWh/day. The
energy cost savings can be calculated as follows:
150 kWh/day x $0.057/kWh x 30 days/mo = $256/month
Demand savings = 21 kW x $11/kW = $231/month
Total monthly energy savings = $487

15
Annual energy savings = $5844
Another option is to purchase new pumps and use the same motors to provide
greater energy efficiency. New pumps can be installed that can pump 1250 gpm (each) at
a TDH of 84 feet using the existing 25-hp motors. Each of the current pumps discharge
through separate 8-inch lines, which combine into a single 8-inch pipe just prior to
separating into two 8-inch lines entering the flash mix basin. This piping arrangement is
less than optimal. Another approach is to have each pump discharge into a 12-inch line,
which separates into the two 8-inch lines entering the flash mix basin. The larger pipe
coupled with the new pumps will allow one pump to run at a time and deliver the desired
water flow rate into the WTP. With this approach, one pump would run about 13.3
hours/day to deliver 1.0 mgd to the WTP. The energy cost savings are calculated below:
350 kWh/day x $0.057/kWh x 30 days/mo = $597/month
Demand savings = 21 kW x $11/kW = $231/month
Total monthly energy savings = $828
Annual energy savings = $9936 (55% energy savings for raw water pumping)
The total cost of installing the two new raw water pumps and installing the new 12-inch
line is about $40,000. Thus, the payback period for this approach is 4.0 years. This
represents about 15% energy savings at the water treatment plant.

16
B. High Service Pumping
According to the pump curve for the two high service pumps, the design operating
point of the pumps is at a total dynamic head (TDH) of 315 feet and a pumping rate of
850 gpm. At this operating point, each pump should have an efficiency of 83%.
Currently, each high service pump is pumping about 1050 gpm at a TDH of about 290
feet, which is actually closer to the best efficiency point (BEP) for these pumps; at the
BEP, the pump efficiency is 86%. One alternative is to install two new 60-hp pumps
that each can pump 700 gpm at a TDH of 290 feet. Operating continuously, one pump
could supply 1.01 mgd of raw water to the elevated tank in Coalmont. If this was done,
the energy use of the high service pump station would be 1075 kWh/day. The energy cost
savings can be calculated as follows:
125 kWh/day x $0.057/kWh x 30 days/mo = $214/month
Demand savings = 30 kW x $11/kW = $330/month
Total monthly energy savings = $544
Annual energy savings = $6528
The total cost of installing the two new high service pumps is $150,000. The payback
period is about 23 years.
Another option for the high service pumps is to install variable frequency drives
on the two pumps. For a pumping application where friction head dominates the total
dynamic head (TDH) against which the pump is pumping, use of a variable frequency
drive is typically beneficial. Reducing the pump speed in a friction loss system allows the

17
pump to continue to operate near its best efficiency point; thus the pump continues to
operate efficiently while using less power as flow and head are reduced.
For a pumping application where static head dominates the TDH against which
the pumps are pumping, using a variable frequency drive is typically not beneficial. In
this application, the reduction in flow is no longer proportional to speed. A small turn
down in speed could give a large reduction in flow rate and pump efficiency. In turn, this
means that the pump efficiency changes when the speed of the pump changes. This is
significantly different to a pump system without static head. In this application, the
operating point on the reduced speed curves also moves relatively higher on the pump
curve as the speed is reduced. There are problems connected with this situation. A
relatively minor decrease in speed can move the pump operating point into an area where
the pump should not be operated continuously. Operating the pump close to shut-off head
for extended periods could severely damage the pump – even though the pump runs at a
reduced speed.
For the high service pumps, the estimated static head is about 280 feet; the total
dynamic head (from the actual pump curve) is 315 feet. Thus, the static head comprises
about 89% of the TDH. Therefore, the potential problems discussed above for a static-
head dominated system are of great concern. In light of this, installation of variable
frequency drives on the two high service pumps is not recommended.

18
VI. EVALUATION OF ENERGY CONSERVATION MEASURES
Purchasing new pumps and using the same motors at the raw water pumping
station will provide greater energy efficiency. The estimated annual energy savings is
approximately $10,000. The cost of installing the two new raw water pumps and
installing the new 12-inch line is about $40,000. Therefore, the payback period for this
option is 4.0 years. This option is recommended and will save the BCUD about 15% in
energy costs at the water treatment plant.
The option of running only one raw water pump at a time and not using the
throttling valve will substantially improve the efficiency of these pumps. However, they
would need to run about 24 hours per day to supply 1.2 mgd of raw water to the treatment
plant. This would possibly require someone to be available on the third shift in case of
pump failure. Consequently, the BGUD is not in favor of this approach.
Installing two new pumps in the high service pump station is not attractive
economically because the payback period is about 23 years. The option of installing
variable frequency drives on the two high service pumps is not attractive because this
pump application is dominated by static head rather than by friction head. Operating the
pumps at reduced speed significantly reduces their efficiency and could severely damage
the pumps.

19
VII. CONCLUSIONS AND RECOMMENDATIONS
In the raw water pump station, installing new pumps that can pump 1250 gpm
(each) at a TDH of 84 feet using the existing 25-hp motors is an excellent way to
conserve energy and improve the operating efficiency of the pumps. In conjunction with
the new pumps, a new 12-inch line downstream of the raw water pumps should be
constructed to reduce the head loss in the pipes to the water treatment plant. The 12-inch
line will separate into two 8-inch lines just prior to entering the flash mix basin. The
annual energy savings will be about $10,000, and the payback periods will be 4 years.
This represents about 15% savings at the water treatment plant.
Replacing the high service pumps with two new 60-hp pumps that can pump 700
gpm at a TDH of 290 feet is not cost-effective. While annual energy savings will be
about $6500, the payback period will be about 23 years, which is much too long.
Installing variable frequency drives on the two high service pumps also is not a good
approach because the pumps will operate much less efficiently and may suffer severe
damage.

20