Energy conservation indicators in Southern Mediterranean...
27
Energy conservation indicators in Southern Mediterranean countries Country report for Tunisia Rafik Missaoui and Hassen Ben Hassine (Alcor) in cooperation with Leila Bejaoui (ANME) Plan Bleu UNEP/MAP Regional Activity Center Sophia Antipolis June 2012
Transcript of Energy conservation indicators in Southern Mediterranean...

Energy conservation indicators in Southern Mediterranean countries
Country report for Tunisia Rafik Missaoui and Hassen Ben Hassine (Alcor) in cooperation with Leila Bejaoui (ANME)
Plan Bleu
UNEPMAP Regional Activity Center Sophia Antipolis June 2012
3
Content Preface 5
List of abbreviations 6
I Country General background 7
II Strategies and objectives for renewable energies and energy efficiency 8
III Data collection process 10 1 Data sources 10 2 Data availability 11 3 Major difficulties met during the data collection 11
IV Indicatorrsquos calculation 12 1 Macro level indicators 12 2 Energy transformation sector indicators 14 3 Industry sector indicators 17 4 tertiary sector indicators 19 5 Residential sector indicators 20 6 Transport sector indicators 23 7 Agriculture and fishing sector indicator 24
V Conclusion 26
VI References and relevant websites 27
5
Preface The design the implementation and the monitoring of national energy policies require relevant indicators reflecting the energy use performances at macro and sector level Moreover for developing countries the implementation of information systems on energy and greenhouse gas emissions indicators will be a key condition for the development of new mitigation financing mechanisms (NAMAs sectoral mechanism etc) currently under negotiations for the new international climate governance regime In fact these mechanisms will need Measures Reporting and Verification systems (MRV) to prove the integrity of these actions Also for the Arab League States Energy Efficiency Directive such indicators are crucial for the monitoring and the assessment of the National Energy Efficiency Action Plans (NEEAPs)
For these reasons and based on European experiences ( ODYSSEE) PLAN BLUE in cooperation with RCREEE and with the support of MED-ENEC has launched the current Energy Efficiency Indicators Project in ten MENA countries namely Morocco Algeria Egypt Lebanon Syria Jordan Libya Palestine Tunisia and Yemen as a tenth member state of RCREEE This project is aiming at i) strengthening the capacities of these countries in monitoring their energy policies by using the energy efficiency indicators approach ii) building and interpreting a range of basic common indicators for the region
The project was carried out according to a two years process based on specific methodology including bull A Participative approach associating national public and private experts
minus 4 workshops and working sessions held in Tunisia Egypt France and Morocco minus Selection by the participants of the common indicators to be developed in the project based on the data availability and the relevancy for the country minus Technical assistance throughout the project provided by the regional coordination
bull Capacity building through ldquo learning by doingrdquo and experience exchanges minus Data collection by the national experts with the support of RCREEE focal points strengthening the cooperation between public and private experts minus Common development of a simplified calculation tool for data collection and indicatorsrsquo calculation used by the experts minus Development of capacity for analysis and interpretation of energy indicators by national experts minus Country reports developed by the national teams
bull Dissemination of the results and the learned lessons minus Organization of final seminar for the decision-makers in June 2012 minus Publication and wide dissemination of the results recorded in flyers national and regional reports
The project was coordinated by minus Plan Bleu Ferdinand Costes El Habib El Andaloussi minus RCREEE Amel Bida minus MED-ENEC Florentine Visser minus ALCOR Rafik Missaoui Hassen Ben Hassine Adel Mourtada
The report authors would like to express their gratitude to Plan Blue and RCREEE for supporting this important work which is long overdue and will serve as a first step toward having reliable and comprehensive EE indicators for the region We also would like to thank the ANME for providing technical support and allowing dada access particularly Mr Nejib OSMAN Head of Studies and planning Department and his collaborator Ms Leila BEJAOUI for their valuable cooperation
6
List of abbreviations Units of measurement GWh Gigawatt hour
MW Megawatt
Kg kilogram
Km kilometer
pkm passenger-kilometer
tkm ton-kilometre
t ton
toe ton of oil equivalent
Kgoe kilogram of oil equivalent
TCO2e Ton of CO2 equivalent
Currency and related symbols TND Tunisian Dinar
US$ US Dollar
TND 1990- TD base year 1990
LC Local currency
Other abbreviations GDP Gross Domestic Product
STEG Tunisian electricity and Gas Company
ETAP Tunisian Petroleum Activities Company
ANME National Agency for Energy Conservation
7
I Country General background Tunisia occupies the eastern portion of the great bulge of North Africa It is bounded on the west by Algeria on the north and east by the Mediterranean Sea and on the southeast by Libya Tunisia is at the crossroads of Europe the Middle East and Africa
Covering a surface of 162155 Kmsup2 Tunisia has an impressing coastline of 1300 km open on the Mediterranean The country offers various landscapes which considerably differ ranging from mountainous regions in the North and West steppes in the Centre wide plains in the North East (Sahel) to a desert zone in the South The climate is Mediterranean in the North and on the East coast semiarid in the inland and Saharan in the South Average temperatures vary between 114degC (December) and 293degC (July) Rainfalls are irregular and concentrated during the cold season (34 of the total yearly rainfall) North 800 mm South 50 to 150 mm
Tunisia is inhabited by almost 105 million inhabitants of whom 80 is living in the coastal regions where most of economic activities are concentrated This population which increases at a well-controlled rate (137year) is more and more urbanized (with a current percentage of more than 658)
With a GDP reaching about 396 billion US$ and 3792 current US$ per capita Tunisia is considered among the intermediate income countries
Tunisia has a diverse economy including agricultural mining tourism and manufacturing sectors However the Tunisian economy is more and more based on services which represents around 54 in 2011 as shown by the chart
Real growth which averaged almost 5 over the past decade declined to 46 in 2008 and to 3-4 in 2009-10 because of economic contraction and slowing of import demand in Europe - Tunisias largest export market
On 14th January 2011 the popular revolution (called Jasmine Revolution) allowed to change the dictatorial regime of Ben Ali toward a democratic political system A transitional government should govern the country until 23th October 2011 when election for a new government will take place However during this transition phase the Tunisian economy declined because of the socio-political events In 2011 this decline was around -2
8
II Strategies and objectives for renewable energies and energy efficiency
Since the early 2000s Tunisia has entered fully into the category of net importer of energy under the double effect of the depletion of oil reserves and the rapid growth of domestic demand This has made it increasingly vulnerable to fluctuations in international oil prices Indeed Tunisia has experienced the full price increases experienced by the international market for energy in 2005 and continued until today
The energy bill of Tunisia now exceeds 13 of its GDP Moreover given the disconnection of domestic prices from international prices the Tunisian government has paid very large amounts of subsidies to energy prices estimated at nearly 5 of current GDP in 2011
The effect of the international situation has been relatively mitigated by the long-term energy efficiency and renewable energy policy adopted in Tunisia since the 80s This policy is based mainly on three types of instruments
bull The institutional instrument consists essentially in the National Agency for Energy Management created in the early 80s to promote energy efficiency and renewable energy and implement the state policy in this field
bull The regulatory tool essentially governed by the laws 2004-72 and 2009-7 and the implementing regulations attached to them They define the obligations of Energy Consumers (obligation of energy audit etc) as well as the benefits granted to the energy efficiency and RE measures
bull The incentive tools consisting of a part in the National Fund for energy conservation that provides partial subsidies for EE and RE projects and other fiscal benefits on efficient devices
9
As result of this policy coupled with economic choice moving towards the service sector and the development of industries with high value added primary energy intensity has declined steadily since the 90s with more than 25 year In particular large public efforts have been made since the mid-2000s with the sudden increase in international energy prices The ex-post assessment of the three-year plan 2005-2007 and the four-years plan 2008-2011 for energy conservation has shown that the cumulative energy savings over the period 2005-2010 was estimated to around 2700 ktoe mainly in industry sector
For the future Tunisia has decided to strengthen its policy of energy conservation by setting more ambitious targets for energy efficiency and renewable energy under the Tunisian Solar Plan This plan projects a primary energy savings of about 24 in 2016 and 40 in 2030
10
III Data collection process
1 Data sources Data are collected from several sources mainly
bull National Energy Observatory (Ministry of Industry and Technology) Energy balance including energy supply transformation and final consumption by sector One has to underline that energy balance in Tunisia is available since 1980
bull National Agency for Energy Conservation (ANME) The ANME created early 80rsquos has a large set of updated information since it is managing an information system (SIM2E) which includes the main socio-economic energy en GHG emission data Particularly energy consumption data by branch by use and by type of energy are available in ANME thank to surveys and studies it carries out on regular base
bull Tunisian Company of Electricity and Gas (STEG) STEG publishes on early base all data concerning insulated capacity power generation primary energy consumption for electricity generation electricity consumption by voltage and tariff level etc Furthermore since 1989 STEG carry out each 5 years a large survey on energy consumption of its household customers This survey is very helpful for the analysis of energy consumption in residential sector
bull National Statistics Institute (INS) It is the main source for socio-economic (GDP Private Consumption etc) and demographic data
bull Other sources it is like Ministry of Environment Ministry of Agriculture Ministry of transportation Specific large industries that has provided specific sector data
The main sources of data collection are presented in the following table
Institution name Address Tel and fax Email and Website
National Agency for Energy Conservation 3 Rue Chott Meriem - Montplaisir - 1002 Tunis Tel (216) 71 906 900 Fax (216) 71 904 624
e-mail bocanmenattn Websitewwwanmenattn
Tunisian Ministry for Industry and Technology Immeuble Beya 40 Rue 8011 Montplaisir 1002 Tunis Tel 216 71 905 132 Fax 216 71 902 742
Website wwwindustriegovtn e-mail contactmitgovtn
Tunisian electricity and gas company 38 rue Kamel Attaturk 1080 Tunis Tel +216 71 341311 Fax +216 71 341311
wwwstegcomtn e-mail dpscstegcomtn
National Institute of Statistics 70 Rue Ech-cham BP 265 CEDEX Tel (216) 71 891 002 Fax (216) 71 792 559 Insmdcigovtn _ Insnattn
Tunisian national office of tourism 1 Av Mohamed V - 1001 Tunis Teacutel (+216) 71341077 Fax (+216) 71350997
Email onttontttourismtn WebSite wwwtunisietourismecomtn
Tunisian central bank 25 rue Heacutedi Nouira-BP 777-1080 Tunis-cedex-Tunisie Teacutel (216) - 71 254 000 Fax (216) - 71 354 214
Email onttbctgovtn WebSitewwwbctgovtn
Ministry of finance Government square la Kasbah 1006 Tunis Tel +216 71 565 400 Fax + 216 71 341 077
Emailpcontenufinancesgovtn wwwportailfinancesgovtn
11
2 Data availability The following table presents the data required by the indicator model and the rate of data availability through this work
Sector
Energy data Socio-economic data Environmental data
Total number of data Available data
Total number of data Available data
Total number of data Available data
Number Number Number
Macro 80 80 100 60 60 100 10 10 100 Transformation sector 140 140 100 0 0 0 0 Transport sector 70 70 100 150 130 87 30 30 100 Tertiary sector 30 30 100 60 40 67 10 10 100 Residential sector 20 20 100 80 70 87 10 10 100 Industry sector 80 80 100 130 100 77 10 10 100 Agriculture amp fishing 20 20 100 80 80 100 0 0 0 Total 440 440 100 560 480 86 70 70 100
Total number of data expected by the sheet ldquoEnergy amp socioeconomic datardquo Total number of data (collected or estimated) filled in the sheet ldquoEnergy amp socioeconomic datardquo One value for one year is considered as a data
Data for different sectors are generally available and particularly data on energy and environment In Tunisia data collection is often regularly collected by national or local monitoring networks surveys and universities and research institutes Socio-economic data are less available this is mainly due to the variety and complexity of covered sub-sectors Around 990 items out of a total of 1070 were collected within this project giving and overall data availability of more than then 90
3 Major difficulties met during the data collection For the case of Tunisia the data collection was largely facilitated because of the availability of the Information System SIM2E of the ANME which includes the main energy socio-economic and GHG emission data
However some difficulties were encountered particularly for the collection of specific data concerning transport sector and more precisely road transport This sector is suffering from an important lack of data availability that should be addressed in priority
12
IV Indicatorrsquos calculation
1 Macro level indicators The following table presents all the indicators calculated at the macro level
Abbreviation Indicators Unit 2000 2001 2002 2003 2004 2005 2006 2007 2008 2009EDR Energy dependence Ratio 17 23 21 26 26 23 31 19 25 22IPE Intensity of Primary Energy toe1000 TD2000 039 039 038 036 036 033 034 034 032 031IFE Intensity of Final Energy toe1000 TD2000 030 029 029 028 028 026 025 025 024 023RFEPE Ratio of final energy consumption to primary energy 76 74 75 77 77 81 75 73 73 74REB Ratio of National Energy Bill to GDP 8 7 7 6 7 9 12 11 13 9RPSE Ratio of public subsidies for energy to GDP 078 044 000 000 062 214 333 259 401 010AEF Average emission factor teCO2toe 276 274 277 272 271 273 270 272 268 268ICO2 Intensity of CO2 teCO2 1000 TD 1076 1080 1056 0982 0975 0889 0912 0912 0872 0835AECH Average Primary Energy Consumption per habitant ktoe1000 hab 0701 0736 0718 0712 0743 0695 0750 0787 0789 0770AELCH Average Electricity Consumption per habitant MWhhab 0855 0907 0932 1058 1092 1127 1158 1183 1227 1248
The indicator of energy dependency has progress with around 29 between 2000 and 2009 As mentioned before Tunisia is more and more dependent for its energy supply from import under the double effect of the internal energy demand increase and the exhaustion of its oil fields
The figures show also a slight improvement of both the primary and the final energy Intensities with an average rate of respectively 24 and 27 per year between 2000 and 2009 The final energy improvement is essentially due to the effort made by the Tunisian Government in term of energy efficiency program particularly since 2005 after the international energy price increase In fact the National Agency of Energy Conservation estimates by using the bottom up approach that the final energy saving made the EE programs between 2005 and 2011 is around 3550 ktoe1 Of course such energy saving imply the reduction of the final energy intensity
1 Maicirctrise en lrsquoeacutenergie en Tunisie Chiffres cleacutes (Energy efficiency in Tunisia Main statistics) ANME 2012
13
The reduction of the primary energy intensity can be explain in one hand by the improvement of the efficiency of the energy consumption at end use level and the progress of the transformation sector efficiency in another hand The energy intensity of the transformation sector has been improved of an average of 17 per year between 2000 (009 toe1000 TND) and 2009 (008 toe1000 TND) The ANME estimates that the primary energy saved between 2005 and 2011 is around 5825 ktoe2
The primary energy consumption per capita has increased by around 1 per year from 2000 to 2009 against 43 for the electricity consumption The electricity consumption is increasing mainly because of the level standard rinsing of the households implying more and mode appliances owning This increase could be greater if there were public effort for energy efficiency promotion in all sectors
Finally the energy bill of the country is calculated in a theoretical way as the aggregation of the primary energy consumption of each product multiplied by its international price In the same approach the total public subsidies to energy are calculated as the energy bill of the country minus the local revenue of the energy sector (sales in the country) The subsidies are coming from the fact that internal energy prices are disconnected from the international prices and the Government has to pay the gap
The following chart shows the evolution of the ratios of energy bill and energy subsidies to GDP (current prices) within the period 2000-2009 The ratio of energy bill has reach its maximum in 2008 (13 of the GDP) when the crude oil has reach a pick of 140 $barrel In the same year the subsidy ratio has
2 Maicirctrise en lrsquoeacutenergie en Tunisie Chiffres cleacutes (Energy efficency in Tunisia Main statistics) ANME 2012
14
reach around 4 In 2009 the ratio of the subsidy has decreased under the double effect of international energy prices decrease and the significant increase of internal prices
The high ratio of energy bill can show the socio-economic vulnerability of the country to international energy prices (economic competiveness social pressures etc) The high ratio of energy subsidy can translate the pressure on the energy system on the public finance
2 Energy transformation sector indicators Tunisiarsquos oil and gas sector is supported by the efforts of a number of small companies The Tunisian Government created the State-owned oil company Entreprise Tunisienne drsquoActivites Petrolieacuteres (ETAP) in 1972 ETAPrsquos mission is to manage oil and natural gas exploration and production activities and it has been active in attracting foreign firms to fund oil exploration
Tunisia has to import more than half of its requirements of petroleum products The country has one refinery with a capacity of 35000 bd and this sector has not seen changes for decades But now there is a firm plan for a 120000 bd grassroots refinery to be built on BOOT basis at Skhira oil terminal center
15
The natural gas represents currently around 50 of the primary energy consumption of the country and come mainly from 3 sources
bull The national production essentially from the fields of Miskar (British Gas) and Ghergui in the south of the country bull The royalties on the Algerian pipeline to Italy bull A long term supply contract from Algeria
The electricity sector in Tunisia is operated by a public monopole utility (STEG) The large majority of power generation comes from thermal sources essentially from natural gas In fact more than 97 of electricity is generated from natural gas power plants leaving less than 3 of power being generated from hydroelectric and wind plants in 2009 In 2011 Tunisia has launched a study with the support of the German Cooperation in order to define the energy mix strategy for electricity generation aiming at reducing the dependency to natural gas by diversifying the mix This study proposes a share of 30 of renewable electricity by 2030
The following table presents the main indicators calculated with in the current project for transformation sector
The table leads to the following comments
Abbreviation Indicators Unit 2000 2001 2002 2003 2004 2005 2006 2007 2008 2009SREC Share of installed RE electricity capacity 0 0 0 1 1 1 1 1 1 2
URICUsage rate of the installed power generation capacity 45 40 41 42 43 42 45 45 47 46
AETSApparent Efficiency of Energy Transformation Sector 67 64 65 65 64 65 64 61 62 62
PGEFF Power generation efficiency of thermal plants 38 37 39 39 40 40 40 39 39 39SCFFP Specific Consumption of thermal power plants toeGWh 22789 23366 22214 22050 21488 21443 21493 21776 21843 21853PGF Power generation efficiency 38 37 39 39 40 40 40 40 39 40SCPG Specific Consumption of Power Generation toeGWh 22573 23183 22205 21926 21356 21357 21270 21623 21883 21756
TDEETransmission and Distribution Electricity system Efficiency 088 087 088 087 087 086 086 086 086 086
PGEF Power Generation Emission Factor teCO2GWh 54521 55770 53601 54220 53035 51847 52240 53594 54580 53885ESEF Electricity Sector Emission Factor teCO2GWh 61666 63451 60989 61116 60199 59534 60332 62131 62669 62312
16
bull A minor improvement of the renewable energy electricity penetration in term of installed capacity mainly due to the installation of new wind farms (extension of Sidi Daoud site from 10 MW to 54 MW)
bull A decrease of apparent efficiency of energy transformation sector with 6 of efficiency loss This can be explained by the oldness of the Tunisian refinery but also the losses in electricity transmission and distribution system
bull A rather stagnation of the power generation efficiency and the specific consumption of the thermal power generation (39 and 219 toGWh) bull A slight improvement of overall power generation efficiency from 38 in 2000 to around 40 in 2009 due to the introduction of the wind energy farm
od Sidi Daoud bull A small increase of the losses of distribution and transmission network for which the efficiency has moved from 88 in 2000 to 86 in 2009 bull Finally the emission factor power generation has registered and slight improvement due to naturel gas use and the introduction of renewable energy
(Wind)
17
3 Industry sector indicators Manufacturing industries producing largely for export are a major source of foreign currency revenue In 2009 industrial sector contributes to about 31 to the total GDP
The industry sector exclusive of the energy industries (production of hydrocarbons refining and power plants) appears as the top consuming sector with 22 million of toe in 2009 that is about 36 of the total final commercial energy consumption of Tunisia and offers the largest energy saving potential
The structure of energy consumption in the industrial sector remains dominated by oil products which account for about 42 of consumption However this share has declined sharply over the past 20 years due to the natural gas penetration whose share has almost doubled since 1990 (34 in 2009) This trend is the result of a proactive public policy of energy diversification based on the substitution of petroleum products by natural gas in the industrial sector
Within the sector the distribution of consumption is by far dominated by the branch of construction material which alone accounts for about 60 of the consumption sector followed by chemical products (12)
Among the 6000 industry unit in Tunisia about 320 companies (with energy consumption greater than 800 toe per year) represent about 75 of total consumption in the sector Finally 55 companies whose consumption is greater than 5000 toe per year (say energy-intensive industries) represent alone over 40 of the sector consumption These companies are targeted in a special way by the energy efficiency policy in Tunisia
The following table presents the main indicators calculated with in the current project for industry sector
18
Abbreviation Indicators Unit 2000 2001 2002 2003 2004 2005 2006 2007 2008 2009Specific energy consumption for the Cement 0084 0086 0081 0085 0091 0086 0087 0089 0085 0087Specific energy consumption for the Phosphate 0007 0007 0008 0007 0006 0006 0006 0007 0007 0006Specific energy consumption for the Phosphoric acid 0027 0020 0020 0025 0022 0024 0026 0027 0031 0029Specific energy consumption for the T Super Phosphate 0078 0083 0082 0074 0075 0075 0069 0071 0065 0073Specific energy consumption for the Steel 0565 0538 0555 0556 0335 0327 0367 0318 0235 0239
Specific energy consumption for the Paper 1130 1040 1087 1144 1224 1234 1160 1238 1253 1398Specific energy consumption for the Sugar 0167 0165 0174 0169 0155 0138 0133 0142 0130 0141
FEIIS Final Energy Intensity of Industry Sector toe1000 TD 0564 0559 0544 0543 0547 0513 0529 0510 0494 0536IEBR Ratio of Industry sector Energy Bill to Added Value 12 9 9 9 11 14 17 17 22 14IESR Ratio of public subsidies to added value 0 0 0 0 0 2 3 2 5 0IESRGB Ratio of public subsidies for energy to Government Budget 0 0 0 0 0 1 1 1 3 0IELSR Ratio of public subsidies for electricity to added value 1 0 0 0 1 1 1 2 4 1IICO2 Intensity of CO2 teCO2 1000 TD 2031 2049 1967 1993 1979 1898 1943 1888 1854 2003IAEF Average emission factor of industry sector teCO2toe 3602 3669 3612 3672 3617 3700 3672 3704 3753 3738
toet BSEC
The final energy intensity for industry sector has been significantly improved from 0564 toe1000 TND1990 in 2000 to around 0494 in 2008 than 0536 in 20093 The increase of the energy intensity in 2009 can be explained by the massive introduction in 2009 of the use of petroleum coke in many cement factories with lower efficiency However in general the industry sector is coming more and more efficient translating the results of the energy efficiency public programs in this sector
At branch level a significant decrease of the specific consumption is observed for the steel industry because of changing of process for the sole manufactory in the sector (in Menzel Bourguiba) For the other the specific consumption is remaining unchanged or slightly improved
Finally we can notice a slight improvement in environmental indicators with 13 for intensity of CO2 and 13 for average emission factor due to among others the massive introduction of natural gas
Energy indicators (specific energy consumption and intensity) improvement can be explained largely by the key role played by energy efficiency policy in the country particularly with the mandatory energy audits and incentive measures for industry sector since the industrial activity structure has not changed
3 Including mines and non
19
a lot within the next 10 years According to ANME assessment the cumulated primary energy saving in the industry sector between 2005 and 2011 is estimated to around 1200 ktoe
4 tertiary sector indicators Services sector output is central for the Tunisian economy with an average annual growth of 59 contributing to around 60 of Tunisian GDP Moreover this sector (hotels restaurants transport communication finances) absorbs around 40 of total employment in the country
From energy point of view the tertiary sector is a heterogeneous and complex branch and very often the energy consumption is integrated with residential sector under the term ldquobuilding sectorrdquo In Tunisia the tertiary sector energy consumption is figured out alone and is estimated to about 9 of the total final energy consumption of the country
The following table presents the main indicators calculated with in the current project for the tertiary sector
Abbreviation Indicators Unit 2000 2001 2002 2003 2004 2005 2006 2007 2008 2009FEITS Final Energy Intensity of Tertiary Sector toe1000 LC 0062 0060 0059 0060 0060 0056 0051 0050 0048 0047
TDRSHRDiffusion Rate of Solar Water Heaters in tertiary sector msup21000 hab 0558 0749 1066 1209 1198 1186 1182 1187 1277 1579
TEBRRatio of energy bill to added value in tertiary sector 149 111 101 109 140 174 183 189 243 150
TELSRRatio of public subsidies for energy to added value 002 000 000 000 000 021 018 014 056 000
TESRGBRatio of public subsidies for energy to Government Budget 002 000 000 000 000 031 029 022 090 000
HECNG Energy Consumption per night guest kgoeNigh Guest 4806 4946 6106 6552 3882 3596 3601 3754 3733 4154 TICO2 Intensity of CO2 teCO2 1000 LC 0263 0261 0250 0261 0259 0241 0227 0224 0218 0210 TAEF Average emission factor teCO2toe 4213 4335 4261 4363 4276 4308 4412 4433 4510 4519
The table shows
bull A significant improvement of the final energy intensity with an average of 32 per year ie 25 of the whole variation between 2000 and 2009 This trend confirms a key role played by energy efficiency policy including mandatory and incentive measures
bull A Significant improvement in environmental indicators with 32 for intensity of CO2 and 9 for average emission factor because of the important introduction of the use of the natural gas in the sector
20
bull An overall decreasing trend for energy consumption by night guest in tourism sector since 2003 bull A strong increase in diffusion rate of solar water heaters by an average of 12 per year ie 180 on the whole period of 2000-2009
5 Residential sector indicators The housing stock in Tunisia has shown strong growth over the past three decades resulting from the deliberate policy of Tunisia in access to housing If one is based on the extrapolation of the trends observed during the period 1994-2004 the housing stock would be in 2009 around 2886 million dwelling with more than 65 in urban area and 35 in rural side
The stock of dwelling is mainly constituted by individual buildings and the collective flats represent less than 8 of the dwellings
With 17 of total final energy consumption the residential sector is in the 3rd place after industry and transport sectors However with an average increase of about 3 per year during the last 10 years this sector could be one the most important consumer within the next years
Aware about this issue the Tunisian government has set up many programs and measures aiming at improving energy efficiency in this sector
bull Labeling and minimum standards of the appliances mainly refrigerators and air conditioning bull Efficient lighting promotion and interdiction of sailing of incandescent bulbs with more than 100 W bull Thermal building code with minimum technical requirements of specific consumption bull Financial incentive for solar water heaters within the Prosol Program since 2005
The following table presents the main indicators calculated with in the current project for the households sector
21
Abbreviation Indicators Unit 2000 2001 2002 2003 2004 2005 2006 2007 2008 2009UCED Unit Consumption of Energy per Dwelling kgoeDw 34370 34893 35158 36086 37505 37454 35149 34155 33872 34006
SCEMsup2 Specific Consumption of Energy per area unit kgoemsup2 3 3 4 4 4 4 4 3 3 3
UEICD Unit Consumption of Electricity per Dwelling kWhDw 91555 95290 96826 107762 109724 111138 111946 112192 114254 114104SCElMsup2 Specific Consumption of Electricity per msup2 kWhmsup2 9156 9529 9683 10776 10972 11114 11195 11219 11425 11410RIPE Intensity of Residential Sector toe 1000 TD 0074 0073 0072 0072 0073 0072 0066 0063 0061 0060
RELSRRatio of public subsidies for energy to private consumption 0 0 0 0 0 0 0 0 1 0
RESRGBRatio of public subsidies for energy to Government Budget 0 0 0 0 0 0 1 0 1 0
RAEF Average emission factor teCO2toe 3808 3877 3821 3900 3846 3840 3929 4024 4061 4029RICO2 Intensity of CO2 teCO21000TD 0282 0283 0276 0282 0282 0276 0260 0253 0248 0242
RDRSHRDiffusion Rate of Solar Water Heaters in Residential sector m21000 hab 69 86 100 107 114 136 169 228 303 379
ERACREquipment Rate of Air conditioning in Residential sector UnitDw 33 42 52 65 81 92 104 118 134 151
ERFREquipment Rate of refrigerator in Residential sector UnitDw 717 735 754 773 793 798 803 808 814 819
SEPCShare of energy expenses in household private consumption 26 26 26 27 27 27 27 27 27 27
Thanks to the effort on energy efficiency the final energy intensity has been improved significantly with the period with an average of 22 per year
22
The overall energy consumption per dwelling and the specific consumption per area unit remain almost stable with a very slight decrease tendency This is not the case for electricity consumption per dwelling which increase on average by 25 per year during the period
Concerning appliances diffusion rates one can notice the impressive increase of air condition rate with an average of 183 per year which is now causing a real problem of the increase of the electricity peak load during the summer For the refrigerators the increase rate is rather low (15 per year) because of the saturation of the stock
The penetration rate of the solar water heater in Tunisian is growing up very quickly due to the PROSOL program based on an innovative financial mechanism involving public subsidy of solar water heater prices and a loan system via the electricity company The following curve shows the solar water heater market evolution during the last 30 years in Tunisia and the impact of the PROSOL program which starts in 2005
Finally within the observation period there was a significant efficiency gain for environmental indicators with on average 16 per year for the average emission factor and 38 per year for the CO2 intensity This can be explained partly by the ambitious program of the Tunisian government in term of natural gas use penetration in the sector
23
6 Transport sector indicators The transport sector energy consumption accounts for 30 of the total final consumption and about 40 of petroleum products in the country Final energy consumption of transport sector has increased from 1620 ktoe in 2000 to around 1782 ktoe in 2009 which is in average 10 of increase on the whole period
Setting up an energy efficiency policy in the transport sector is rather difficult because of the complexity of this sector in term of institutional organizational and technical issues The Tunisian situation is in fact characterized by the high development of the private car stock and the lack of the collective transport supply in term of quantity and quantity which decrease the energy performance of the sector
Moreover because of its scattered nature and its institutional complexity there is a huge lack of data in this sector for both socio-economic and energy consumption aspects Availability of data requires to gather data from a large set of institutional stakeholders but also to carry out field surveys at large scale which is usually very expensive ANME has started to develop a national information system with the help of the UNDP in order to set up a common data platform for the transport stakeholders
Up to now the Tunisian energy efficiency has focused mainly on technical aspect and not on organizational and institutional ones The main measures are
bull Mandatory energy audits for transport companies consuming more than 500 toe per year bull 20 subsidy of the cost of any energy efficiency measures bull Mandatory engine diagnosis with the yearly technical control of vehicles
The ANME estimates the energy saving in the transport sector due to these measures to around 146 ktoe on the period 2005-2010
The following table presents the main indicators calculated with in the current project for the transport sector
Abbreviation Indicators Unit 2000 2001 2002 2003 2004 2005 2006 2007 2008 2009TrFEI Final Energy Intensity toe1000 TD 0094 0091 0089 0086 0083 0082 0077 0076 0073 0069STEHE Share of household expenditure for transport 5 6 7 7 8 9 9 10 11 12EUCC Average Energy Unit Consumption of Cars kgeocaryear 1664 1617 1564 1550 1483 1485 1415 1387 1319 1248EUCC G Average Energy Unit Consumption of gasoline Cars kgeocaryear 1085 1071 1037 975 917 878 814 819 782 759EUCC D Average Energy Unit Consumption of diesel Cars kgeocaryear 2249 2176 2112 2148 2080 2139 2075 2048 1963 1855AEFTS Average emission factor of transport sector teCO2toe 2934 2938 2936 2941 2939 2940 2941 2943 2946 2947MR Motorization rate persons Vehicle 1274 1208 1151 1119 1071 1039 1009 970 933 899ICO2 Intensity of CO2 teCO21000 TD 0277 0268 0261 0252 0244 0241 0227 0224 0214 0203SCRW Specific consumption for Rail ways kgoe pkm 0008 0008 0008 0009 0010 0010 0010 0010 0010 0010
24
This table shows
bull Significant improvement of the final energy intensity of the sector with an average 34 per year ie 27 of the whole period bull Strong increase of householdrsquos expenditures for transport The share of expenses for transport has more than doubled between 2000 and 2009 This
shows clearly the increasing pressure of transport on the householdrsquos budget bull Significant decrease of the average energy unit consumption of cars by 27 per year ie 15 of the whole variation between 2000 and 2009 bull Stagnation of the average emission factor of transport sector with 3 of the on the whole period bull Strong improvement of the intensity of CO2 of transport sector with 25 on the whole period
Finally one has to underline that the unavailability of data did not allow calculation of other important indicators required for the monitoring of energy efficiency policies in the transport sector such as the specific consumption of the private transport goods road transport shipping etc
Moreover the reliability of the data has to be improved For example the data on private car stock includes circulating cars and downgraded vehicles which make the data overestimated
7 Agriculture and fishing sector indicator Agricultural activity accounts for 9 to 11 of the GDP depending on the climate conditions The energy consumption of the sector has increased with an annual rate of around 77 during the 80rsquos due the intensification and modernization of the agriculture activity However this rate has fall to around 15 since the 90rsquos because of the modernization accomplishment and the limitation of the utile agriculture area in the country
25
Although it represents less than 9 of the final energy balance the energy consumption of this sector covers important socio-economic issues In fact energy expenses share in the crops and fish production costs is getting more and more high involving additional economic difficulties for the small farms and fishing units Energy efficiency policy in this sector should aim not only improving energy balance but also economic protecting of large layers of population
The flowing table presents the main indicators calculated for this sector
Abbreviation Indicators Unit 2000 2001 2002 2003 2004 2005 2006 2007 2008 2009
FEIAFinal Energy Intensity of agriculture toe1000LC 0164 0173 0177 0155 0147 0161 0151 0146 0147 0138
FEIF Final Energy Intensity of fishing toe1000LC 0647 0783 0760 0862 0759 0785 0730 0720 0565 0580
SCFSpecific consumption for fishing toe tone 0862 1020 1043 1133 0948 0971 0849 0862 0859 0845
SDCA Share of Dry cultivated area 96 96 96 96 96 96 96 96 96 96
SICAShare of Irrigated cultivated area 4 4 4 4 4 4 4 4 4 4
SEWMPShare of equipped wells with Moto pumps 36 32 29 25 22 20 18 17 15 14
SEWElPShare of equipped wells with electro pumps 64 68 71 75 78 80 82 83 85 86
The energy intensity of the agriculture sector is varying according to the years because highly depending on the climate conditions since the major part of the cultures are rainfall However there is a slight tendency to improvement since 2000 due to most probably to the effort done in water saving and pumping electrification since the 90rsquos
For the fishing sector the intensity has increased since the 90rsquos and reach its maximum in 2003 which can be partly explained by the depletion of the fish resources in the Mediterranean Sea Then since 2007 the sector has showed an improvement tendency of energy intensity due to most probably to the proliferation of the breeding fish units
As it is not an intensive energy sector the agricultural and fishing sector are usually poor in term of energy data availability However in Tunisia availability of detailed information on energy consumption has considerably increased thanks to the recent study curried out by the ANME in 2009 on the ldquostrategy of energy efficiency and renewable energy development in the agriculture and the fishing sectorrdquo This study has allowed providing energy consumption by use by form of energy by type of crops by region etc It gives also some relevant indicators such as energy intensity of branches and specific consumption of main products
26
V Conclusion Tunisia is rather advanced in term of energy and GHG emission indicators thank to the implementation of an information system initiated by the ANME in cooperation with ADEME since more than five years This cooperation program has allowed also enhancing the capacity of the ANME staff to improve the data collection and develop a set of indicators used by the decision makers
We should mention also the importance of the five years STEG survey on energy consumption and appliances in household sector It constitutes one of the major sources of data for this sector
However some sectors are still poor on reliable data mainly the transport and tertiary sectors For the present exercise the unavailability of data has constituted real barriers to develop particular indicators such as specific consumption per mode of transports
For that reason it is highly recommended to improve data collection system by strengthen coordination and information exchange between main stakeholders in the country This can lead also to the need to carry out specific surveys to gather some categories of information such as mobility data and energy consumption per mode for transport sector Finally some data have to be estimated it is than essential to harmonize the estimation methodologies in the country
27
VI References and relevant websites Energy balances ONE General Directory of Energy
SIM2E data base ANME
Householdsrsquo Energy consumption STEG survey report 1989 1994 1999 and 2004 STEG
Nationrsquos accounts Central Bank of Tunisia
Financial statistics bulletin Central Bank of Tunisia
Annual Report on Infrastructure Indicators National Institute of Statistics
Annual Report on Demographic Situation in Tunisia National Institute of Statistics
Population and Housing General Census National Institute of Statistics
Annual reports National company of electricity and gas
Ten year electricity statistic book 2000-2010 STEG
Eurostat website httpeuropaeuintcommeurostat
IEA mdash Statistics website httpwwwieaorgstatistindexhtm
World Bank website httpwwwworldbankorgdata
World Energy Council website httpwwwworldenergyorg
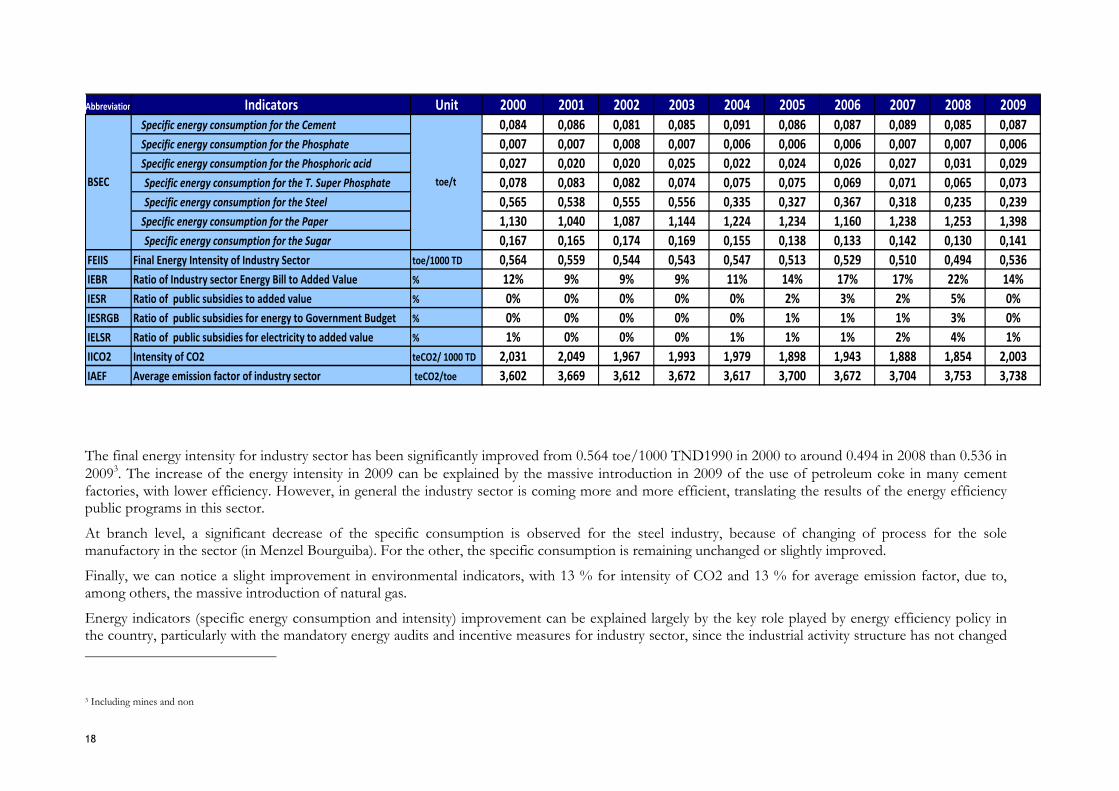
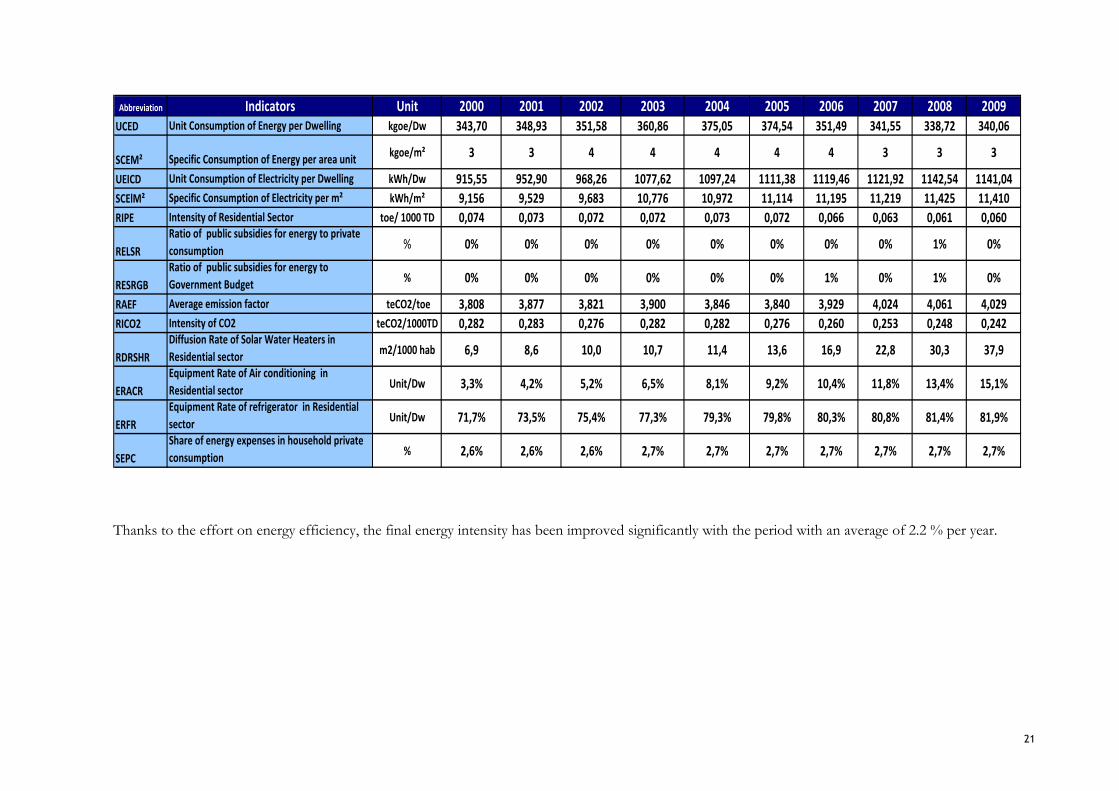